Profilaktyczny drenaż jamy brzusznej po operacji trzustki
Appendices
Appendix 1. Glossary of terms
Abscess: a collection of pus that has built up within the tissues of the body
Active drain: drains that suction under low or high pressure
Adverse events: untoward side effects
Anastomosis: connection between two organs (e.g. stomach and small intestine) created by surgery
Biliary: related to the bile duct
Chronic pancreatitis: long‐standing inflammation of the pancreas
Delayed gastric emptying: a medical condition consisting of paresis (partial paralysis) of the stomach, resulting in food remaining in the stomach for an abnormally long time
Duodenal: related to the first section of the small intestine
Drainage: the process or system by which water or waste liquid flows away
Incidence: the rate at which something happens
Morbidity: the proportion of people with any postoperative complications
Mortality: the proportion of deaths after surgery
Pancreas: the organ in the body that produces insulin and a liquid that helps your body to use the food that you eat
Pancreatic: relating to the pancreas
Pancreatic anastomoses: the surgical connection of the bile‐pancreatic duct and gut to form a continuous channel
Pancreatic fistula: a complication whereby the pancreas is disconnected from the nearby gut, and then reconnected to allow pancreatic juice containing digestive enzymes to enter the digestive system
Pancreaticoduodenectomy: a major surgical operation involving the pancreas, duodenum, and other organs
Passive drain: drains without suction
Postoperative: relating to the time after someone has had a medical operation
Prevalence: the total number of people with an illness at a designated time
Prophylactic: protective or preventive
Randomized controlled trials: an experiment in which participants are randomly allocated to two or more interventions, possibly including a control intervention or no intervention, and the results are compared
Subhepatic: under the liver.
Appendix 2. EBM Reviews Ovid ‐ Cochrane Central Register of Controlled Trials (CENTRAL; 2016 to 15 November 2017)
-
exp Pancreas/
-
common bile duct/ or "ampulla of vater"/ or "sphincter of oddi"/ or exp Duodenum/
-
pancrea*.ab,ti.
-
or/1‐3
-
carcinoma/ or adenocarcinoma/ or exp Neoplasms/
-
(carcino* or cancer$ or neoplasm* or tumour$ or tumor$ or cyst$ or growth$ or adenocarcinoma* or malign*).tw.
-
5 or 6
-
4 and 7
-
pancreatic neoplasms/ or exp carcinoma, islet cell/ or carcinoma, pancreatic ductal/ or Duodenal Neoplasms/ or Common Bile Duct Neoplasms/ or exp Pancreatitis/
-
8 or 9
-
General Surgery/
-
(surger* or operatio* or operative therap* or resection*).tw.
-
11 or 12
-
10 and 13
-
pancreatectomy/ or pancreaticoduodenectomy/ or pancreaticojejunostomy/
-
(pancreatectom* or pancreaticojejunostom* or pancreaticoduodenectom* or pancreaticogastrostom* or duodenopancreatectom*).ab,ti.
-
or/14‐16
-
drainage/ or negative‐pressure wound therapy/ or suction/
-
(drain* or suction*).ab,ti.
-
18 or 19
-
17 and 20
Appendix 3. MEDLINE Ovid search strategy (2016 to 2 November 2017)
-
randomized controlled trial.pt.
-
controlled clinical trial.pt.
-
randomized.ab.
-
placebo.ab.
-
drug therapy.fs.
-
randomly.ab.
-
trial.ab.
-
groups.ab.
-
or/1‐8
-
exp animals/ not humans.sh.
-
9 not 10
-
exp Pancreas/
-
common bile duct/ or "ampulla of vater"/ or "sphincter of oddi"/ or exp Duodenum/
-
pancrea*.ab,ti.
-
or/12‐14
-
carcinoma/ or adenocarcinoma/ or exp Neoplasms/
-
(carcino* or cancer$ or neoplasm* or tumour$ or tumor$ or cyst$ or growth$ or adenocarcinoma* or malign*).tw.
-
16 or 17
-
15 and 18
-
pancreatic neoplasms/ or exp carcinoma, islet cell/ or carcinoma, pancreatic ductal/ or Duodenal Neoplasms/ or Common Bile Duct Neoplasms/ or exp Pancreatitis/
-
19 or 20
-
General Surgery/
-
(surger* or operatio* or operative therap* or resection*).tw.
-
22 or 23
-
21 and 24
-
pancreatectomy/ or pancreaticoduodenectomy/ or pancreaticojejunostomy/
-
(pancreatectom* or pancreaticojejunostom* or pancreaticoduodenectom* or pancreaticogastrostom* or duodenopancreatectom*).ab,ti.
-
or/25‐27
-
drainage/ or negative‐pressure wound therapy/ or suction/
-
(drain* or suction*).ab,ti.
-
29 or 30
-
11 and 28 and 31
Appendix 4. Embase Ovid search strategy (2016 to 15 November 2017)
-
random:.tw. or placebo:.mp. or double‐blind:.tw.
-
pancreas/ or "islets of langerhans"/ or pancreas, exocrine/ or pancreatic ducts/
-
exp common bile duct/ or exp Vater papilla/ or exp duodenum/
-
pancrea*.ab,ti.
-
2 or 3 or 4
-
carcinoma/ or adenocarcinoma/ or exp neoplasm/
-
(carcino* or cancer$ or neoplasm* or tumour$ or tumor$ or cyst$ or growth$ or adenocarcinoma* or malign*).tw.
-
6 or 7
-
5 and 8
-
pancreas islet cell tumor/ or exp pancreas cancer/ or exp duodenum cancer/ or exp duodenum carcinoma/ or exp Vater papilla tumor/ or exp Vater papilla carcinoma/ or exp bile duct cancer/ or exp pancreatitis/
-
9 or 10
-
surgery/
-
(surger* or operatio* or operative therap* or resection*).tw.
-
12 or 13
-
11 and 14
-
exp pancreas resection/ or exp pancreaticojejunostomy/ or exp pancreaticoduodenectomy/
-
(pancreatectom* or pancreaticojejunostom* or pancreaticoduodenectom* or pancreaticogastrostom* or duodenopancreatectom*).ab,ti.
-
or/15‐17
-
exp drain/ or exp suction/ or exp abscess drainage/ or exp abdominal drainage/ or exp wound drainage/ or exp surgical drainage/ or exp vacuum assisted closure/ or exp negative pressure wound therapy/
-
(drain* or suction*).ab,ti.
-
19 or 20
-
1 and 18 and 21
Appendix 5. Science Citation Index Expanded search strategy (2016 to 15 November 2017)
-
Topic=(pancrea* or (common bile duct*) or (ampulla of vater) or (sphincter of oddi) or duodenum) AND Topic=(carcino* or cancer* or neoplasm* or tumour* or tumor* or cyst* or growth* or adenocarcinoma* or malign*)
-
Topic=((surger* or operatio* or operative therap* or resection*)) OR Topic=((pancreatectom* or pancreaticojejunostom* or pancreaticoduodenectom* or pancreaticogastrostom* or duodenopancreatectom*))
-
Topic=(drain* or suction*) OR Topic=(negative‐pressure wound therap*) OR Topic=(vacuum assisted closure*)
-
#3 AND #2 AND #1
-
Topic=(single blind* or double blind* or clinical trial* or placebo* or random* or controlled clinical trial* or research design or comparative stud* or controlled trial* or (follow up stud*) or prospective stud*)
-
#5 AND #4
Appendix 6. Chinese Biomedical Literature Database (CBM) search strategy (2016 to 15 November 2017)
-
主题词:随机对照试验/全部树/全部副主题词
-
主题词:临床对照试验/全部树/全部副主题词
-
主题词:临床试验/全部树/全部副主题词
-
主题词:病例对照研究/全部树/全部副主题词
-
主题词:随机分配/全部树/全部副主题词
-
主题词:对比研究/全部树/全部副主题词
-
主题词:前瞻性研究/全部树/全部副主题词
-
主题词:安慰剂/全部树/全部副主题词
-
全部字段:随机
-
全部字段:单盲
-
全部字段:双盲
-
全部字段:盲法
-
(#1 OR #2 OR #3 OR #4 OR #5 OR #6 OR #7 OR #8 OR #9 OR #10 OR #11 OR #12)
-
主题词:胰腺肿瘤/全部树/全部副主题词
-
主题词:胰腺疾病/全部树/全部副主题词
-
全部字段:胰腺占位
-
全部字段:胰腺癌
-
全部字段:胰头癌
-
主题词:胆总管肿瘤/全部树/全部副主题词
-
全部字段:胆总管下端占位
-
全部字段:胆总管下端肿瘤
-
全部字段:胆总管下端癌
-
主题词:肝胰管壶腹/全部树/全部副主题词
-
全部字段:壶腹部占位
-
全部字段:壶腹部肿瘤
-
全部字段:壶腹癌
-
全部字段:vater壶腹癌
-
主题词:十二指肠肿瘤/全部树/全部副主题词
-
主题词:十二指肠疾病/全部树/全部副主题词
-
全部字段:十二指肠占位
-
全部字段:十二指肠乳头腺癌
-
主题词:胰腺炎/全部树/全部副主题词
-
主题词:胰腺炎,慢性/全部树/全部副主题词
-
(#14 OR #15 OR #16 OR #17 OR #18 OR #19 OR #20 OR #21 OR #22 #23 OR #24 OR #25 OR #26 OR #27 OR #28 OR #29 OR #30 OR #31 OR #32 OR #33)
-
主题词:外科手术/全部树/全部副主题词
-
主题词:吻合术, 外科/全部树/全部副主题词
-
全部字段:手术治疗
-
全部字段:手术
-
全部字段:切除术
-
(#35 OR #36 OR #37 OR #38 OR #39)
-
(#34 AND #40)
-
主题词:胰腺/全部树/SU
-
主题词:胰腺切除术/全部树/全部副主题词
-
主题词:胰十二指肠切除术/全部树/全部副主题词
-
全部字段:胰体尾切除术
-
全部字段:胰腺部分切除
-
全部字段:胰十二指肠吻合术
-
全部字段:胰头十二指肠吻合术
-
全部字段:Whipple术式
-
全部字段:Child术式
-
(#41 OR #42 OR #43 OR #44 OR #45 OR #46 OR#47 OR #48 OR #49 OR #50)
-
主题词:引流/全部树/全部副主题词
-
主题词:抽吸/全部树/全部副主题词
-
主题词:负压伤口治疗/全部树/全部副主题词
-
全部字段:腹腔引流
-
全部字段:引流管
-
全部字段:手术引流
-
全部字段:伤口引流
-
全部字段:负压引流
-
(#52 OR #53 OR #54 OR #55 OR #56 OR #57 OR# 58 OR #59)
-
(#13 AND #51 AND #60)
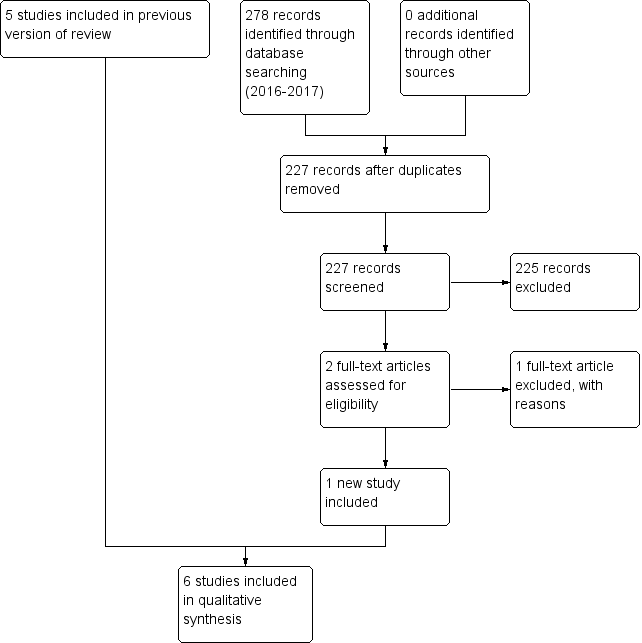
Study flow diagram: 2018 review update

Risk of bias graph: review authors' judgements about each risk of bias item presented as percentages across all included studies

Risk of bias summary: review authors' judgements about each risk of bias item for each included study

Comparison 1 Drain use versus no drain use, Outcome 1 Mortality (30 days).

Comparison 1 Drain use versus no drain use, Outcome 2 Mortality (90 days).
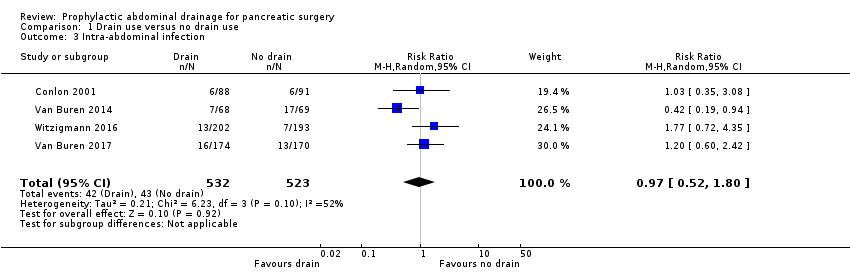
Comparison 1 Drain use versus no drain use, Outcome 3 Intra‐abdominal infection.
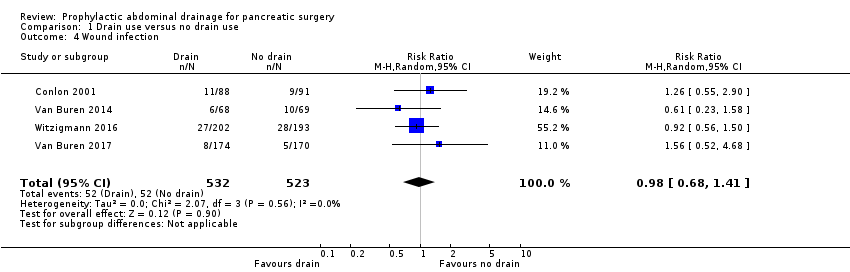
Comparison 1 Drain use versus no drain use, Outcome 4 Wound infection.
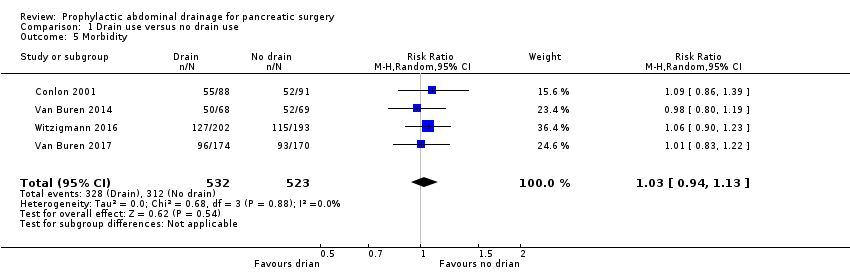
Comparison 1 Drain use versus no drain use, Outcome 5 Morbidity.

Comparison 1 Drain use versus no drain use, Outcome 6 Length of hospital stay (days).
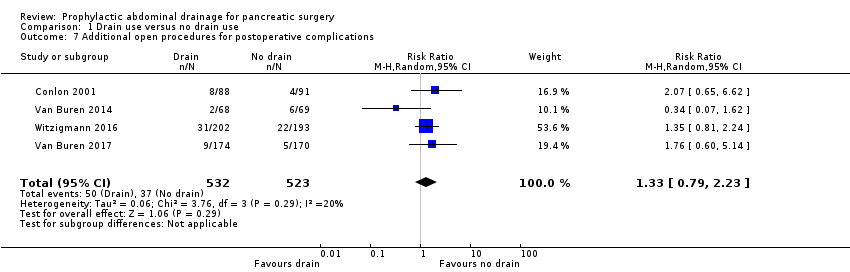
Comparison 1 Drain use versus no drain use, Outcome 7 Additional open procedures for postoperative complications.

Comparison 1 Drain use versus no drain use, Outcome 8 Additional radiological interventions for postoperative complications.
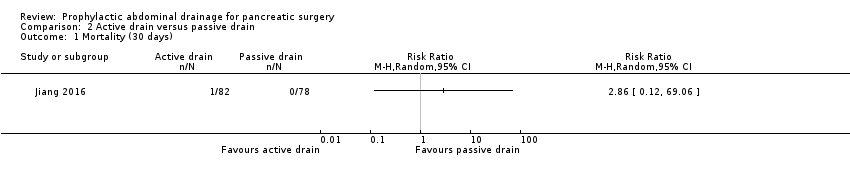
Comparison 2 Active drain versus passive drain, Outcome 1 Mortality (30 days).
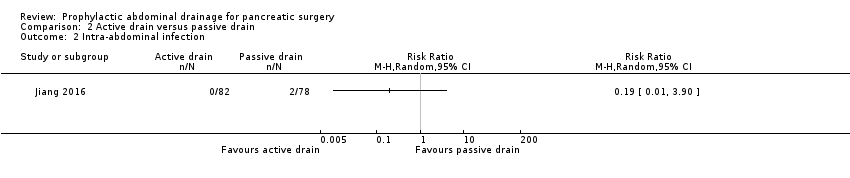
Comparison 2 Active drain versus passive drain, Outcome 2 Intra‐abdominal infection.

Comparison 2 Active drain versus passive drain, Outcome 3 Wound infection.

Comparison 2 Active drain versus passive drain, Outcome 4 Morbidity.
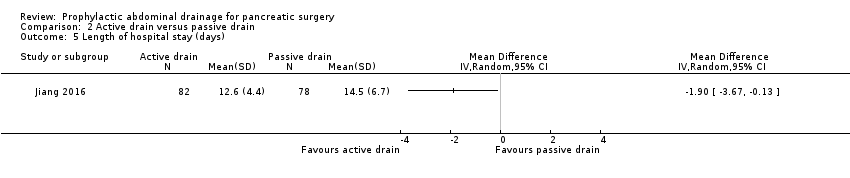
Comparison 2 Active drain versus passive drain, Outcome 5 Length of hospital stay (days).
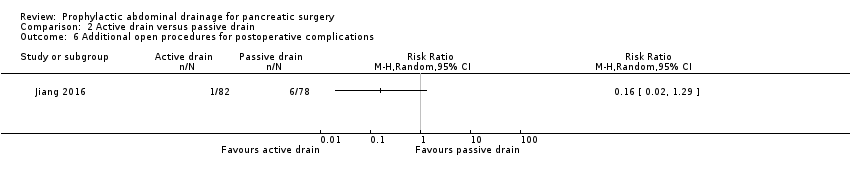
Comparison 2 Active drain versus passive drain, Outcome 6 Additional open procedures for postoperative complications.
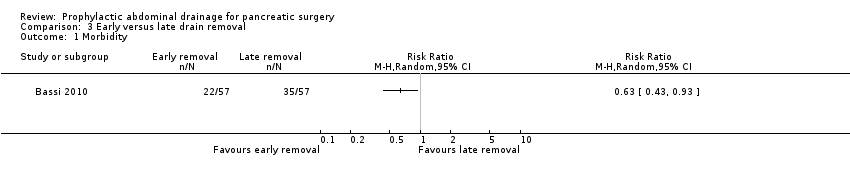
Comparison 3 Early versus late drain removal, Outcome 1 Morbidity.
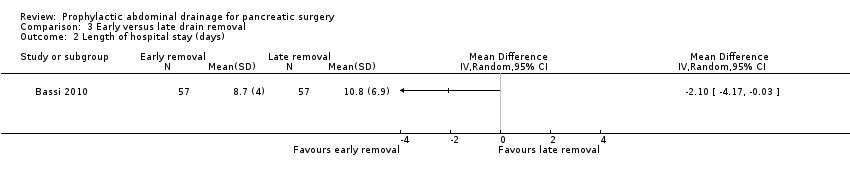
Comparison 3 Early versus late drain removal, Outcome 2 Length of hospital stay (days).

Comparison 3 Early versus late drain removal, Outcome 3 Hospital costs (EUR).

Comparison 3 Early versus late drain removal, Outcome 4 Additional open procedures for postoperative complications.

Comparison 4 Drain use versus no drain use sensitivity analysis for missing data, Outcome 1 Mortality (90 days) ‐ worst‐case scenario.
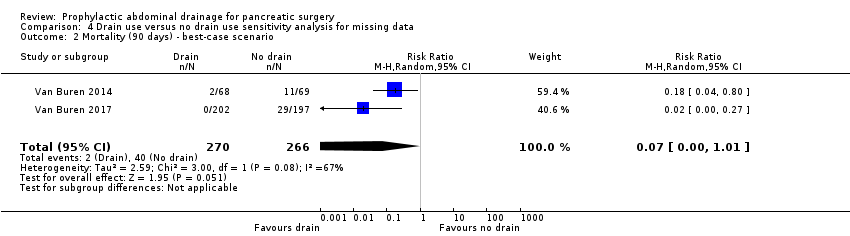
Comparison 4 Drain use versus no drain use sensitivity analysis for missing data, Outcome 2 Mortality (90 days) ‐ best‐case scenario.
| Drain use versus no drain use for pancreatic surgery | ||||||
| Patient or population: people undergoing elective open pancreatic resections | ||||||
| Outcomes | Anticipated absolute effects* (95% CI) | Relative effect | No of participants | Certainty of the evidence | Comments | |
| Risk with no drain use | Risk with drain use | |||||
| Mortality Follow‐up: 30 days | 23 per 1000 | 18 per 1000 (7 to 46) | RR 0.78 | 1055 | ⊕⊕⊕⊝ | |
| Mortality Follow‐up: 90 days | 42 per 1000 | 10 per 1000 (3 to 38) | RR 0.23 | 478 | ⊕⊕⊕⊝ | |
| Intra‐abdominal infection Follow‐up: 30 days | 82 per 1000 | 80 per 1000 (43 to 148) | RR 0.97 | 1055 | ⊕⊝⊝⊝ | |
| Wound infection Follow‐up: 30 days | 99 per 1000 | 97 per 1000 (68 to 140) | RR 0.98 | 1055 | ⊕⊕⊝⊝ | |
| Drain‐related complications Follow‐up: 30 days | See comment | See comment | Not estimable | 179 | ⊕⊕⊝⊝ | There was 1 drain‐related complication in the drainage group. The drainage tube was broken. |
| Morbidity Follow‐up: 30 days | 597 per 1000 | 614 per 1000 (561 to 674) | RR 1.03 | 1055 | ⊕⊕⊕⊝ | |
| Length of hospital stay Follow‐up: 30 days | The mean length of hospital stay in the no drain groups was 13.8 days | The mean length of hospital stay in the drain groups was | MD ‐0.66 (‐1.60 to 0.29) | 711 | ⊕⊕⊕⊝ | |
| Hospital costs Follow‐up: 30 days | Not reported | |||||
| Additional open procedures for postoperative complications Follow‐up: 30 days | 71 per 1000 | 94 per 1000 (56 to 158) | RR 1.33 | 1055 | ⊕⊕⊝⊝ | |
| Additional radiological interventions for postoperative complications Follow‐up: 30 days | 121 per 1000 | 105 per 1000 (48 to 227) | RR 0.87 | 660 | ⊕⊝⊝⊝ | |
| Pain Follow‐up: 30 days | Not reported | |||||
| Quality of life Follow‐up: 30 days FACT‐PA questionnaire: scale 0 to 144, where higher values indicate better quality of life | The mean quality of life score in the no drain group was 104 points | The mean quality of life score in the drain groups was | Not estimable (see comment) | 399 | ⊕⊕⊝⊝ | The study reported the mean quality of life score, without mentioning the standard deviation. |
| * The basis for the assumed risk was the control group proportion in the study. The risk in the intervention group (and its 95% confidence interval) is based on the assumed risk in the control group and the relative effect of the intervention (and its 95% CI). CI: Confidence interval; RR: Risk ratio; MD: mean difference. | ||||||
| GRADE Working Group grades of evidence | ||||||
| 1 Downgraded one level for serious imprecision (very few events, confidence interval of risk ratio overlapped 0.75 and 1.25). | ||||||
| Active drain versus passive drain for pancreatic surgery | ||||||
| Patient or population: people undergoing elective open pancreatic resections | ||||||
| Outcomes | Anticipated absolute effects* (95% CI) | Relative effect | No of participants | Quality of the evidence | Comments | |
| Risk with passive drain | Risk with active drain | |||||
| Mortality Follow‐up: 30 days | 1 per 1000 | 3 per 1000 (0 to 69) | RR 2.86 | 160 | ⊕⊕⊝⊝ | There were no events in the control arm. A risk of "1 per 1000" was chosen for illustration. RR was calculated using a correction factor and should be interpreted with caution. |
| Mortality Follow‐up: 90 days | Not reported | |||||
| Intra‐abdominal infection Follow‐up: 30 days | 26 per 1000 | 5 per 1000 (0 to 100) | RR 0.19 | 160 | ⊕⊝⊝⊝ | |
| Wound infection Follow‐up: 30 days | 90 per 1000 | 61 per 1000 (21 to 184) | RR 0.68 | 160 | ⊕⊝⊝⊝ | |
| Drain‐related complications Follow‐up: 30 days | Not reported | |||||
| Morbidity Follow‐up: 30 days | 321 per 1000 | 218 per 1000 (131 to 369) | RR 0.68 | 160 | ⊕⊕⊝⊝ | |
| Length of hospital stay Follow‐up: 30 days | The mean length of hospital stay in the passive drain group was 14.5 days | The mean length of hospital stay in the active drain group was | MD ‐1.90 (‐3.67 to ‐0.13) | 160 | ⊕⊕⊝⊝ | |
| Hospital costs Follow‐up: 30 days | Not reported | |||||
| Additional open procedures for postoperative complications Follow‐up: 30 days | 77 per 1000 | 12 per 1000 (2 to 99) | RR 0.16 | 160 | ⊕⊝⊝⊝ | |
| Additional radiological interventions for postoperative complications Follow‐up: 30 days | Not reported | |||||
| Pain Follow‐up: 30 days | Not reported | |||||
| Quality of life Follow‐up: 30 days | Not reported | |||||
| * The basis for the assumed risk was the control group proportion in the study. The risk in the intervention group (and its 95% confidence interval) is based on the assumed risk in the control group and the relative effect of the intervention (and its 95% CI). | ||||||
| GRADE Working Group grades of evidence | ||||||
| 1 Downgraded two levels for very serious imprecision (small sample sizes, very few events, confidence intervals of risk ratios overlapped 0.75 and 1.25). | ||||||
| Early versus late drain removal for pancreatic surgery | ||||||
| Patient or population: people undergoing elective open pancreatic resections Setting: hospital | ||||||
| Outcomes | Anticipated absolute effects* (95% CI) | Relative effect | No of participants | Quality of the evidence | Comments | |
| Risk with late drain removal | Risk with early drain removal | |||||
| Mortality Follow‐up: 30 days | There was no mortality in either group. | 114 | ⊕⊕⊕⊝ | |||
| Mortality Follow‐up: 90 days | Not reported | |||||
| Intra‐abdominal infection Follow‐up: 30 days | Not reported | |||||
| Wound infection Follow‐up: 30 days | Not reported | |||||
| Drain‐related complications Follow‐up: 30 days | Not reported | |||||
| Morbidity Follow‐up: 30 days | 614 per 1000 | 387 per 1000 (264 to 571) | RR 0.63 | 114 | ⊕⊕⊝⊝ | |
| Length of hospital stay Follow‐up: 30 days | The mean length of hospital stay in the late removal group was 10.8 days | The mean length of hospital stay in the early removal group was | MD ‐2.10 (‐4.17 to ‐0.03) | 114 | ⊕⊕⊝⊝ | |
| Hospital costs Follow‐up: 30 days | The mean hospital costs in the late removal group was EUR 12140.00 | The mean hospital costs in the early removal group was EUR 2069 lower | MD ‐2069.00 (‐3872.26 to ‐265.74) | 114 | ⊕⊕⊝⊝ | |
| Additional open procedures for postoperative complications Follow‐up: 30 days | 18 per 1000 | 6 per 1000 | RR 0.33 | 114 | ⊕⊝⊝⊝ | |
| Additional radiological interventions for postoperative complications Follow‐up: 30 days | Not reported | |||||
| Pain Follow‐up: 30 days | Not reported | |||||
| Quality of life Follow‐up: 30 days | Not reported | |||||
| * The basis for the assumed risk was the control group proportion in the study. The risk in the intervention group (and its 95% confidence interval) is based on the assumed risk in the control group and the relative effect of the intervention (and its 95% CI). | ||||||
| GRADE Working Group grades of evidence | ||||||
| 1 Publication bias could not be assessed because of the few number of studies. | ||||||
| Outcome or subgroup title | No. of studies | No. of participants | Statistical method | Effect size |
| 1 Mortality (30 days) Show forest plot | 3 | 711 | Risk Ratio (M‐H, Random, 95% CI) | 0.78 [0.31, 1.99] |
| 2 Mortality (90 days) Show forest plot | 2 | 478 | Risk Ratio (M‐H, Random, 95% CI) | 0.23 [0.06, 0.90] |
| 3 Intra‐abdominal infection Show forest plot | 4 | 1055 | Risk Ratio (M‐H, Random, 95% CI) | 0.97 [0.52, 1.80] |
| 4 Wound infection Show forest plot | 4 | 1055 | Risk Ratio (M‐H, Random, 95% CI) | 0.98 [0.68, 1.41] |
| 5 Morbidity Show forest plot | 4 | 1055 | Risk Ratio (M‐H, Random, 95% CI) | 1.03 [0.94, 1.13] |
| 6 Length of hospital stay (days) Show forest plot | 3 | 711 | Mean Difference (IV, Random, 95% CI) | ‐0.66 [‐1.60, 0.29] |
| 7 Additional open procedures for postoperative complications Show forest plot | 4 | 1055 | Risk Ratio (M‐H, Random, 95% CI) | 1.33 [0.79, 2.23] |
| 8 Additional radiological interventions for postoperative complications Show forest plot | 3 | 660 | Risk Ratio (M‐H, Random, 95% CI) | 0.87 [0.40, 1.87] |
| Outcome or subgroup title | No. of studies | No. of participants | Statistical method | Effect size |
| 1 Mortality (30 days) Show forest plot | 1 | Risk Ratio (M‐H, Random, 95% CI) | Totals not selected | |
| 2 Intra‐abdominal infection Show forest plot | 1 | Risk Ratio (M‐H, Random, 95% CI) | Totals not selected | |
| 3 Wound infection Show forest plot | 1 | Risk Ratio (M‐H, Random, 95% CI) | Totals not selected | |
| 4 Morbidity Show forest plot | 1 | Risk Ratio (M‐H, Random, 95% CI) | Totals not selected | |
| 5 Length of hospital stay (days) Show forest plot | 1 | Mean Difference (IV, Random, 95% CI) | Totals not selected | |
| 6 Additional open procedures for postoperative complications Show forest plot | 1 | Risk Ratio (M‐H, Random, 95% CI) | Totals not selected | |
| Outcome or subgroup title | No. of studies | No. of participants | Statistical method | Effect size |
| 1 Morbidity Show forest plot | 1 | Risk Ratio (M‐H, Random, 95% CI) | Totals not selected | |
| 2 Length of hospital stay (days) Show forest plot | 1 | Mean Difference (IV, Random, 95% CI) | Totals not selected | |
| 3 Hospital costs (EUR) Show forest plot | 1 | Mean Difference (IV, Random, 95% CI) | Totals not selected | |
| 4 Additional open procedures for postoperative complications Show forest plot | 1 | Risk Ratio (M‐H, Random, 95% CI) | Totals not selected | |
| Outcome or subgroup title | No. of studies | No. of participants | Statistical method | Effect size |
| 1 Mortality (90 days) ‐ worst‐case scenario Show forest plot | 2 | 536 | Risk Ratio (M‐H, Random, 95% CI) | 2.15 [0.05, 89.11] |
| 2 Mortality (90 days) ‐ best‐case scenario Show forest plot | 2 | 536 | Risk Ratio (M‐H, Random, 95% CI) | 0.07 [0.00, 1.01] |