胰腺手术的预防性腹部引流术
Abstract
研究背景
术后引流的使用被认为是胰腺手术后强制性的。预防性腹腔引流在胰腺手术术后并发症中的作用是有争议的。
研究目的
目的: 评价胰腺手术后常规腹腔引流术的优点和危害, 比较不同类型手术引流的效果, 并且评价最佳的引流时间。
检索策略
在本综述的最后一个版本中, 我们检索了CENTRAL (2016, 8月发布), MEDLINE, Embase, 科学引文索引扩展版, 以及中国生物医学文献数据库 (CBM)),截止到2016年8月28日。对于这一更新的综述,我们检索了CENTRAL, MEDLINE, Embase, 科学引文索引扩展版, 和CBM,从2016年到2017年11月15日。
标准/纳入排除标准
我们纳入了所有比较胰腺手术后腹部引流与无引流的随机对照试验。我们还纳入了比较不同类型的引流术和接受胰腺手术人的不同的移除引流的时间安排的随机对照研究。
数据收集与分析
我们确定了六项研究 (1384 名受试者)。两名研究人员根据纳入标准,独立筛选、提取资料并且评估偏倚风险。我们使用Review Manager 5(RevMan)进行数据分析。我们计算了二分类结局的风险比(RR)和连续结局的均值差异(MD)和95%置信区间。对于所有的分析, 我们使用了随机效应模型。
主要结果
引流术使用与无引流术使用
我们纳入了四项研究,涉及1110名受试者,胰腺手术后他们被随机分到引流组 (n = 560) 和无引流组 (n = 550) 。两组间30天的死亡率差异很少或没有差别 (引流术组为1.5%,无引流术组为2.3% ;RR=0.78, 95% CI= 0.31 ‐ 1.99;四项研究, 1055 名受试者;中等质量的证据)。引流术的使用可能轻微地减少在90天的死亡率(0.8% 比 4.2%;RR= 0.23,95% CI= 0.06 到 0.90;两项研究中,478 名受试者;中等质量的证据)。我们不确定引流术的使用是否会减少腹内感染(7.9% 比 8.2%;RR =0.97,95% CI =0.52 ‐ 1.80;四项研究,1055 名受试者;非常低质量的证据),或额外的放射干预对术后并发症的影响(10.9% 比 12.1%;RR= 0.87,95% CI =0.79 到 2.23;三项研究,660 名受试者;非常低质量的证据)。当与无引流术的使用相比较时,引流术的使用可能导致相似的伤口感染量(9.8% 比 9.9%;RR =0.98,95% CI =0.68 ‐ 1.41;四项研究,1055 名受试者;低质量的证据)和对于术后并发症的额外开放手术(9.4% 比 7.1%;RR= 1.33, 95% CI =0.79 ‐ 2.23;四项研究,1055 名参与者;低质量的证据)。两组之间的发病率(61.7% 比 59.7%;RR =1.03, 95% CI= 0.94‐ 1.13;四项研究,1055 名受试者;中等质量的证据),或住院时间 (MD= ‐0.66 天,95% CI=‐1.60 ‐ 0.29;三项研究,711 名受试者;中等质量证据)差异很少或没有差异 。引流术组 (0.2%)中有一项与引流术相关的并发症(引流管断裂)。与健康有关的生活质量是用 pancreas‐specific 生活质量调查问卷(FACT‐PA;0 到144的刻度,更高的数值表明了更好的生活质量) 来衡量的。当与无引流术相比较时,引流术的使用可能导致相似的生活质量评分——测量于胰腺手术之后的30天(105 分比104分; 一项研究,399 名受试者;低质量证据)。在任何研究中都没有报告医院费用和疼痛。
引流术类型
我们纳入了一项研究,共160名受试者,胰腺手术后他们被随机分到积极的引流组(n = 82)和消极的引流组(n = 78) 。当与消极的引流术相比时,积极的引流术可能在30天内导致类似的死亡率(积极的引流术占1.2% 而消极的引流术占0%;低质量证据)和发病率(22.0% 比 32.1%;RR=0.68,95% CI=0.41 ‐ 1.15;低质量的证据)。我们不确定是否积极的引流术能减少腹内感染(0% 比 2.6%;非常低质量的证据),伤口感染(6.1% 比 9.0%;RR=0.68, 95% CI=0.23‐2.05;非常低质量的证据),或额外开放手术的数量,术后并发症 (1.2% 比 7.7%;RR=0.16,95% CI=0.02‐1.29;非常低质量的证据)。积极的引流术可轻微的减少住院时间 (MD= ‐1.90 天, 95% CI= ‐3.67 ‐ ‐0.13;一项研究;低质量证据;平均住院时间减少 14.1%)。这项研究没有报告额外的放射干预、疼痛和生活质量。
早期与后期引流的移除
我们纳入了一项试验, 涉及114名术后胰瘘风险低的受试者, 胰腺手术后他们被随机分配到早期引流移除组(n = 57)和晚期引流移除组 (n = 57) 。两组均无死亡率。早期引流移除可能轻微地减少发病率 (早期引流移除为38.6% 而晚期引流移除为61.4%;RR=0.63, 95% CI=0.43 ‐ 0.93;低质量证据), 住院时间(MD=‐2.10 天,95% CI=‐4.17 ‐ ‐0.03;低质量证据;平均住院天数减少21.5% )和医院费用 (MD= ‐2069.00EUR ,95% CI=‐3872.26 ‐ ‐265.74;低质量证据;平均医院费用减少17.0%)。我们不确定早期移除引流是否减少了对术后并发症的额外开放手术的需要 (0% 比1.8%;RR=0.33,95% CI=0.01‐8.01;一项研究;非常低质量证据)。本研究未报告腹腔内感染、伤口感染、额外放射干预、疼痛和生活质量。
作者结论
目前还不清楚常规的腹部引流是否对30天的死亡率降低或胰腺手术后并发症有任何影响。中等质量的证据表明常规的腹部引流可能会轻微降低90天内死亡率。低质量的证据表明,与使用消极的引流术相比,使用积极的引流术可能会略微减少胰腺手术后住院的时间,并且对于术后胰瘘低风险人群,早期移除引流术可能优于晚期移除引流术。
PICO
Plain language summary
胰腺手术后的引流应用
综述问题
使用引流可以减少胰腺手术后的并发症吗?
研究背景
术后引流的使用被认为是胰腺手术后强制性的。然而, 引流在减少胰腺手术后并发症 (称为术后并发症) 中的作用是有争议的。
研究特征
我们检索了在2017年11月之前所有相关的、实施严谨的研究报告。我们纳入六项随机对照研究 (在试验中受试者被随机分配到两个或更多的干预措施, 也许包括干预措施或不干预, 并比较结果)。六项研究包括1384名做过胰腺手术的受试者。六项随机试验研究中的四项研究共1110名受试者被随机分配到术后引流组(人数 = 560)或无术后引流组(N = 550)。一项随机试验有170名受试者被随机分配到积极的引流术组(引流用低或高压抽吸,N = 82)或消极的引流术组(引流没有压力, n = 78)。一项随机试验中将术后胰瘘 (一种并发症, 胰腺与附近的肠道断开, 然后重新连接,使含有消化酶的胰汁进入消化系统)风险低的114名患者随机分配到早期引流组(n = 57) 或延迟引流组(n = 57)。
主要结局
引流术使用组和没有引流术使用组,在30天时,死亡率 (引流术组1.5% ,而没有引流术组2.3% ), 整体并发症 (61.7% 对比59.7%), 或住院时间 (14.3 天对比13.8 天)上, 可能差异很少或根本没有差异。引流术的使用可能在90天内稍微降低死亡率 (0.8% 比 4.2%)。我们不确定是否引流术使用减少了腹部感染(7.9% 比 8.2%), 或是否需要额外的放射来治疗术后并发症 (10.9%% 比 12.1%)。与没有引流术使用相比,引流术的使用可能导致类似的伤口感染 (9.8% 比 9.9%), 需要对术后并发症额外的开放手术,(9.4% 比 7.1%), 和生活质量评分 (105 分比104分)。引流术组 (0.2%) 中有一项与引流术相关的并发症 (引流管断裂)。
积极的引流术在30天内可能在死亡率(加压引流术组为1.2% ,而不加压引流术组为0%),整体并发症 (22.0% 比 32.1%)与消极的引流术组结局相似。我们不确定是否加压引流术会减少腹内感染 (0% 比 2.6%),伤口感染 (6.1% 比 9.0%),或对术后并发症是否需要额外的开放手术 (1.2% 比 7.7%)。积极的引流术可能会略微减少住院的时间 (平均住院时间减少14.1%)。
在一项对比了早期和晚期移除引流的小型研究中,两组都没有死亡 。早期移除引流可减少整体并发症 (早期移除引流术为38.6%,晚期移除引流为61.4%), 住院时间(平均住院时间减少 21.5%)和医院费用 (平均住院费用减少17.0%)。我们不确定早期移除引流是否减少了对术后并发症的额外开放手术的需要 (0% 比 1.8%)。
目前尚不清楚常规引流术的使用是否对30天内的死亡减少或术后并发症有任何影响。常规的腹部引流可能会在90天内轻微的减少死亡。积极的引流术与早期出院的关系似乎比消极的引流术更相关, 并且早期移除引流对于术后胰瘘的风险降低似乎优于晚期移除引流。
证据的质量
所有的研究都有很高的偏倚风险 (暗示有高估优点或低估危害的可能性)。总的来说,证据的质量在非常低到中等之间。
Authors' conclusions
Summary of findings
| Drain use versus no drain use for pancreatic surgery | ||||||
| Patient or population: people undergoing elective open pancreatic resections | ||||||
| Outcomes | Anticipated absolute effects* (95% CI) | Relative effect | No of participants | Certainty of the evidence | Comments | |
| Risk with no drain use | Risk with drain use | |||||
| Mortality Follow‐up: 30 days | 23 per 1000 | 18 per 1000 (7 to 46) | RR 0.78 | 1055 | ⊕⊕⊕⊝ | |
| Mortality Follow‐up: 90 days | 42 per 1000 | 10 per 1000 (3 to 38) | RR 0.23 | 478 | ⊕⊕⊕⊝ | |
| Intra‐abdominal infection Follow‐up: 30 days | 82 per 1000 | 80 per 1000 (43 to 148) | RR 0.97 | 1055 | ⊕⊝⊝⊝ | |
| Wound infection Follow‐up: 30 days | 99 per 1000 | 97 per 1000 (68 to 140) | RR 0.98 | 1055 | ⊕⊕⊝⊝ | |
| Drain‐related complications Follow‐up: 30 days | See comment | See comment | Not estimable | 179 | ⊕⊕⊝⊝ | There was 1 drain‐related complication in the drainage group. The drainage tube was broken. |
| Morbidity Follow‐up: 30 days | 597 per 1000 | 614 per 1000 (561 to 674) | RR 1.03 | 1055 | ⊕⊕⊕⊝ | |
| Length of hospital stay Follow‐up: 30 days | The mean length of hospital stay in the no drain groups was 13.8 days | The mean length of hospital stay in the drain groups was | MD ‐0.66 (‐1.60 to 0.29) | 711 | ⊕⊕⊕⊝ | |
| Hospital costs Follow‐up: 30 days | Not reported | |||||
| Additional open procedures for postoperative complications Follow‐up: 30 days | 71 per 1000 | 94 per 1000 (56 to 158) | RR 1.33 | 1055 | ⊕⊕⊝⊝ | |
| Additional radiological interventions for postoperative complications Follow‐up: 30 days | 121 per 1000 | 105 per 1000 (48 to 227) | RR 0.87 | 660 | ⊕⊝⊝⊝ | |
| Pain Follow‐up: 30 days | Not reported | |||||
| Quality of life Follow‐up: 30 days FACT‐PA questionnaire: scale 0 to 144, where higher values indicate better quality of life | The mean quality of life score in the no drain group was 104 points | The mean quality of life score in the drain groups was | Not estimable (see comment) | 399 | ⊕⊕⊝⊝ | The study reported the mean quality of life score, without mentioning the standard deviation. |
| * The basis for the assumed risk was the control group proportion in the study. The risk in the intervention group (and its 95% confidence interval) is based on the assumed risk in the control group and the relative effect of the intervention (and its 95% CI). CI: Confidence interval; RR: Risk ratio; MD: mean difference. | ||||||
| GRADE Working Group grades of evidence | ||||||
| 1 Downgraded one level for serious imprecision (very few events, confidence interval of risk ratio overlapped 0.75 and 1.25). | ||||||
| Active drain versus passive drain for pancreatic surgery | ||||||
| Patient or population: people undergoing elective open pancreatic resections | ||||||
| Outcomes | Anticipated absolute effects* (95% CI) | Relative effect | No of participants | Quality of the evidence | Comments | |
| Risk with passive drain | Risk with active drain | |||||
| Mortality Follow‐up: 30 days | 1 per 1000 | 3 per 1000 (0 to 69) | RR 2.86 | 160 | ⊕⊕⊝⊝ | There were no events in the control arm. A risk of "1 per 1000" was chosen for illustration. RR was calculated using a correction factor and should be interpreted with caution. |
| Mortality Follow‐up: 90 days | Not reported | |||||
| Intra‐abdominal infection Follow‐up: 30 days | 26 per 1000 | 5 per 1000 (0 to 100) | RR 0.19 | 160 | ⊕⊝⊝⊝ | |
| Wound infection Follow‐up: 30 days | 90 per 1000 | 61 per 1000 (21 to 184) | RR 0.68 | 160 | ⊕⊝⊝⊝ | |
| Drain‐related complications Follow‐up: 30 days | Not reported | |||||
| Morbidity Follow‐up: 30 days | 321 per 1000 | 218 per 1000 (131 to 369) | RR 0.68 | 160 | ⊕⊕⊝⊝ | |
| Length of hospital stay Follow‐up: 30 days | The mean length of hospital stay in the passive drain group was 14.5 days | The mean length of hospital stay in the active drain group was | MD ‐1.90 (‐3.67 to ‐0.13) | 160 | ⊕⊕⊝⊝ | |
| Hospital costs Follow‐up: 30 days | Not reported | |||||
| Additional open procedures for postoperative complications Follow‐up: 30 days | 77 per 1000 | 12 per 1000 (2 to 99) | RR 0.16 | 160 | ⊕⊝⊝⊝ | |
| Additional radiological interventions for postoperative complications Follow‐up: 30 days | Not reported | |||||
| Pain Follow‐up: 30 days | Not reported | |||||
| Quality of life Follow‐up: 30 days | Not reported | |||||
| * The basis for the assumed risk was the control group proportion in the study. The risk in the intervention group (and its 95% confidence interval) is based on the assumed risk in the control group and the relative effect of the intervention (and its 95% CI). | ||||||
| GRADE Working Group grades of evidence | ||||||
| 1 Downgraded two levels for very serious imprecision (small sample sizes, very few events, confidence intervals of risk ratios overlapped 0.75 and 1.25). | ||||||
| Early versus late drain removal for pancreatic surgery | ||||||
| Patient or population: people undergoing elective open pancreatic resections Setting: hospital | ||||||
| Outcomes | Anticipated absolute effects* (95% CI) | Relative effect | No of participants | Quality of the evidence | Comments | |
| Risk with late drain removal | Risk with early drain removal | |||||
| Mortality Follow‐up: 30 days | There was no mortality in either group. | 114 | ⊕⊕⊕⊝ | |||
| Mortality Follow‐up: 90 days | Not reported | |||||
| Intra‐abdominal infection Follow‐up: 30 days | Not reported | |||||
| Wound infection Follow‐up: 30 days | Not reported | |||||
| Drain‐related complications Follow‐up: 30 days | Not reported | |||||
| Morbidity Follow‐up: 30 days | 614 per 1000 | 387 per 1000 (264 to 571) | RR 0.63 | 114 | ⊕⊕⊝⊝ | |
| Length of hospital stay Follow‐up: 30 days | The mean length of hospital stay in the late removal group was 10.8 days | The mean length of hospital stay in the early removal group was | MD ‐2.10 (‐4.17 to ‐0.03) | 114 | ⊕⊕⊝⊝ | |
| Hospital costs Follow‐up: 30 days | The mean hospital costs in the late removal group was EUR 12140.00 | The mean hospital costs in the early removal group was EUR 2069 lower | MD ‐2069.00 (‐3872.26 to ‐265.74) | 114 | ⊕⊕⊝⊝ | |
| Additional open procedures for postoperative complications Follow‐up: 30 days | 18 per 1000 | 6 per 1000 | RR 0.33 | 114 | ⊕⊝⊝⊝ | |
| Additional radiological interventions for postoperative complications Follow‐up: 30 days | Not reported | |||||
| Pain Follow‐up: 30 days | Not reported | |||||
| Quality of life Follow‐up: 30 days | Not reported | |||||
| * The basis for the assumed risk was the control group proportion in the study. The risk in the intervention group (and its 95% confidence interval) is based on the assumed risk in the control group and the relative effect of the intervention (and its 95% CI). | ||||||
| GRADE Working Group grades of evidence | ||||||
| 1 Publication bias could not be assessed because of the few number of studies. | ||||||
Background
Description of the condition
See 'Glossary' for an explanation of terms (Appendix 1).
Pancreatic cancer ranks thirteenth in terms of the most common cancers and eighth as the cause of cancer death from a global viewpoint (Anderson 2006; Lowenfels 2006). Regional differences exist in the incidence, and the number of new cases diagnosed per year (Anderson 2006; Kamisawa 2016). The overall incidence of pancreatic cancer is approximately 4 to 10 cases per 100,000 people per year (Dragovich 2017; Torre 2015). The most common cause of pancreatic cancer is heavy tobacco usage (Kamisawa 2016; Lowenfels 2006).
Although the exact worldwide incidence of chronic pancreatitis is unknown, the estimated incidence of chronic pancreatitis is six cases per 100,000 people per year in Europe, and probably in all western countries (Spanier 2008). The prevalence of chronic pancreatitis per 100,000 people is 3 cases in the UK, 26 in France, 4 in Japan, and 114 to 200 cases in south India (Bornman 2001; Braganza 2011; Garg 2004; Lévy 2006). The most common cause of chronic pancreatitis is alcohol abuse (Kleeff 2017; Spanier 2008).
Pancreatic surgery is performed to treat various pancreatic and extra‐pancreatic diseases, including pancreatic cancers, chronic pancreatitis, and biliary and duodenal malignancies (Cheng 2014; Cheng 2016a; Cheng 2017; Connor 2005; Gurusamy 2013a). Although mortality of pancreatic surgery has been reduced to less than 5% currently, overall morbidity is still high, ranging from 30% to 60% (Bassi 2017; Connor 2005; Giovinazzo 2011; Gurusamy 2013a; Wente 2007a; Wente 2007b). The most common complications after pancreatic surgery include delayed gastric emptying (19% to 23%; Wente 2007a; Wente 2007b), pancreatic fistula (2% to 30%; Bassi 2017; Cheng 2016a; Hackert 2011; Wente 2007a; Wente 2007b), intra‐abdominal abscess (9% to 10%; Wente 2007a; Wente 2007b), wound infection (5% to 15%; Andrén‐Sandberg 2011; Halloran 2002), and postoperative bleeding (1% to 8%; Wente 2007a; Wente 2007b).
Description of the intervention
As a measure to reduce postoperative complications after pancreatic resections, prophylactic drains are traditionally placed in the subhepatic space near both the biliary and pancreatic anastomoses (Conlon 2001; Fisher 2011). Abdominal drainage has been in use for over 1000 years (Memon 2001).
Surgical drains are artificial tubes used to remove blood, pus, or other body fluids from wounds (Durai 2009). There are two main types of surgical drains: open and closed (Cheng 2015; Durai 2009; Gurusamy 2007a; Wang 2015). An open drain communicates with the atmosphere (e.g. corrugated drain, Penrose drain, sump drain; Durai 2009; Gurusamy 2007a; Wang 2015). A closed drain consists of a tube that drains into a collection bag or bottle, where the contents are not exposed to the atmosphere (Durai 2009; Gurusamy 2007a; Wang 2015). Closed drains may be either active (suction drains under low or high pressure, e.g. Jackson‐Pratt drain, Redivac) or passive (drains without suction, e.g. Robinson drain, Pigtail drain; Durai 2009; Gurusamy 2007a; Wang 2015).
How the intervention might work
Surgeons have routinely used drains after pancreatic surgery because of the possible collection of bile, pancreatic juice, or blood, which may require additional procedures. The primary reasons for placing abdominal drains after pancreatic resections are: (1) drainage of established intra‐abdominal collections (e.g. bile, pancreatic juice, pus); (2) prevention of further fluid accumulation; and (3) identification and monitoring of any fistula or bleeding. Theoretically, abdominal drainage has the potential to prevent or control postoperative complications (e.g. intra‐abdominal abscess, pancreatic or biliary fistula, bleeding; Adham 2013; Bassi 2010; Conlon 2001; Correa‐Gallego 2013; Fisher 2011; Giovinazzo 2011; Heslin 1998; Jeekel 1992; Kawai 2006; Lim 2013; Mehta 2013; Paulus 2012; Van Buren 2014; Van Buren 2017). The use of surgical drains has been considered mandatory after pancreatic surgery since the mid‐1930s (Allen 2011).
However, some surgeons have argued that abdominal drainage may fail to reduce postoperative complications because a drain may become sealed off and ineffective within a few days after pancreatic surgery (Heslin 1998; Paulus 2012). The drain itself appears to act as a foreign body, and may interfere with wound healing (Correa‐Gallego 2013; Fisher 2011; Paulus 2012). The drainage tube creates a pathway for contamination, and may increase the risk of postoperative infectious complications (Inoue 2011; Jeekel 1992). In addition, the use of a drain may be associated with an increased length of hospital stay (Fisher 2011; Mehta 2013; Paulus 2012; Van Buren 2017). Abdominal drainage may be also associated with some rare adverse events, such as bowel perforation, hernia, and bleeding (Cameron‐Strange 1985; Henkus 1999; Makama 2010; Nomura 1998; Reed 1992; Sahu 2008; Srivastava 2007; Van Hee 1983). Studies have suggested that routine placement of prophylactic abdominal drains may be unnecessary, and may be associated with an increased complication rate (Adham 2013; Correa‐Gallego 2013; Fisher 2011; Giovinazzo 2011; Heslin 1998; Jeekel 1992; Lim 2013; Mehta 2013; Paulus 2012).
Why it is important to do this review
Routine use of prophylactic abdominal drainage in people undergoing pancreatic surgery is controversial. This is an update of a previous Cochrane Review assessing the role of prophylactic abdominal drainage for pancreatic surgery (Cheng 2016a).
Objectives
To assess the benefits and harms of routine abdominal drainage after pancreatic surgery, compare the effects of different types of surgical drains, and evaluate the optimal time for drain removal.
Methods
Criteria for considering studies for this review
Types of studies
We included all randomized controlled trials (RCTs), regardless of sample size, language, or publication status, which compared (1) drain use versus no drain use, (2) different types of drains, or (3) different schedules for drain removal in people undergoing pancreatic surgery. We excluded quasi‐randomized studies, in which the allocation was performed on the basis of a pseudo‐random sequence (e.g. odd or even hospital number or date of birth, alternation, and non‐randomized studies) because of the potential for bias (Reeves 2011).
Types of participants
We included people, regardless of age, sex, or race, who underwent elective pancreatic resections (open or laparoscopic) for any pancreatic or extra‐pancreatic disease.
Types of interventions
-
Drain use versus no drain use.
-
One type of drain versus another.
-
Early versus late drain removal (no more than four days versus more than four days).
Types of outcome measures
Primary outcomes
-
Mortality:
-
30‐day mortality;
-
90‐day mortality.
-
-
Infectious complications:
-
intra‐abdominal infection;
-
wound infection.
-
-
Drain‐related complications.
Secondary outcomes
-
Morbidity as defined by study authors. We classified morbidity by the Clavien‐Dindo classification of surgical complications (Clavien 2009).
-
Length of hospital stay.
-
Hospital costs.
-
Additional procedures for postoperative complications:
-
open procedures;
-
radiological interventions (radiological drainage requiring insertion of drain or percutaneous aspiration).
-
-
Pain.
-
Quality of life.
The main reason to justify abdominal drainage was the assumption that it would reduce the infectious complication rate and subsequent mortality and morbidity rates. Other clinical outcomes were chosen to assess whether abdominal drainage resulted in earlier discharge from hospital, fewer reoperations, and improvement in health‐related quality of life and cost effectiveness.
Reporting of the outcomes listed here was not an inclusion criterion for the review.
Search methods for identification of studies
Before searching, we designed the search strategies with the help of the Cochrane Upper Gastrointestinal and Pancreatic Diseases (UGPD) Information Specialist. We placed no restrictions on the language of publication when searching the electronic databases or reviewing reference lists in identified studies.
Electronic searches
For the last version of this review, we searched the Cochrane Central Register of Controlled Trials (CENTRAL; 2016, Issue 8) in the Cochrane Library, MEDLINE (1946 to 28 August 2016), Embase (1980 to 28 August 2016), Science Citation Index Expanded (1900 to 28 August 2016), and Chinese Biomedical Literature Database (CBM; 1978 to 28 August 2016; Cheng 2016b; Peng 2015). For this updated review, we searched the following electronic databases from 2016 to 15 November 2017, with no language or date of publication restrictions:
-
the Cochrane Central Register of Controlled Trials (CENTRAL; 2017, Issue 11) in the Cochrane Library (searched 15 November 2017; Appendix 2);
-
MEDLINE Ovid (2016 to 15 November 2017; Appendix 3);
-
Embase Ovid (2016 to 15 November 2017; Appendix 4);
-
Science Citation Index Expanded (Web of Science; 2016 to 15 November 2017; Appendix 5); and
-
Chinese Biomedical Literature Database (CBM; 2016 to 15 November 2017; Appendix 6).
Searching other resources
We checked reference lists of all primary studies and relevant review articles that were identified during the search for RCTs for additional references. We contacted authors of identified studies and asked them to identify other published and unpublished studies.
We searched PubMed for errata or retractions of eligible studies, and reported the date this was done in the results section (www.ncbi.nlm.nih.gov/pubmed). We also searched the meeting abstracts via the Society of American Gastrointestinal and Endoscopic Surgeons (SAGES; www.sages.org/; accessed 15 November 2017) and Conference Proceedings Citation Index to explore further relevant clinical studies.
Clinical trials registers/trial result registers
We searched the following databases to identify ongoing studies (accessed 15 November 2017):
-
World Health Organization International Clinical Trials Registry Platform search portal (apps.who.int/trialsearch/);
-
ClinicalTrials.gov (www.clinicaltrials.gov/);
-
Current Controlled Trials (www.controlled‐trials.com/);
-
European (EU) Clinical Trials Register (www.clinicaltrialsregister.eu/);
-
Chinese Clinical Trial Register (www.chictr.org/).
Data collection and analysis
We conducted this systematic review according to the Cochrane Handbook for Systematic Reviews of Intervention (Higgins 2011), and the Cochrane UGPD Group Module (Forman 2011).
Selection of studies
Two review authors (WZ, SH) independently screened the titles and abstracts of all the reports we identified as a result of the search, and coded them as 'retrieve' (eligible, potentially eligible, or unclear) or 'do not retrieve'. We retrieved the full‐text study reports and publications of identified reports, and two review authors (WZ, SH) independently screened the full text, identified studies for inclusion, and identified and recorded reasons for exclusion of the ineligible studies. We resolved any disagreements through discussion, or if required, we consulted a third review author (ZL). We identified and excluded duplicates and collated multiple reports of the same study, so that each study, rather than each report, was the unit of interest in the review. We recorded the selection process in sufficient detail to complete a PRISMA flow diagram and a 'Characteristics of excluded studies' table (Moher 2009).
Data extraction and management
We used a standard data collection form for study characteristics and outcome data, which had been piloted on at least one study in the review. Two review authors (JX, ML) extracted the following study characteristics from included studies:
-
methods: study design, total duration of study and run in, number of study centers and location, study setting, withdrawals, and date of study;
-
participants: number (N), mean age, age range, gender, severity of condition, diagnostic criteria, inclusion criteria, and exclusion criteria;
-
interventions: intervention, comparison;
-
outcomes: primary and secondary outcomes specified and collected, time points reported;
-
notes: funding for trial, notable conflicts of interest of trial authors.
Two review authors (JX, ML) independently extracted outcome data from included studies. We noted in the 'Characteristics of included studies' table if outcome data were not reported in a usable way. We resolved disagreements by consensus, or by involving a third review author (ZL). One review author (SH) copied the data from the data collection form into Review Manager 5 (RevMan 2014). We double‐checked that the data were entered correctly by comparing the study reports with how the data were presented in the systematic review. A second review author spot‐checked study characteristics for accuracy against the trial report.
Assessment of risk of bias in included studies
Two review authors (WZ, SH) independently assessed risk of bias for each study, using the criteria outlined in the Cochrane Handbook for Systematic Reviews of Interventions (Higgins 2011). We resolved any disagreements by discussion, or by involving a third review author (ZL). We assessed the risk of bias according to the following domains:
-
random sequence generation;
-
allocation concealment;
-
blinding of outcome assessment;
-
incomplete outcome data;
-
selective outcome reporting;
-
other bias.
We graded each potential source of bias as high, low, or unclear risk, and provided a quote from the study report together with a justification for our judgement in the 'Risk of bias' table. We summarized the 'Risk of bias' judgements across different studies for each of the domains listed. We considered blinding separately for different key outcomes where necessary (e.g. for unblinded outcome assessment, risk of bias for all‐cause mortality may be different than for a participant‐reported pain scale). Where information on risk of bias related to unpublished data or correspondence with a trialist, we noted this in the 'Risk of bias' table.
When considering treatment effects, we took into account the risk of bias for the studies that contributed to that outcome.
Assessment of bias in conducting the systematic review
We conducted the review according to the published protocol, and reported any deviations from it in the 'Differences between protocol and review' section of the review (Cheng 2013).
Measures of treatment effect
We analyzed dichotomous data as risk ratio (RR) and continuous data as mean difference (MD) or standardized mean difference (SMD) with 95% confidence intervals (CI). We ensured that higher scores for continuous outcomes had the same meaning for the particular outcome, explained the direction to the reader, and reported where the directions were reversed, if this was necessary.
We undertook meta‐analyses only where this was meaningful, that is, if the treatments, participants, and underlying clinical question were similar enough for pooling to make sense.
A common way that trialists indicate when they have skewed data is by reporting medians and interquartile ranges. When we encountered this, we noted that the data were skewed and considered the implication of this.
Where multiple trial arms were reported in a single trial, we included only the relevant arms. If two comparisons (e.g. drug A versus placebo and drug B versus placebo) were entered into the same meta‐analysis, we halved the control group to avoid double‐counting.
Unit of analysis issues
The unit of analysis was the individual participant. We did not find any cross‐over or cluster‐randomized studies.
Dealing with missing data
We contacted investigators or study sponsors in order to verify key study characteristics and obtained missing numerical outcome data when needed (e.g. when a study was identified as abstract only). We did not get a response. Thus, we only used the available data in the analyses.
Assessment of heterogeneity
We used the I² statistic to measure heterogeneity among the studies in each analysis (Higgins 2003). When we identified substantial heterogeneity (greater than 50%), we explored it by prespecified subgroup analysis, and we interpreted summary effect measures with caution.
Assessment of reporting biases
We did not perform funnel plots to assess reporting biases because there were fewer than 10 included studies (Sterne 2011).
Data synthesis
We performed the meta‐analyses using Review Manager 5 software (RevMan 2014). For all analyses, we used a random‐effects model.
Subgroup analysis and investigation of heterogeneity
We had intended to perform the following subgroup analyses, but were unable to because of limited data:
-
RCTs with low risk of bias versus RCTs with high risk of bias;
-
different etiologies (pancreatic cancer, chronic pancreatitis, and others);
-
type of operation (proximal, distal, and central pancreatectomy).
Sensitivity analysis
We performed sensitivity analyses, defined a priori, to assess the robustness of our conclusions. This involved:
-
changing between a fixed‐effect model and a random‐effects model;
-
changing between RR, risk differences (RD), and odds ratios (OR) for dichotomous outcomes;
-
changing between MD and SMD for continuous outcomes;
-
changing between worst‐case and best‐case scenario analyses for missing data.
If the results did not change, they were considered to have low sensitivity. If the results changed, they were considered to have high sensitivity.
Reaching conclusions
We based our conclusions only on findings from the quantitative or narrative synthesis of included studies for this review. We avoided making recommendations for practice, and tried, in our implications for research, to give the reader a clear sense of where the focus of any future research in the area should be and what the remaining uncertainties were.
'Summary of findings' table
We created 'Summary of findings' tables for all considered outcomes. We used the five GRADE considerations (study limitations, consistency of effect, imprecision, indirectness, and publication bias) to assess the quality of a body of evidence based on the studies that contributed data to the meta‐analyses for the prespecified outcomes. We used the methods and recommendations described in Section 8.5 and Chapter 12 of the Cochrane Handbook for Systematic Reviews of Interventions (Higgins 2011), and used GRADEpro GDT software (GRADEpro GDT). We justified all decisions to downgrade or upgrade the quality of the evidence using footnotes, and made comments to aid the reader's understanding of the review, where necessary. We considered whether there was any additional outcome information that we were unable to incorporate into meta‐analyses, and noted this in the comments. We noted whether it supported or contradicted the information from the meta‐analyses for each outcome, including any subgroup analysis or sensitivity analysis.
Results
Description of studies
See 'Characteristics of included studies' and 'Characteristics of excluded studies' tables.
Results of the search
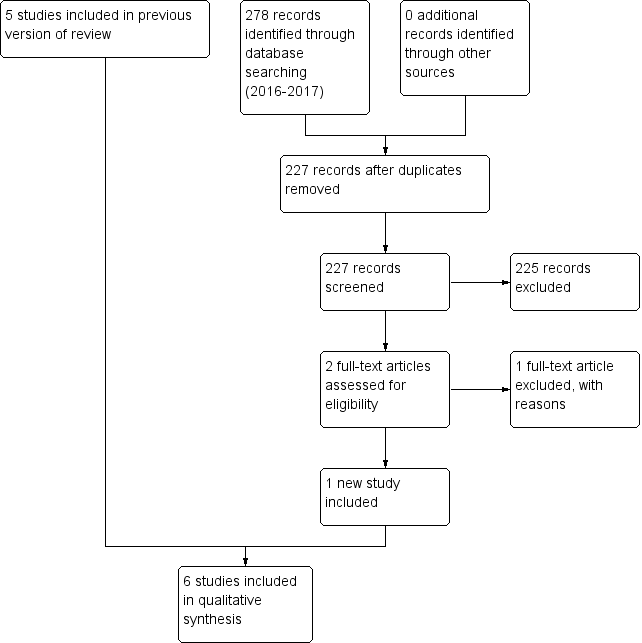
For this updated review, we identified 278 records through the electronic searches of CENTRAL (25 records), MEDLINE Ovid (74 records), Embase Ovid (88 records), Science Citation Index Expanded (Web of Science; 80 records), and Chinese Biomedical Literature Database (CBM; 11 records). We did not identify any records by scanning reference lists of the identified RCTs. We excluded 51 duplicates and 225 clearly irrelevant records through reading titles and abstracts. The remaining two records were retrieved for further assessment. We excluded one study for the reasons listed in the Characteristics of excluded studies table. In total, one RCT fulfilled the inclusion criteria for this update. We have shown the study flow diagram in Figure 1.

Study flow diagram: 2018 review update
Included studies
The last published version of this review included five studies, published between 2001 and 2016 (Bassi 2010; Conlon 2001; Jiang 2016; Van Buren 2014; Witzigmann 2016). We added one recently published study to this update (Van Buren 2017). Therefore, we included six studies (1384 participants), all of which provided data for the analyses. We listed details of the studies in the 'Characteristics of included studies' table.
Drain use versus no drain use
Four studies randomized 1110 participants who underwent elective pancreatic resections (604 pancreaticoduodenectomy, 439 distal pancreatectomy, and 67 other pancreatic surgery) to those who had drainage tubes inserted postoperatively (N = 560), and those who did not (N = 550). Three of these studies were conducted in the USA (Conlon 2001; Van Buren 2014; Van Buren 2017), and one in Germany (Witzigmann 2016). The mean age was 63.9 years. One or two drainage tubes were placed near the pancreatic anastomoses or pancreatic stumps. These studies measured mortality, morbidity, wound infection, intra‐abdominal infection, various postoperative complications, reoperation, additional radiological intervention, length of hospital stay, and quality of life (Conlon 2001; Van Buren 2014; Van Buren 2017; Witzigmann 2016).
One type of drain versus another
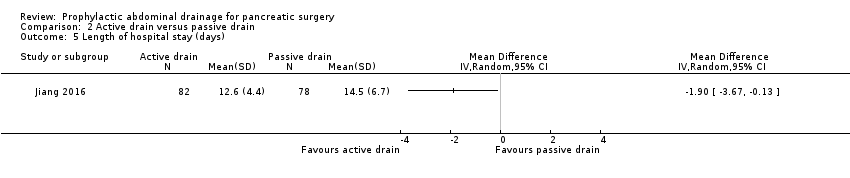
One study randomized 160 participants undergoing elective pancreaticoduodenectomy to the active drain group or the passive drain group (Jiang 2016). This trial was conducted in China. One drainage tube was placed near both the biliary and pancreatic anastomoses. The mean age was 59.6 years. The outcomes reported were mortality, morbidity, wound infection, intra‐abdominal infection, various postoperative complications, reoperation, operation time, and length of hospital stay.
Early versus late drain removal
One study randomized 114 participants with low risk of postoperative pancreatic fistula undergoing elective pancreatic resections (75 pancreaticoduodenectomy and 39 distal pancreatectomy) to the early drain removal group or the late drain removal group (Bassi 2010). This trial was conducted in Italy. Two drainage tubes were placed near both the biliary and pancreatic anastomoses. One drainage tube was placed near the pancreatic stump after distal pancreatectomy. The mean age was 56.6 years. The outcomes reported were pancreatic fistula, abdominal complications, pulmonary complications, reoperation, length of hospital stay, hospital readmission, postoperative mortality, morbidity, and hospital costs.
Excluded studies
We excluded 12 studies. We listed the details in the 'Characteristics of excluded studies' table. One trial was excluded because it focused on pancreatic duct drainage (Lee 2009); the rest were not RCTs.
Ongoing studies
We found one ongoing study (Čečka 2015). Two hundred and twenty‐three participants undergoing pancreatic resection will be randomized to closed suction drain or closed gravity drain. This trial is currently recruiting participants. It is being performed in Czech Republic, and was initiated in October 2013. The primary outcome is the rate of postoperative pancreatic fistula. The secondary outcomes are postoperative morbidity, including wound infection, intra‐abdominal collections, delayed gastric emptying, postoperative hemorrhage, pneumonia, abdominal rupture, cardiac events, and neurological complications.
Risk of bias in included studies
Figure 2 and Figure 3 show the risk of bias of the included studies. All six studies were at high risk of bias (Bassi 2010; Conlon 2001; Jiang 2016; Van Buren 2014; Van Buren 2017; Witzigmann 2016).

Risk of bias graph: review authors' judgements about each risk of bias item presented as percentages across all included studies
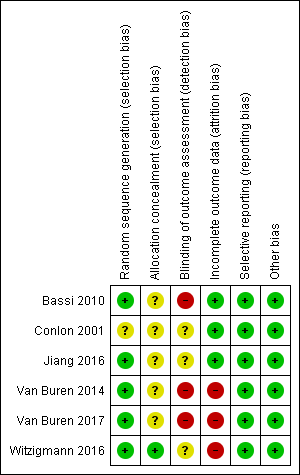
Risk of bias summary: review authors' judgements about each risk of bias item for each included study
Allocation
Random sequence generation was at low risk of bias in five studies (Bassi 2010; Jiang 2016; Van Buren 2014; Van Buren 2017; Witzigmann 2016). Allocation concealment was at low risk of bias in one trial (Witzigmann 2016).
Blinding
Blinding of outcome assessment was at high risk of bias in three studies (Bassi 2010; Van Buren 2014; Van Buren 2017).
Incomplete outcome data
There were some dropouts in three studies, but the data were not analyzed on an intention‐to‐treat basis, therefore, we assessed these three studies at high risk of bias regarding incomplete outcome data (Van Buren 2014; Van Buren 2017; Witzigmann 2016).
Selective reporting
Selective reporting was at low risk of bias in all six studies (Bassi 2010; Conlon 2001; Jiang 2016; Van Buren 2014; Van Buren 2017; Witzigmann 2016).
Other potential sources of bias
Baseline imbalance was at low risk of bias in all six studies.
Effects of interventions
See: Summary of findings for the main comparison Drain use versus no drain use for pancreatic surgery; Summary of findings 2 Active drain versus passive drain for pancreatic surgery; Summary of findings 3 Early versus late drain removal for pancreatic surgery
See: summary of findings Table for the main comparison, summary of findings Table 2, summary of findings Table 3.
Drain use versus no drain use
Four studies (1110 participants) compared drain use with no drain use (Conlon 2001; Van Buren 2014; Van Buren 2017; Witzigmann 2016). Five hundred and sixty participants were randomized to the drainage group, and 550 participants to the no drainage group. See: summary of findings Table for the main comparison.
Mortality (30 days)
The 30‐day mortality was 1.5% (8/532) in the drainage group, and 2.3% (12/523) in the no drainage group. The estimated risk ratio (RR) for 30‐day mortality was 0.78 (95% confidence interval (CI) 0.31 to 1.99; four studies, 1055 participants; Analysis 1.1). We downgraded the quality of evidence from high to moderate due to serious imprecision.
Mortality (90 days)
The 90‐day mortality was 0.8% (2/242) in the drainage group, and 4.2% (10/236) in the no drainage group. The estimated RR for 90‐day mortality was 0.23 (95% CI 0.06 to 0.90; two studies, 478 participants; Analysis 1.2). We downgraded the quality of evidence from high to moderate due to serious imprecision.
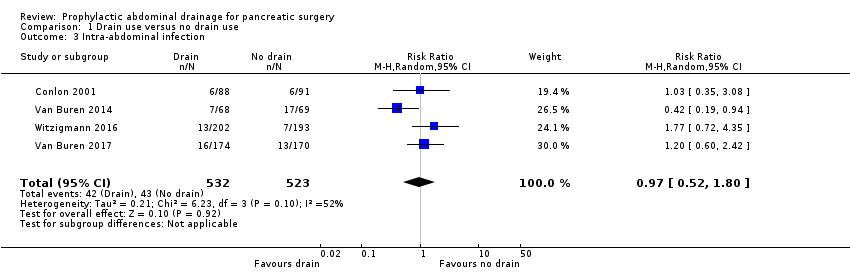
Intra‐abdominal infection
The intra‐abdominal infection rate was 7.9% (42/532) in the drainage group, and 8.2% (43/523) in the no drainage group. The estimated RR for intra‐abdominal infection rate was 0.97 (95% CI 0.52 to 1.80; four studies, 1055 participants; Analysis 1.3). We downgraded the quality of evidence from high to very low due to high risk of bias, serious imprecision, and inconsistency in the direction and magnitude of effects across the studies (I² = 52%).
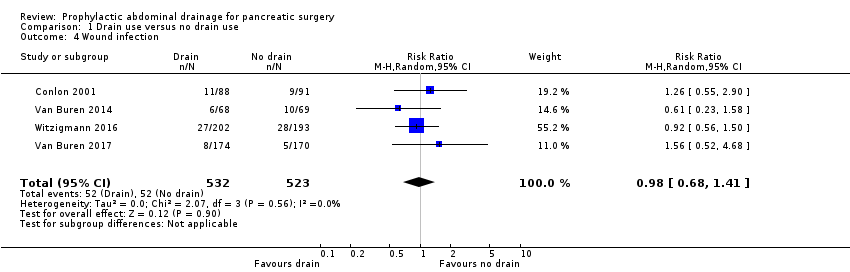
Wound infection
The wound infection rate was 9.8% (52/532) in the drainage group and 9.9% (52/523) in the no drainage group. The estimated RR for wound infection rate was 0.98 (95% CI 0.68 to 1.41; four studies, 1055 participants; Analysis 1.4). We downgraded the quality of evidence from high to low due to high risk of bias and serious imprecision.
Drain‐related complications
One trial (179 participants) reported this outcome (Conlon 2001). There was one drain‐related complication (broken drain) in the drainage group. We downgraded the quality of evidence from high to low due to high risk of bias and serious imprecision.
Morbidity
The morbidity was 61.7% (328/532) in the drainage group and 59.7% (312/523) in the no drainage group. The estimated RR for morbidity was 1.03 (95% CI 0.94 to 1.13; four studies, 1055 participants; Analysis 1.5). We downgraded the quality of evidence from high to moderate due to high risk of bias.
Length of hospital stay
The estimated mean difference (MD) for length of hospital stay was ‐0.66 days (95% CI ‐1.60 to 0.29; three studies, 711 participants; Analysis 1.6). We downgraded the quality of evidence from high to moderate due to high risk of bias.
Hospital costs
None of the studies reported this outcome.
Additional open procedures for postoperative complications
A total of 87 participants needed additional open procedures for postoperative complications. The rate of additional open procedures for postoperative complications was 9.4% (50/532) in the drainage group and 7.1% (37/523) in the no drainage group. The estimated RR for the need of additional open procedures was 1.33 (95% CI 0.79 to 2.23; four studies, 1055 participants; Analysis 1.7). We downgraded the quality of evidence from high to low due to high risk of bias and serious imprecision.
Additional radiological interventions for postoperative complications
A total of 75 participants needed additional radiological interventions for postoperative complications. The rate of additional radiological interventions for postoperative complications was 10.9% (36/330) in the drainage group and 12.1% (40/330) in the no drainage group. The estimated RR for the need of additional radiological interventions was 0.87 (95% CI 0.40 to 1.87; three studies, 660 participants; Analysis 1.8). We downgraded the quality of evidence from high to very low due to high risk of bias, serious imprecision, and inconsistency in the direction and magnitude of effects across the studies (I² = 64%).
Pain
None of the studies reported on pain.
Quality of life
Van Buren 2017 used the pancreas‐specific quality of life questionnaire (FACT‐PA) to assess quality of life. The FACT‐PA is a scale of 0 to 144, with higher values indicating better quality of life. The mean quality of life score at 30 days after pancreatic surgery was 105 points in the drainage and 104 points in the no drainage group. The study reported the standard deviation of the quality of life score. We downgraded the quality of evidence from high to low due to high risk of bias and serious imprecision.
Active drain versus passive drain
One trial (160 participants) compared active drain versus passive drain (Jiang 2016). Eighty‐two participants were randomized to the active drain group and 78 participants to the passive drain group. See: summary of findings Table 2.
Mortality (30 days)
The 30‐day mortality was 1.2% (1/82) in the active drain group and 0% (0/78) in the passive drain group. We downgraded the quality of evidence from high to very low due to high risk of bias and very serious imprecision.
Mortality (90 days)
The trial did not report this outcome.
Intra‐abdominal infection
The intra‐abdominal infection rate was 0% (0/82) in the active drain group and 2.6% (2/78) in the passive drain group. We downgraded the quality of evidence from high to very low due to high risk of bias and very serious imprecision.
Wound infection
The wound infection rate was 6.1% (5/82) in the active drain group and 9.0% (7/78) in the passive drain group. The estimated RR for wound infection rate was 0.68 (95% CI 0.23 to 2.05; one study, 160 participants; Analysis 2.3). We downgraded the quality of evidence from high to very low due to high risk of bias and very serious imprecision.
Drain‐related complications
The trial did not report this outcome.
Morbidity
The morbidity was 22.0% (18/82) in the active drain group and 32.1% (25/78) in the passive drain group. The estimated RR for morbidity was 0.68 (95% CI 0.41 to 1.15; one study, 160 participants; Analysis 2.4). We downgraded the quality of evidence from high to low due to high risk of bias and serious imprecision.
Length of hospital stay
The estimated MD for length of hospital stay was ‐1.90 days less (14.1% decrease of an 'average' length of hospital stay) in the active drain removal group (95% CI ‐3.67 to ‐0.13; one study, 160 participants; Analysis 2.5). We downgraded the quality of evidence from high to low due to high risk of bias and serious imprecision.
Hospital costs
The trial did not report this outcome.
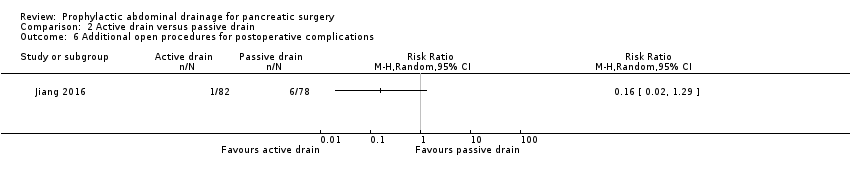
Additional open procedures for postoperative complications
Seven participants needed additional open procedures for postoperative complications. The rate of additional open procedures for postoperative complications was 1.2% (1/82) in the active drain group and 7.7% (6/78) in the passive drain group. The estimated RR for the need of additional open procedures was 0.16 (95% CI 0.02 to 1.29; one study, 160 participants; Analysis 2.6). We downgraded the quality of evidence from high to very low due to high risk of bias and very serious imprecision.
Additional radiological interventions for postoperative complications
The trial did not report this outcome.
Pain
The trial did not report this outcome.
Quality of life
The trial did not report this outcome.
Early versus late drain removal
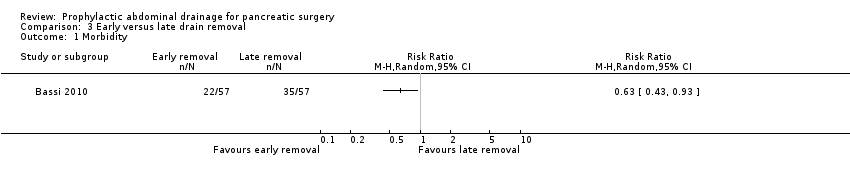
One study (114 participants with low risk of postoperative pancreatic fistula) compared early versus late drain removal (Bassi 2010). Fifty‐seven participants were randomized to the early drain removal group and 57 participants to the late drain removal group. See: summary of findings Table 3.
Mortality (30 days)
There was no mortality reported in either group.
Mortality (90 days)
The study did not report this outcome.
Intra‐abdominal infection
The study did not report this outcome
Wound infection
The study did not report this outcome
Drain‐related complications
The study did not report this outcome.
Morbidity
The morbidity was 38.6% (22/57) in the early drain removal group and 61.4% (35/57) in the late drain removal group. The estimated RR for morbidity was 0.63 (95% CI 0.43 to 0.93; one study, 114 participants; Analysis 3.1). We downgraded the quality of evidence from high to low due to high risk of bias and serious imprecision.
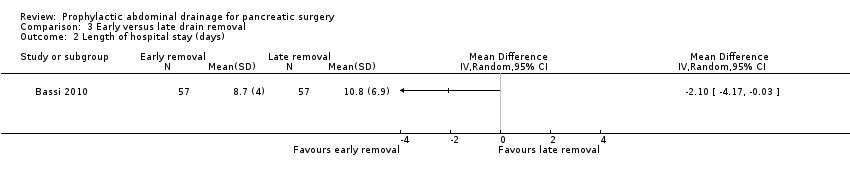
Length of hospital stay
The estimated MD for length of hospital stay was 2.10 days less (21.5% decrease of an 'average' length of hospital stay) in the early drain removal group (95% CI ‐4.17 to ‐0.03; one study, 114 participants; Analysis 3.2). We downgraded the quality of evidence from high to low due to high risk of bias and serious imprecision.
Hospital costs
The estimated MD for total hospital costs was EUR 2069.00 less (17.0% decrease of 'average' hospital costs) in the early drain removal group (95% CI ‐3872.26 to ‐265.74; one study, 114 participants; Analysis 3.3). We downgraded the quality of evidence from high to low due to high risk of bias and serious imprecision.
Additional open procedures for postoperative complications
One participant needed an additional open procedure for postoperative complications. The rate of additional open procedures for postoperative complications was 0% (0/57) in the early drain removal group and 1.8% (1/57) in the late drain removal group. The estimated RR for the need of additional open procedures was 0.33 (95% CI 0.01 to 8.01; one study, 160 participants; Analysis 3.4). We downgraded the quality of evidence from high to very low due to high risk of bias and very serious imprecision.
Additional radiological interventions for postoperative complications
The trial did not report this outcome.
Pain
The trial did not report this outcome.
Quality of life
The trial did not report this outcome.
Subgroup analysis
We did not perform any of the planned subgroup analyses because this review included only five studies.
Sensitivity analysis
We performed the following planned sensitivity analyses:
-
changed between a fixed‐effect model and a random‐effects model;
-
changed statistics among RR, RD, and OR for dichotomous outcomes;
-
changed statistics between MD and SMD for continuous outcomes;
-
changed between worst‐case and best‐case scenario analyses for missing data.
We observed no change in the results by changing between a fixed‐effect and a random‐effects model, calculating the RD and OR for dichotomous outcomes, or calculating the SMD for continuous outcomes. There were 101 postrandomization dropouts in three studies (Van Buren 2014; Van Buren 2017; Witzigmann 2016). We observed no change in the results by changing between worst‐case and best‐case scenario analyses for missing data, except for the outcome 'mortality ((90 days)'; Analysis 4.1; Analysis 4.2).
Discussion
Summary of main results
Evidence from six studies with 1384 people undergoing pancreatic surgery contributed data to the outcomes of interest for this review. For the comparison of drain use versus no drain use (four studies, 1110 participants), we found that there was probably little or no difference in mortality at 30 days or in postoperative complications between groups. Although drain use probably slightly reduced mortality at 90 days, it may have led to drain‐related complications.
One trial (160 participants) compared the use of an active drain versus a passive drain. We found that an active drain was associated with earlier discharge from hospital.
Data comparing early versus late drain removal were available from one trial (114 participants). We found that they favored early drain removal for people with low risk of postoperative pancreatic fistula.
Overall completeness and applicability of evidence
All of the studies included people undergoing elective pancreaticoduodenectomy (N = 839, 60.6%), distal pancreatectomy (N = 478, 34.6%), and other pancreatic surgery (N = 67, 4.8%) for various pancreatic and extra‐pancreatic diseases, including pancreatic cancers, ampullary cancers, chronic pancreatitis, biliary and duodenal malignancy. The majority (58.1%) of the participants had either pancreatic cancers (46.8%) or chronic pancreatitis (11.3%). Only two of the studies included 163 participants (11.8%) who underwent laparoscopic pancreatic resections, therefore, the results of this review are not applicable to people undergoing laparoscopic pancreatic resections, and the role of abdominal drainage after laparoscopic pancreatic resections requires further assessment. Therefore, the results of this review are only applicable to people undergoing elective open pancreaticoduodenectomy, distal pancreatectomy, and other pancreatic surgery for various pancreatic and extra‐pancreatic diseases, especially for pancreatic cancers or chronic pancreatitis.
Quality of the evidence
None of the studies were at low risk of bias. There were too few studies included under each comparison to assess inconsistency and publication bias. There was no indirectness of evidence because the studies did not perform the indirect comparison of one type of drain versus another. The confidence intervals of the majority of outcomes were wide, indicating that the estimates of effect obtained were imprecise. Overall, the quality of the evidence was considered to be very low to moderate (summary of findings Table for the main comparison; summary of findings Table 2; summary of findings Table 3).
Potential biases in the review process
There were some unavoidable potential biases of note in the review process. First, when we contacted some investigators to request further information, we did not get a reply. The missing data may introduce bias to this review. Additionally, we were unable to explore publication bias because we did not have access to protocols for two studies (Conlon 2001; Jiang 2016), and the studies included in each comparison were too few.
Agreements and disagreements with other studies or reviews
There is increasing evidence in Cochrane Reviews that routine abdominal drainage after various abdominal operations is not mandatory (Cheng 2015; Rolph 2004; Gurusamy 2007a; Gurusamy 2007b; Gurusamy 2013b; Wang 2015). The routine use of surgical drains has also been questioned in other areas, including thyroid, gynaecological, and orthopaedic surgeries (Charoenkwan 2017; Gates 2013; Parker 2007; Samraj 2007).
The routine use of drains has been considered surgical dogma after a pancreatic resection. Jeekel and coworkers first challenged the dogma in the 1990s (Jeekel 1992). They reported a cohort in which 22 people underwent pancreaticoduodenectomy without undue complications after abandoning abdominal drainage. They concluded that abdominal drainage after pancreaticoduodenectomy may be omitted. Since then, several non‐randomized studies (Adham 2013; Correa‐Gallego 2013; Fisher 2011; Giovinazzo 2011; Heslin 1998; Kawai 2006; Lim 2013; Mehta 2013; Paulus 2012), and one RCT (Conlon 2001), have tested drain use versus no drain use after pancreatic resections. All of the studies found a similar or higher complication rate in the drainage group over the no drainage group. In addition, the routine use of surgical drains was associated with an increased length of hospital stay (Fisher 2011; Mehta 2013; Paulus 2012). Some authors suggested that routine prophylactic drainage after pancreatic resections could be safely abandoned (Adham 2013; Correa‐Gallego 2013; Mehta 2013). Twenty‐two years after the first reports of a 'no drain' policy and 13 years after the first RCT (Conlon 2001), Van Buren and coworkers conducted an RCT that compared drain use versus no drain use after pancreatic resections (Van Buren 2014). They found that pancreaticoduodenectomy without drain use was associated with an increased rate and severity of complications. They questioned the safety of not routinely placing drains in all participants after pancreaticoduodenectomy. In contrast, Witzigmann and colleagues performed another RCT on this topic (Witzigmann 2016). They found that pancreatic resection without drain use was superior to drain use in terms of clinically relevant pancreatic fistula and fistula‐associated complications. They suggested that there was no need for routine prophylactic drainage after pancreatic resection. Recently, Van Buren and coworkers conducted another RCT that compared drain use and no drain use after pancreatic resections (Van Buren 2017). They found that distal pancreatectomy without drain use had mortality and postoperative complications similar to the procedure with drain use.
One systematic review that compared drain use with no drain use in people undergoing pancreatic resections concluded that the routine use of abdominal drains after pancreatic resection may result in a higher risk for major complications (Van der Wilt 2013). They included three studies that we had considered for this review (Conlon 2001; Fisher 2011; Heslin 1998). Two of these studies were non‐randomized, so were not included in this review. Another recent systematic review also compared drain use with no drain use after pancreatic resections (Hüttner 2017). The review included a total of three randomized controlled studies (Conlon 2001; Van Buren 2014; Witzigmann 2016). The authors of the systematic review concluded that drain use and no drain had similar results in mortality, morbidity and re‐intervention. Our review did not make any specific recommendation because the quality of the current evidence about drain use after pancreatic surgery is low.
Another systematic review compared early drain removal with late drain removal in people undergoing pancreatic resection (Diener 2011), and included two studies that we had considered for this review (Bassi 2010; Kawai 2006). One of the studies was not randomized, so we did not include it (Kawai 2006). The authors of the systematic review concluded that early drain removal seemed to be superior to late drain removal (Diener 2011). Our results concluded that early drain removal seemed to be superior to late drain removal for people with low risk of postoperative pancreatic fistula.
Study flow diagram: 2018 review update

Risk of bias graph: review authors' judgements about each risk of bias item presented as percentages across all included studies

Risk of bias summary: review authors' judgements about each risk of bias item for each included study

Comparison 1 Drain use versus no drain use, Outcome 1 Mortality (30 days).

Comparison 1 Drain use versus no drain use, Outcome 2 Mortality (90 days).
Comparison 1 Drain use versus no drain use, Outcome 3 Intra‐abdominal infection.
Comparison 1 Drain use versus no drain use, Outcome 4 Wound infection.
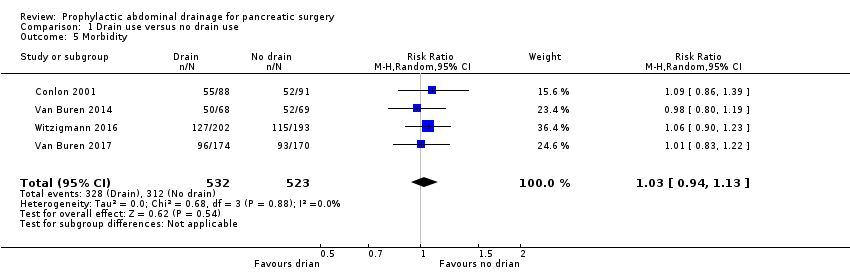
Comparison 1 Drain use versus no drain use, Outcome 5 Morbidity.

Comparison 1 Drain use versus no drain use, Outcome 6 Length of hospital stay (days).
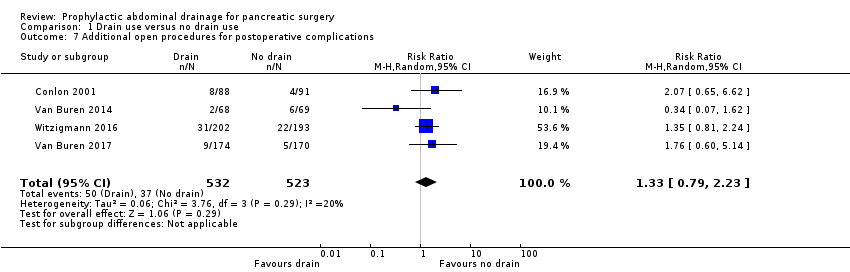
Comparison 1 Drain use versus no drain use, Outcome 7 Additional open procedures for postoperative complications.

Comparison 1 Drain use versus no drain use, Outcome 8 Additional radiological interventions for postoperative complications.
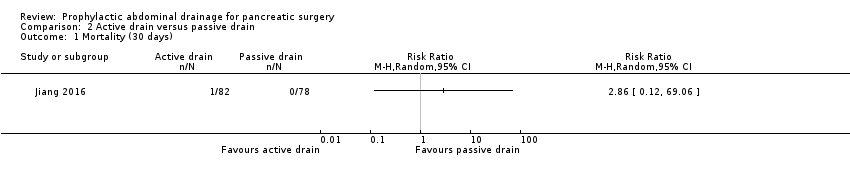
Comparison 2 Active drain versus passive drain, Outcome 1 Mortality (30 days).
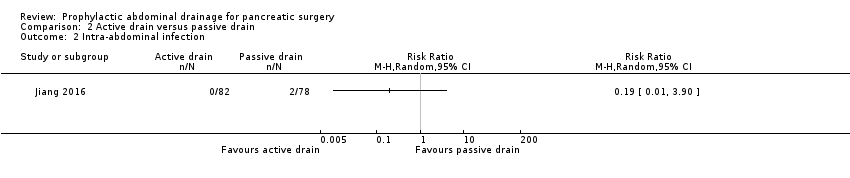
Comparison 2 Active drain versus passive drain, Outcome 2 Intra‐abdominal infection.

Comparison 2 Active drain versus passive drain, Outcome 3 Wound infection.

Comparison 2 Active drain versus passive drain, Outcome 4 Morbidity.
Comparison 2 Active drain versus passive drain, Outcome 5 Length of hospital stay (days).
Comparison 2 Active drain versus passive drain, Outcome 6 Additional open procedures for postoperative complications.
Comparison 3 Early versus late drain removal, Outcome 1 Morbidity.
Comparison 3 Early versus late drain removal, Outcome 2 Length of hospital stay (days).

Comparison 3 Early versus late drain removal, Outcome 3 Hospital costs (EUR).

Comparison 3 Early versus late drain removal, Outcome 4 Additional open procedures for postoperative complications.

Comparison 4 Drain use versus no drain use sensitivity analysis for missing data, Outcome 1 Mortality (90 days) ‐ worst‐case scenario.
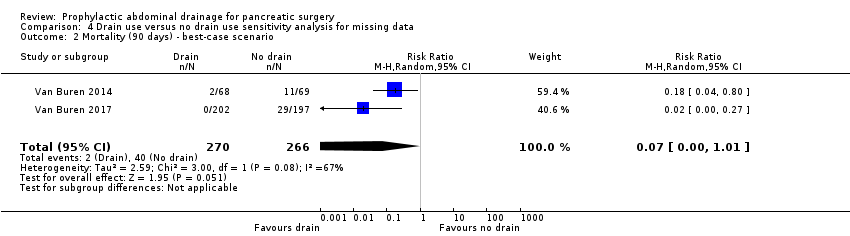
Comparison 4 Drain use versus no drain use sensitivity analysis for missing data, Outcome 2 Mortality (90 days) ‐ best‐case scenario.
| Drain use versus no drain use for pancreatic surgery | ||||||
| Patient or population: people undergoing elective open pancreatic resections | ||||||
| Outcomes | Anticipated absolute effects* (95% CI) | Relative effect | No of participants | Certainty of the evidence | Comments | |
| Risk with no drain use | Risk with drain use | |||||
| Mortality Follow‐up: 30 days | 23 per 1000 | 18 per 1000 (7 to 46) | RR 0.78 | 1055 | ⊕⊕⊕⊝ | |
| Mortality Follow‐up: 90 days | 42 per 1000 | 10 per 1000 (3 to 38) | RR 0.23 | 478 | ⊕⊕⊕⊝ | |
| Intra‐abdominal infection Follow‐up: 30 days | 82 per 1000 | 80 per 1000 (43 to 148) | RR 0.97 | 1055 | ⊕⊝⊝⊝ | |
| Wound infection Follow‐up: 30 days | 99 per 1000 | 97 per 1000 (68 to 140) | RR 0.98 | 1055 | ⊕⊕⊝⊝ | |
| Drain‐related complications Follow‐up: 30 days | See comment | See comment | Not estimable | 179 | ⊕⊕⊝⊝ | There was 1 drain‐related complication in the drainage group. The drainage tube was broken. |
| Morbidity Follow‐up: 30 days | 597 per 1000 | 614 per 1000 (561 to 674) | RR 1.03 | 1055 | ⊕⊕⊕⊝ | |
| Length of hospital stay Follow‐up: 30 days | The mean length of hospital stay in the no drain groups was 13.8 days | The mean length of hospital stay in the drain groups was | MD ‐0.66 (‐1.60 to 0.29) | 711 | ⊕⊕⊕⊝ | |
| Hospital costs Follow‐up: 30 days | Not reported | |||||
| Additional open procedures for postoperative complications Follow‐up: 30 days | 71 per 1000 | 94 per 1000 (56 to 158) | RR 1.33 | 1055 | ⊕⊕⊝⊝ | |
| Additional radiological interventions for postoperative complications Follow‐up: 30 days | 121 per 1000 | 105 per 1000 (48 to 227) | RR 0.87 | 660 | ⊕⊝⊝⊝ | |
| Pain Follow‐up: 30 days | Not reported | |||||
| Quality of life Follow‐up: 30 days FACT‐PA questionnaire: scale 0 to 144, where higher values indicate better quality of life | The mean quality of life score in the no drain group was 104 points | The mean quality of life score in the drain groups was | Not estimable (see comment) | 399 | ⊕⊕⊝⊝ | The study reported the mean quality of life score, without mentioning the standard deviation. |
| * The basis for the assumed risk was the control group proportion in the study. The risk in the intervention group (and its 95% confidence interval) is based on the assumed risk in the control group and the relative effect of the intervention (and its 95% CI). CI: Confidence interval; RR: Risk ratio; MD: mean difference. | ||||||
| GRADE Working Group grades of evidence | ||||||
| 1 Downgraded one level for serious imprecision (very few events, confidence interval of risk ratio overlapped 0.75 and 1.25). | ||||||
| Active drain versus passive drain for pancreatic surgery | ||||||
| Patient or population: people undergoing elective open pancreatic resections | ||||||
| Outcomes | Anticipated absolute effects* (95% CI) | Relative effect | No of participants | Quality of the evidence | Comments | |
| Risk with passive drain | Risk with active drain | |||||
| Mortality Follow‐up: 30 days | 1 per 1000 | 3 per 1000 (0 to 69) | RR 2.86 | 160 | ⊕⊕⊝⊝ | There were no events in the control arm. A risk of "1 per 1000" was chosen for illustration. RR was calculated using a correction factor and should be interpreted with caution. |
| Mortality Follow‐up: 90 days | Not reported | |||||
| Intra‐abdominal infection Follow‐up: 30 days | 26 per 1000 | 5 per 1000 (0 to 100) | RR 0.19 | 160 | ⊕⊝⊝⊝ | |
| Wound infection Follow‐up: 30 days | 90 per 1000 | 61 per 1000 (21 to 184) | RR 0.68 | 160 | ⊕⊝⊝⊝ | |
| Drain‐related complications Follow‐up: 30 days | Not reported | |||||
| Morbidity Follow‐up: 30 days | 321 per 1000 | 218 per 1000 (131 to 369) | RR 0.68 | 160 | ⊕⊕⊝⊝ | |
| Length of hospital stay Follow‐up: 30 days | The mean length of hospital stay in the passive drain group was 14.5 days | The mean length of hospital stay in the active drain group was | MD ‐1.90 (‐3.67 to ‐0.13) | 160 | ⊕⊕⊝⊝ | |
| Hospital costs Follow‐up: 30 days | Not reported | |||||
| Additional open procedures for postoperative complications Follow‐up: 30 days | 77 per 1000 | 12 per 1000 (2 to 99) | RR 0.16 | 160 | ⊕⊝⊝⊝ | |
| Additional radiological interventions for postoperative complications Follow‐up: 30 days | Not reported | |||||
| Pain Follow‐up: 30 days | Not reported | |||||
| Quality of life Follow‐up: 30 days | Not reported | |||||
| * The basis for the assumed risk was the control group proportion in the study. The risk in the intervention group (and its 95% confidence interval) is based on the assumed risk in the control group and the relative effect of the intervention (and its 95% CI). | ||||||
| GRADE Working Group grades of evidence | ||||||
| 1 Downgraded two levels for very serious imprecision (small sample sizes, very few events, confidence intervals of risk ratios overlapped 0.75 and 1.25). | ||||||
| Early versus late drain removal for pancreatic surgery | ||||||
| Patient or population: people undergoing elective open pancreatic resections Setting: hospital | ||||||
| Outcomes | Anticipated absolute effects* (95% CI) | Relative effect | No of participants | Quality of the evidence | Comments | |
| Risk with late drain removal | Risk with early drain removal | |||||
| Mortality Follow‐up: 30 days | There was no mortality in either group. | 114 | ⊕⊕⊕⊝ | |||
| Mortality Follow‐up: 90 days | Not reported | |||||
| Intra‐abdominal infection Follow‐up: 30 days | Not reported | |||||
| Wound infection Follow‐up: 30 days | Not reported | |||||
| Drain‐related complications Follow‐up: 30 days | Not reported | |||||
| Morbidity Follow‐up: 30 days | 614 per 1000 | 387 per 1000 (264 to 571) | RR 0.63 | 114 | ⊕⊕⊝⊝ | |
| Length of hospital stay Follow‐up: 30 days | The mean length of hospital stay in the late removal group was 10.8 days | The mean length of hospital stay in the early removal group was | MD ‐2.10 (‐4.17 to ‐0.03) | 114 | ⊕⊕⊝⊝ | |
| Hospital costs Follow‐up: 30 days | The mean hospital costs in the late removal group was EUR 12140.00 | The mean hospital costs in the early removal group was EUR 2069 lower | MD ‐2069.00 (‐3872.26 to ‐265.74) | 114 | ⊕⊕⊝⊝ | |
| Additional open procedures for postoperative complications Follow‐up: 30 days | 18 per 1000 | 6 per 1000 | RR 0.33 | 114 | ⊕⊝⊝⊝ | |
| Additional radiological interventions for postoperative complications Follow‐up: 30 days | Not reported | |||||
| Pain Follow‐up: 30 days | Not reported | |||||
| Quality of life Follow‐up: 30 days | Not reported | |||||
| * The basis for the assumed risk was the control group proportion in the study. The risk in the intervention group (and its 95% confidence interval) is based on the assumed risk in the control group and the relative effect of the intervention (and its 95% CI). | ||||||
| GRADE Working Group grades of evidence | ||||||
| 1 Publication bias could not be assessed because of the few number of studies. | ||||||
| Outcome or subgroup title | No. of studies | No. of participants | Statistical method | Effect size |
| 1 Mortality (30 days) Show forest plot | 3 | 711 | Risk Ratio (M‐H, Random, 95% CI) | 0.78 [0.31, 1.99] |
| 2 Mortality (90 days) Show forest plot | 2 | 478 | Risk Ratio (M‐H, Random, 95% CI) | 0.23 [0.06, 0.90] |
| 3 Intra‐abdominal infection Show forest plot | 4 | 1055 | Risk Ratio (M‐H, Random, 95% CI) | 0.97 [0.52, 1.80] |
| 4 Wound infection Show forest plot | 4 | 1055 | Risk Ratio (M‐H, Random, 95% CI) | 0.98 [0.68, 1.41] |
| 5 Morbidity Show forest plot | 4 | 1055 | Risk Ratio (M‐H, Random, 95% CI) | 1.03 [0.94, 1.13] |
| 6 Length of hospital stay (days) Show forest plot | 3 | 711 | Mean Difference (IV, Random, 95% CI) | ‐0.66 [‐1.60, 0.29] |
| 7 Additional open procedures for postoperative complications Show forest plot | 4 | 1055 | Risk Ratio (M‐H, Random, 95% CI) | 1.33 [0.79, 2.23] |
| 8 Additional radiological interventions for postoperative complications Show forest plot | 3 | 660 | Risk Ratio (M‐H, Random, 95% CI) | 0.87 [0.40, 1.87] |
| Outcome or subgroup title | No. of studies | No. of participants | Statistical method | Effect size |
| 1 Mortality (30 days) Show forest plot | 1 | Risk Ratio (M‐H, Random, 95% CI) | Totals not selected | |
| 2 Intra‐abdominal infection Show forest plot | 1 | Risk Ratio (M‐H, Random, 95% CI) | Totals not selected | |
| 3 Wound infection Show forest plot | 1 | Risk Ratio (M‐H, Random, 95% CI) | Totals not selected | |
| 4 Morbidity Show forest plot | 1 | Risk Ratio (M‐H, Random, 95% CI) | Totals not selected | |
| 5 Length of hospital stay (days) Show forest plot | 1 | Mean Difference (IV, Random, 95% CI) | Totals not selected | |
| 6 Additional open procedures for postoperative complications Show forest plot | 1 | Risk Ratio (M‐H, Random, 95% CI) | Totals not selected | |
| Outcome or subgroup title | No. of studies | No. of participants | Statistical method | Effect size |
| 1 Morbidity Show forest plot | 1 | Risk Ratio (M‐H, Random, 95% CI) | Totals not selected | |
| 2 Length of hospital stay (days) Show forest plot | 1 | Mean Difference (IV, Random, 95% CI) | Totals not selected | |
| 3 Hospital costs (EUR) Show forest plot | 1 | Mean Difference (IV, Random, 95% CI) | Totals not selected | |
| 4 Additional open procedures for postoperative complications Show forest plot | 1 | Risk Ratio (M‐H, Random, 95% CI) | Totals not selected | |
| Outcome or subgroup title | No. of studies | No. of participants | Statistical method | Effect size |
| 1 Mortality (90 days) ‐ worst‐case scenario Show forest plot | 2 | 536 | Risk Ratio (M‐H, Random, 95% CI) | 2.15 [0.05, 89.11] |
| 2 Mortality (90 days) ‐ best‐case scenario Show forest plot | 2 | 536 | Risk Ratio (M‐H, Random, 95% CI) | 0.07 [0.00, 1.01] |