| 1 Number of women cured Show forest plot | 1 | | Risk Ratio (M‐H, Fixed, 95% CI) | Totals not selected |
|
| 1.1 PFMT + clenbuterol vs clenbuterol | 1 | | Risk Ratio (M‐H, Fixed, 95% CI) | 0.0 [0.0, 0.0] |
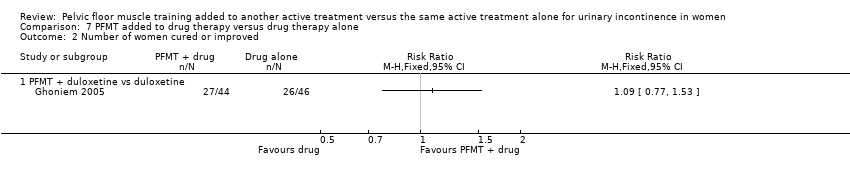
| 2 Number of women cured or improved Show forest plot | 1 | | Risk Ratio (M‐H, Fixed, 95% CI) | Totals not selected |
|
| 2.1 PFMT + duloxetine vs duloxetine | 1 | | Risk Ratio (M‐H, Fixed, 95% CI) | 0.0 [0.0, 0.0] |
| 3 Condition‐specific quality of life on I‐QoL questionnaire Show forest plot | 1 | | Mean Difference (IV, Fixed, 95% CI) | Totals not selected |
|
| 3.1 PFMT + duloxetine vs duloxetine | 1 | | Mean Difference (IV, Fixed, 95% CI) | 0.0 [0.0, 0.0] |
| 4 Number of women improved on patient global impression of improvement in first 3 months Show forest plot | 2 | | Risk Ratio (M‐H, Fixed, 95% CI) | Totals not selected |
|
| 4.1 PFMT + duloxetine vs duloxetine | 1 | | Risk Ratio (M‐H, Fixed, 95% CI) | 0.0 [0.0, 0.0] |
| 4.2 PFMT + oxybutynin vs oxybutynin | 1 | | Risk Ratio (M‐H, Fixed, 95% CI) | 0.0 [0.0, 0.0] |
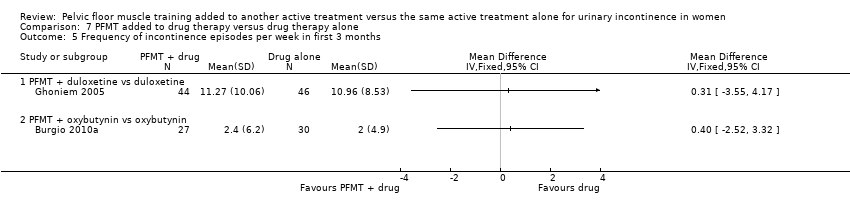
| 5 Frequency of incontinence episodes per week in first 3 months Show forest plot | 2 | | Mean Difference (IV, Fixed, 95% CI) | Totals not selected |
|
| 5.1 PFMT + duloxetine vs duloxetine | 1 | | Mean Difference (IV, Fixed, 95% CI) | 0.0 [0.0, 0.0] |
| 5.2 PFMT + oxybutynin vs oxybutynin | 1 | | Mean Difference (IV, Fixed, 95% CI) | 0.0 [0.0, 0.0] |
| 6 Frequency of incontinence episodes per week at 12 months Show forest plot | 1 | | Mean Difference (IV, Fixed, 95% CI) | Totals not selected |
|
| 6.1 PFMT + oxybutynin vs oxybutynin | 1 | | Mean Difference (IV, Fixed, 95% CI) | 0.0 [0.0, 0.0] |
| 7 Frequency of micturitions per 24 hours Show forest plot | 1 | | Mean Difference (IV, Fixed, 95% CI) | Totals not selected |
|
| 7.1 PFMT + oxybutynin vs oxybutynin | 1 | | Mean Difference (IV, Fixed, 95% CI) | 0.0 [0.0, 0.0] |
| 8 Volumes of urine per micturition Show forest plot | 1 | | Mean Difference (IV, Fixed, 95% CI) | Totals not selected |
|
| 8.1 PFMT + oxybutynin vs oxybutynin | 1 | | Mean Difference (IV, Fixed, 95% CI) | 0.0 [0.0, 0.0] |
| 9 Number of continence pads used per week Show forest plot | 1 | | Mean Difference (IV, Fixed, 95% CI) | Totals not selected |
|
| 9.1 PFMT + duloxetine vs duloxetine | 1 | | Mean Difference (IV, Fixed, 95% CI) | 0.0 [0.0, 0.0] |
| 10 Treatment adverse events Show forest plot | 1 | | Risk Ratio (M‐H, Fixed, 95% CI) | Totals not selected |
|
| 10.1 PFMT + solifenacin vs solifenacin | 1 | | Risk Ratio (M‐H, Fixed, 95% CI) | 0.0 [0.0, 0.0] |
| 11 Patient satisfaction with treatment outcome in first 3 months Show forest plot | 2 | | Risk Ratio (M‐H, Fixed, 95% CI) | Totals not selected |
|
| 11.1 PFMT + oxybutynin vs oxybutynin | 1 | | Risk Ratio (M‐H, Fixed, 95% CI) | 0.0 [0.0, 0.0] |
| 11.2 PFMT + clenbuterol vs clenbuterol | 1 | | Risk Ratio (M‐H, Fixed, 95% CI) | 0.0 [0.0, 0.0] |
| 12 Treatment benefit Show forest plot | 1 | | Risk Ratio (M‐H, Fixed, 95% CI) | Totals not selected |
|
| 12.1 PFMT + ?drug vs ?drug (drug name not reported) | 1 | | Risk Ratio (M‐H, Fixed, 95% CI) | 0.0 [0.0, 0.0] |