Beckenbodentraining in Kombination mit einer weiteren aktiven Behandlung im Vergleich zu der gleichen aktiven Behandlung alleine für Frauen mit Harninkontinenz
Abstract
Background
Pelvic floor muscle training (PFMT) is a first‐line conservative treatment for urinary incontinence in women. Other active treatments include: physical therapies (e.g. vaginal cones); behavioural therapies (e.g. bladder training); electrical or magnetic stimulation; mechanical devices (e.g. continence pessaries); drug therapies (e.g. anticholinergics (solifenacin, oxybutynin, etc.) and duloxetine); and surgical interventions including sling procedures and colposuspension. This systematic review evaluated the effects of adding PFMT to any other active treatment for urinary incontinence in women
Objectives
To compare the effects of pelvic floor muscle training combined with another active treatment versus the same active treatment alone in the management of women with urinary incontinence.
Search methods
We searched the Cochrane Incontinence Group Specialised Register, which contains trials identified from the Cochrane Central Register of Controlled Trials (CENTRAL), MEDLINE, MEDLINE in process, ClinicalTrials.gov, WHO ICTRP and handsearching of journals and conference proceedings (searched 5 May 2015), and CINAHL (January 1982 to 6 May 2015), and the reference lists of relevant articles.
Selection criteria
We included randomised or quasi‐randomised trials with two or more arms, of women with clinical or urodynamic evidence of stress urinary incontinence, urgency urinary incontinence or mixed urinary incontinence. One arm of the trial included PFMT added to another active treatment; the other arm included the same active treatment alone.
Data collection and analysis
Two review authors independently assessed trials for eligibility and methodological quality and resolved any disagreement by discussion or consultation with a third party. We extracted and processed data in accordance with the Cochrane Handbook for Systematic Reviews of Interventions. Other potential sources of bias we incorporated into the 'Risk of bias' tables were ethical approval, conflict of interest and funding source.
Main results
Thirteen trials met the inclusion criteria, comprising women with stress urinary incontinence (SUI), urgency urinary incontinence (UUI) or mixed urinary incontinence (MUI); they compared PFMT added to another active treatment (585 women) with the same active treatment alone (579 women). The pre‐specified comparisons were reported by single trials, except bladder training, which was reported by two trials, and electrical stimulation, which was reported by three trials. However, only two of the three trials reporting electrical stimulation could be pooled, as one of the trials did not report any relevant data. We considered the included trials to be at unclear risk of bias for most of the domains, predominantly due to the lack of adequate information in a number of trials. This affected our rating of the quality of evidence.
The majority of the trials did not report the primary outcomes specified in the review (cure or improvement, quality of life) or measured the outcomes in different ways. Effect estimates from small, single trials across a number of comparisons were indeterminate for key outcomes relating to symptoms, and we rated the quality of evidence, using the GRADE approach, as either low or very low. More women reported cure or improvement of incontinence in two trials comparing PFMT added to electrical stimulation to electrical stimulation alone, in women with SUI, but this was not statistically significant (9/26 (35%) versus 5/30 (17%); risk ratio (RR) 2.06, 95% confidence interval (CI) 0.79 to 5.38). We judged the quality of the evidence to be very low. There was moderate‐quality evidence from a single trial investigating women with SUI, UUI or MUI that a higher proportion of women who received a combination of PFMT and heat and steam generating sheet reported a cure compared to those who received the sheet alone: 19/37 (51%) versus 8/37 (22%) with a RR of 2.38, 95% CI 1.19 to 4.73). More women reported cure or improvement of incontinence in another trial comparing PFMT added to vaginal cones to vaginal cones alone, but this was not statistically significant (14/15 (93%) versus 14/19 (75%); RR 1.27, 95% CI 0.94 to 1.71). We judged the quality of the evidence to be very low. Only one trial evaluating PFMT when added to drug therapy provided information about adverse events (RR 0.84, 95% CI 0.45 to 1.60; very low‐quality evidence).
With regard to condition‐specific quality of life, there were no statistically significant differences between women (with SUI, UUI or MUI) who received PFMT added to bladder training and those who received bladder training alone at three months after treatment, on either the Incontinence Impact Questionnaire‐Revised scale (mean difference (MD) ‐5.90, 95% CI ‐35.53 to 23.73) or on the Urogenital Distress Inventory scale (MD ‐18.90, 95% CI ‐37.92 to 0.12). A similar pattern of results was observed between women with SUI who received PFMT plus either a continence pessary or duloxetine and those who received the continence pessary or duloxetine alone. In all these comparisons, the quality of the evidence for the reported critical outcomes ranged from moderate to very low.
Authors' conclusions
This systematic review found insufficient evidence to state whether or not there were additional effects by adding PFMT to other active treatments when compared with the same active treatment alone for urinary incontinence (SUI, UUI or MUI) in women. These results should be interpreted with caution as most of the comparisons were investigated in small, single trials. None of the trials in this review were large enough to provide reliable evidence. Also, none of the included trials reported data on adverse events associated with the PFMT regimen, thereby making it very difficult to evaluate the safety of PFMT.
PICO
Laienverständliche Zusammenfassung
Beckenbodentraining in Kombination mit einer weiteren aktiven Behandlung im Vergleich zu der gleichen aktiven Behandlung alleine für Frauen mit Harninkontinenz
Hintergrund
Frauen in allen Altersklassen sind von unfreiwilligem Harnabgang (Harninkontinenz) betroffen, vor allem aber ältere Frauen in Heimen, wie beispielsweise Pflegeeinrichtungen. Bei einigen Frauen tritt ein ungewollter Verlust von Urin während einer körperlichen Aktivität oder beim Husten oder Niesen auf (Belastungsinkontinenz). Die Ursache dafür könnte eine Schwäche der Beckenbodenmuskulatur sein, ausgelöst beispielsweise durch Faktoren wie eine Schädigung bei einer Geburt. Andere Frauen spüren ein plötzliches dringendes Bedürfnis, Urin lassen zu müssen, und schaffen es nicht rechtzeitig zur Toilette (Dranginkontinenz). Die Ursache dafür könnte eine unwillkürliche Kontraktion des Blasenmuskels sein. Die Kombination einer Belastungs‐ und einer Dranginkontinenz wird gemischte Inkontinenz genannt. Beckenbodentraining (PFMT, Englisch: Pelvic floor muscle training) ist eine überwachte Behandlung mit Muskel‐Anspannübungen zur Stärkung der Beckenbodenmuskulatur. Diese Behandlung wird häufig gegen Inkontinenz bei Frauen angewandt. Es gibt jedoch auch weitere Therapieformen, die entweder einzeln oder in Kombination mit Beckenbodentraining eingesetzt werden können.
Hauptergebnisse des Reviews
Wir schlossen 13 Studien in diesen Review ein, in denen eine Kombination aus Beckenbodentraining mit einer weiteren aktiven Behandlung bei 585 Frauen mit der gleichen aktiven Behandlung alleine bei 579 Frauen verglichen wurde. Behandelt wurden alle Arten der Inkontinenz. Die Evidenz reichte nicht aus, um eine Aussage zu treffen, ob Beckenbodentraining zusätzlich zu einer anderen aktiven Behandlung im Vergleich zu der gleichen aktiven Behandlung alleine zu mehr Berichten über eine Heilung oder Verbesserung von Inkontinenz und einer besseren Lebensqualität führt oder nicht.
Unerwünschte Wirkungen
Es lag ebenfalls keine ausreichende Evidenz vor, um die unerwünschten Wirkungen bei einer Kombination aus PFMT mit einer anderen aktiven Behandlung zu bewerten, da in keiner der eingeschlossenen Studien Daten über unerwünschte Wirkungen im Zusammenhang mit der PFMT‐Behandlung angegeben waren.
Einschränkungen des Reviews
Die meisten Vergleiche wurden in einzelnen, kleinen Studien durchgeführt. Keine der in diesen Review eingeschlossenen Studien war von ausreichender Größe, um die Antworten zu liefern, die sie zum Ziel hatten. Die Qualität der Evidenz für die betrachteten Endpunkte wurde als niedrig bis sehr niedrig eingestuft. Die wichtigsten Einschränkungen der Evidenz waren eine unzureichende Dokumentation der Studienmethoden und mangelnde Präzision in den Ergebnissen für die Endpunkte.
Authors' conclusions
Summary of findings
| PFMT added to vaginal cones versus vaginal cones alone for urinary incontinence in women | ||||||
| Patient or population: women with urinary incontinence | ||||||
| Outcomes | Illustrative comparative risks* (95% CI) | Relative effect | No of participants | Quality of the evidence | Comments | |
| Assumed risk | Corresponding risk | |||||
| Control | PFMT added to vaginal cones versus vaginal cones alone | |||||
| Number of women cured or improved (subjective) ‐ not reported | Not estimable | Not reported | ||||
| Number of women reporting incontinence at 1 year or more after treatment (subjective) ‐ not reported | Not estimable | Not reported | ||||
| Objective measure of urine leakage (pad test) | Study population | RR 1.27 | 34 | ⊕⊝⊝⊝ | ||
| 737 per 1000 | 936 per 1000 | |||||
| Number of women experiencing pain ‐ not reported | Not estimable | Not reported | ||||
| Condition‐specific quality of life assessed by patient questionnaire such as Incontinence Impact Questionnaire (IIQ), King's Health Questionnaire (KHQ) ‐ not reported | Not estimable | Not reported | ||||
| General health status evaluation e.g. Short Form (SF)‐36 ‐ not reported | Not estimable | Not reported | ||||
| Number of women requiring further treatment such as surgery, drugs, mechanical devices (relapse) ‐ not reported | Not estimable | Not reported | ||||
| *The basis for the assumed risk (e.g. the median control group risk across studies) is provided in footnotes. The corresponding risk (and its 95% confidence interval) is based on the assumed risk in the comparison group and the relative effect of the intervention (and its 95% CI). | ||||||
| GRADE Working Group grades of evidence | ||||||
| 1Random sequence generation and allocation concealment unclear. | ||||||
| PFMT added to lifestyle intervention versus lifestyle intervention alone for urinary incontinence in women | ||||||
| Patient or population: women with urinary incontinence | ||||||
| Outcomes | Illustrative comparative risks* (95% CI) | Relative effect | No of participants | Quality of the evidence | Comments | |
| Assumed risk | Corresponding risk | |||||
| Control | PFMT added to lifestyle intervention versus lifestyle intervention alone | |||||
| Number of women cured or improved (subjective) ‐ not reported | Not estimable | Not reported | ||||
| Number of women reporting incontinence at 1 year or more after treatment (subjective) ‐ not reported | Not estimable | Not reported | ||||
| Objective measure of urine leakage (e.g. pad test) ‐ not reported | Not estimable | Not reported | ||||
| Number of women reporting adverse events ‐ not reported | Not estimable | Not reported | ||||
| Condition‐specific quality of life ‐ not reported | Not estimable | Not reported | ||||
| General health status evaluation e.g. Short Form (SF)‐36 ‐ not reported | Not estimable | Not reported | ||||
| Number of women requiring further treatment such as surgery, drugs, mechanical devices (relapse) ‐ not reported | Not estimable | Not reported | ||||
| *The basis for the assumed risk (e.g. the median control group risk across studies) is provided in footnotes. The corresponding risk (and its 95% confidence interval) is based on the assumed risk in the comparison group and the relative effect of the intervention (and its 95% CI). | ||||||
| GRADE Working Group grades of evidence | ||||||
| PFMT added to bladder training versus bladder training alone for urinary incontinence in women | ||||||
| Patient or population: women with urinary incontinence | ||||||
| Outcomes | Illustrative comparative risks* (95% CI) | Relative effect | No of participants | Quality of the evidence | Comments | |
| Assumed risk | Corresponding risk | |||||
| Control | PFMT added to bladder training versus bladder training alone | |||||
| Number of women cured ‐ 3 months after treatment | Study population | RR 1.71 | 122 | ⊕⊝⊝⊝ | ||
| 159 per 1000 | 271 per 1000 | |||||
| Number of women reporting incontinence at 1 year or more after treatment (subjective) ‐ not reported | Not estimable | Not reported | ||||
| Objective measure of urine leakage (e.g. pad test) ‐ not reported | Not estimable | Not reported | ||||
| Number of women experiencing pain ‐ not reported | Not estimable | Not reported | ||||
| Condition‐specific quality of life ‐ 3 months after treatment | The mean condition‐specific quality of life ‐ 3 months after treatment in the intervention groups was 5.9 lower (35.53 lower to 23.73 higher) | 118 | ⊕⊝⊝⊝ | lower scores imply lower impact of incontinence on quality of life | ||
| General health status evaluation e.g. Short Form (SF)‐36 ‐ not reported | Not estimable | Not reported | ||||
| Number of women requiring further treatment such as surgery, drugs, mechanical devices (relapse) | 396 per 1000 | 376 per 1000 | RR 0.95 | 96 | ⊕⊝⊝⊝ | |
| *The basis for the assumed risk (e.g. the median control group risk across studies) is provided in footnotes. The corresponding risk (and its 95% confidence interval) is based on the assumed risk in the comparison group and the relative effect of the intervention (and its 95% CI). | ||||||
| GRADE Working Group grades of evidence | ||||||
| 1Random sequence generation and allocation concealment is unclear. | ||||||
| PFMT added to electrical stimulation versus electrical stimulation alone (excluding implanted electrodes) for urinary incontinence in women | ||||||
| Patient or population: women with urinary incontinence | ||||||
| Outcomes | Illustrative comparative risks* (95% CI) | Relative effect | No of participants | Quality of the evidence | Comments | |
| Assumed risk | Corresponding risk | |||||
| Control | PFMT added to electrical stimulation versus electrical stimulation alone (excluding implanted electrodes) | |||||
| Number of women cured | Study population | RR 2.06 | 56 | ⊕⊝⊝⊝ | ||
| 167 per 1000 | 343 per 1000 | |||||
| Number of women reporting incontinence at 1 year or more after treatment (subjective) ‐ not reported | Not estimable | Not reported | ||||
| Objective measure of urine leakage (e.g. pad test) ‐ not reported | Not estimable | Not reported | ||||
| Number of women experiencing pain ‐ not reported | Not estimable | Not reported | ||||
| Condition‐specific quality of life assessed by patient questionnaire such as Incontinence Impact Questionnaire (IIQ), King's Health Questionnaire (KHQ) ‐ not reported | Not estimable | Not reported | ||||
| General health status evaluation e.g. Short Form (SF)‐36 ‐ not reported | Not estimable | Not reported | ||||
| Number of women requiring further treatment such as surgery, drugs, mechanical devices (relapse) ‐ not reported | Not estimable | Not reported | ||||
| *The basis for the assumed risk (e.g. the median control group risk across studies) is provided in footnotes. The corresponding risk (and its 95% confidence interval) is based on the assumed risk in the comparison group and the relative effect of the intervention (and its 95% CI). | ||||||
| GRADE Working Group grades of evidence | ||||||
| 1Random sequence generation and allocation concealment unclear. | ||||||
| PFMT added to magnetic stimulation versus magnetic stimulation alone for urinary incontinence in women | ||||||
| Patient or population: women with urinary incontinence | ||||||
| Outcomes | Illustrative comparative risks* (95% CI) | Relative effect | No of participants | Quality of the evidence | Comments | |
| Assumed risk | Corresponding risk | |||||
| Control | PFMT added to magnetic stimulation versus magnetic stimulation alone | |||||
| Number of women cured or improved (subjective) ‐ not reported | Not estimable | Not reported | ||||
| Number of women reporting incontinence at 1 year or more after treatment (subjective) ‐ not reported | Not estimable | Not reported | ||||
| Objective measure of urine leakage (e.g. pad test) ‐ not reported | Not estimable | Not reported | ||||
| Number of women reporting adverse events ‐ not reported | Not estimable | Not reported | ||||
| Condition‐specific quality of life assessed by patient questionnaire such as Incontinence Impact Questionnaire (IIQ), King's Health Questionnaire (KHQ) ‐ not reported | Not estimable | Not reported | ||||
| General health status evaluation e.g. Short Form (SF)‐36 ‐ not reported | Not estimable | Not reported | ||||
| Number of women requiring further treatment such as surgery, drugs, mechanical devices (relapse) ‐ not reported | Not estimable | Not reported | ||||
| *The basis for the assumed risk (e.g. the median control group risk across studies) is provided in footnotes. The corresponding risk (and its 95% confidence interval) is based on the assumed risk in the comparison group and the relative effect of the intervention (and its 95% CI). | ||||||
| GRADE Working Group grades of evidence | ||||||
| PFMT added to continence pessary versus continence pessary alone for urinary incontinence in women | ||||||
| Patient or population: women with urinary incontinence | ||||||
| Outcomes | Illustrative comparative risks* (95% CI) | Relative effect | No of participants | Quality of the evidence | Comments | |
| Assumed risk | Corresponding risk | |||||
| Control | PFMT added to continence pessary versus continence pessary alone | |||||
| Number of women cured or improved (subjective) at 12 months | Study population | RR 0.88 | 207 | ⊕⊕⊕⊝ | ||
| 531 per 1000 | 468 per 1000 | |||||
| Number of women reporting incontinence at 1 year or more after treatment (subjective) ‐ not reported | Not estimable | Not reported | ||||
| Objective measure of urine leakage (e.g. pad test) ‐ not reported | Not estimable | Not reported | ||||
| Number of women reporting adverse events ‐ not reported | Not estimable | Not reported | ||||
| Condition‐specific quality of life at 12 months | Study population | RR 0.81 | 207 | ⊕⊕⊕⊝ | ||
| 542 per 1000 | 439 per 1000 | |||||
| General health status evaluation e.g. Short Form (SF)‐36 ‐ not reported | Not estimable | Not reported | ||||
| Number of women requiring further treatment such as surgery, drugs, mechanical devices (relapse) ‐ not reported | Not estimable | Not reported | ||||
| *The basis for the assumed risk (e.g. the median control group risk across studies) is provided in footnotes. The corresponding risk (and its 95% confidence interval) is based on the assumed risk in the comparison group and the relative effect of the intervention (and its 95% CI). | ||||||
| GRADE Working Group grades of evidence | ||||||
| 1Wide confidence interval (0.67 to 1.16). | ||||||
| PFMT added to drug therapy versus drug therapy alone for urinary incontinence in women | ||||||
| Patient or population: women with urinary incontinence | ||||||
| Outcomes | Illustrative comparative risks* (95% CI) | Relative effect | No of participants | Quality of the evidence | Comments | |
| Assumed risk | Corresponding risk | |||||
| Control | PFMT added to drug therapy versus drug therapy alone | |||||
| Number of women cured ‐ PFMT + clenbuterol versus clenbuterol | Study population | RR 1.16 | 32 | ⊕⊝⊝⊝ | ||
| 769 per 1000 | 892 per 1000 | |||||
| Number of women reporting incontinence at 1 year or more after treatment (subjective) ‐ not reported | Not estimable | Not reported | ||||
| Objective measure of urine leakage (e.g. pad test) ‐ not reported | Not estimable | Not reported | ||||
| Number of women reporting adverse events | 207 per 1000 | 174 per 1000 | RR 0.84 | 162 | ⊕⊝⊝⊝ | |
| Condition‐specific quality of life on I‐QoL Questionnaire ‐ PFMT + duloxetine versus duloxetine | The mean condition‐specific quality of life on I‐QoL questionnaire ‐ PFMT + duloxetine versus duloxetine in the intervention groups was 5.84 higher | 101 | ⊕⊕⊝⊝ | Higher scores mean less symptom impact on the quality of life (better) | ||
| General health status evaluation e.g. Short Form (SF)‐36 ‐ not reported | Not estimable | Not reported | ||||
| Number of women requiring further treatment such as surgery, drugs, mechanical devices (relapse) ‐ not reported | Not estimable | Not reported | ||||
| *The basis for the assumed risk (e.g. the median control group risk across studies) is provided in footnotes. The corresponding risk (and its 95% confidence interval) is based on the assumed risk in the comparison group and the relative effect of the intervention (and its 95% CI). | ||||||
| GRADE Working Group grades of evidence | ||||||
| 1Random sequence generation and allocation concealment is unclear. | ||||||
| PFMT prior to surgical intervention versus surgical intervention alone for urinary incontinence in women | ||||||
| Patient or population: women with urinary incontinence | ||||||
| Outcomes | Illustrative comparative risks* (95% CI) | Relative effect | No of participants | Quality of the evidence | Comments | |
| Assumed risk | Corresponding risk | |||||
| Control | PFMT prior to surgical intervention versus surgical intervention alone | |||||
| Number of women cured or improved (subjective) ‐ not reported | Not estimable | Not reported | ||||
| Number of women reporting incontinence at 1 year or more after treatment (subjective) ‐ not reported | Not estimable | Not reported | ||||
| Objective measure of urine leakage (e.g. pad test) ‐ not reported | Not estimable | Not reported | ||||
| Number of women reporting adverse events ‐ not reported | Not estimable | Not reported | ||||
| Condition‐specific quality of life assessed by patient questionnaire such as Incontinence Impact Questionnaire (IIQ), King's Health Questionnaire (KHQ) ‐ not reported | Not estimable | Not reported | ||||
| General health status evaluation e.g. Short Form (SF)‐36 ‐ not reported | Not estimable | Not reported | ||||
| Number of women requiring further treatment such as surgery, drugs, mechanical devices (relapse) ‐ not reported | Not estimable | Not reported | ||||
| *The basis for the assumed risk (e.g. the median control group risk across studies) is provided in footnotes. The corresponding risk (and its 95% confidence interval) is based on the assumed risk in the comparison group and the relative effect of the intervention (and its 95% CI). | ||||||
| GRADE Working Group grades of evidence | ||||||
| PFMT added to HSGS versus HSGS alone for urinary incontinence in women | ||||||
| Patient or population: women with urinary incontinence | ||||||
| Outcomes | Illustrative comparative risks* (95% CI) | Relative effect | No of participants | Quality of the evidence | Comments | |
| Assumed risk | Corresponding risk | |||||
| Control | PFMT added to other versus other treatment alone | |||||
| Number of women cured | Study population | RR 2.38 | 74 | ⊕⊕⊕⊝ | ||
| 216 per 1000 | 515 per 1000 | |||||
| Number of women reporting incontinence at 1 year or more after treatment (subjective) ‐ not reported | Not estimable | Not reported | ||||
| Objective measure of urine leakage (e.g. pad test) ‐ not reported | Not estimable | Not reported | ||||
| Number of women experiencing pain ‐ not reported | Not estimable | Not reported | ||||
| Condition‐specific quality of life assessed by patient questionnaire such as Incontinence Impact Questionnaire (IIQ), King's Health Questionnaire (KHQ) ‐ not reported | Not estimable | Not reported | ||||
| General health status evaluation e.g. Short Form (SF)‐36 ‐ not reported | Not estimable | Not reported | ||||
| Number of women requiring further treatment such as surgery, drugs, mechanical devices (relapse) ‐ not reported | Not estimable | Not reported | ||||
| *The basis for the assumed risk (e.g. the median control group risk across studies) is provided in footnotes. The corresponding risk (and its 95% confidence interval) is based on the assumed risk in the comparison group and the relative effect of the intervention (and its 95% CI). | ||||||
| GRADE Working Group grades of evidence | ||||||
| 1Allocation concealment unclear. | ||||||
Background
Different treatment options are currently available for the management of urinary incontinence in women. Conservative interventions include:
-
physical therapies such as pelvic floor muscle training (PFMT) with or without biofeedback (Dumoulin 2014; Herderschee 2011);
-
electrical or magnetic stimulation;
-
vaginal cones (Herbison 2013);
-
behavioural therapies including bladder training (Wallace 2004);
-
timed voiding (Ostaszkiewicz 2004);
-
prompted voiding (Eustice 2000);
-
anti‐incontinence devices (Lipp 2011); and
-
lifestyle interventions such as weight reduction.
Drug therapies include anticholinergics (Madhuvrata 2012; Nabi 2006), duloxetine (Mariappan 2005), local vaginal oestrogens (Cody 2012) and intravesical botulinum toxin (Duthie 2011). Surgical interventions include sling procedures (Ogah 2009; Rehman 2011), colposuspension (Dean 2006; Lapitan 2012), and injection of peri‐urethral bulking agents (Kirchin 2012).
The focus of this review is to determine the benefits of adding PFMT to any of the treatments above for the management of urinary incontinence in women. There is a separate Cochrane review dealing with the conservative treatment of postprostatectomy urinary incontinence in men (Campbell 2012).
Description of the condition
Urinary incontinence or loss of bladder control, according to the International Continence Society (ICS), is defined as the complaint of any involuntary loss of urine (Abrams 2013). It is a common problem that may affect women of all ages with a wide range of severity and a variety of symptoms; however, it is more prevalent in older women, particularly amongst those in institutionalised care (Milsom 2009).
The prevalence of urinary incontinence varies, depending on the age of the study population, the study methods and settings and the definition of the problem (Culligan 2000). In the general population, the estimated prevalence of urinary incontinence in middle‐aged and older women ranges from 30% to 60% and increases with advancing age; the prevalence of daily urinary incontinence ranges from 5% to 15%, and is over 15% in institutionalised women who are over the age of 70 (Milsom 2009). Nonetheless, these figures may not actually reflect the true nature, size and scope of this problem, for it is usually under‐diagnosed and under‐reported due to its embarrassing nature and associated stigmatisation (Shaw 2001a).
Urinary incontinence has an impact on many aspects of a woman's life (Grimby 1993; Hunskaar 1991; Sinclair 2011). Women with urinary incontinence have a significant reduction in their quality of life (Shaw 2001b). It significantly affects couples' relationships (Nilsson 2009); it is reported that 25% to 50% of incontinent women experience sexual dysfunction (Barber 2002). Evidence has also shown that women with urinary incontinence have coexisting psychiatric illness. Melville, et al reported that major depression was three times more common in incontinent women compared to their continent counterparts (6.1% versus 2.2%; Melville 2002). The financial impact of urinary incontinence is enormous; the estimated annual direct cost of treating urinary incontinence in women in the USA was estimated at USD 12.4 billion in 2001 (Wilson 2001). In the UK, the annual NHS cost of treating clinically significant urinary storage symptoms in women was estimated to be GBP 233 million (Turner 2004). With an increasingly ageing population, these costs are likely to increase in the future.
Types of urinary incontinence
There are three main types of urinary incontinence.
Stress urinary incontinence (SUI)
This is defined by the ICS and the International Urogynecological Association (IUGA) as the complaint of involuntary leakage of urine with coughing, sneezing or physical exertion (Haylen 2010). The term urodynamic stress incontinence (USI) is used to describe involuntary leakage of urine with increased intra‐abdominal pressure in the absence of detrusor contraction during urodynamic evaluation (Abrams 2013). Stress urinary incontinence is the most common type of urinary incontinence, affecting an estimated 50% (half) of all incontinent women (Milsom 2009). It is more prevalent in young and middle‐aged women, particularly those who are white and non‐Hispanic (Milsom 2009). It is often associated with weakness of pelvic floor support (muscles and collagen‐dependent tissues (Long 2008), damage to the bladder sphincter mechanism, or both, resulting in bladder neck hypermobility and rotational descent of the proximal urethra with associated intrinsic sphincter deficiency (Schorge 2008). This results in reduction of urethral closure pressure and consequently urine leakage during exertion or physical exercise.
Risk factors for SUI in women include pregnancy, vaginal delivery, increasing parity, advancing age, post‐menopausal state, obesity (MacArthur 2006; MacLennan 2000), and gynaecological procedures such as hysterectomy (Allahdin 2008). The aim of treatment is to strengthen the pelvic floor support, restore the normal function of the sphincter mechanism, or both.
Urgency urinary incontinence (UUI)
This is defined by the IUGA and ICS as the complaint of involuntary leakage of urine associated with urgency (Haylen 2010). Urgency is a sudden and compelling desire to void urine which is difficult to defer (Abrams 2013). Overactive bladder (OAB) is the presence of urinary urgency, usually associated with frequency and nocturia, with (OAB‐wet) or without UUI (OAB‐dry), in the absence of urinary tract infection (UTI) or other pathology (Haylen 2010). Urinary frequency is defined as passing urine more than eight times in 24 hours (Fitzgerald 2003; Fitzgerald 2002), while nocturia is waking up from sleep more than once per night to urinate (van Kerrebroeck 2002). In patients with detrusor overactivity (DO), a spontaneous or induced detrusor contraction is observed during urodynamic testing (Abrams 2013). Urgency urinary incontinence is more prevalent in older women and accounts for a small proportion of women with urinary incontinence (Milsom 2009). In continent individuals, reflex (involuntary) contraction of the pelvic floor muscles and the striated muscle of the urethra occurs during the filling (storage) phase of the bladder (Morrison 1995). This in turn leads to increased intra‐urethral pressure and reflex inhibition of detrusor contraction, thereby preventing urine leakage and urgency. Thus, any abnormality of the pelvic floor muscles (structural or neural) which disrupts this reflex inhibition of detrusor during the filing phase may result in urgency urinary incontinence.
In some cases, the cause of urgency urinary incontinence is idiopathic (unknown cause). Other causes include neurogenic (multiple sclerosis, Alzheimer's or Parkinson's disease), stroke, tumour of the bladder and bladder pain syndrome (interstitial cystitis), defined by the ICS as "an unpleasant sensation (pain, pressure, discomfort) perceived to be related to the urinary bladder, associated with lower urinary tract symptom(s) of more than six weeks duration, in the absence of infection or other identifiable causes" (Abrams 2013). The aim of treatment is to reduce the symptoms of OAB or UUI.
Mixed urinary incontinence (MUI)
This is the complaint of involuntary leakage of urine associated with urgency, exertion, effort, sneezing and coughing (Abrams 2013). The prevalence of MUI increases with age. It has been suggested that mixed urinary incontinence should initially be managed conservatively, or with drugs, to reduce the need for surgical intervention (Karram 1989). However, if symptoms persist without significant evidence of detrusor overactivity on urodynamics, surgery may be performed.
Description of the intervention
Pelvic floor muscle training (PFMT)
Pelvic floor muscle training (PFMT) was popularised by Arnold Kegel for the management of urinary incontinence and has since remained a first‐line conservative measure (Kegel 1948). It is commonly recommended for the treatment of patients with stress or mixed urinary incontinence (Dumoulin 2014). Less commonly, it can be used for urgency urinary incontinence.
The main aim of PFMT is to improve the function of the pelvic floor muscles in terms of strength, endurance and co‐ordination, thereby providing maximum support to the pelvic organs (particularly, the bladder neck and the proximal urethra), before and during an increase in intra‐abdominal pressure, to prevent urine leakage. There are different ways through which PFMT appears to work (Bø 2004):
-
Patients can learn how to use conscious pelvic floor muscle pre‐contraction before and during exertion to prevent urine leakage (co‐ordination).
-
Pelvic floor muscle strength training increases long‐lasting muscle volume, thereby providing structural support to the pelvic organs (strengthening).
The reported cure rates of PFMT vary, depending on a number of factors (Bernstein 1997; Bø 1999; Kegel 1948). These factors include the type and severity of incontinence, type of instruction and follow‐up, patients' adherence and the outcome measures used. Structured, supervised and more intensive programmes have been associated with more success than simple verbal instructions (Bø 1990; Dumoulin 2014).
How the intervention might work
Strong, fast and well‐timed voluntary pelvic floor muscle contractions have the effect of pressing the urethra against the posterior aspect of the symphysis pubis, thereby producing a mechanical increase in intra‐urethral pressure (DeLancey 1988). Thus, a positive urethral closure pressure is maintained during an increase in intra‐abdominal pressure, resulting in correction of the negative closure pressure usually observed in patients with stress incontinence.
Pelvic floor muscle strength training also aims to provide more support to the bladder neck and proximal urethra, which are observed to be poorly supported in some patients with urinary incontinence, by raising the position of the levator ani muscle through increased muscle volume (hypertrophy) and muscle stiffness (Bø 2004). The overall effect of this is to raise urethral closure pressure at rest and during increased intra‐abdominal pressure.
In urgency urinary incontinence, there is an inability to inhibit detrusor contractions, leading to abnormally high detrusor pressures. Reflex inhibition of detrusor activity has been shown to follow electrical stimulation of pelvic floor muscles (Godec 1975), and may also accompany repeated and conscious pelvic floor muscle contraction, thereby controlling UUI (Polden 1990). However, the timing, number, intensity and duration of pelvic floor muscle contractions considered adequate to inhibit detrusor contraction are unknown (Dumoulin 2014).
It is possible that adding other active treatments to basic PFMT may enhance its effectiveness, particularly if those treatments are effective in their own right.
Why it is important to do this review
To date, there is no sufficient evidence‐based rationale indicating that PFMT, in combination with another active treatment, is a better treatment of choice than the active treatment alone for urinary incontinence in women. Adding a treatment such as PFMT might be time consuming, increase resource use and decrease adherence. Therefore, if adding PFMT does not improve outcome over and above the other treatment, then there is no point incurring extra cost (both direct and indirect) for no added benefit. Thus, a considerable doubt exists about the real and potential therapeutic effectiveness, cost‐effectiveness and risks of PFMT added to another active treatment, in comparison with the active treatment alone, for the treatment of women with urinary incontinence. Therefore, there is a compelling need for a systematic review of the existing trial‐based evidence. The outcome of this review will complement what is already known about the effectiveness of PFMT (Boyle 2012; Dumoulin 2014; Hay‐Smith 2011; Herderschee 2011).
Objectives
To compare the effects of pelvic floor muscle training combined with another active treatment versus the same active treatment alone, in the management of women with urinary incontinence.
Methods
Criteria for considering studies for this review
Types of studies
We included randomised controlled trials and quasi‐randomised trials (for example allocation by alternation) of pelvic floor muscle training added to an active treatment versus the active treatment alone, for urinary incontinence in women. We also included trials using more than two arms of interventions, providing one of the arms involved the use of PFMT plus an active treatment and another arm involved the same active treatment alone. We excluded other forms of clinical trials.
Types of participants
Adult women with stress urinary incontinence (SUI), urgency urinary incontinence (UUI) or mixed urinary incontinence (MUI).
Weincluded trials that used any mode of diagnosis of incontinence (symptoms, signs, urodynamic evaluation, or any combination). This is because many patients are referred for PFMT solely on the basis of symptoms, with or without clinical signs, as there is no consensus yet on the need for urodynamic testing before PFMT is performed (Glazener 2012; Thuroff 2011). Also, the outcome of a conservative management of urinary incontinence has been shown to be no different with respect to the mode of diagnosis (Elser 1999). We included trials that recruited men and women providing demographic and outcome data were reported separately for women.
We excluded studies of women with urinary incontinence whose symptoms were due to significant external factors, for example, cognitive impairment, neurological disorders or lack of independent mobility, which are considered to be outside the urinary tract. We also excluded studies that recruited women with nocturnal enuresis.
We excluded studies that specifically investigated antenatal or postnatal women (up to three months after delivery). The effect of PFMT might differ in this group of women, given the physiological changes that occur during pregnancy and the postpartum period. These women have been considered in another Cochrane review (Boyle 2012).
We also excluded studies that recruited women in long‐term care facilities. Urinary incontinence in this category of women is often associated with other co‐morbid conditions such as dementia, depression, lack of independent mobility, etc., which might influence the outcome of PFMT or their ability to comply with treatment (Milsom 2009).
Types of interventions
One arm of the trial used pelvic floor muscle training (PFMT) added to another active treatment. The comparison was the same active treatment alone.
In this review, we counted PFMT as a programme of repeated voluntary pelvic floor muscle contractions taught or supervised (or both) by healthcare professionals. All types of PFMT programmes were considered for inclusion, for example, variations in timing and purpose of PFMT (such as PFMT for strengthening or urge suppression), ways of teaching PFMT, and types and number of contractions. If biofeedback was used at least once in the teaching or delivery of PFMT, we called this a PFMT intervention, and clearly labelled any trial that used biofeedback as a 'PFMT plus biofeedback' trial to recognise the potential additional effect of biofeedback. We considered trials in which PFMT was combined with advice on frequency or urgency strategies, or both (but without a scheduled voiding regimen characteristic of bladder training), or other lifestyle advice (such as weight reduction), with leaflets or verbal instructions only to be 'pure PFMT'.
The comparisons were:
A Physical
1. PFMT added to vaginal cones versus vaginal cones alone
B Behavioural
2. PFMT added to lifestyle intervention (e.g. weight reduction) versus lifestyle intervention alone (lifestyle intervention must be structured or supervised)
3. PFMT added to bladder training versus bladder training alone (bladder training must include scheduled voiding regimen)
C Electrical or magnetic
4. PFMT added to electrical stimulation versus electrical stimulation alone (excluding implanted electrodes)
5. PFMT added to magnetic stimulation versus magnetic stimulation alone
D Mechanical
6. PFMT added to continence pessaries versus continence pessaries alone
E Drugs
7. PFMT added to drug therapy (e.g. tolterodine, duloxetine) versus drug therapy alone
F Surgery
8. PFMT prior to surgical intervention (e.g. tension‐free vaginal tape (TVT)) versus surgical intervention alone
G Other
9. PFMT added to any other stand‐alone active treatment versus the same stand‐alone active treatment.
Types of outcome measures
The Standardisation Committee of the International Continence Society recommended that research looking into the effects of therapeutic interventions for women with urinary incontinence should take into consideration the following five outcome domains: patient's observations with respect to the symptoms of urinary incontinence, quantification of patient's symptoms, clinician's observations (functional and anatomical), patient's quality of life and socioeconomic implication of treatment (Lose 1998). For this review, one or more outcomes of interest were considered from each domain.
Primary outcomes
Women's observations
-
Number of women cured of symptoms of urinary incontinence (within first year, as reported by the participants, not the clinicians)
-
Number of women cured or improved (as reported by the participants, not the clinicians)
-
Symptom‐ and condition‐specific quality of life assessed by various measures, such as the Urinary Incontinence Quality of Life (I‐QoL) scale, King's Health Questionnaire, the Incontinence Impact Questionnaire (IIQ), the Social Activity Index, the Leicester Impact Scale, etc.
-
Number of women improved on patient global impression of improvement in the first three months after the end of treatment
Secondary outcomes
1. Quantification of symptoms
-
Number of women reporting incontinence at one year or more after treatment (subjective)
-
Number of micturitions during the day
-
Number of micturitions during the night
-
Urine loss (measured on pad or paper towel weight tests)
-
Other quantification of symptoms reported by individual trials
2. Clinician's observations
-
Objective measurement of incontinence, such as observation of urine leakage during cough test
-
Measurement of pelvic floor muscle function, such as electromyography, vaginal squeeze pressure, pelvic floor muscle force and morphological measurements (dynamometry, ultrasound)
3. Generic quality of life
-
General health status evaluation e.g. Short Form (SF)‐36, Norwegian version of the Quality of Life Scale (QoLS‐N), etc.
-
Other quality of life measures as reported by individual trials
4. Economic analysis
-
Costs of intervention, resource implications of differences in outcomes and overall cost utility and cost‐effectiveness
5. Adverse effects
-
Number of women reporting adverse events
-
Pain or discomfort
-
Other adverse outcomes as reported by individual trials
6. Other outcomes
-
Sexual function
-
Pelvic organ prolapse
-
Number of women requiring further treatment, such as surgery, drugs, mechanical devices (relapse)
-
Treatment adherence evaluation using, for example, a self administered treatment adherence questionnaire
-
Patient satisfaction with treatment assessed using, for example, the validated Patient Satisfaction Questionnaire
-
Other outcomes not pre‐specified but considered to be important during the review, e.g. long‐term follow‐up
Quality of evidence
We assessed the quality of evidence by adopting the Grading of Recommendations, Assessment, Development and Evaluation (GRADE) approach. The following factors were considered for assessing the quality of evidence:
-
Limitations in the study design
-
Inconsistency of results
-
Indirectness of evidence
-
Imprecision
-
Publication bias
The review authors classified primary and secondary outcomes, as defined above, as 'critical', 'important' or 'not important' for decision making from the woman's perspective. The GRADE working group strongly recommends including up to seven critical outcomes in a systematic review (Guyatt 2011a; Guyatt 2011b).
In this systematic review, the seven critical outcomes for assessing the quality of evidence were as follows:
-
Number of women cured or improved (subjective)
-
Condition‐specific quality of life assessed by patient questionnaire such as Incontinence Impact Questionnaire (IIQ), King's Health Questionnaire (KHQ)
-
Number of women reporting incontinence at one year or more after treatment (subjective)
-
Objective measure of urine leakage (e.g. pad test)
-
Number of women reporting adverse events
-
General health status evaluation e.g. Short Form (SF‐36)
-
Number of women requiring further treatment such as surgery, drugs, mechanical devices
Search methods for identification of studies
We did not impose any restrictions, for example language or publication status, on the searches described below.
Electronic searches
This review drew on the search strategy developed for the Cochrane Incontinence Group. We identified relevant trials from the Cochrane Incontinence Group Specialised Register of trials. For more details of the search methods used to build the Specialised Register please see the Group's module in the Cochrane Library. The register contains trials identified from the Cochrane Central Register of Controlled Trials (CENTRAL), MEDLINE, MEDLINE in Process, ClinicalTrials.gov and WHO ICTRP and handsearching of journals and conference proceedings. Most of the trials in the Cochrane Incontinence Group Specialised Register are also contained in CENTRAL. The date of the last search of the Specialised Register was 5 May 2015.
The terms used to search the Incontinence Group Specialised Register are given in Appendix 1:
For this review, we also specifically searched CINAHL on EBSCO Host from January 1982 to May 2015. The last search was performed on 6 May 2015; the search strategy is given in Appendix 1:
For details of the specific searches performed for the first version of this review, please see Appendix 2 (Ayeleke 2013).
Searching other resources
We searched the reference lists of relevant articles, and the included and excluded studies in other relevant Cochrane reviews.
Data collection and analysis
Selection of studies
Only randomised and quasi‐randomised controlled trials were included. Two review authors independently screened the list of titles and abstracts generated by the search. We retrieved full‐text articles of potentially relevant studies. Two review authors independently assessed the full‐text articles for eligibility. Any differences of opinion were resolved through discussion or by involving a third party. We listed studies formally considered for the review but excluded, with reasons given for their exclusion.
Data extraction and management
Two review authors independently extracted the data from the included studies using a standardised form. Any disagreement was resolved by discussion or by consulting a third party. Where there was insufficient information regarding the outcomes or other relevant aspects of the published reports, we contacted study authors. For data entry, we used Review Manager software (RevMan 2012). We processed the data from the included trials according to the Cochrane Handbook for Systematic Reviews of Interventions (Higgins 2011).
Assessment of risk of bias in included studies
We assessed the risk of bias in the included studies using the Cochrane 'Risk of bias' assessment tool (Higgins 2011). This included:
-
sequence generation;
-
allocation concealment;
-
blinding of participants or therapists;
-
blinding of outcome assessors;
-
completeness of outcome data;
-
selective outcome reporting;
Other potential sources of bias we incorporated into the 'Risk of bias' tables were ethical approval, conflict of interest and funding source. Some of these additional domains are also used in another systematic review (Omar 2014). Two review authors independently assessed the above mentioned domains. Any differences of opinion were resolved through consensus or by consulting a third party.
Measures of treatment effect
Analyses were based on available data from all included trials relevant to the comparisons and outcomes of interest. For trials with multiple publications, only the most up‐to‐date of the trials or those with complete data for each outcome were included. We had planned to undertake a meta‐analysis, but this could not be done for most of the outcome measures because each of the pre‐specified comparisons (except bladder training and electrical stimulation) was addressed by single trials. For categorical outcomes, we related the numbers reporting an outcome to the numbers at risk in each group to calculate a risk ratio (RR) with 95% confidence intervals (CI). For continuous variables, we used means and standard deviations to calculate a mean difference (MD) with 95% CI. Where data we required to calculate RRs or MDs were not given, we utilised the most detailed numerical data available (e.g. test statistics, P values) to calculate the actual numbers or means and standard deviations.
Unit of analysis issues
The primary analysis was per woman randomised. Initially, we had planned to analyse two‐period, two‐intervention cross‐over trials with continuous outcomes by determining the mean person difference between the two treatment periods and the standard error of this mean to obtain the effect estimates for inclusion in a meta‐analysis, by using the generic inverse variance method (Higgins 2011). However, cross‐over trials were not identified for inclusion in this review. Similarly, we had intended to analyse cluster‐randomised trials by reducing them to their effective sample size (that is, original sample size divided by design effect; design effect = 1 + (M ‐ 1) x ICC, where M is the average cluster size and ICC is the intra‐cluster correlation coefficient), and then combine the data obtained (dichotomous or continuous) in a meta‐analysis (Higgins 2011). In the end, no cluster‐randomised trial was included in this review.
Dealing with missing data
We analysed the data on an intention‐to‐treat basis as far as possible. By intention‐to‐treat analysis, we mean that: 1. outcome data must be measured on all participants; 2. all randomised participants must be included in the analysis; and 3. participants must be retained in the intervention groups to which they were assigned (Higgins 2011). However, for this review, the criterion set for intention‐to‐treat analyses was that participants be retained and analysed in the intervention groups to which they were assigned. Where this was not the case, we considered whether the trial should be excluded. We made attempts to obtain missing data from the original trialists. However, where this was not possible, data were reported as given in the trial reports, except where there was evidence of differential loss to follow‐up between the intervention groups. In that case, the use of imputation of missing data was considered.
Assessment of heterogeneity
We assessed heterogeneity between studies by visual inspection of plots of the data, the Chi² test for heterogeneity and the I² statistic (Higgins 2003). We also used the thresholds for interpretation of the I² statistic as defined by the Cochrane Handbook for Systematic Reviews of Interventions (Higgins 2011). An I² measurement greater than 50% was taken to indicate substantial heterogeneity..
Assessment of reporting biases
In view of the difficulty in detecting and correcting for publication bias and other reporting biases, we minimised their potential impact by ensuring a comprehensive search for eligible studies, and by watching out for duplication of data.
Data synthesis
We combined trials with similar interventions in a meta‐analysis, using a fixed‐effect model approach, as there was no evidence of significant heterogeneity across studies.
Subgroup analysis and investigation of heterogeneity
We had intended to do subgroup data analyses by the type of underlying urinary incontinence or lower urinary tract symptoms:
-
stress urinary incontinence;
-
urgency urinary incontinence;
-
mixed urinary incontinence (both stress and urgency urinary incontinence);
-
'unclear' if there was no clear cut diagnosis with respect to the type of urinary incontinence.
Ultimately, we could not perform subgroup analysis because there were few trials, with most addressing different interventions.
Where heterogeneity between trials was found to be substantive, we had planned to conduct an investigation to identify its cause(s). The investigation of heterogeneity was meant to address populations and interventions in the individual trials. The investigation could also include subgroup analyses, meta‐regression and sensitivity analyses. Where heterogeneity persisted after appropriate investigation and possible removal of outlying trials, a random‐effects model could have be used in the meta‐analysis. In the end, there was no need to investigate heterogeneity as most of the included trials tested different comparisons.
Sensitivity analysis
We had planned to perform sensitivity analyses by including or excluding trials at high risk of bias. However, this was not applicable as meta‐analyses could not be performed for most of the comparisons.
Results
Description of studies
Results of the search
In the first version of this review, the search produced a total of 641 titles and abstracts, out of which we considered 132 full‐text articles for further assessment. Eleven trials in 29 reports met the eligibility criteria for inclusion in the review, while 84 studies in 103 reports were excluded (reasons for exclusion are stated in the Characteristics of excluded studies table). In the current updated version of this review, the updated searches produced 173 records to assess, from which an additional two new studies in four reports were identified (Bezerra 2009; Kaya 2015). Thus, we included a total of 13 trials in 33 reports in the current updated version. The PRISMA flow chart in Figure 1 illustrates the flow of literature through the search and assessment process.
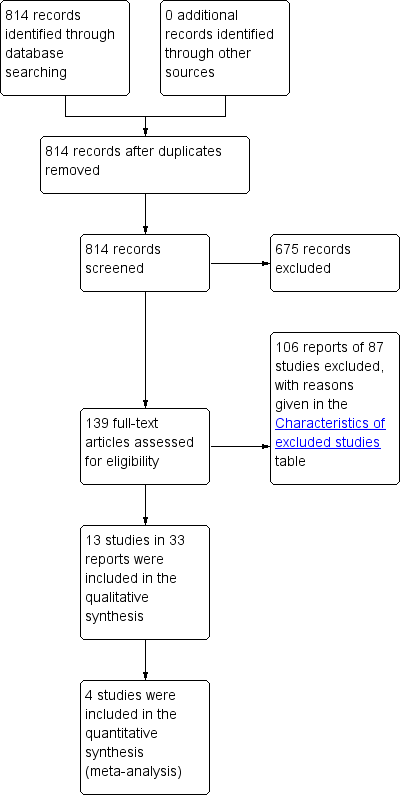
PRISMA study flow diagram.
Included studies
Nine of the included trials (Ghoniem 2005; Hofbauer 1990; Ishiko 2000; Jeyaseelan 2002; Jin 2012; Kim 2011; Richter 2010; Wise 1993; Wyman 1998) contained more than two intervention arms; descriptions and data were provided for all the arms in this review. The trials included a total of 1164 women, 585 of whom received some form of PFMT added to another active treatment, while 579 received comparator treatments, which were the other active treatment alone.
In terms of number of participants per comparison group:
-
the largest trial had more than 100 per comparison group (Richter 2010);
-
three trials had more than 50 but fewer than 100 per comparison group (Jin 2012; Kaya 2015; Wyman 1998);
-
one trial had between 47 and 52 per comparison group (Ghoniem 2005);
-
three trials had more than 20 but fewer than 50 per comparison group (Bezerra 2009; Burgio 2010a; Kim 2011);
-
one trial had between 20 and 21 per comparison group (Wise 1993);
-
one trial had between 18 and 20 per comparison group (Ishiko 2000); and
-
three trials had fewer than 20 per comparison group (Chen 2008; Hofbauer 1990; Jeyaseelan 2002).
Three trials reported an a priori power calculation (Kaya 2015; Richter 2010; Wyman 1998); another one used an a priori power calculation at an early stage of the trial, but later decided to use a conditional power calculation (based on available participants) due to slow accrual of participants (Burgio 2010a).
Sample characteristics
Mode of diagnosis of urinary incontinence
The trials based the diagnosis of urinary incontinence on:
-
symptoms, signs, or both: five trials (Chen 2008; Ishiko 2000; Kaya 2015; Kim 2011; Richter 2010);
-
urodynamics: three trials (Hofbauer 1990; Jin 2012; Wise 1993);
-
symptoms and urodynamics: four trials (Bezerra 2009; Burgio 2010a; Ghoniem 2005; Wyman 1998);
-
unspecified mode: one trial (Jeyaseelan 2002).
Types of urinary incontinence
The trials recruited women with:
-
SUI only: five trials (Bezerra 2009; Hofbauer 1990; Ishiko 2000; Jeyaseelan 2002; Wise 1993);
-
SUI or SUI predominant MUI: two trials (Ghoniem 2005; Richter 2010);
-
UUI or UUI predominant MUI: one trial (Burgio 2010a);
-
SUI, UUI or MUI: three trials (Kaya 2015; Kim 2011; Wyman 1998).
Age
The included trials recruited women aged:
-
18 to 75 years (Ghoniem 2005);
-
18 years or older (Kaya 2015; Richter 2010);
-
30 to 75 years or older (Ishiko 2000);
-
45 years or older Bezerra 2009; (Wyman 1998);
-
70 years or older (Kim 2011).
Four trials did not set age limits (either a lower or an upper limit; Burgio 2010a; Chen 2008; Hofbauer 1990; Jin 2012), while two trials did not present any data on the age of the included women (Jeyaseelan 2002; Wise 1993).
Frequency of urinary incontinence episodes
Five trials used frequency of incontinence episodes as one of the inclusion criteria:
-
more than once a month (Kim 2011);
-
at least once per week (Wyman 1998);
-
at least twice per week (Burgio 2010a);
-
twice or more per day (Ghoniem 2005); or
-
at least two episodes on seven‐day bladder diary (Richter 2010).
Duration of urinary incontinence symptoms
In six trials, duration of UI was reported as one of the baseline characteristics, with none using this as an inclusion criterion (Burgio 2010a; Ishiko 2000; Jin 2012; Kaya 2015; Kim 2011; Wyman 1998). The reported mean or median duration of symptoms varied between 2.1 and 8.6 years.
Other characteristics
Exclusion criteria were reported by eight of the included trials (Ghoniem 2005; Hofbauer 1990; Ishiko 2000; Jin 2012; Kaya 2015; Kim 2011; Richter 2010; Wyman 1998). Common reasons for excluding participants across trials were: presence of uncontrolled diabetes mellitus, persistent urinary tract infection, disease of the nervous system, impaired mental state, advanced pelvic organ prolapse, antenatal or postnatal women (up to three months after delivery), and post‐void residual volume more than a specified amount.
Interventions
Pelvic floor muscle training (PFMT)
Detailed descriptions of the PFMT programmes of the included trials are given in the Characteristics of included studies table. The purpose of this review was to examine the additional effects of adding PFMT to another active treatment. Therefore, the review authors were particularly interested in the effectiveness of PFMT with respect to the confirmation of a correct voluntary pelvic floor muscle contraction, duration of PFMT, and PFMT 'dose'. Additionally, we were interested in whether the 'experimental group' received any additional intervention to enhance the effectiveness of PFMT.
Confirmation of a correct pelvic floor muscle contraction
Only two trials reported that the correct type of voluntary pelvic floor muscle contraction was confirmed, but full details about the mode of confirmation were not reported (Ghoniem 2005; Wise 1993).
Duration of PFMT
One trial did not specify the duration of PFMT in weeks; it stated that participants underwent 24 sessions of PFMT training (Bezerra 2009). The duration of PFMT in the remaining trials varied between four and 12 weeks among the trials:
-
four weeks (Jin 2012);
-
six weeks (Hofbauer 1990; Kaya 2015);
-
eight weeks (Burgio 2010a; Chen 2008; Jeyaseelan 2002; Richter 2010); and
-
12 weeks (Ghoniem 2005; Ishiko 2000; Kim 2011; Wise 1993; Wyman 1998).
'Dose' of PFMT
A PFMT programme may be prescribed to:
-
increase strength (i.e. the maximum force generated in a single contraction by a muscle), characterised by low numbers of repetitions with high 'loads'('loads' can be increased by increasing the amount of voluntary efforts with each contraction);
-
increase endurance (i.e. the ability to contract repetitively or sustain a single contraction over time), characterised by high numbers of repetitions or prolonged contractions with low to moderate 'loads';
-
co‐ordinate muscle activity by using voluntary pelvic floor muscle contraction to either minimise urine leakage (with increased intra‐abdominal pressure) or suppress urge (suppression of detrusor contraction; i.e. behavioural training); or
-
a combination of these. In this review, the trials included the following programmes:
-
one trial targeted endurance training (Chen 2008), two trials targeted a combination of strength and endurance training (Kaya 2015; Kim 2011), while one trial used a combination of endurance and co‐ordination training (Burgio 2010a);
-
two trials used a combination of strength, endurance and co‐ordination training programmes (Ghoniem 2005; Wyman 1998).
-
In seven trials, it was difficult to characterise the PFMT programme (contraction effort, frequency, number and duration), because full details were not provided about the key training parameters, such as amount and duration of voluntary contractions (Bezerra 2009; Hofbauer 1990; Ishiko 2000; Jeyaseelan 2002; Jin 2012; Richter 2010; Wise 1993).
Additional intervention to enhance PFMT effectiveness
Some trials added extra interventions to the PFMT regimen in order to increase its effects:
-
biofeedback in the form of perineal surface electromyography (Chen 2008; Jeyaseelan 2002), or a strip‐chart recorder from vaginal balloon (Wyman 1998);
-
feedback by means of manual palpation (Ghoniem 2005); and
-
abdominal muscle exercises (Hofbauer 1990; Kim 2011).
Comparators
The active and concomitant comparators were:
-
vaginal cones (Wise 1993);
-
bladder training (Kaya 2015; Wyman 1998);
-
electrical stimulation (Bezerra 2009; Hofbauer 1990; Jeyaseelan 2002);
-
continence pessary (Richter 2010);
-
drug therapy: duloxetine (Ghoniem 2005); oxybutynin (Burgio 2010a); solifenacin (Jin 2012); clenbuterol (Ishiko 2000), and unspecified drugs (but assumed to be an anticholinergic as it was for participants with overactive bladder, (Chen 2008);
-
other active treatment: heat and steam generating sheet (HSGS, Kim 2011).
Further details about the participants, interventions and comparators are provided in the Characteristics of included studies table.
Outcome measures
The choice of outcome measures varied considerably among trials and this made it impossible to combine results from the majority of individual trials. Only the outcomes reported at endpoints (at the end of, or shortly after the end of the interventions) were used in the analysis based on the assumption that the maximum benefits could be expected to have been gained at that time. One trial reported all its outcomes in medians and ranges and was therefore not included in the analysis of data (Jeyaseelan 2002).
Excluded studies
We excluded 87 trials (106 reports); reasons for their exclusion are given in the Characteristics of excluded studies table. Most trials were excluded because either the interventions or the comparators were not relevant. For example, Millard and colleagues administered PFMT via a two‐page written instruction sheet (Millard 2004); another trial added bladder training, another active treatment, to PFMT as a component of lower urinary tract exercise (i.e. the exercise did not contain 'pure' PFMT and this combination was added to another active treatment, (Berghmans 2000); while Fitzgerald and colleagues used behavioural therapy, which included PFMT and timed voiding (BE‐DRI 2008); the latter is an active treatment on its own (Ostaszkiewicz 2004).
Risk of bias in included studies
Figure 2 and Figure 3 summarise the risk of bias of the included trials. Five trials were published as conference abstracts and it was therefore difficult to assess the risk of bias, with most domains being assessed as 'unclear' risk (Bezerra 2009; Chen 2008; Jeyaseelan 2002; Jin 2012; Wise 1993).
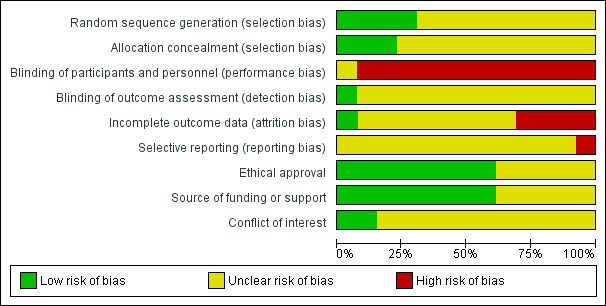
'Risk of bias' graph: review authors' judgements about each risk of bias item presented as percentages across all included studies.
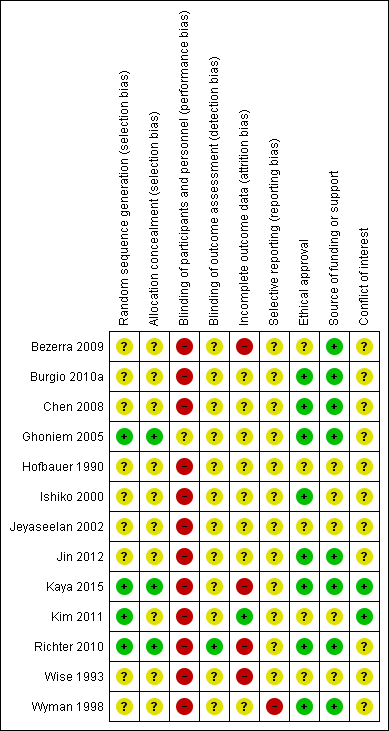
'Risk of bias' summary: review authors' judgements about each risk of bias domain for each included study.
Allocation
Sequence generation
Four trials provided sufficient details about the methods used in random sequence generation to be sure this was genuine and adequate (Ghoniem 2005; Kaya 2015; Kim 2011; Richter 2010). Therefore, we considered these trials to be at low risk. For the remaining trials, the risk of bias was unclear because they did not provide enough details about the methods used in sequence generation.
Allocation concealment
Three trials gave enough details to be sure there was adequate allocation concealment and we thus considered them to be at low risk (Ghoniem 2005; Kaya 2015; Richter 2010). Other trials did not give clear and sufficient information about allocation concealment and thus the risk of bias was unclear.
Blinding
It was decided that, given the nature of an intervention such as PFMT, blinding of women as well as therapists was not practical. Though one trial attempted this by blinding the participants (gave 'sham' PFMT to one of the treatment groups), the adequacy and genuineness of such a blinding process was unclear, thus, we categorised this trial as unclear with regard to performance bias (Ghoniem 2005). We categorised the remaining trials as being at high risk with respect to performance bias.
In the domain of detection bias, only one trial clearly stated that outcome assessors were blinded, therefore, we categorised it as being at low risk (Richter 2010). The remaining trials did not provide sufficient, or any, information about outcome assessment and we thus categorised them as unclear.
Incomplete outcome data
Description of dropout and withdrawal
Four trials did not clearly state whether or not there was loss to follow‐up (Chen 2008; Hofbauer 1990; Jeyaseelan 2002; Jin 2012), though in three of these trials, it appeared there were no dropouts (Hofbauer 1990; Jeyaseelan 2002; Jin 2012). In the remaining trials, the proportion of losses to follow‐up for all the treatment groups was as follows:
-
less than 10% (Burgio 2010a; Kim 2011; Wyman 1998);
-
between 10% and 20% (Ishiko 2000; Kaya 2015; Richter 2010; Wise 1993);
-
more than 20% (Bezerra 2009; Ghoniem 2005).
One trial did not report the number of withdrawals by treatment group (Wyman 1998). In another trial, there were no dropouts in either the experimental or the control groups (Kim 2011). In three trials, the proportion of losses to follow‐up was higher in the PFMT plus active treatment group than the active treatment group (Bezerra 2009; Burgio 2010a; Wise 1993), while in another three trials, more women dropped out of the active treatment group than the PFMT plus the active treatment group (Ishiko 2000; Kaya 2015; Richter 2010). In the remaining trial, the proportion of dropouts did not differ significantly between the experimental and the control groups (Ghoniem 2005).
Analysis by full intention‐to‐treat (ITT) principle
Trials were required to retain and analyse participants in the group to which they were randomly assigned. Only three trials clearly reported that the primary analysis was by intention‐to‐treat (Burgio 2010a; Ghoniem 2005; Richter 2010). However, it was difficult to ascertain if any of these trials actually met the above criterion for intention‐to‐treat analysis.
Therefore, we categorised trials as being at low risk of bias if the proportion of loss to follow‐up was 10% or less, and there was no evidence of differential loss to follow‐up between the comparison groups of interest. In this regard, we rated one trial as being at low risk (Kim 2011); we categorised four trials as being at high risk (Bezerra 2009; Kaya 2015; Richter 2010; Wise 1993), while the remaining trials were unclear.
Selective reporting
It was difficult to assess whether the included trials selectively reported their outcomes or not, as the protocols for these trials were not available for review. In some of the trials, there was incomplete data reporting with data not made available for one or more of the outcomes specified in the methods section. Therefore, we rated all the trials as unclear for this domain of risk of bias.
Other potential sources of bias
Ethical approval
In five trials, it was neither stated that ethical approval was obtained, nor that informed consent was sought from participants (Bezerra 2009; Hofbauer 1990; Jeyaseelan 2002; Kim 2011; Wise 1993).
Source of funding or financial assistance
Three trials received funding or support from public sources (Burgio 2010a; Kaya 2015; Wyman 1998); another two were funded either by pharmaceutical companies (Ghoniem 2005), or a private organisation (Richter 2010). Three trials stated that no funding or financial assistance was received (Bezerra 2009; Chen 2008; Jin 2012). The remaining trials did not give any report on their source of funding or financial support (Hofbauer 1990; Ishiko 2000; Jeyaseelan 2002; Kim 2011; Wise 1993).
Conflict of interest
Three trials clearly made conflict of interest statements in which some of the authors had financial or other relationships with some pharmaceutical companies (Burgio 2010a; Ghoniem 2005; Richter 2010); in Ghoniem 2005, some of the authors had financial interests or other relationships with one of the organisations that supported the trial. Two trials stated that the authors had no conflict of interest (Kaya 2015; Kim 2011). The remaining trials did not make any statement with respect to their conflict of interest (Bezerra 2009; Chen 2008; Hofbauer 1990; Ishiko 2000; Jeyaseelan 2002; Jin 2012; Wise 1993; Wyman 1998).
Effects of interventions
See: Summary of findings for the main comparison PFMT added to vaginal cones versus vaginal cones alone for urinary incontinence in women; Summary of findings 2 PFMT added to lifestyle intervention versus lifestyle intervention alone for urinary incontinence in women; Summary of findings 3 PFMT added to bladder training versus bladder training alone for urinary incontinence in women; Summary of findings 4 PFMT added to electrical stimulation versus electrical stimulation alone (excluding implanted electrodes) for urinary incontinence in women; Summary of findings 5 PFMT added to magnetic stimulation versus magnetic stimulation alone for urinary incontinence in women; Summary of findings 6 PFMT added to continence pessary versus continence pessary alone for urinary incontinence in women; Summary of findings 7 PFMT added to drug therapy versus drug therapy alone for urinary incontinence in women; Summary of findings 8 PFMT prior to surgical intervention versus surgical intervention alone for urinary incontinence in women; Summary of findings 9 PFMT added to HSGS versus HSGS alone for urinary incontinence in women
The 13 included trials compared PFMT added to another active treatment (585 women) with the same active treatment alone (579 women). Nine trials reported data on at least one or more of the pre‐specified primary outcomes, while nine trials contained data on at least one or more of the pre‐specified secondary outcomes. None of the trials reported any data on socioeconomic outcomes.
The following comparisons were addressed:
A Physical interventions
1. PFMT added to vaginal cones versus vaginal cones alone
One small trial (Wise 1993) compared the effects of a combined PFMT and vaginal cones treatment with vaginal cones treatment alone for women with SUI.
Secondary outcome measures
Number of women cured or improved (objective assessment)
A number of outcomes were reported, but only one contained usable data; the number of women cured or improved on pad testing (objective assessment of cure or improvement). There were no statistically significant differences in the estimated size of treatment effect between the two intervention groups at endpoint (RR 1.27, 95% CI 0.94 to1.71, Analysis 1.1).
B Behavioural interventions
2. PFMT added to lifestyle intervention (e.g. weight reduction) versus lifestyle intervention alone (lifestyle intervention must be structured or supervised)
None of the trials addressed this comparison. We have added summary of findings Table 2 to highlight lack of evidence.
3. PFMT added to bladder training versus bladder training alone (bladder training must include scheduled voiding regimen)
For this comparison, two trials with 336 participants contributed data (Kaya 2015; Wyman 1998). However, Kaya 2015 contributed data to only one outcome (patient global impression of improvement). The trials compared the effects of interventions in women with SUI, UUI or MUI.
Primary outcome measures
Number of women 'cured' or 'improved' (as reported by the women)
Cure rate was assessed immediately after and at three months after treatment, using a standardised diary; cure was defined as complete cessation (100% reduction) of incontinence. Immediately after treatment, women who received combined PFMT and bladder training were more likely to be cured than those who received bladder training alone, but this difference was not statistically significant (19/61 versus 12/67; RR 1.74, 95% CI 0.92 to 3.28; Analysis 3.1). At three months after treatment, there was also no statistically significant difference in the estimated size of treatment effect between the two intervention groups (16/59 versus 10/63; RR 1.71, 95% CI 0.84 to 3.46; Analysis 3.1).
Improvement was defined as the proportion of women who had 50% or greater reduction in incontinence episodes in a standardised diary. More women who received a combination of PFMT and bladder training reported cure or improvement immediately after treatment compared to those who were treated with bladder training alone (43/61 versus 35/67; RR 1.35, 95% CI 1.02 to 1.79; Analysis 3.2.1), but there was no statistically significant difference between the two intervention groups at three months after intervention (35/59 versus 28/61; RR 1.29, 95% CI 0.92 to 1.82; Analysis 3.2.2).
Symptom‐ and condition‐specific quality of life
The impact of urinary incontinence on quality of life was assessed by two validated scales: the Incontinence Impact Questionnaire‐Revised (IIQ‐R) and the Urogenital Distress Inventory (UDI) scale. Both instruments have established validity and reliability for assessing the impact of urinary incontinence on the quality of life of women (Shumaker 1994). On these scales, lower scores imply lower impact of incontinence on quality of life and vice versa. Assessment was carried out immediately and at three months after treatment.
Data analysis indicated that immediately after treatment, the addition of PFMT to bladder training resulted in statistically significantly lower impact on the quality of life (better) than with bladder training alone on both scales (IIQ‐R: MD ‐25.50, 95% CI ‐49.95 to ‐1.05; Analysis 3.3.1; UDI: MD ‐31.10, 95% CI ‐48.94 to ‐13.26; Analysis 3.4.1). However, this difference did not persist at three months after treatment on either scale (IIQ‐R: MD ‐5.90, 95% CI ‐35.53 to 23.73; Analysis 3.3.2; UDI: MD ‐18.90, 95% CI ‐37.92 to 0.12; Analysis 3.4.2).
Patient global impression of improvement
Data analysis from two trials showed that immediately after treatment, the addition of PFMT to bladder training resulted in statistically significantly higher proportion of women being cured or improved than with bladder training alone (111/117 versus 86/118; RR 1.29, 95% CI 1.15 to 1.45; I² = 35%; Analysis 3.5). However, this difference did not persist at three months after treatment as reported in Wyman 1998 (RR 1.21, 95% CI 0.94 to 1.55; Analysis 3.5).
Secondary outcome measures
Frequency of incontinence episodes per week was assessed from the records in a standardised diary immediately after the intervention (Analysis 3.6). While women had fewer episodes of incontinence in the combined treatment group compared with bladder training alone group, this result was not statistically significant (6.8 versus 10.6; MD ‐3.80, 95% CI ‐8.51 to 0.91; Analysis 3.6).
Other outcome measures
Patient satisfaction with treatment outcome
The instrument used to assess the level of satisfaction of the women with their treatment outcome was not reported. However, the pattern of more women improved immediately after treatment, but not three months later, was repeated; details are available in Analysis 3.7).
Number of women requiring further treatment (relapse)
After completion of the 12‐week treatment, women were followed for approximately three years. A similar number of women had sought further treatment such as surgical intervention or drug therapy among those who received PFMT in combination with bladder training and the control (bladder training alone).. No statistically significant difference was found in the estimated size of treatment effect (18/48 (38%) versus 19/48 (40%); RR 0.95, 95% CI 0.57 to 1.57; Analysis 3.8)
C Electrical or magnetic interventions
4. PFMT added to electrical stimulation versus electrical stimulation alone (excluding implanted electrodes)
Three small trials investigated the effects of this comparison in women with SUI (Bezerra 2009 (N = 48); Hofbauer 1990 (N = 43); Jeyaseelan 2002 (N = 19)) . However, Jeyaseelan 2002 provided no useable data.
Bezerra 2009 and Hofbauer 1990 reported the following outcomes of interest:
Primary outcome measures
Number of women 'cured' or 'improved' (as reported by the women)
The number of women 'cured' was reported by Hofbauer 1990 only. Cure was self reported by the women and was defined as the proportion of women who became continent (free of symptoms of urinary incontinence) at a specified point after treatment onset. The trial was too small to detect statistically significant differences in cure rates between women who received PFMT added to electrical stimulation and those who were given electrical stimulation alone (3/11 versus 1/11; RR 3.00, 95% CI 0.37 to 24.58; Analysis 4.1).
Both Bezerra 2009 and Hofbauer 1990 reported the number of women 'improved'. Improvement was also self reported, but the success threshold was not defined. Again, there was no statistically significant difference in the estimated size of the treatment effect between the two intervention groups (9/26 versus 5/30; RR 2.06, 95% CI 0.79 to 5.38; ; Analysis 4.2).
Other outcome measure
Patient satisfaction with treatment outcome
This outcome was reported by Bezerra 2009 only. There was no statistically significant difference in the proportion of women satisfied with their treatment outcome between the two treatment groups either immediately after treatment (RR 0.84, 95% CI 0.47 to 1.52; Analysis 4.3), or 12 months after treatment (RR 0.99, 95% CI 0.48 to 2.02; Analysis 4.3)
Jeyaseelan 2002 reported the following outcomes of interest:
Primary outcome measures
Condition‐specific quality of life
Condition‐specific quality of life was assessed at endpoint using two scales: Incontinence Impact Questionnaire (IIQ) and Urogenital Distress Inventory (UDI). Further details about these tools or the interpretation of scores were not given, and data were reported in medians and ranges. Women who received PFMT added to electrical stimulation had lower median scores (better) than those who received electrical stimulation alone on both instruments: IIQ: ‐27 (‐63 to 0) versus 7 (‐50 to 150); UDI: ‐32 (‐50 to 18) versus ‐28 (‐86 to 22).
Secondary outcome measures
Objective assessment of improvement on pad test
Women who received PFMT added to electrical stimulation had lower median pad weights compared to those who received electrical stimulation alone: ‐53 (‐77 to ‐23) versus 39 (‐39 to 29), implying less urine loss.
Frequency of incontinence episodes
Details about how this outcome was measured were not reported. However, women who received a combination of PFMT and electrical stimulation had fewer median episodes of urine leakage compared to those who were treated with electrical stimulation alone: ‐58 (‐100 to ‐50) versus ‐36 (‐58 to 166).
5. PFMT added to magnetic stimulation versus magnetic stimulation alone
This comparison was not investigated by any of the included trials. We have added summary of findings Table 5 to highlight lack of evidence.
D Mechanical interventions
6. PFMT added to pessaries versus pessaries alone
Only one trial with 446 participants reported a number of outcomes on the effects of adding PFMT to continence pessary versus continence pessary alone, for women with SUI (Richter 2010).
Primary outcome measures
Number of women cured or improved (as reported by the women)
Cure or improvement rate was assessed using the seven‐day bladder diary and success (improvement) was defined as the proportion of women who had 75% or greater reduction in frequency of incontinence episodes per week. Assessment was carried out at three, six and 12 months after the start of treatment (but data were only available at three and 12 months). The result indicated that there were no statistically significant differences in cure or improvement rates between women who received PFMT added to continence pessaries and those who were treated with pessaries alone either at six months (80/132 versus 69/110; RR 0.97, 95% CI 0.79 to 1.18; Analysis 6.1.1), or at 12 months (52/111 versus 51/96; RR 0.88, 95% CI 0.67 to 1.16; Analysis 6.1.2) after the start of treatment.
Symptom‐ and condition‐specific quality of life
This outcome was assessed at three and 12 months after the onset of intervention. The instrument used was the Urogenital Distress Inventory stress incontinence sub‐scale of the Pelvic Floor Distress Inventory, a validated tool that measures the impact of pelvic floor disorders on the quality of life of women (Barber 2001). On this scale, success was defined as the proportion of women without 'bothersome' stress incontinence symptoms. For more details, see the Characteristics of included studies table. There were no statistically significant differences in the estimated size of treatment effect between the two intervention groups either at three months (RR 1.12, 95% CI 0.86 to 1.47; Analysis 6.2.1), or at 12 months (RR 0.81, 95% CI 0.62 to 1.08; Analysis 6.2.2) post‐randomisation.
Patient global impression of improvement
This outcome was assessed at three, six and 12 months post‐randomisation, using the validated Patient Global Impression of Improvement (PGI‐I) Questionnaire. The validity and reliability of this instrument have been established by Yalcin and colleague (Yalcin 2003). Success was defined as the proportion of women with a response of 'much better' or 'very much better' on this scale. There were no statistically significant differences in the women's global impression of improvement between the two intervention groups at any of the endpoints: three months (RR 1.13, 95% CI 0.91 to 1.41; Analysis 6.3.1), six months (RR 1.00, 95% CI 0.78 to 1.30; Analysis 6.3.2) or 12 months (RR 0.90, 95% CI 0.67 to 1.21; Analysis 6.3.3).
Other outcome measure
Patient satisfaction with treatment outcome
This was assessed at three, six and 12 months after the start of treatment using the Patient Satisfaction Question, which has been found to be valid and reliable in assessing the extent to which women were satisfied with treatment (Burgio 2006). Success criteria were not reported. Analysis of data showed that there were no statistically significant differences in satisfaction between women who were treated with PFMT added to continence pessary and those who received continence pessary alone with approximately equal proportions of women in each treatment group reporting the same level of satisfaction at each time point: three months (118/132 versus 94/110; RR 1.05, 95% CI 0.95 to 1.15; Analysis 6.4.1); six months (104/123 versus 87/102; RR 0.99, 95% CI 0.89 to 1.11; Analysis 6.4.2); and 12 months (81/111 versus 75/96; RR 0.93, 95% CI 0.80 to 1.09; Analysis 6.4.3).
E Drug interventions
Each drug was tested only in single trials.
7. Duloxetine
One trial with 201 participants reported a number of outcomes on the benefits of adding PFMT to duloxetine therapy for women with SUI (Ghoniem 2005). The trial was too small to assess differences in outcomes reliably, and the confidence intervals were wide.
Primary outcome measures
Number of women cured or improved (as reported by the women)
Cure or improvement was assessed from the paper diaries completed by the women at the endpoint of treatment. Success was defined as the proportion of women who had 50% or greater reduction in the frequency of incontinence episodes per week. There were no statistically significant differences in the estimated size of treatment effect between women who were treated with PFMT added to duloxetine and those who received duloxetine alone (RR 1.09, 95% CI 0.77 to 1.53; Analysis 7.2.1).
Symptom‐ and condition‐specific quality of life
This outcome was assessed at the endpoint of treatment, using the Incontinence Quality of Life (I‐QoL) Questionnaire. The validity of this instrument has been established by Patrick and colleagues (Patrick 1999). Scores were assigned to different domains of the questionnaire and mean (SD) scores calculated. Higher scores mean less symptom impact on the quality of life (better). The results indicated that there were no statistically significant differences in this outcome between the two intervention groups (MD 5.84, 95% CI ‐2.08 to 13.76; Analysis 7.3.1).
Patient global impression of improvement
Patient global impression of improvement was determined within the first three months after randomisation, using the validated Patient Global Impression of Improvement (PGI‐I) Questionnaire (Yalcin 2003). Success was defined as the number of women with a PGI‐I score in one of the three 'better' categories, that is, 'very much better', 'much better' or 'a little better'. The estimated size of treatment effect was not statistically significant between the women who received a combined PFMT and duloxetine and those who received duloxetine alone (RR 1.31, 95% CI 0.96 to 1.78; Analysis 7.4.1).
Secondary outcome measures
Frequency of incontinence episodes per week
This outcome was determined three months after randomisation using paper diaries completed by the women. No statistically significant differences in outcome were detected between the two intervention groups (MD 0.31, 95% CI ‐3.55 to 4.17; Analysis 7.5.1).
Number of continence pads used per week
This outcome was computed for each intervention group at the endpoint of treatment. There were no statistically significant differences in number of continence pads used between women who received a combination of PFMT and duloxetine and those who were given duloxetine alone (MD 0.61, 95% CI ‐2.18 to 3.40; Analysis 7.9).
8. Oxybutynin
One small trial investigated the effects of adding PFMT to oxybutynin treatment for women with urgency predominant urinary incontinence (Burgio 2010a). The following outcomes were reported and contributed data to the comparison.
Primary outcome measures
Patient global impression of improvement
One trial addressed this outcome three months after randomisation, using the validated Patient Global Impression of Improvement (PGI‐I) Questionnaire (Burgio 2006; Yalcin 2003). Success was defined as the proportion of women who felt 'much better' at endpoint. Analysis of data showed that there was no statistically significant difference in the estimated size of treatment effect between the two intervention groups (RR 0.86, 95% CI 0.68 to 1.09; Analysis 7.4.2).
Secondary outcome measures
Frequency of incontinence episodes per week
This outcome was measured at three months and at 12 months post‐randomisation, using the seven‐day bladder diary. Women were more likely to be incontinent with PFMT in combination with oxybutynin versus those who were treated with oxybutynin alone, but this did not reach statistical significance within either the first three months (MD 0.40, 95% CI ‐2.52 to 3.32; Analysis 7.5.2) or at 12 months (MD 2.80, 95% CI ‐2.19 to 7.79; Analysis 7.6.1) post‐randomisation.
Frequency of micturitions per 24 hours
Although women emptied their bladders more often in the combined treatment group, this difference did not reach statistical significance at the end of treatment (MD 0.20, 95% CI ‐1.11 to 1.51; Analysis 7.7.1).
Volume of urine per micturition
For this outcome, higher volumes of urine per void means better treatment effect. Women tended to have higher volumes on the drug alone, but this did not differ significantly between the two intervention groups when subjected to statistical analysis and the difference was only 16 ml (MD ‐16.30, 95% CI ‐73.77 to 41.17; Analysis 7.8.1).
Other outcome measures
Patient satisfaction with treatment outcome
The validated Patient Satisfaction Questionnaire was used to assess each woman's level of satisfaction with her treatment outcome at endpoint (Burgio 2006). The number of women who were 'completely satisfied' with their treatment outcome was determined. Analysis of data showed that although more women were satisfied with the drug alone, there were no statistically significant differences in the estimated size of treatment effect between the two intervention groups (RR 0.89, 95% CI 0.70 to 1.14; Analysis 7.11.1).
9. Solifenacin
One trial contributed data towards the analysis of the effects of adding PFMT to solifenacin treatment for women with over‐active bladder (Jin 2012). Only one of the reported outcomes had usable data, that is, treatment adverse effects, a secondary outcome measure (Analysis 7.10). Adverse effects were assessed with respect to the side effects of solifenacin, a treatment taken by both intervention groups. No statistically significant differences were found in adverse effects due to treatment between women who were treated with combined PFMT and solifenacin treatment and those who received solifenacin treatment alone (RR 0.84, 95% CI 0.45 to 1.60; Analysis 7.10.1).
10. Clenbuterol
One small trial compared the effects of combined PFMT and clenbuterol treatment with clenbuterol treatment alone for women with SUI (Ishiko 2000) .
Primary outcome measure
Number of women cured (as reported by the women)
Cure rate was defined as the proportion of women who reported 100% reduction in symptoms of urinary incontinence at the end of treatment. There were no statistically significant differences in reports of self reported cure between the two intervention groups (RR 1.16, 95% CI 0.83 to 1.63; Analysis 7.1.1).
Other outcome measures
Women's satisfaction with treatment outcome
The scale used in measuring this outcome was not specified. The trial was too small to identify significant differences in the number of women who were satisfied with either treatment (Analysis 7.11.2).
11. Other drugs (unspecified)
One very small trial tested the effects of adding PFMT to an unspecified drug therapy for women with overactive bladder (Chen 2008).
Other outcome measures
Treatment benefits
Treatment benefits were assessed using the Benefit Questionnaire (further detail was not reported). More women reported that they benefited from combined treatment in the intervention group compared to the control group treated with the drug alone: 11/15, 73% versus 4/14, 29%. This result was statistically significant (RR 2.57, 95% CI 1.06 to 6.20; Analysis 7.12.1).
F Surgical interventions
12. PFMT prior to surgical intervention (e.g. tension‐free vaginal tape (TVT)) versus surgical intervention alone
This comparison was not tested by any of the included trials. We have added summary of findings Table 8 to highlight lack of evidence.
G Other interventions
13. PFMT + heat and steam generating sheet versus heat and steam generating sheet alone
This comparison was tested by one trial in women with UUI or MUI (Kim 2011). The trialists hypothesised that the heat and steam generating sheet (HSGS) would reduce incontinent episodes by heating the abdominal and lower back, which in turn might result in positive effects on renal function, such as, suppression of the activity of renal sympathetic nerves and promotion of bladder emptying. Details about the heat and steam generating sheet are available in the Characteristics of included studies table.
Primary outcome measures
Number of women cured (as reported by the women)
Cure was assessed by interview and success was defined as the proportion of women with complete cessation of urine loss episodes at the end of treatment. Analysis of data indicated that more women were cured in the intervention group (PFMT added to HSGS) compared to the comparison group (HSGS alone): 19/37, 51% versus 8/37, 22%. This result was statistically significant (RR 2.38, 95% CI 1.19 to 4.73; Analysis 9.1.1).
Discussion
This is an updated version of a Cochrane review on the effects of adding pelvic floor muscle training (PFMT) to another active treatment versus the same active treatment alone, for urinary incontinence in women (Ayeleke 2013), and should be considered in the context of the other Cochrane reviews on pelvic floor muscle training (Boyle 2012; Dumoulin 2014; Hay‐Smith 2011; Herbison 2013; Herderschee 2011). The review examines whether the addition of PFMT to another active treatment is more beneficial than the same active treatment alone, for the treatment of women with urinary incontinence.
Summary of main results
Is PFMT added to another active treatment more effective than the same active treatment alone?
This question was addressed by 13 trials (Bezerra 2009; Burgio 2010a; Chen 2008; Ghoniem 2005; Hofbauer 1990; Ishiko 2000; Jeyaseelan 2002; Jin 2012; Kaya 2015; Kim 2011; Richter 2010; Wise 1993; Wyman 1998). We classified the primary and secondary outcomes, as defined earlier, as 'critical', 'important' or 'not important' for decision making from the woman's perspective. Seven outcomes from the comparisons were considered to be 'critical'; we applied the GRADE approach to determine the quality of evidence associated with these outcomes. The results are presented in the 'Summary of findings' tables.
Vaginal cones
The additional effects of adding PFMT to vaginal cones was examined by Wise and colleagues in women with stress urinary incontinence (SUI; Wise 1993). Although more women were either cured or improved with combined PFMT and vaginal cones than the control on objective assessment of urine leakage, this difference was not statistically significant (Analysis 1.1). The 12‐week PFMT was potentially too short and not adequately described to decide whether the exercise dose was theoretically sufficient. Adherence was not reported. We considered the quality of the evidence to be very low for the objective measure of urine leakage (pad test), when adopting the GRADE approach;none of the other outcomes which we considered critical for decision‐making were reported (summary of findings Table for the main comparison).
Bladder training
The addition of PFMT to bladder training in women with SUI, urgency urinary incontinence (UUI) or mixed urinary incontinence (MUI) did not result in a statistically significant difference in the number of women cured either immediately after treatment (three months after randomisation; Analysis 3.1.1) or at three months after intervention (six months after randomisation; Analysis 3.1.2; Kaya 2015; Wyman 1998). There was no statistically significant benefit from adding PFMT to bladder training on the quality of life at three months after intervention (Analysis 3.4.2). A similar number of women (around 40%) who received PFMT added to bladder training versus bladder training alone required further treatments at approximately three years after treatment.. The description of the 12‐week PFMT programme in Wyman 1998 suggested it could theoretically increase strength, endurance and co‐ordination, although it was probably of insufficient duration for muscle strengthening. Training adherence was not reported. We judged the quality of evidence to be very low for the three reported critical outcomes, when adopting the GRADE approach; none of the other four outcomes which we considered critical for decision‐making from the patient's perspective were reported (summary of findings Table 3).
Electrical stimulation
Adding PFMT to electrical stimulation in women with SUI did not result in a statistically significant difference in the cure or improvement rates (Bezerra 2009; Hofbauer 1990). The content of PFMT was not described, and at six weeks duration (Hofbauer 1990), or 24 sessions (Bezerra 2009), it was probably insufficient to maximise any possible training effect. Adherence was not reported. We considered the quality of the evidence to be very low for the number of women either cured or improved, when adopting the GRADE approach; none of the other outcomes which we considered critical for decision‐making were reported (summary of findings Table 4).
Continence pessary
The addition of PFMT to a continence pessary did not result in statistically significant benefits in women with SUI in terms of the number of women cured or improved (Analysis 6.1.2) or the impact of urinary incontinence on the quality of life (Analysis 6.2.2) at 12 months after treatment (Richter 2010). At eight weeks duration, the incompletely described PFMT programme (that included stress and urgency strategies) was probably insufficient to maximise any possible training effect, and adherence was not reported. We considered the quality of the evidence to be moderate for the number of women cured or improved (subjective) at 12 months and condition‐specific quality of life at 12 months, when adopting the GRADE approach; none of the other outcomes which we considered critical for decision‐making were reported (summary of findings Table 6).
Drug treatment
The benefits of adding PFMT to drug treatment did not show any statistically significant difference between the experimental (PFMT plus drug) and the control (drug alone) groups. There was no statistically significant difference in the number of women cured when adding PFMT to clenbuterol (Ishiko 2000). The 12‐week PFMT programme was potentially too short and not adequately described to decide whether the exercise dose was theoretically sufficient, and adherence was not reported. Similarly, the addition of PFMT to duloxetine did not result in a statistically significant better outcome in the domain of symptom‐ and condition‐specific quality of life (Ghoniem 2005). The description of the 12‐week PFMT programme suggested it could theoretically increase strength, endurance and co‐ordination, although it was probably of insufficient duration for muscle strengthening. In addition, training adherence was not reported. The quality of the evidence was low for condition‐specific quality of life on the I‐QoL Questionnaire, and very low for the number of women cured and the number of women reporting adverse events,when adopting the GRADE methodology; none of the other outcomes which we considered critical for decision‐making were reported (summary of findings Table 7).
Other active treatments
The additional benefits of PFMT over and above a heat and steam generating sheet (HSGS) were investigated by Kim and colleagues (Kim 2011). More women were cured in the combined PFMT and HSGS group compared to the HSGS alone group and this result was statistically significant (Analysis 9.1.1). The description of the 12‐week PFMT programme suggested it could theoretically increase strength and endurance, but this duration was probably insufficient for muscle strengthening. Training adherence was not reported. We considered the effect estimate to be of moderate quality when adopting the GRADE approach (summary of findings Table 9).
Problems with pelvic floor muscle training regimens
In most of the included trials, the absence of additional effects of PFMT over and above the active treatment alone might have been due to a number of factors. Of particular concern was the difficulty in evaluating the potential effectiveness of the PFMT intervention, the obvious inadequacy of the exercise dose offered to women, or both. All but three of the trials gave insufficient detail of the PFMT programme, or the PFMT programme was too short for muscle strengthening, suggesting that the exercise dose was not sufficient for treatment effect. Wyman, Kim and Ghoniem described PFMT programmes that might theoretically strengthen pelvic floor muscles (although in all three trials the treatment duration of 12 weeks was probably too short to establish muscle hypertrophy). It is also worth considering whether participants might have regarded the addition of PFMT as an additional treatment burden and thus either carried it out suboptimally or abandoned it altogether. None of the trials reported training adherence, which further compromises the ability to appraise the potential effectiveness of the PFMT intervention.
However, a likely explanation is that all the trials were too small (and hence underpowered) to detect statistically significant differences between the interventions.
Overall completeness and applicability of evidence
Three of the pre‐specified objectives (interventions) were not investigated by any of the included trials (PFMT with lifestyle intervention versus lifestyle intervention alone, PFMT with magnetic stimulation versus magnetic stimulation alone and PFMT prior to surgical intervention versus surgical intervention alone). The remaining pre‐specified comparisons were each addressed by single trials, except PFMT added to bladder training versus bladder training alone, which was reported by two trials (Kaya 2015; Wyman 1998) and PFMT plus electrical stimulation versus electrical stimulation alone, which was investigated by three trials (Bezerra 2009; Hofbauer 1990; Jeyaseelan 2002).
Jeyaseelan 2002 reported results using median and range, so the results were not included in the meta‐analysis. Therefore, it was not possible to improve the power for most of the comparisons. Some of the trialists used combinations of interventions with no regard to the types of urinary incontinence, and this might have influenced the results of the reported outcomes, e.g. combining PFMT and anticholinergics (without the appropriate 'dose' or 'doses') for women with UUI or urgency predominant urinary incontinence, when PFMT has been shown to work better for women with SUI or MUI (Dumoulin 2014).
None of the included trials reported any data on socioeconomic implications of the intervention, while only one trial reported data in a usable form on long‐term follow‐up (Wyman 1998). Also, only one trial, evaluating PFMT added to drug therapy, provided information about treatment adverse events, with respect to the side effects of the drug therapy (Jin 2012); none of the included trials reported data on adverse events associated with the PFMT regimen, thereby making it very difficult for us to evaluate the safety of PFMT. Treatment adherence, which might impact other outcome measures, was not reported in a usable form by any of the included trials and therefore, not analysed.
Quality of the evidence
Trial quality and methodological assessment
Methodological assessment plays a crucial role in determining the quality of the evidence supporting the estimated size of treatment effects of any intervention. In this review, we assessed the methodological flaws of the included trials, using the reports of the trials. Therefore, our judgement of methodological quality and hence the quality of effect estimates was influenced by the quality of reporting.
Five trials were published as conference abstracts, with few details on study designs, methods or data, thereby, making it difficult to assess their methodological quality (Bezerra 2009; Chen 2008; Jeyaseelan 2002; Jin 2012; Wise 1993). Of the 13 included trials, only three gave detailed descriptions of the randomisation process for the review authors to be sure there was adequate sequence generation and allocation concealment (Ghoniem 2005; Kaya 2015; Richter 2010). Thus, we judged them to be at low risk with respect to selection bias. A key challenge of the intervention in this review is that given the nature of PFMT, it was difficult to blind the participants or treatment providers to group allocation (performance bias). With regard to detection bias, outcome assessors were adequately blinded in only one of the included trials (Richter 2010).
In the domain of attrition bias, the rates of withdrawals and losses to follow‐up were high in some of the included trials, but with small differences in rates within treatment groups. In terms of size, most of the included trials were small, meaning that a high attrition rate would result in under‐powering of the trials and hence the occurrence of type II error (false negative results). A common problem with most of the included trials was incomplete reporting, particularly with respect to the trial methods and data. Thus, we assessed some domains of the risk of bias as 'unclear' due to incomplete reporting of methods.
In this review, the estimated sizes of treatment effects were generally small and therefore the quality of the evidence was not upgraded for any of the outcomes. However, the quality of the body of evidence was downgraded if we considered the randomisation process (sequence generation and allocation concealment) of the trial to be inadequate, if the effect estimate crossed the line of 'no effect' by 25% or 50% on either side (that is, effect estimate with a wide confidence interval), or both.
Potential biases in the review process
We searched all the important databases and imposed no language restriction in the course of the search. However, we were mindful of the fact that these databases might not have contained all the potentially eligible trials.
Agreements and disagreements with other studies or reviews
We identified one systematic review in the 5th edition of the International Consultation on Incontinence (ICI), which addressed the effects of adding PFMT to other active treatment versus the same active treatment alone (Moore 2013). Moore and colleagues included eight trials (Burgio 2008; Burgio 2010a; Ghoniem 2005; Hofbauer 1990; Ishiko 2000; Wilson 1998; Wise 1993; Wyman 1998), six of which were also included in this review (Burgio 2010a; Ghoniem 2005; Hofbauer 1990; Ishiko 2000; Wise 1993; Wyman 1998). One trial (Wilson 1998) was not included in this review as the participants were postpartum women; whereas the other trial was excluded because the behavioural intervention consisted of PFMT in addition to delayed voiding to increase voiding intervals, and individualised fluid management, which we considered as active treatments on their own (Burgio 2008). Moore's review did not include seven trials which were included in this review (Bezerra 2009; Chen 2008; Jeyaseelan 2002; Jin 2012; Kaya 2015; Kim 2011; Richter 2010). Overall, the findings of the review conducted by Moore and colleagues are in agreement with those of this review (Moore 2013).

PRISMA study flow diagram.

'Risk of bias' graph: review authors' judgements about each risk of bias item presented as percentages across all included studies.

'Risk of bias' summary: review authors' judgements about each risk of bias domain for each included study.

Comparison 1 PFMT added to vaginal cones versus vaginal cones alone, Outcome 1 Number of women cured or improved (objective assessment).

Comparison 3 PFMT added to bladder training versus bladder training alone, Outcome 1 Number of women cured.

Comparison 3 PFMT added to bladder training versus bladder training alone, Outcome 2 Number of women cured or improved.

Comparison 3 PFMT added to bladder training versus bladder training alone, Outcome 3 Condition‐specific quality of life on IIQ‐R.

Comparison 3 PFMT added to bladder training versus bladder training alone, Outcome 4 Condition‐specific quality of life on UDI.

Comparison 3 PFMT added to bladder training versus bladder training alone, Outcome 5 Number of women cured or improved using patient global impression of improvement.

Comparison 3 PFMT added to bladder training versus bladder training alone, Outcome 6 Incontinence episode per week.

Comparison 3 PFMT added to bladder training versus bladder training alone, Outcome 7 Patient satisfaction with treatment outcome.

Comparison 3 PFMT added to bladder training versus bladder training alone, Outcome 8 Number of women requiring further treatment (relapse).

Comparison 4 PFMT added to electrical stimulation versus electrical stimulation alone (excluding implanted electrodes), Outcome 1 Number of women cured.

Comparison 4 PFMT added to electrical stimulation versus electrical stimulation alone (excluding implanted electrodes), Outcome 2 Number of women cured or improved.

Comparison 4 PFMT added to electrical stimulation versus electrical stimulation alone (excluding implanted electrodes), Outcome 3 Patient satisfaction with treatment outcome.

Comparison 6 PFMT added to continence pessary versus continence pessary alone, Outcome 1 Number of women cured or improved.

Comparison 6 PFMT added to continence pessary versus continence pessary alone, Outcome 2 Condition‐specific quality of life on UDI.

Comparison 6 PFMT added to continence pessary versus continence pessary alone, Outcome 3 Number of women improved using patient global impression of improvement.

Comparison 6 PFMT added to continence pessary versus continence pessary alone, Outcome 4 Patient satisfaction with treatment outcome.

Comparison 7 PFMT added to drug therapy versus drug therapy alone, Outcome 1 Number of women cured.
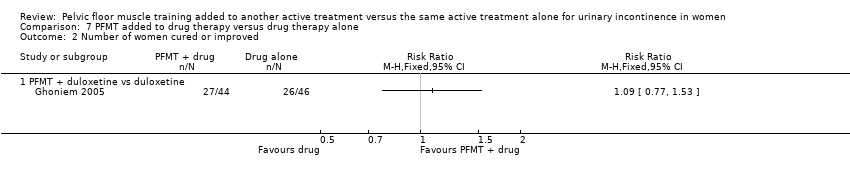
Comparison 7 PFMT added to drug therapy versus drug therapy alone, Outcome 2 Number of women cured or improved.

Comparison 7 PFMT added to drug therapy versus drug therapy alone, Outcome 3 Condition‐specific quality of life on I‐QoL questionnaire.

Comparison 7 PFMT added to drug therapy versus drug therapy alone, Outcome 4 Number of women improved on patient global impression of improvement in first 3 months.
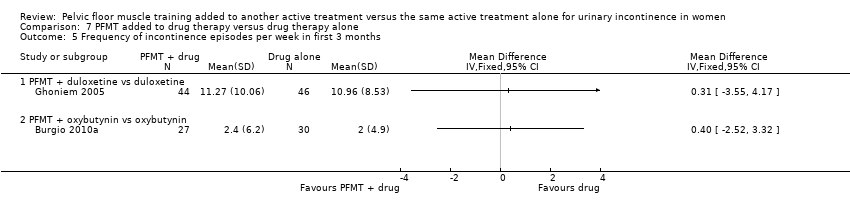
Comparison 7 PFMT added to drug therapy versus drug therapy alone, Outcome 5 Frequency of incontinence episodes per week in first 3 months.

Comparison 7 PFMT added to drug therapy versus drug therapy alone, Outcome 6 Frequency of incontinence episodes per week at 12 months.

Comparison 7 PFMT added to drug therapy versus drug therapy alone, Outcome 7 Frequency of micturitions per 24 hours.

Comparison 7 PFMT added to drug therapy versus drug therapy alone, Outcome 8 Volumes of urine per micturition.

Comparison 7 PFMT added to drug therapy versus drug therapy alone, Outcome 9 Number of continence pads used per week.

Comparison 7 PFMT added to drug therapy versus drug therapy alone, Outcome 10 Treatment adverse events.

Comparison 7 PFMT added to drug therapy versus drug therapy alone, Outcome 11 Patient satisfaction with treatment outcome in first 3 months.

Comparison 7 PFMT added to drug therapy versus drug therapy alone, Outcome 12 Treatment benefit.

Comparison 9 PFMT added to other treatment versus other treatment alone, Outcome 1 Number of women cured.
| PFMT added to vaginal cones versus vaginal cones alone for urinary incontinence in women | ||||||
| Patient or population: women with urinary incontinence | ||||||
| Outcomes | Illustrative comparative risks* (95% CI) | Relative effect | No of participants | Quality of the evidence | Comments | |
| Assumed risk | Corresponding risk | |||||
| Control | PFMT added to vaginal cones versus vaginal cones alone | |||||
| Number of women cured or improved (subjective) ‐ not reported | Not estimable | Not reported | ||||
| Number of women reporting incontinence at 1 year or more after treatment (subjective) ‐ not reported | Not estimable | Not reported | ||||
| Objective measure of urine leakage (pad test) | Study population | RR 1.27 | 34 | ⊕⊝⊝⊝ | ||
| 737 per 1000 | 936 per 1000 | |||||
| Number of women experiencing pain ‐ not reported | Not estimable | Not reported | ||||
| Condition‐specific quality of life assessed by patient questionnaire such as Incontinence Impact Questionnaire (IIQ), King's Health Questionnaire (KHQ) ‐ not reported | Not estimable | Not reported | ||||
| General health status evaluation e.g. Short Form (SF)‐36 ‐ not reported | Not estimable | Not reported | ||||
| Number of women requiring further treatment such as surgery, drugs, mechanical devices (relapse) ‐ not reported | Not estimable | Not reported | ||||
| *The basis for the assumed risk (e.g. the median control group risk across studies) is provided in footnotes. The corresponding risk (and its 95% confidence interval) is based on the assumed risk in the comparison group and the relative effect of the intervention (and its 95% CI). | ||||||
| GRADE Working Group grades of evidence | ||||||
| 1Random sequence generation and allocation concealment unclear. | ||||||
| PFMT added to lifestyle intervention versus lifestyle intervention alone for urinary incontinence in women | ||||||
| Patient or population: women with urinary incontinence | ||||||
| Outcomes | Illustrative comparative risks* (95% CI) | Relative effect | No of participants | Quality of the evidence | Comments | |
| Assumed risk | Corresponding risk | |||||
| Control | PFMT added to lifestyle intervention versus lifestyle intervention alone | |||||
| Number of women cured or improved (subjective) ‐ not reported | Not estimable | Not reported | ||||
| Number of women reporting incontinence at 1 year or more after treatment (subjective) ‐ not reported | Not estimable | Not reported | ||||
| Objective measure of urine leakage (e.g. pad test) ‐ not reported | Not estimable | Not reported | ||||
| Number of women reporting adverse events ‐ not reported | Not estimable | Not reported | ||||
| Condition‐specific quality of life ‐ not reported | Not estimable | Not reported | ||||
| General health status evaluation e.g. Short Form (SF)‐36 ‐ not reported | Not estimable | Not reported | ||||
| Number of women requiring further treatment such as surgery, drugs, mechanical devices (relapse) ‐ not reported | Not estimable | Not reported | ||||
| *The basis for the assumed risk (e.g. the median control group risk across studies) is provided in footnotes. The corresponding risk (and its 95% confidence interval) is based on the assumed risk in the comparison group and the relative effect of the intervention (and its 95% CI). | ||||||
| GRADE Working Group grades of evidence | ||||||
| PFMT added to bladder training versus bladder training alone for urinary incontinence in women | ||||||
| Patient or population: women with urinary incontinence | ||||||
| Outcomes | Illustrative comparative risks* (95% CI) | Relative effect | No of participants | Quality of the evidence | Comments | |
| Assumed risk | Corresponding risk | |||||
| Control | PFMT added to bladder training versus bladder training alone | |||||
| Number of women cured ‐ 3 months after treatment | Study population | RR 1.71 | 122 | ⊕⊝⊝⊝ | ||
| 159 per 1000 | 271 per 1000 | |||||
| Number of women reporting incontinence at 1 year or more after treatment (subjective) ‐ not reported | Not estimable | Not reported | ||||
| Objective measure of urine leakage (e.g. pad test) ‐ not reported | Not estimable | Not reported | ||||
| Number of women experiencing pain ‐ not reported | Not estimable | Not reported | ||||
| Condition‐specific quality of life ‐ 3 months after treatment | The mean condition‐specific quality of life ‐ 3 months after treatment in the intervention groups was 5.9 lower (35.53 lower to 23.73 higher) | 118 | ⊕⊝⊝⊝ | lower scores imply lower impact of incontinence on quality of life | ||
| General health status evaluation e.g. Short Form (SF)‐36 ‐ not reported | Not estimable | Not reported | ||||
| Number of women requiring further treatment such as surgery, drugs, mechanical devices (relapse) | 396 per 1000 | 376 per 1000 | RR 0.95 | 96 | ⊕⊝⊝⊝ | |
| *The basis for the assumed risk (e.g. the median control group risk across studies) is provided in footnotes. The corresponding risk (and its 95% confidence interval) is based on the assumed risk in the comparison group and the relative effect of the intervention (and its 95% CI). | ||||||
| GRADE Working Group grades of evidence | ||||||
| 1Random sequence generation and allocation concealment is unclear. | ||||||
| PFMT added to electrical stimulation versus electrical stimulation alone (excluding implanted electrodes) for urinary incontinence in women | ||||||
| Patient or population: women with urinary incontinence | ||||||
| Outcomes | Illustrative comparative risks* (95% CI) | Relative effect | No of participants | Quality of the evidence | Comments | |
| Assumed risk | Corresponding risk | |||||
| Control | PFMT added to electrical stimulation versus electrical stimulation alone (excluding implanted electrodes) | |||||
| Number of women cured | Study population | RR 2.06 | 56 | ⊕⊝⊝⊝ | ||
| 167 per 1000 | 343 per 1000 | |||||
| Number of women reporting incontinence at 1 year or more after treatment (subjective) ‐ not reported | Not estimable | Not reported | ||||
| Objective measure of urine leakage (e.g. pad test) ‐ not reported | Not estimable | Not reported | ||||
| Number of women experiencing pain ‐ not reported | Not estimable | Not reported | ||||
| Condition‐specific quality of life assessed by patient questionnaire such as Incontinence Impact Questionnaire (IIQ), King's Health Questionnaire (KHQ) ‐ not reported | Not estimable | Not reported | ||||
| General health status evaluation e.g. Short Form (SF)‐36 ‐ not reported | Not estimable | Not reported | ||||
| Number of women requiring further treatment such as surgery, drugs, mechanical devices (relapse) ‐ not reported | Not estimable | Not reported | ||||
| *The basis for the assumed risk (e.g. the median control group risk across studies) is provided in footnotes. The corresponding risk (and its 95% confidence interval) is based on the assumed risk in the comparison group and the relative effect of the intervention (and its 95% CI). | ||||||
| GRADE Working Group grades of evidence | ||||||
| 1Random sequence generation and allocation concealment unclear. | ||||||
| PFMT added to magnetic stimulation versus magnetic stimulation alone for urinary incontinence in women | ||||||
| Patient or population: women with urinary incontinence | ||||||
| Outcomes | Illustrative comparative risks* (95% CI) | Relative effect | No of participants | Quality of the evidence | Comments | |
| Assumed risk | Corresponding risk | |||||
| Control | PFMT added to magnetic stimulation versus magnetic stimulation alone | |||||
| Number of women cured or improved (subjective) ‐ not reported | Not estimable | Not reported | ||||
| Number of women reporting incontinence at 1 year or more after treatment (subjective) ‐ not reported | Not estimable | Not reported | ||||
| Objective measure of urine leakage (e.g. pad test) ‐ not reported | Not estimable | Not reported | ||||
| Number of women reporting adverse events ‐ not reported | Not estimable | Not reported | ||||
| Condition‐specific quality of life assessed by patient questionnaire such as Incontinence Impact Questionnaire (IIQ), King's Health Questionnaire (KHQ) ‐ not reported | Not estimable | Not reported | ||||
| General health status evaluation e.g. Short Form (SF)‐36 ‐ not reported | Not estimable | Not reported | ||||
| Number of women requiring further treatment such as surgery, drugs, mechanical devices (relapse) ‐ not reported | Not estimable | Not reported | ||||
| *The basis for the assumed risk (e.g. the median control group risk across studies) is provided in footnotes. The corresponding risk (and its 95% confidence interval) is based on the assumed risk in the comparison group and the relative effect of the intervention (and its 95% CI). | ||||||
| GRADE Working Group grades of evidence | ||||||
| PFMT added to continence pessary versus continence pessary alone for urinary incontinence in women | ||||||
| Patient or population: women with urinary incontinence | ||||||
| Outcomes | Illustrative comparative risks* (95% CI) | Relative effect | No of participants | Quality of the evidence | Comments | |
| Assumed risk | Corresponding risk | |||||
| Control | PFMT added to continence pessary versus continence pessary alone | |||||
| Number of women cured or improved (subjective) at 12 months | Study population | RR 0.88 | 207 | ⊕⊕⊕⊝ | ||
| 531 per 1000 | 468 per 1000 | |||||
| Number of women reporting incontinence at 1 year or more after treatment (subjective) ‐ not reported | Not estimable | Not reported | ||||
| Objective measure of urine leakage (e.g. pad test) ‐ not reported | Not estimable | Not reported | ||||
| Number of women reporting adverse events ‐ not reported | Not estimable | Not reported | ||||
| Condition‐specific quality of life at 12 months | Study population | RR 0.81 | 207 | ⊕⊕⊕⊝ | ||
| 542 per 1000 | 439 per 1000 | |||||
| General health status evaluation e.g. Short Form (SF)‐36 ‐ not reported | Not estimable | Not reported | ||||
| Number of women requiring further treatment such as surgery, drugs, mechanical devices (relapse) ‐ not reported | Not estimable | Not reported | ||||
| *The basis for the assumed risk (e.g. the median control group risk across studies) is provided in footnotes. The corresponding risk (and its 95% confidence interval) is based on the assumed risk in the comparison group and the relative effect of the intervention (and its 95% CI). | ||||||
| GRADE Working Group grades of evidence | ||||||
| 1Wide confidence interval (0.67 to 1.16). | ||||||
| PFMT added to drug therapy versus drug therapy alone for urinary incontinence in women | ||||||
| Patient or population: women with urinary incontinence | ||||||
| Outcomes | Illustrative comparative risks* (95% CI) | Relative effect | No of participants | Quality of the evidence | Comments | |
| Assumed risk | Corresponding risk | |||||
| Control | PFMT added to drug therapy versus drug therapy alone | |||||
| Number of women cured ‐ PFMT + clenbuterol versus clenbuterol | Study population | RR 1.16 | 32 | ⊕⊝⊝⊝ | ||
| 769 per 1000 | 892 per 1000 | |||||
| Number of women reporting incontinence at 1 year or more after treatment (subjective) ‐ not reported | Not estimable | Not reported | ||||
| Objective measure of urine leakage (e.g. pad test) ‐ not reported | Not estimable | Not reported | ||||
| Number of women reporting adverse events | 207 per 1000 | 174 per 1000 | RR 0.84 | 162 | ⊕⊝⊝⊝ | |
| Condition‐specific quality of life on I‐QoL Questionnaire ‐ PFMT + duloxetine versus duloxetine | The mean condition‐specific quality of life on I‐QoL questionnaire ‐ PFMT + duloxetine versus duloxetine in the intervention groups was 5.84 higher | 101 | ⊕⊕⊝⊝ | Higher scores mean less symptom impact on the quality of life (better) | ||
| General health status evaluation e.g. Short Form (SF)‐36 ‐ not reported | Not estimable | Not reported | ||||
| Number of women requiring further treatment such as surgery, drugs, mechanical devices (relapse) ‐ not reported | Not estimable | Not reported | ||||
| *The basis for the assumed risk (e.g. the median control group risk across studies) is provided in footnotes. The corresponding risk (and its 95% confidence interval) is based on the assumed risk in the comparison group and the relative effect of the intervention (and its 95% CI). | ||||||
| GRADE Working Group grades of evidence | ||||||
| 1Random sequence generation and allocation concealment is unclear. | ||||||
| PFMT prior to surgical intervention versus surgical intervention alone for urinary incontinence in women | ||||||
| Patient or population: women with urinary incontinence | ||||||
| Outcomes | Illustrative comparative risks* (95% CI) | Relative effect | No of participants | Quality of the evidence | Comments | |
| Assumed risk | Corresponding risk | |||||
| Control | PFMT prior to surgical intervention versus surgical intervention alone | |||||
| Number of women cured or improved (subjective) ‐ not reported | Not estimable | Not reported | ||||
| Number of women reporting incontinence at 1 year or more after treatment (subjective) ‐ not reported | Not estimable | Not reported | ||||
| Objective measure of urine leakage (e.g. pad test) ‐ not reported | Not estimable | Not reported | ||||
| Number of women reporting adverse events ‐ not reported | Not estimable | Not reported | ||||
| Condition‐specific quality of life assessed by patient questionnaire such as Incontinence Impact Questionnaire (IIQ), King's Health Questionnaire (KHQ) ‐ not reported | Not estimable | Not reported | ||||
| General health status evaluation e.g. Short Form (SF)‐36 ‐ not reported | Not estimable | Not reported | ||||
| Number of women requiring further treatment such as surgery, drugs, mechanical devices (relapse) ‐ not reported | Not estimable | Not reported | ||||
| *The basis for the assumed risk (e.g. the median control group risk across studies) is provided in footnotes. The corresponding risk (and its 95% confidence interval) is based on the assumed risk in the comparison group and the relative effect of the intervention (and its 95% CI). | ||||||
| GRADE Working Group grades of evidence | ||||||
| PFMT added to HSGS versus HSGS alone for urinary incontinence in women | ||||||
| Patient or population: women with urinary incontinence | ||||||
| Outcomes | Illustrative comparative risks* (95% CI) | Relative effect | No of participants | Quality of the evidence | Comments | |
| Assumed risk | Corresponding risk | |||||
| Control | PFMT added to other versus other treatment alone | |||||
| Number of women cured | Study population | RR 2.38 | 74 | ⊕⊕⊕⊝ | ||
| 216 per 1000 | 515 per 1000 | |||||
| Number of women reporting incontinence at 1 year or more after treatment (subjective) ‐ not reported | Not estimable | Not reported | ||||
| Objective measure of urine leakage (e.g. pad test) ‐ not reported | Not estimable | Not reported | ||||
| Number of women experiencing pain ‐ not reported | Not estimable | Not reported | ||||
| Condition‐specific quality of life assessed by patient questionnaire such as Incontinence Impact Questionnaire (IIQ), King's Health Questionnaire (KHQ) ‐ not reported | Not estimable | Not reported | ||||
| General health status evaluation e.g. Short Form (SF)‐36 ‐ not reported | Not estimable | Not reported | ||||
| Number of women requiring further treatment such as surgery, drugs, mechanical devices (relapse) ‐ not reported | Not estimable | Not reported | ||||
| *The basis for the assumed risk (e.g. the median control group risk across studies) is provided in footnotes. The corresponding risk (and its 95% confidence interval) is based on the assumed risk in the comparison group and the relative effect of the intervention (and its 95% CI). | ||||||
| GRADE Working Group grades of evidence | ||||||
| 1Allocation concealment unclear. | ||||||
| Outcome or subgroup title | No. of studies | No. of participants | Statistical method | Effect size |
| 1 Number of women cured or improved (objective assessment) Show forest plot | 1 | Risk Ratio (M‐H, Fixed, 95% CI) | Totals not selected | |
| Outcome or subgroup title | No. of studies | No. of participants | Statistical method | Effect size |
| 1 Number of women cured Show forest plot | 1 | Risk Ratio (M‐H, Fixed, 95% CI) | Totals not selected | |
| 1.1 Immediately after treatment | 1 | Risk Ratio (M‐H, Fixed, 95% CI) | 0.0 [0.0, 0.0] | |
| 1.2 3 months after treatment | 1 | Risk Ratio (M‐H, Fixed, 95% CI) | 0.0 [0.0, 0.0] | |
| 2 Number of women cured or improved Show forest plot | 1 | Risk Ratio (M‐H, Fixed, 95% CI) | Totals not selected | |
| 2.1 Immediately after treatment | 1 | Risk Ratio (M‐H, Fixed, 95% CI) | 0.0 [0.0, 0.0] | |
| 2.2 3 months after treatment | 1 | Risk Ratio (M‐H, Fixed, 95% CI) | 0.0 [0.0, 0.0] | |
| 3 Condition‐specific quality of life on IIQ‐R Show forest plot | 1 | Mean Difference (IV, Fixed, 95% CI) | Totals not selected | |
| 3.1 Immediately after treatment | 1 | Mean Difference (IV, Fixed, 95% CI) | 0.0 [0.0, 0.0] | |
| 3.2 3 months after treatment | 1 | Mean Difference (IV, Fixed, 95% CI) | 0.0 [0.0, 0.0] | |
| 4 Condition‐specific quality of life on UDI Show forest plot | 1 | Mean Difference (IV, Fixed, 95% CI) | Totals not selected | |
| 4.1 Immediately after treatment | 1 | Mean Difference (IV, Fixed, 95% CI) | 0.0 [0.0, 0.0] | |
| 4.2 3 months after treatment | 1 | Mean Difference (IV, Fixed, 95% CI) | 0.0 [0.0, 0.0] | |
| 5 Number of women cured or improved using patient global impression of improvement Show forest plot | 2 | 354 | Risk Ratio (M‐H, Fixed, 95% CI) | 1.27 [1.14, 1.41] |
| 5.1 Immediately after treatment | 2 | 235 | Risk Ratio (M‐H, Fixed, 95% CI) | 1.29 [1.15, 1.45] |
| 5.2 3 months after treatment | 1 | 119 | Risk Ratio (M‐H, Fixed, 95% CI) | 1.21 [0.94, 1.55] |
| 6 Incontinence episode per week Show forest plot | 1 | Mean Difference (IV, Fixed, 95% CI) | Totals not selected | |
| 7 Patient satisfaction with treatment outcome Show forest plot | 1 | Risk Ratio (M‐H, Fixed, 95% CI) | Totals not selected | |
| 7.1 Immediately after treatment | 1 | Risk Ratio (M‐H, Fixed, 95% CI) | 0.0 [0.0, 0.0] | |
| 7.2 3 months after treatment | 1 | Risk Ratio (M‐H, Fixed, 95% CI) | 0.0 [0.0, 0.0] | |
| 8 Number of women requiring further treatment (relapse) Show forest plot | 1 | Risk Ratio (M‐H, Fixed, 95% CI) | Totals not selected | |
| Outcome or subgroup title | No. of studies | No. of participants | Statistical method | Effect size |
| 1 Number of women cured Show forest plot | 1 | Risk Ratio (M‐H, Fixed, 95% CI) | Totals not selected | |
| 2 Number of women cured or improved Show forest plot | 2 | 56 | Risk Ratio (M‐H, Fixed, 95% CI) | 2.06 [0.79, 5.38] |
| 3 Patient satisfaction with treatment outcome Show forest plot | 1 | 68 | Risk Ratio (M‐H, Fixed, 95% CI) | 0.90 [0.57, 1.43] |
| 3.1 Immediately after treatment | 1 | 34 | Risk Ratio (M‐H, Fixed, 95% CI) | 0.84 [0.47, 1.52] |
| 3.2 After 12 months | 1 | 34 | Risk Ratio (M‐H, Fixed, 95% CI) | 0.99 [0.48, 2.02] |
| Outcome or subgroup title | No. of studies | No. of participants | Statistical method | Effect size |
| 1 Number of women cured or improved Show forest plot | 1 | Risk Ratio (M‐H, Fixed, 95% CI) | Totals not selected | |
| 1.1 At 3 months | 1 | Risk Ratio (M‐H, Fixed, 95% CI) | 0.0 [0.0, 0.0] | |
| 1.2 At 12 months | 1 | Risk Ratio (M‐H, Fixed, 95% CI) | 0.0 [0.0, 0.0] | |
| 2 Condition‐specific quality of life on UDI Show forest plot | 1 | Risk Ratio (M‐H, Fixed, 95% CI) | Totals not selected | |
| 2.1 At 3 months | 1 | Risk Ratio (M‐H, Fixed, 95% CI) | 0.0 [0.0, 0.0] | |
| 2.2 At 12 months | 1 | Risk Ratio (M‐H, Fixed, 95% CI) | 0.0 [0.0, 0.0] | |
| 3 Number of women improved using patient global impression of improvement Show forest plot | 1 | Risk Ratio (M‐H, Fixed, 95% CI) | Totals not selected | |
| 3.1 At 3 months | 1 | Risk Ratio (M‐H, Fixed, 95% CI) | 0.0 [0.0, 0.0] | |
| 3.2 At 6 months | 1 | Risk Ratio (M‐H, Fixed, 95% CI) | 0.0 [0.0, 0.0] | |
| 3.3 At 12 months | 1 | Risk Ratio (M‐H, Fixed, 95% CI) | 0.0 [0.0, 0.0] | |
| 4 Patient satisfaction with treatment outcome Show forest plot | 1 | Risk Ratio (M‐H, Fixed, 95% CI) | Totals not selected | |
| 4.1 At 3 months | 1 | Risk Ratio (M‐H, Fixed, 95% CI) | 0.0 [0.0, 0.0] | |
| 4.2 At 6 months | 1 | Risk Ratio (M‐H, Fixed, 95% CI) | 0.0 [0.0, 0.0] | |
| 4.3 At 12 months | 1 | Risk Ratio (M‐H, Fixed, 95% CI) | 0.0 [0.0, 0.0] | |
| Outcome or subgroup title | No. of studies | No. of participants | Statistical method | Effect size |
| 1 Number of women cured Show forest plot | 1 | Risk Ratio (M‐H, Fixed, 95% CI) | Totals not selected | |
| 1.1 PFMT + clenbuterol vs clenbuterol | 1 | Risk Ratio (M‐H, Fixed, 95% CI) | 0.0 [0.0, 0.0] | |
| 2 Number of women cured or improved Show forest plot | 1 | Risk Ratio (M‐H, Fixed, 95% CI) | Totals not selected | |
| 2.1 PFMT + duloxetine vs duloxetine | 1 | Risk Ratio (M‐H, Fixed, 95% CI) | 0.0 [0.0, 0.0] | |
| 3 Condition‐specific quality of life on I‐QoL questionnaire Show forest plot | 1 | Mean Difference (IV, Fixed, 95% CI) | Totals not selected | |
| 3.1 PFMT + duloxetine vs duloxetine | 1 | Mean Difference (IV, Fixed, 95% CI) | 0.0 [0.0, 0.0] | |
| 4 Number of women improved on patient global impression of improvement in first 3 months Show forest plot | 2 | Risk Ratio (M‐H, Fixed, 95% CI) | Totals not selected | |
| 4.1 PFMT + duloxetine vs duloxetine | 1 | Risk Ratio (M‐H, Fixed, 95% CI) | 0.0 [0.0, 0.0] | |
| 4.2 PFMT + oxybutynin vs oxybutynin | 1 | Risk Ratio (M‐H, Fixed, 95% CI) | 0.0 [0.0, 0.0] | |
| 5 Frequency of incontinence episodes per week in first 3 months Show forest plot | 2 | Mean Difference (IV, Fixed, 95% CI) | Totals not selected | |
| 5.1 PFMT + duloxetine vs duloxetine | 1 | Mean Difference (IV, Fixed, 95% CI) | 0.0 [0.0, 0.0] | |
| 5.2 PFMT + oxybutynin vs oxybutynin | 1 | Mean Difference (IV, Fixed, 95% CI) | 0.0 [0.0, 0.0] | |
| 6 Frequency of incontinence episodes per week at 12 months Show forest plot | 1 | Mean Difference (IV, Fixed, 95% CI) | Totals not selected | |
| 6.1 PFMT + oxybutynin vs oxybutynin | 1 | Mean Difference (IV, Fixed, 95% CI) | 0.0 [0.0, 0.0] | |
| 7 Frequency of micturitions per 24 hours Show forest plot | 1 | Mean Difference (IV, Fixed, 95% CI) | Totals not selected | |
| 7.1 PFMT + oxybutynin vs oxybutynin | 1 | Mean Difference (IV, Fixed, 95% CI) | 0.0 [0.0, 0.0] | |
| 8 Volumes of urine per micturition Show forest plot | 1 | Mean Difference (IV, Fixed, 95% CI) | Totals not selected | |
| 8.1 PFMT + oxybutynin vs oxybutynin | 1 | Mean Difference (IV, Fixed, 95% CI) | 0.0 [0.0, 0.0] | |
| 9 Number of continence pads used per week Show forest plot | 1 | Mean Difference (IV, Fixed, 95% CI) | Totals not selected | |
| 9.1 PFMT + duloxetine vs duloxetine | 1 | Mean Difference (IV, Fixed, 95% CI) | 0.0 [0.0, 0.0] | |
| 10 Treatment adverse events Show forest plot | 1 | Risk Ratio (M‐H, Fixed, 95% CI) | Totals not selected | |
| 10.1 PFMT + solifenacin vs solifenacin | 1 | Risk Ratio (M‐H, Fixed, 95% CI) | 0.0 [0.0, 0.0] | |
| 11 Patient satisfaction with treatment outcome in first 3 months Show forest plot | 2 | Risk Ratio (M‐H, Fixed, 95% CI) | Totals not selected | |
| 11.1 PFMT + oxybutynin vs oxybutynin | 1 | Risk Ratio (M‐H, Fixed, 95% CI) | 0.0 [0.0, 0.0] | |
| 11.2 PFMT + clenbuterol vs clenbuterol | 1 | Risk Ratio (M‐H, Fixed, 95% CI) | 0.0 [0.0, 0.0] | |
| 12 Treatment benefit Show forest plot | 1 | Risk Ratio (M‐H, Fixed, 95% CI) | Totals not selected | |
| 12.1 PFMT + ?drug vs ?drug (drug name not reported) | 1 | Risk Ratio (M‐H, Fixed, 95% CI) | 0.0 [0.0, 0.0] | |
| Outcome or subgroup title | No. of studies | No. of participants | Statistical method | Effect size |
| 1 Number of women cured Show forest plot | 1 | Risk Ratio (M‐H, Fixed, 95% CI) | Totals not selected | |
| 1.1 PFMT + heat and steam generating sheet versus heat and steam generating sheet alone | 1 | Risk Ratio (M‐H, Fixed, 95% CI) | 0.0 [0.0, 0.0] | |