Fármacos antiinflamatorios no esteroideos versus corticosteroides para el control de la inflamación después de la cirugía de catarata no complicada
Información
- DOI:
- https://doi.org/10.1002/14651858.CD010516.pub2Copiar DOI

- Base de datos:
-
- Cochrane Database of Systematic Reviews
- Versión publicada:
-
- 03 julio 2017see what's new
- Tipo:
-
- Intervention
- Etapa:
-
- Review
- Grupo Editorial Cochrane:
-
Grupo Cochrane de Salud ocular y de la visión
- Copyright:
-
- Copyright © 2017 The Cochrane Collaboration. Published by John Wiley & Sons, Ltd.
Cifras del artículo
Altmetric:
Citado por:
Autores
Contributions of authors
VVJ, EC, and RSC coordinated and contributed significantly to the design and writing of the review.
VVJ, EC, and RSC provided clinical, methodological, policy, and consumer perspectives to the review.
RSC performed previous work that was the foundation of the current study.
EC performed the data analysis and prepared the results.
VVJ drafted the discussion and conclusions.
Sources of support
Internal sources
-
No sources of support supplied
External sources
-
Cochrane Eyes and Vision US Project, supported by Grant 1 U01 EY020522, National Eye Institute, National Institutes of Health, USA.
-
National Institute for Health Research (NIHR), UK.
-
Richard Wormald, Co‐ordinating Editor for Cochrane Eyes and Vision (CEV) acknowledges financial support for his CEV research sessions from the Department of Health through the award made by the NIHR to Moorfields Eye Hospital NHS Foundation Trust and UCL Institute of Ophthalmology for a Specialist Biomedical Research Centre for Ophthalmology.
-
This review was supported by the NIHR, via Cochrane Infrastructure funding to the CEV UK editorial base.
The views and opinions expressed therein are those of the authors and do not necessarily reflect those of the Systematic Reviews Programme, NIHR, NHS or the Department of Health.
-
Declarations of interest
VVJ: None known.
EC: None known.
RSC: None known.
Acknowledgements
We acknowledge John Gonzales, David Gritz, Roomasa Channa, Guilherme Quinto, and Alisa Kim for co‐authoring the protocol for this review and Swaroop Vedula for assisting with the protocol design and draft. We acknowledge Lori Rosman, Information Specialist for Cochrane Eyes and Vision (CEV), for developing the search strategy and executing the electronic searches. We acknowledge Sueko Matsumura, Reva Datar, Sarah Money, Cesar Ugarte, and Nan Guo for assistance with data extraction. We acknowledge Shuiqing Liu, Hsin‐wen Wu, Yu‐Tian Xiao, and Yuanxi Jia for help with screening and data extraction of Chinese language studies; Karin Rau and Jutta Scheffczik for help with screening and data extraction of German language studies; Jan Witowski for help with screening of Polish language studies; and Cesar Ugarte for help with screening and data extraction of Spanish language studies.
This work was undertaken in collaboration with the National Institute for Health and Care Excellence (NICE). The views expressed in this publication are those of the authors and not necessarily those of NICE.
Version history
| Published | Title | Stage | Authors | Version |
| 2017 Jul 03 | Non‐steroidal anti‐inflammatory drugs versus corticosteroids for controlling inflammation after uncomplicated cataract surgery | Review | Viral V Juthani, Elizabeth Clearfield, Roy S Chuck | |
| 2013 May 31 | Non‐steroidal anti‐inflammatory drugs versus corticosteroids for controlling inflammation after uncomplicated cataract surgery | Protocol | John A Gonzales, David C Gritz, Roomasa Channa, Guilherme G Quinto, Alisa Kim, Roy S Chuck | |
Differences between protocol and review
We included methods for the 'Summary of findings' tables and the GRADE assessment that were not included in the original protocol.
We did not do a sensitivity analysis to determine the implication of missing data because too few trials provided information on missing data and loss to follow‐up.
The protocol called for meta‐analysis on anterior chamber cell and flare as dichotomous outcomes, however we performed meta‐analyses on continuous cell and flare data as this was how this information was reported in many of the included studies.
Keywords
MeSH
Medical Subject Headings (MeSH) Keywords
- *Phacoemulsification [adverse effects];
- Adrenal Cortex Hormones [*therapeutic use];
- Anti‐Inflammatory Agents, Non‐Steroidal [*therapeutic use];
- Cataract Extraction [*adverse effects, *methods];
- Corneal Edema [etiology, prevention & control];
- Drug Therapy, Combination;
- Eye Diseases [etiology, *prevention & control];
- Inflammation [etiology, prevention & control];
- Macular Edema [etiology, prevention & control];
- Postoperative Complications [etiology, *prevention & control];
- Randomized Controlled Trials as Topic;
- Visual Acuity;
Medical Subject Headings Check Words
Humans;
PICO
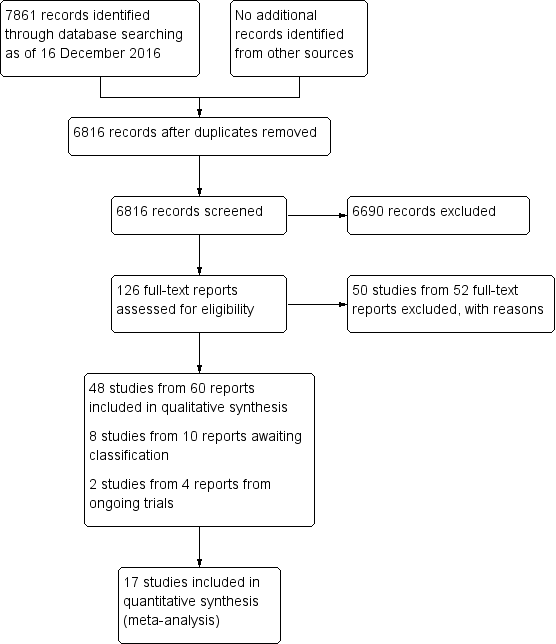
Study flow diagram.

Risk of bias graph: review authors' judgements about each risk of bias item presented as percentages across all included studies.

Risk of bias summary: review authors' judgements about each risk of bias item for each included study.

Forest plot of comparison: 1 NSAIDs versus corticosteroids, outcome: 1.1 Mean cell values at one week.

Forest plot of comparison: 1 NSAIDs versus corticosteroids, outcome: 1.2 Mean flare values at one week.

Forest plot of comparison: 2 NSAIDs plus corticosteroids versus corticosteroids alone, outcome: 2.1 Proportion of participants with cystoid macular edema at one week.
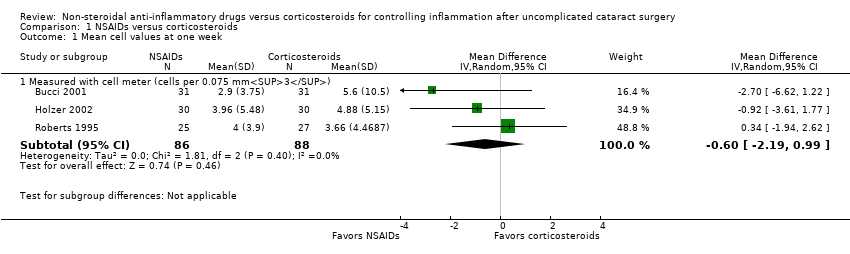
Comparison 1 NSAIDs versus corticosteroids, Outcome 1 Mean cell values at one week.

Comparison 1 NSAIDs versus corticosteroids, Outcome 2 Mean flare values at one week.
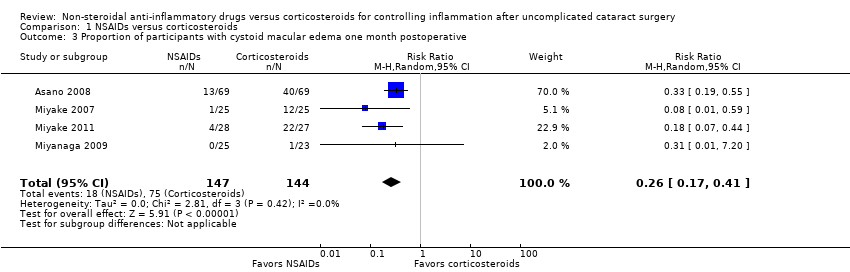
Comparison 1 NSAIDs versus corticosteroids, Outcome 3 Proportion of participants with cystoid macular edema one month postoperative.

Comparison 2 NSAIDs plus corticosteroids versus corticosteroids alone, Outcome 1 Proportion of participants with cystoid macular edema at one week.

Comparison 2 NSAIDs plus corticosteroids versus corticosteroids alone, Outcome 2 Proportion of participants with cystoid macular edema at one month.
| NSAIDs compared with corticosteroids for controlling inflammation after uncomplicated cataract surgery | ||||||
| Patient or population: people who received phacoemulsification Intervention: NSAID Comparison: corticosteroid | ||||||
| Outcomes | Illustrative comparative risks* (95% CI) | Relative effect | No of participants | Certainty of the evidence | Comments | |
| Assumed risk | Corresponding risk | |||||
| Corticosteroid | NSAID | |||||
| Intraocular inflammation measured by anterior chamber cell and flare 1 week | Cell values | — | 174 (3 RCTs) | ⊕⊕⊕⊝1 | The cell values presented were measured using a Kowa cell meter. 2 additional studies measured cells using a slit lamp, but we were unable to combine these data as the studies used different scales to report the number of cells. | |
| The mean cell value ranged from 3.7 to 5.8. | The mean cell value was0.24 cells lower (1.65 lower to 1.16 higher). | |||||
| Flare values | — | 365 (5 RCTs) | ⊕⊕⊝⊝1,2 | The flare values presented were measured using a Kowa cell meter. There was high statistical heterogeneity among the included studies (I2 = 92%). | ||
| The mean flare ranged from 15.65 to 48.3 photons/ms. | The mean flare was 13.74 photons/ms lower (21.47 lower to 6 lower). | |||||
| Intraocular inflammation measured by proportion of participants with corneal edema 1 week | 133 per 1000 | 103 per 1000 (35 to 305) | RR 0.77 (0.26 to 2.29) | 114 (1 RCT) | ⊕⊕⊝⊝3,4 | |
| Proportion of participants with best‐corrected visual acuity of 20/40 1 week | None of the included studies reported on this outcome. | |||||
| Proportion of participants with cystoid macular edema 1 week | 521 per 1000 | 135 per 1000 (89 to 214) | RR 0.26 (0.17 to 0.41) | 291 | ⊕⊕⊝⊝1,5 | None of the included studies reported the proportion of participants with cystoid macular edema at 1 week, our intended outcome of interest. The data shown here are for 4 studies that reported on the presence of macular edema at 1 month. |
| Time to cessation of treatment | None of the included studies reported on this outcome. | |||||
| Adverse events | None of the included studies reported on this outcome. | |||||
| Economic outcomes | None of the included studies reported on this outcome. | |||||
| *The basis for the assumed risk (e.g. the median control group risk across studies) is provided in footnotes. The corresponding risk (and its 95% confidence interval) is based on the assumed risk in the comparison group and the relative effect of the intervention (and its 95% CI). | ||||||
| GRADE Working Group grades of evidence | ||||||
| 1We downgraded the evidence due to risk of bias: the studies included in this meta‐analysis were poorly reported. | ||||||
| NSAIDs plus corticosteroids compared with corticosteroids alone for controlling inflammation after uncomplicated cataract surgery | ||||||
| Patient or population: people who received phacoemulsification Intervention: NSAID plus corticosteroid Comparison: corticosteroid alone | ||||||
| Outcomes | Illustrative comparative risks* (95% CI) | Relative effect | No of participants | Certainty of the evidence | Comments | |
| Assumed risk | Corresponding risk | |||||
| Corticosteroid alone | NSAID plus corticosteroid | |||||
| Intraocular inflammation measured by anterior chamber cell and flare 1 week | None of the included studies reported on this outcome. | |||||
| Intraocular inflammation measured by proportion of participants with corneal edema 1 week | 912 per 1000 | 976 per 1000 (894 to 1000) | RR 1.07 (0.98 to 1.16) | 138 | ⊕⊕⊕⊝1 | |
| Proportion of participants with best‐corrected visual acuity of 20/40 1 week | None of the included studies reported on this outcome. | |||||
| Proportion of participants with cystoid macular edema 1 week | 47 per 1000 | 8 per 1000 | RR 0.17 (0.03 to 0.97) | 220 | ⊕⊕⊝⊝2,3 | 7 additional studies (including 1213 participants) reported on the presence of cystoid macular edema at 1 month postoperatively. The meta‐analysis showed that the group that received a combination of NSAID plus corticosteroid had a lower risk of macular edema at 1 month compared with the group that received a corticosteroid only, however there was uncertainty in the measurement (RR 0.50, 95% CI 0.23 to 1.06) |
| Time to cessation of treatment | None of the included studies reported on this outcome. | |||||
| Adverse events | See comment | — | — | — | Only 2 studies reported on adverse events. 1 reported that there were no adverse events related to NSAID use, but that 1 participant randomized to NSAIDs plus corticosteroid had heterogeneous retinal detachment as a complication of cataract surgery. Another study used the COMTOL questionnaire to ask participants about the frequency and severity of side effects; 3 of the top 5 most commonly reported side effects were markers of ocular discomfort: burning, redness, and blurred vision. The adverse events reported in this study were not separated by intervention group. | |
| Economic outcomes | None of the included studies reported on this outcome. | |||||
| *The basis for the assumed risk (e.g. the median control group risk across studies) is provided in footnotes. The corresponding risk (and its 95% confidence interval) is based on the assumed risk in the comparison group and the relative effect of the intervention (and its 95% CI). | ||||||
| GRADE Working Group grades of evidence | ||||||
| 1We downgraded the certainty of the evidence due to high risk of reporting bias: the study reported collecting data for certain time points, but results were not reported. | ||||||
| Cells/Grade | Cells per field |
| 0 | Less than 1 |
| 0.5+ | 1 to 5 cells |
| 1+ | 6 to 15 cells |
| 2+ | 16 to 25 cells |
| 3+ | 26 to 50 cells |
| 4+ | More than 50 cells |
| Flare/Grade | Description |
| 0 | None to trace |
| 1+ | Faint |
| 2+ | Moderate (iris and lens details clear) |
| 3+ | Marked (iris and lens details hazy) |
| 4+ | Intense (fibrin or plastic aqueous) |
| Grade | Degree of ocular discomfort | Description |
| 0 | None | Absent |
| 1 | Mild | You experience ocular discomfort, but it does not interfere at all with your completion of daily tasks. |
| 2 | Moderate | You experience ocular discomfort and it slows you down, but you are able to carry out work of a light or sedentary nature (e.g. light house work, office work). |
| 3 | Severe | Your experience of ocular discomfort makes you completely unable to carry out any work activities. |
| Primary Outcomes | Secondary outcomes | |||||||||
| Study | Expected outcome: Proportion of participants with corneal edema >grade 0 | Expected outcome: Proportion of participants with anterior chamber cells and flare >grade 1 | Reported outcome: Cells and flare as a continuous measure | Expected outcome: Proportion of participants with BCVA of 20/40 or better | Reported outcome: Visual acuity as a continuous measure | Expected outcome: Proportion of participants with CME | Reported outcome: OCT outcomes or FFA outcomes measured continuously (macular thickness, total macular volume, macular cube volume, fluorescein leakage,etc) | Expected outcome: Time to cessation of treatment for inflammation | Expected outcome: Adverse events | Expected outcome: Economic outcomes (cost) |
| Studies comparing an NSAID to a corticosteroid | ||||||||||
| Yes | Yes | Yes | ||||||||
| Yes | ||||||||||
| Yes | Yes | Yes | ||||||||
| Yes | Yes | |||||||||
| Data in figure only | Yes | Yes | ||||||||
| Yes | Yes | |||||||||
| Yes | Yes | |||||||||
| Partial | ||||||||||
| Yes | Yes | |||||||||
| Yes | Yes | Yes | Yes | |||||||
| Yes | Yes | Yes | Yes | |||||||
| Yes | ||||||||||
| Yes | Yes | |||||||||
| Yes | ||||||||||
| Yes | Yes | |||||||||
| Studies comparing an NSAID plus a corticosteroid to a corticosteroid alone | ||||||||||
| Yes | ||||||||||
| Data in figure only | Yes | |||||||||
| Yes | ||||||||||
| Yes | ||||||||||
| Yes | Yes | |||||||||
| Yes | Yes | Yes | ||||||||
| Yes | Yes | Yes | ||||||||
| Yes | Yes | |||||||||
| Yes | Yes | |||||||||
| Yes | Yes | Yes | ||||||||
| Partial | Yes | |||||||||
| Data in figure only | Yes | |||||||||
| Partial | Yes | |||||||||
| Yes | Yes | Yes | ||||||||
| Yes | Yes | Yes | Yes | |||||||
| Data in figure only | Yes | Yes | Yes | Yes | ||||||
| Yes | Yes | |||||||||
| Studies with other combinations of NSAIDs and corticosteroids | ||||||||||
| Yes | ||||||||||
| Yes | Yes | Yes | Yes | |||||||
| Yes | ||||||||||
| Data in figure only | Yes | Yes | ||||||||
| Yes | Yes | Yes | ||||||||
| Yes | Yes | Yes | Yes | |||||||
| Yes | Yes | Yes | ||||||||
| Yes | Yes | Yes | ||||||||
| Data in figure only | ||||||||||
| Yes | Yes | Yes | Yes | |||||||
| Yes | Yes | Yes | ||||||||
| Yes | Yes | |||||||||
| Yes | ||||||||||
| Partial refers to studies missing data or not reporting all data needed to perform a meta‐analysis (such as reporting means without standard deviations) and studies reporting data at time points that were not of interest for this review. | ||||||||||
| Outcome or subgroup title | No. of studies | No. of participants | Statistical method | Effect size |
| 1 Mean cell values at one week Show forest plot | 3 | Mean Difference (IV, Random, 95% CI) | Subtotals only | |
| 1.1 Measured with cell meter (cells per 0.075 mm3) | 3 | 174 | Mean Difference (IV, Random, 95% CI) | ‐0.60 [‐2.19, 0.99] |
| 2 Mean flare values at one week Show forest plot | 5 | Mean Difference (IV, Random, 95% CI) | Subtotals only | |
| 2.1 Measured with flare meter (photons/milisecond) | 5 | 365 | Mean Difference (IV, Random, 95% CI) | ‐13.74 [‐21.45, ‐6.04] |
| 3 Proportion of participants with cystoid macular edema one month postoperative Show forest plot | 4 | 291 | Risk Ratio (M‐H, Random, 95% CI) | 0.26 [0.17, 0.41] |
| Outcome or subgroup title | No. of studies | No. of participants | Statistical method | Effect size |
| 1 Proportion of participants with cystoid macular edema at one week Show forest plot | 2 | 220 | Risk Ratio (M‐H, Fixed, 95% CI) | 0.17 [0.03, 0.97] |
| 2 Proportion of participants with cystoid macular edema at one month Show forest plot | 7 | 1213 | Risk Ratio (M‐H, Random, 95% CI) | 0.50 [0.23, 1.06] |