Nacięcia różnej wielkości podczas operacji fakoemulsyfikacji zaćmy związanej z wiekiem
Abstract
Background
Age‐related cataract is the principal cause of blindness and visual impairment in the world. Phacoemulsification is the main surgical procedure used to treat cataract. The comparative effectiveness and safety of different‐sized incisions for phacoemulsification has not been determined.
Objectives
The aim of this systematic review was to assess the effectiveness and safety of smaller versus larger incisions for phacoemulsification in age‐related cataract. The primary outcome of this review was surgically induced astigmatism at three months after surgery.
Search methods
We searched the Cochrane Central Register of Controlled Trials (CENTRAL) (which contains the Cochrane Eyes and Vision Trials Register) (2016, Issue 10), MEDLINE Ovid (1946 to 28 October 2016), Embase Ovid (1947 to 28 October 2016), PubMed (1948 to 28 October 2016), LILACS (Latin American and Caribbean Health Sciences Literature Database) (1982 to 28 October 2016), the metaRegister of Controlled Trials (mRCT) (www.controlled‐trials.com; last searched 13 May 2013), ClinicalTrials.gov (www.clinicaltrials.gov; searched 28 October 2016), and the WHO International Clinical Trials Registry Platform (ICTRP) (www.who.int/ictrp; searched 28 October 2016). We did not use any date or language restrictions in the electronic searches for trials.
Selection criteria
We included randomized controlled trials (RCTs) comparing different‐sized incisions in people with age‐related cataract undergoing phacoemulsification.
Data collection and analysis
We used standard methodological procedures expected by Cochrane.
Main results
We included 26 RCTs with a total of 2737 participants (3120 eyes). These trials were conducted in Bosnia and Herzegovina, China, France, India, Italy, Korea, Spain, Switzerland, and Turkey. Half of the 26 trials were conducted in China. We judged all trials as mostly at unclear to low risk of bias. The included RCTs compared four different‐sized incisions:<= 1.5 mm, 1.8 mm, 2.2 mm, and approximately 3.0 mm. These incisions were performed using three different techniques: coaxial and biaxial microincision phacoemulsification (C‐MICS and B‐MICS) and standard phacoemulsification. Not all studies provided data in a form that could be included in this review. Five studies had three arms.
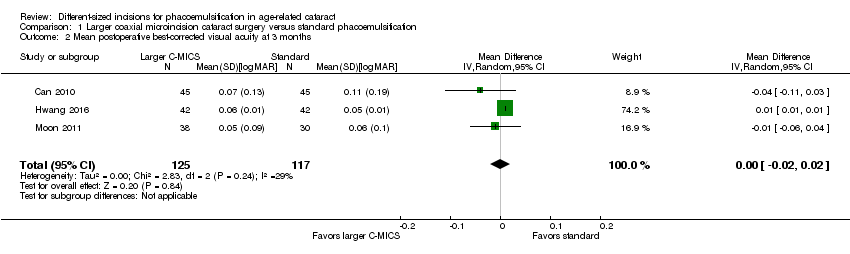
Fifteen trials compared C‐MICS (2.2 mm) with standard phacoemulsification (about 3.0 mm). Very low‐certainty evidence suggested less surgically induced astigmatism in the C‐MICS group at three months compared with standard phacoemulsification (mean difference (MD) ‐0.19 diopters (D), 95% confidence interval (CI) ‐0.30 to ‐0.09; 996 eyes; 8 RCTs). There was low‐certainty evidence that both groups achieved similar best‐corrected visual acuity (MD 0.00 logMAR, 95% CI ‐0.02 to 0.02; 242 eyes; 3 RCTs). There was low‐certainty evidence of little or no difference in endothelial cell loss and central corneal thickness comparing C‐MICS with standard phacoemulsification (MD ‐7.23 cells/mm2, 95% CI ‐78.66 to 64.20; 596 eyes; 4 RCTs) and (MD ‐0.68 μm, 95% CI ‐3.26 to 1.90; 487 eyes; 5 RCTs).
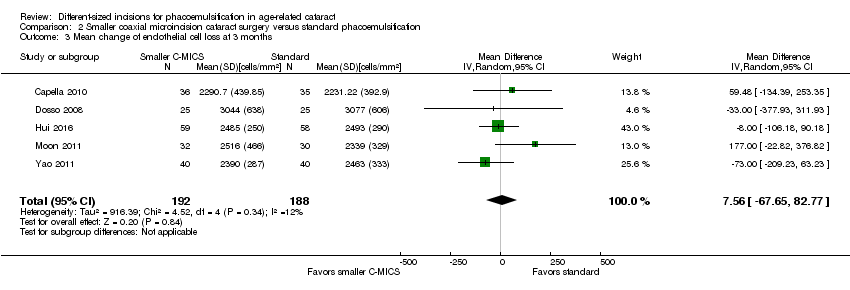
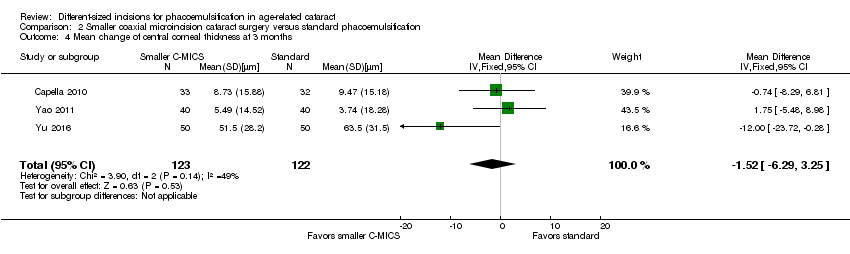
Nine trials compared C‐MICS (1.8 mm) with standard phacoemulsification (about 3.0 mm). Very low‐certainty evidence suggested less astigmatism at three months in the C‐MICS group compared with standard phacoemulsification group (MD ‐0.23 D, 95% CI ‐0.34 to ‐0.13; 561 eyes; 5 RCTs). Low‐certainty evidence suggested little or no difference in best‐corrected visual acuity, endothelial cell loss, and central corneal thickness in the two groups at three months (MD ‐0.02 logMAR, 95% CI ‐0.03 to ‐0.00; 192 eyes; 3 RCTs), (MD 7.56 cells/mm2, 95% CI ‐67.65 to 82.77; 380 eyes; 5 RCTs), and (MD ‐1.52 μm, 95% CI ‐6.29 to 3.25; 245 eyes; 3 RCTs).
Six studies compared C‐MICS (1.8 mm) with C‐MICS (2.2 mm). There was low‐certainty evidence that astigmatism, visual acuity, and central corneal thickness were similar in the two groups at three months (MD 0.04 D, 95% CI ‐0.09 to 0.16; 259 eyes; 3 RCTs), (MD 0.01 logMAR, 95% CI ‐0.01 to 0.04; 200 eyes; 3 RCTs), and (MD 0.45 μm, 95% CI ‐2.70 to 3.60; 100 eyes; 1 RCT). Very low‐certainty evidence suggested higher endothelial cell loss in the 1.8 mm group (MD 213.00 cells/mm2, 95% CI 11.15 to 414.85; 70 eyes; 1 RCT).
Four studies compared B‐MICS (<= 1.5 mm) with standard phacoemulsification (about 3.0 mm). Astigmatism was similar in the two groups at three months (MD ‐0.01 D, 95% CI ‐0.03 to 0.01; 368 eyes; 2 RCTs; moderate‐certainty evidence). There was low‐certainty evidence on visual acuity, suggesting little or no difference between the two groups (MD ‐0.02 logMAR, 95% CI ‐0.04 to ‐0.00; 464 eyes; 3 RCTs). Low‐certainty evidence on endothelial cell loss and central corneal thickness also suggested little or no difference between the two groups (MD 55.83 cells/mm2, 95% CI ‐34.93 to 146.59; 280 eyes; 1 RCT) and (MD 0.10 μm, 95% CI ‐14.04 to 14.24; 90 eyes; 1 RCT).
None of the trials reported on quality of life. One trial reported that no participants experienced endophthalmitis or posterior capsule rupture; they also reported little or no difference between incision groups regarding corneal edema (risk ratio 1.02, 95% CI 0.40 to 2.63; 362 eyes).
Authors' conclusions
Phacoemulsification with smaller incisions was not consistently associated with less surgically induced astigmatism compared with phacoemulsification with larger incisions. Coaxial microincision phacoemulsification may be associated with less astigmatism than standard phacoemulsification, but the difference was small, in the order of 0.2 D, and the evidence was uncertain. Safety outcomes and quality of life were not adequately reported; these should be addressed in future studies.
PICO
Streszczenie prostym językiem
Nacięcia różnej wielkości podczas operacji chorych z zaćmą starczą
Cel przeglądu
Celem tego przeglądu Cochrane było sprawdzenie czy wielkość nacięcia (otworu wykonanego na brzegu rogówki; przyp. tłum.) podczas operacji zaćmy wpływa na końcowy wynik zabiegu. Odnaleźliśmy 26 badań odpowiadających na to pytanie.
Kluczowe informacje
Niektóre, ale nie wszystkie techniki operacyjne, w których stosowano mniejsze nacięcie wiązały się z mniejszym ryzykiem astygmatyzmu; jednak różnice były małe, a dowody niepewne. Niewiele danych naukowych wskazywało na istotny wpływ na poprawę widzenia. Dane naukowe opisujące objawy niepożądane były ograniczone i nie stwierdzono żadnych danych dotyczących wpływu różnej wielkości nacięć na jakość życia.
Co badano w tym przeglądzie ?
Wraz z wiekiem soczewka w oku może stać się mętna. Proces ten nazywamy zaćmą. W celu usunięcia zaćmy przeprowadzany jest zabieg operacyjny, a zmętniałą soczewkę zastępuje się sztuczną. Zabieg jest bezpieczny i przywraca wzrok w prawie każdym przypadku. Zaćma starcza jest jedną z głównych przyczyn ślepoty na świecie.
Jedynym problemem, który może wystąpić po operacji zaćmy jest zniekształcenie przedniej części oka, która nie ma już idealnej krzywizny. Może to skutkować rozmytym i zniekształconym obrazem, co nazywamy astygmatyzmem. Problemy związane z tym powikłaniem mogą być skorygowane za pomocą soczewek korygujących. Powszechnie uważa się, że zastosowanie mniejszego nacięcia podczas operacji zaćmy wiąże się z mniejszym ryzykiem astygmatyzmu.
Główne wyniki
Szukaliśmy badań, w których porównywano różne rozmiary nacięć podczas operacji zaćmy starczej. Przegląd ten obejmuje 26 badań przeprowadzonych w Europie i Azji.
Znaleźliśmy następujące wyniki:
• Stosowanie niektórych, lecz nie wszystkich technik operacyjnych z mniejszym nacięciem wiązało się z mniejszym ryzykiem astygmatyzmu, jednak różnice i wyniki badań były niejednoznaczne (dane naukowe o niskiej i bardzo niskiej pewności [co do wiarygodności obserwowanego efektu ‐ przyp. tłum.]).
• Biorąc pod uwagę ostrość wzroku, stwierdzono małą lub brak różnicy pomiędzy nacięciami różnej wielkości (dane naukowe o niskiej pewności [co do wiarygodności obserwowanego efektu ‐ przyp. tłum.])
• Nie stwierdzono jednorodnego wpływu wielkości nacięcia na inne wyniki, takie jak: grubość rogówki (przednia część oka) oraz liczba komórek w przedniej części gałki ocznej (dane naukowe o niskiej i bardzo niskiej pewności [co do wiarygodności obserwowanego efektu ‐ przyp. tłum.]
• W większości omawianych badań nie przedstawiono danych na temat wystąpienia działań niepożądanych.
• W żadnym z badań nie oceniano wpływu interwencji na jakość życia uczestników.
Do kiedy przegląd jest aktualny?
Poszukiwaliśmy badań, które zostały opublikowane do 28 października 2016 r.
Authors' conclusions
Summary of findings
| Larger C‐MICS compared with standard phacoemulsification for age‐related cataract | ||||||
| Patient or population: adults with age‐related cataract Settings: eye clinics Intervention: larger C‐MICS with 2.2‐millimeter incision Comparison: standard phacoemulsification with about 3.0‐millimeter incision | ||||||
| Outcomes | Illustrative comparative risks* (95% CI) | Relative effect | No. of eyes | Certainty of the evidence | Comments | |
| Assumed risk | Corresponding risk | |||||
| Standard phacoemulsification | Larger C‐MICS | |||||
| Mean postoperative surgically induced astigmatism Follow‐up: 3 months | The mean surgically induced astigmatism was 0.7 to 1.34 diopters. | The mean surgically induced astigmatism in the intervention groups was 0.19 diopters lower (0.30 to 0.09 diopters lower). | ‐ | 996 | ⊕⊝⊝⊝ | A lower diopter value is a better clinical outcome. |
| Mean postoperative best‐corrected visual acuity Follow‐up: 3 months | The mean best‐corrected visual acuity was 0.05 to 0.11 logMAR. | The mean best‐corrected visual acuity in the intervention groups was 0.00 logMAR lower (0.02 logMAR lower to 0.02 logMAR higher). | ‐ | 242 | ⊕⊕⊝⊝ | |
| Mean endothelial cell loss Follow‐up: 3 months | The mean of endothelial cell loss ranged across control groups was 2054.0 to 2339.0 cells/mm2. | The mean change of endothelial cell loss in the intervention groups was 7.23 cells/mm2 lower (78.66 cells/mm2 lower to 64.20 cells/mm2 higher). | ‐ | 596 (4 RCTs) | ⊕⊕⊝⊝ | Little or no difference between groups is a clinically positive result. |
| Central corneal thickness Follow‐up: 3 months | The mean change of central corneal thickness was 9.24 μm. The mean central corneal thickness ranged across control groups from 546.0 to 580.0 μm. | The mean change of central corneal thickness in the intervention groups was 0.68 μm lower (3.26 μm lower to 1.90 μm higher). | ‐ | 487 (5 RCTs) | ⊕⊕⊝⊝ | Hwang 2016 did not report the standard deviation, but reported that the mean % decrease in central corneal thickness was 1.00 in the 2.2‐millimeter group and 0.31 in the 2.75‐millimeter group. Little or no difference between groups is a clinically positive result. |
| Adverse events (corneal edema) Follow‐up: 3 months | 46 per 1000 | 47 per 1000 (19 to 122) | RR 1.02 (0.40 to 2.63 | 362 (1 RCT) | Wang 2009 reported "no intraoperative complications." | |
| Quality of life | Not reported | |||||
| *The basis for the assumed risk (e.g. the median control group risk across studies) is provided in footnotes. The corresponding risk (and its 95% confidence interval) is based on the assumed risk in the comparison group and the relative effect of the intervention (and its 95% CI). | ||||||
| GRADE Working Group grades of evidence | ||||||
| aDowngraded two levels for risk of bias, as one study was at high risk of selection and attrition bias, while another study was at high risk of reporting bias. | ||||||
| Smaller C‐MICS compared with standard phacoemulsification for age‐related cataract | ||||||
| Patient or population: adults with age‐related cataract Settings: eye clinics Intervention: smaller C‐MICS with 1.8‐millimeter incision Comparison: standard phacoemulsification with about 3.0‐millimeter incision | ||||||
| Outcomes | Illustrative comparative risks* (95% CI) | Relative effect | No. of eyes | Certainty of the evidence | Comments | |
| Assumed risk | Corresponding risk | |||||
| Standard phacoemulsification | Smaller C‐MICS | |||||
| Mean postoperative surgically induced astigmatism Follow‐up: 3 months | The mean postoperative surgically induced astigmatism ranged across control groups from 0.03 to 0.94 diopters. | The mean postoperative surgically induced astigmatism in the intervention groups was 0.23 lower (0.34 diopters to 0.13 diopters lower). | ‐ | 561 | ⊕⊝⊝⊝ | A lower diopter value is a better clinical outcome. |
| Mean postoperative best‐corrected visual acuity Follow‐up: 2 to 3 months | The mean postoperative best‐corrected visual acuity ranged across control groups from | The mean postoperative best‐corrected visual acuity in the intervention groups was 0.02 logMAR units lower (0.03 logMAR units lower to 0.00 logMAR units). | ‐ | 192 | ⊕⊕⊝⊝ | |
| Mean change of endothelial cell loss Follow‐up: 3 months | The mean change of endothelial cell loss ranged across control groups from 2231.22 to 3077.0 cells/mm2. | The mean change of endothelial cell loss in the intervention groups was | ‐ | 380 | ⊕⊕⊝⊝ | |
| Mean change of central corneal thickness Follow‐up: 3 months | The mean change of central corneal thickness ranged across control groups from 3.74 to 63.5 μm. | The mean change of central corneal thickness in the intervention groups was 1.52 μm lower (6.29 μm lower to 3.25 μm higher). | ‐ | 245 | ⊕⊕⊝⊝ | |
| Adverse events Follow‐up: 3 months | None of the trials reported on adverse events. | |||||
| Quality of life | Not reported | |||||
| *The basis for the assumed risk (e.g. the median control group risk across studies) is provided in footnotes. The corresponding risk (and its 95% confidence interval) is based on the assumed risk in the comparison group and the relative effect of the intervention (and its 95% CI). | ||||||
| GRADE Working Group grades of evidence | ||||||
| aDowngraded two levels for high risk of selection, performance, and detection bias. | ||||||
| Smaller coaxial microincision cataract surgery (C‐MICS) compared with larger C‐MICS for age‐related cataract | ||||||
| Patient or population: adults with age‐related cataract Settings: eye clinics Intervention: smaller C‐MICS with 1.8‐millimeter incision Comparison: larger C‐MICS with 2.2‐millimeter incision | ||||||
| Outcomes | Illustrative comparative risks* (95% CI) | Relative effect | No. of eyes | Certainty of the evidence | Comments | |
| Assumed risk | Corresponding risk | |||||
| Larger C‐MICS | Smaller C‐MICS | |||||
| Mean postoperative surgically induced astigmatism Follow‐up: 3 months | The mean postoperative surgically induced astigmatism ranged across control groups from 0.48 to 1.08 diopters. | The mean postoperative surgically induced astigmatism in the intervention groups was | ‐ | 259 | ⊕⊕⊝⊝ | A lower diopter value is a better clinical outcome. |
| Mean postoperative best‐corrected visual acuity Follow‐up: 3 months | The mean postoperative best‐corrected visual acuity ranged across control groups from | The mean postoperative best‐corrected visual acuity in the intervention groups was 0.01 logMAR units higher (0.01 logMAR units lower to 0.04 logMAR units higher). | ‐ | 200 | ⊕⊕⊝⊝ | |
| Mean change of endothelial cell loss Follow‐up: 3 months | The mean change in endothelial cell loss was 2303.0 cells/mm2. | The mean change in endothelial cell loss was 213.00 cells/mm2 higher (11.15 to 414.85 cells/mm2 higher). | ‐ | 70 (1 RCT) | ⊕⊝⊝⊝ | |
| Mean central corneal thickness Follow‐up: 3 months | The mean change in central corneal thickness was 2.99 μm. | The mean change in central corneal thickness was 0.45 μm higher (2.70 μm lower to 3.60 μm higher). | ‐ | 100 | ⊕⊕⊝⊝ | |
| Adverse events Follow‐up: end of trial | None of the trials reported on adverse events. | |||||
| Quality of life | Not reported | |||||
| *The basis for the assumed risk (e.g. the median control group risk across studies) is provided in footnotes. The corresponding risk (and its 95% confidence interval) is based on the assumed risk in the comparison group and the relative effect of the intervention (and its 95% CI). | ||||||
| GRADE Working Group grades of evidence | ||||||
| aDowngraded two levels for unexplained statistical heterogeneity, as the I2 was greater than 70%. | ||||||
| B‐MICS compared with standard phacoemulsification for age‐related cataract | ||||||
| Patient or population: adults with age‐related cataract Settings: eye clinics Intervention: B‐MICS with equal to or smaller than 1.5‐millimeter incision Comparison: standard phacoemulsification with about 3.0‐millimeter incision | ||||||
| Outcomes | Illustrative comparative risks* (95% CI) | Relative effect | No. of eyes | Certainty of the evidence | Comments | |
| Assumed risk | Corresponding risk | |||||
| Standard phacoemulsification | B‐MICS | |||||
| Mean postoperative surgically induced astigmatism Follow‐up: 3 months | The mean postoperative surgically induced astigmatism ranged across control groups from 0.12 diopters to 0.44 diopters. | The mean postoperative surgically induced astigmatism in the intervention groups was | ‐ | 368 | ⊕⊕⊕⊝ | A lower diopter value is a better clinical outcome. |
| Mean postoperative best‐corrected visual acuity Follow‐up: 3 months | The mean postoperative best‐corrected visual acuity ranged across control groups from | The mean postoperative best‐corrected visual acuity in the intervention groups was 0.02 logMAR units lower (0.04 logMAR units lower to 0.00 LogMAR units). | ‐ | 464 | ⊕⊕⊝⊝ | |
| Mean endothelial cell loss Follow‐up: 3 months | The mean endothelial cell loss in the control groups was 2410 cells/mm2. | The mean endothelial cell loss in the intervention groups was (34.93 cells/mm2 lower to 146.59 cells/mm2 higher). | ‐ | 280 | ⊕⊕⊝⊝ | |
| Postoperative central corneal thickness Follow‐up: 3 months | The mean change in central corneal thickness in the control group was 546 μm. | The mean change of central corneal thickness in the intervention groups was 0.10 μm higher (14.04 μm lower to 14.24 μm higher). | ‐ | 90 | ⊕⊕⊝⊝ | |
| Adverse events Follow‐up: end of study | None of the trials reported on adverse events. | |||||
| Quality of life | Not reported | |||||
| *The basis for the assumed risk (e.g. the median control group risk across studies) is provided in footnotes. The corresponding risk (and its 95% confidence interval) is based on the assumed risk in the comparison group and the relative effect of the intervention (and its 95% CI). | ||||||
| GRADE Working Group grades of evidence | ||||||
| aDowngraded one level for risk of bias, as the trials were at unclear risk of selection and reporting bias. | ||||||
Background
Description of the condition
Cataract, or opacification of the lens, is the most common cause of visual impairment worldwide, and poses one of the greatest public health challenges of the 21st century (Asbell 2005; Resnikoff 2004). The opacified lens reduces the light reaching the retina, finally resulting in defective vision. No gender, racial, or ethnic group is immune to age‐related opacification of the lens, known as age‐related cataract (ARC). Age‐related cataract, which constitutes 90% of all cataracts, usually presents in the eyes of people older than 40 years (Schlote 2006). Age‐related cataract is divided into three major types, on the basis of slit‐lamp examination: nuclear, cortical, and posterior subcapsular (PSC) cataracts. Each of the three can occur alone or in combination, and all of them can progress to total opacification of the lens (Shiels 2010). Density and location of the lens opacity are the two main factors that determine the effect on vision. To date, no method has been confirmed to halt the formation of a cataract lens.
The World Health Organization (WHO) conducted a global review of surveys in 2004 that demonstrated that ARC remained the leading cause of blindness globally, accounting for 48% of world blindness, and that it affected individuals of both high‐income and middle‐ and low‐income countries (Resnikoff 2004). Without extra intervention, the global blind population will increase to 76 million in 2020 (Frick 2003). The cataract surgery rate (CSR), the number of cataract operations per million population per annum, is a useful measurement of eye care delivery in different settings; it differs between high‐income and middle‐ and low‐income countries.
In Sweden, the CSR was between 8000 and 9000 operations per million population per year from 2000 to 2009 (Behndig 2011), but in Africa the CSR was only about 200 operations per million population per year (WHO 2017). In India about 0.5 million cataract surgeries were performed from 1981 to 1982, but the number had increased to 4.8 million by the year 2006 (Aravind 2008). An even higher increase in the number of cataract surgeries is anticipated in low‐income countries under VISION 2020, the global initiative for the elimination of avoidable blindness (Foster 2005). Despite the increasing number of cataract surgeries, ARC continues to be a leading public health issue because of aging populations and increased life expectancies.
Description of the intervention
Currently, surgery to remove the opacification remains the primary and only treatment for ARC. Cataract surgery has changed dramatically over the past 50 years. Among various surgical techniques for cataract management, phacoemulsification using a clear corneal incision has become the gold standard (Kelman 1967). In phacoemulsification, the surgeon uses an ultrasonic handpiece to emulsify the opacified lens and aspirate the consequent small fragments. Compared with earlier cataract surgeries with large invasive incisions and a large postoperative astigmatic error, phacoemulsification requires only a small incision and thus improves surgical outcomes, with fewer intraoperative and postoperative complications and rapid visual rehabilitation. Continuous advancement in instrumentation, techniques, and intraocular lenses (IOLs), to replace the natural lens, has allowed surgeons to use much smaller incision sizes.
The incision of standard phacoemulsifications measures about 3.0 mm in length. This incision size allows the silicone sleeve‐covered phacoemulsification handpiece to fit snugly through the surgically induced corneal wound. The covered silicone sleeve is intended to prevent thermal injury to the cornea with the goal of improving effectiveness and safety of phacoemulsification. Two other approaches, coaxial microincision cataract surgery (C‐MICS) and biaxial microincision cataract surgery (B‐MICS), have been developed (Osher 2007a; Osher 2007b). These procedures allow surgeons to operate through even smaller incisions (Paul 2005). Coaxial microincision cataract surgery allows surgeons to perform irrigation, ultrasound, and aspiration through one incision about 2 mm in length. Biaxial microincision cataract surgery accomplishes irrigation and aspiration separately through two corneal incisions less than 1.5 mm in length (Lam 2009; Weikert 2006). These two approaches may result in intraoperative changes such as the increased use of cumulative dissipated energy (CDE), total use of balanced salt solution (BSS), and prolonged surgical time. To date, Infiniti Vision System (Alcon Laboratories) and Stellaris Vision Enhancement System (Bausch & Lomb) are the two main surgical systems used in the phacoemulsification cataract surgery already described.
How the intervention might work
The goal of cataract surgery is to improve vision by replacing the opacified lens with an artificial intraocular lens called the IOL. After the cataract lens is removed, an IOL is implanted inside the 'bag' of the lens capsule to correct the induced refractive error due to removal of the natural lens. The very small incisions achieved with modern techniques (B‐MICS and C‐MICS) are expected to lower surgically induced astigmatism (SIA) and allow more rapid visual rehabilitation postoperatively, when compared with current phacoemulsification.
Why it is important to do this review
As phacoemulsification techniques and foldable IOLs have developed rapidly in recent decades, the incision size for phacoemulsification has been reduced from around 3.0 mm with standard phacoemulsification to around 2.0 mm with C‐MICS and even smaller ‐ measuring less than 1.5 mm ‐ with B‐MICS (Cavallini 2007; Luo 2012). Smaller clear corneal cataract surgical incisions may be associated with better postoperative visual acuity, reduced SIA, improved wound healing, earlier stabilization of refractive error resulting in shorter recovery time, more stable corneal biomechanical properties, and lower risk of endophthalmitis (intraocular infection and inflammation) (Chee 2005). However, B‐MICS and C‐MICS require more advanced equipment and may result in longer surgical time, increased use of CDE, and consequently greater endothelial cell loss during surgery. An active area of study therefore involves determining the optimal incision size for performance of phacoemulsification. To date, no systematic review of randomized trials has been conducted to assess the effectiveness and safety of incisions of different sizes for phacoemulsification surgery in eyes with age‐related cataract.
Objectives
The aim of this systematic review was to assess the effectiveness and safety of smaller versus larger incisions for phacoemulsification in ARC. The primary outcome of this review was surgically induced astigmatism at three months after surgery.
Methods
Criteria for considering studies for this review
Types of studies
We included only randomized controlled trials (RCTs) in this review.
Types of participants
We included trials of participants affected by ARC with no ocular condition other than cataract. We included only studies with participants age 50 years or older. Ocular pathologic conditions included high myopia, glaucoma, short axis eyes, etc. We did not impose restrictions with regard to participants' gender or ethnicity.
Types of interventions
We included trials that compared at least two of the following four interventions (major systems included but not limited to Infiniti Vision System and Stellaris Vision Enhancement System).
-
Standard phacoemulsification with about 3.0 mm incision
-
Larger coaxial microincision cataract surgery (C‐MICS) with 2.2‐millimeter incision
-
Smaller coaxial microincision cataract surgery (C‐MICS) with 1.8‐millimeter incision
-
Biaxial microincision cataract surgery (B‐MICS) with equal to or smaller than 1.5‐millimeter incision
We considered standard phacoemulsification with incisions ranging from 2.75 to 3.2 mm to be about 3.0 mm. We excluded trials when the intervention did not meet our inclusion criteria, such as when the initial incision was made on the steepest meridian or expanded for IOL implant, or the manual microincision cataract surgery did not use phacoemulsification to emulsify the opacified lens, etc.
Types of outcome measures
Primary outcomes
-
Mean SIA (in diopters; D) at three months after surgery, measured with corneal topography and assessed by the vector method.
Secondary outcomes
-
Surgically induced astigmatism data when measured at 12 months where clinically important difference is from 0.8 D to 0.1 D.
-
Postoperative best corrected visual acuity (BCVA) on the LogMAR scale at three and 12 months where clinically important difference is 0.1 logMAR units.
-
Postoperative changes of endothelial cell loss (ECL) and central corneal thickness (CCT), from measurements made preoperatively and at three and 12 months after surgery, where little or no difference between baseline and follow‐up is clinically advantageous outcome. Endothelial cell loss measured with non‐contact specular microscopy (cell/mm2 or percentage decrease) and mean CCT measured with ultrasonic pachymeter (μm or percentage increase).
-
Intraoperative parameters recorded at the end of surgery, which are indicative of surgical skill; a lower value is interpreted as having higher surgical skill. The intraoperative parameters are:
-
use of cumulative dissipated energy is the percentage of power utilized during the ultrasound period (CDE, %);
-
total use of balanced salt solution (BSS, mL);
-
surgical time (minutes);
-
phacoemulsification time (seconds).
-
-
Postoperative and intraoperative complications, including endophthalmitis, posterior capsule rupture (PCR), etc.
-
Quality of life as measured by any validated instruments at three and 12 months.
Follow‐up
We considered outcomes at three months and one year after surgery. As studies may not report outcomes at precisely these time points, we defined the following time periods.
-
Three months: from four weeks to less than six months
-
Twelve months: from six months to less than 18 months
Search methods for identification of studies
Electronic searches
The Cochrane Eyes and Vision Information Specialist conducted systematic searches in the following databases for RCTs and controlled clinical trials. There were no language or publication year restrictions. The date of the search was 28 October 2016.
-
Cochrane Central Register of Controlled Trials (CENTRAL; 2016, Issue 10) (which contains the Cochrane Eyes and Vision Trials Register) in the Cochrane Library (searched 28 October 2016) (Appendix 1)
-
MEDLINE Ovid (1946 to 28 October 2016) (Appendix 2)
-
Embase Ovid (1947 to 28 October 2016) (Appendix 3)
-
PubMed (1948 to 28 October 2016) (Appendix 4)
-
LILACS (Latin American and Caribbean Health Sciences Literature Database (1982 to 28 October 2016) (Appendix 5)
-
metaRegister of Controlled Trials (mRCT) (www.controlled‐trials.com; last searched 13 May 2013) (Appendix 6)
-
US National Institutes of Health Ongoing Trials Register ClinicalTrials.gov (www.clinicaltrials.gov; searched 28 October 2016) (Appendix 7)
-
World Health Organization International Clinical Trials Registry Platform (www.who.int/ictrp; searched 28 October 2016) (Appendix 8)
Searching other resources
We searched the references of included studies for additional relevant studies, without restriction in terms of language or date of publication.
Data collection and analysis
Selection of studies
Two review authors independently reviewed the titles and abstracts identified through the electronic and manual searches. We classified the titles and abstracts as 'definitely include,', 'unsure,' or 'definitely exclude.' We retrieved full‐text articles for those classified as 'definitely include' or 'unsure' and reassessed them according to the inclusion criteria of the review. We consulted a third review author whenever disagreements arose. For non‐English and non‐Mandarin articles, we used Cochrane worldwide resources to identify translators for specific languages. All publications from studies meeting the inclusion criteria underwent assessment for risk of bias and data extraction. We contacted the authors of articles to obtain further information as needed. We excluded studies classified as 'definitely exclude' after full‐text retrieval, and recorded reasons for exclusions in the 'Characteristics of excluded studies' tables.
Data extraction and management
For English and Mandarin full texts, two review authors independently extracted the study description and data for the primary and secondary outcomes on to paper data collection forms developed in collaboration with Cochrane Eyes and Vision. We resolved discrepancies by discussion to reach consensus. For full texts in Korean, one review author (YK) extracted the data. One review author entered data into Review Manager 5 (RevMan 2014), and a second review author verified the data entry.
Assessment of risk of bias in included studies
Two review authors independently assessed the risk of bias of included studies as part of the data extraction process. We followed the tools for assessing risk of bias set forth in Chapter 8 of the Cochrane Handbook for Systematic Reviews of Interventions (Higgins 2011a). We examined the studies for the following 'Risk of bias' criteria: random sequence generation; allocation concealment; masking of participants, personnel, and outcome assessors; incomplete outcome data; selective outcome reporting; funding source; and other sources of bias. We labeled each quality criterion as high risk of bias, low risk of bias, or unclear risk of bias (lack of information or uncertainty over the potential for bias). We recorded the assessments in the 'Characteristics of included studies' tables.
Measures of treatment effect
Continuous data
For continuous outcomes, we analyzed the treatment effect as mean difference (MD) with 95% confidence intervals (CI). Continuous outcomes included SIA, BCVA, ECL, CCT, CDE use, amount of BSS, surgical time, and phacoemulsification time. None of the continuous outcomes used different scales, therefore we did not calculate standardized mean differences (SMDs); however, if appropriate, we would do so in future updates of this review.
Dichotomous data
We reported the treatment effect for dichotomous outcomes using risk ratio (RR).
Unit of analysis issues
The unit of analysis was the participant. None of the included trials had assigned individual eyes of a participant to different interventions (standard phacoemulsification, C‐MICS, or B‐MICS). Sample sizes in some included trials suggested paired‐eye trials because the number of eyes included was twice the number of participants (Capella 2010; Hwang 2016; Musanovic 2012; Zhu 2014). We referred to Chapter 16 of the Cochrane Handbook for Systematic Reviews of Interventions as a guide for intraperson correlation between eyes (Higgins 2011b).
Dealing with missing data
We referred to guidelines in Chapter 16 of the Cochrane Handbook for Systematic Reviews of Interventions for information on handling missing data (Higgins 2011b). We attempted to contact study investigators to obtain missing data or to clarify reported information that was unclear. When the investigators did not respond within six weeks or after three attempts at contact, we extracted data as available from the published report.
Assessment of heterogeneity
We examined clinical, methodological, and statistical heterogeneity of the included studies. We used the I2 statistic (%) to determine the proportion of variation in effect estimation, and concluded that an I2 statistic above 50% suggested substantial statistical heterogeneity (Higgins 2003).
Assessment of reporting biases
All meta‐analyses included fewer than 10 trials, therefore we did not use funnel plots to identify any publication biases. If more trials are added to future versions of the review, and the meta‐analysis includes more than 10 trials, we intend to use funnel plots to identify potential publication bias.
Data synthesis
We summarized data from trials that had reported comparable outcome measures at similar follow‐up times. In the absence of clinical, methodological, and substantial statistical heterogeneity, we performed meta‐analysis. We used the fixed‐effect model for meta‐analysis of three or fewer trials. We used a random‐effects model for meta‐analysis of outcome data from more than three trials.
Sensitivity analysis
We intended to conduct sensitivity analyses to determine the impact of excluding studies with lower methodological quality, including exclusion of industry‐funded studies and unpublished studies. However, data were insufficient to conduct such analyses.
Strength of evidence
We rated the strength of evidence using the GRADE approach (GRADEpro GDT 2015; Guyatt 2011), as recommended in the Cochrane Handbook (Schünemann 2011). We used the domains of risk of bias, directness of the evidence, inconsistency, imprecision, and publication bias.
'Summary of findings' table
We presented our results in a 'Summary of findings' table for four comparisons (Types of interventions). We presented the following six outcomes at three months' follow‐up.
-
SIA data when measured
-
Postoperative BCVA on the LogMAR scale
-
Mean ECL measured with non‐contact specular microscopy (cell/mm2 or percentage decrease)
-
Mean CCT measured with ultrasonic pachymeter (μm or percentage increase)
-
Adverse events
-
Quality of life as measured by any validated instruments
Results
Description of studies
Results of the search
As of 28 October 2016, the electronic search yielded 6808 records (Figure 1). There were 2607 records after removal of duplicates. The search of trial registries yielded 439 registered trials. There were 287 unique registered trials after removal of duplicates. We retrieved 72 full‐text articles, of which we included 26 studies and excluded 46 studies with the reasons shown in the Characteristics of excluded studies table.

Study flow diagram.
Included studies
Twenty‐six RCTs met the inclusion criteria of this review. Five of the 26 trials compared three interventions. Further details can be found in the Characteristics of included studies table.
Size of studies
There were 26 RCTs with a total of 2737 participants (3120 eyes). The number of participants in each trial ranged from 30, in Mastropasqua 2011, to 362, in Shan 2016.
Location of studies
One trial was conducted in Bosnia and Herzegovina (Musanovic 2012), 13 trials in China (Hui 2016; Li 2016; Lin 2013; Luo 2012; Mao 2008; Shan 2016; Shi 2013; Wang 2009; Yao 2008; Yao 2011; Yu 2016; Zhang 2014; Zhu 2014), one trial in France (Febbraro 2015), one trial in India (Vasavada 2013a), one trial in Italy (Mastropasqua 2011), five trials in Korea (Hwang 2008; Hwang 2016; Jeong 2013; Li 2011; Moon 2011), two trials in Spain (Capella 2010; Morcillo‐Laiz 2009), one trial in Switzerland (Dosso 2008), and one trial in Turkey (Can 2010).
Comparisons
Five trials had three arms (Can 2010; Febbraro 2015; Luo 2012; Moon 2011; Yu 2016). Can 2010 was included in all pair‐wise comparisons, except the smaller C‐MICS versus standard phacoemulsification comparison. Febbraro 2015, Luo 2012, and Moon 2011 were included in all pair‐wise comparisons except B‐MICS compared with standard phacoemulsification. Yu 2016 was only included in the comparison between the smaller C‐MICS and standard phacoemulsification, as the third arm was microincisions with 2.0 mm incision, which is not of interest to this review. Follow‐up time of these trials ranged from one to six months.
-
Fifteen trials compared the larger C‐MICS with standard phacoemulsification (Can 2010; Febbraro 2015; Hwang 2008; Hwang 2016; Jeong 2013; Li 2011; Li 2016; Lin 2013; Luo 2012; Moon 2011; Musanovic 2012; Shan 2016; Shi 2013; Wang 2009; Zhu 2014).
-
Nine trials compared the smaller C‐MICS with standard phacoemulsification (Capella 2010; Dosso 2008; Febbraro 2015; Hui 2016; Luo 2012; Moon 2011; Yao 2011; Yu 2016; Zhang 2014).
-
Six trials compared the smaller C‐MICS with the larger C‐MICS (Can 2010; Febbraro 2015; Luo 2012; Mastropasqua 2011; Moon 2011; Vasavada 2013a).
-
Four trials compared B‐MICS with standard phacoemulsification (Can 2010; Mao 2008; Morcillo‐Laiz 2009; Yao 2008).
We did not make the following comparisons, as none of the included trials reported them.
-
B‐MICS versus the larger C‐MICS
-
B‐MICS versus the smaller C‐MICS
Type of IOL used
Five trials did not report the type of IOL inserted (Can 2010; Li 2011; Musanovic 2012; Shan 2016; Zhu 2014).
The types of IOL used for the standard phacoemulsification were: AKREOS MI60 IOL (Bausch & Lomb), Lentis L‐303 IOL (WaveLight GmbH), Adapt AO IOL (Bausch & Lomb, Rochester, NY, USA), SA60AT IOL (AcrySof; Alcon, USA), SN60WF IOL (Alcon), SENSER IOL (AMO), Y601075 (AJL, A ́lava, Spain), Staar KS‐1 (Canon), PY‐60 (Hoya, Japan), and ZEISS SPHERIS 209M.
The types of IOL used for the larger C‐MICS were: AcrySof Natural SN60WF IOL (Alcon, Fort Worth, TX, USA), SA60AT IOL (AcrySof; Alcon, USA), MI60 IOL (Bausch & Lomb, Rochester, NY, USA), and AcrySof IQ IOL (Alcon, Fort Worth, TX, USA).
A limited number of IOLs could be used for the smaller C‐MICS: AKREOS MI60 IOL (Bausch & Lomb), Lentis L‐303 IOL (WaveLight GmbH), AcrySof SN60WF IOL (Alcon), and ZEISS ASPHINA 509M.
The types of IOL used for B‐MICS, which was the smallest‐sized incision, were: Acri.Smart46s (Acti.Tec), Acri.Smart 48S, and MI60 IOL (Bausch & Lomb).
Excluded studies
We excluded 46 full‐text articles and documented our reasons for exclusion in the Characteristics of excluded studies tables.
Risk of bias in included studies
See 'Risk of bias' graph (Figure 2) and 'Risk of bias' summary table (Figure 3).
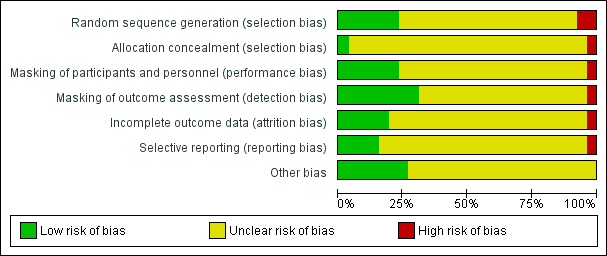
Risk of bias graph: review authors' judgements about each risk of bias item presented as percentages across all included studies.

Risk of bias summary: review authors' judgements about each risk of bias item for each included study.
Allocation
We judged one trial to be at high risk, six trials at low risk, and 19 trials at unclear risk of selection bias based on the reporting of random sequence generation. When the study investigators reported the method of randomization, we judged the study to be at low risk of selection bias. We judged Capella 2010 to be at high risk of bias because it was reported as a "prospective and randomised study" (p269), but the authors noted through email correspondence that the treatment assignment was by "alternating one‐by‐one."
We judged the following six trials to be at low risk of bias. Luo 2012 used a random number generator, and participants were assigned by the remainder after dividing by 3. Participants in Mastropasqua 2011 were randomly assigned to group 1 or group 2 the day before surgery by block randomization (randomly assigned by computer‐generated numbers). After contacting the study investigator, Vasavada 2013a replied that "randomization was done using computer generated random numbers." Hui 2016, Yao 2008, and Yao 2011 used "random numbers table" for sequence generation. Study investigators of the remaining trials mentioned that participants were randomized but did not specify the methods for random sequence generation, therefore we judged them to be at unclear risk of bias.
We judged Capella 2010 to have inadequate allocation concealment; if the treatment was assigned by alternating one‐by‐one, participants might be able to guess their or the next treatment assignment. We judged Vasavada 2013a to have sufficient allocation concealment as the authors had informed us through email correspondence that the random number sequence was stored in a sequentially number and sealed envelope in a dedicated box in the operating room. The remaining trials did not provided sufficient information to determine whether treatment allocation was adequately concealed before randomization and were therefore judged to be at unclear risk of bias.
Masking (performance bias and detection bias)
We judged one trial to be high risk, six trials to be at low risk, and 19 trials at unclear risk of performance and detection bias. The authors of the trial judged to be at high risk of performance and detection bias reported through email that the participants, personnel, and outcome assessors were not masked. Trials that we judged to be at low risk of performance and detection bias explicitly reported masking of participants, personnel, and outcome assessors. Mastropasqua 2011 reported that participants and examiners performing preoperative and postoperative controls were masked to the surgical technique in each case. Morcillo‐Laiz 2009 was a double‐blind clinical trial, and neither the participants nor the examiners knew which technique had been applied. Vasavada 2013a reported only that the trial was "double blind" (participants and outcome assessors) in the article; after contacting the study investigator, we received the following reply: "the patients and outcome assessors were blind to the technique used, however, the surgeon was not. The outcome assessor was another ophthalmologist, and not the operating surgeon." Wang 2009 reported that participants and examiners were masked to the group assignment. In Yao 2008 and Yao 2011, participants were masked to their treatment groups; surgeons could not be masked, and standard surgical procedures were followed that were unlikely to result in bias. Study investigators of Luo 2012 mentioned that only the technician and surgeon were masked during postoperative examinations, so we judged this trial to be at low risk of detection bias and unclear risk of performance bias. Hwang 2016 did not report whether the participants were masked, but the image examiner was masked, so we judged this trial to be at low risk of detection bias and unclear risk of performance bias.
Incomplete outcome data
We judged one trial to be at high risk of bias, five at low risk of bias, and the remaining 20 trials at unclear risk of bias. The five trials judged to be at low risk of bias reported that either no participants or no more than 10% of participants were lost to follow‐up. Capella 2010 reported that 3% of 37 participants were lost to follow‐up; Morcillo‐Laiz 2009 reported that 10% of 94 participants were lost to follow‐up; and in Yao 2011 9% of 89 participants were lost to follow‐up. We judged Lin 2013 to be at high risk of bias as participants were excluded postrandomization. Luo 2012 and Vasavada 2013a reported that no participants were lost to follow‐up and were judged to be at low risk of attrition bias.
Selective reporting
We judged one trial to be at high risk of reporting bias. In the methods description of Musanovic 2012, four outcomes were described; two of them, corneal keratometry and corneal astigmatism, were not reported in the results section.
We judged four trials to be at low risk of reporting bias. Four studies were registered (Hwang 2016; Luo 2012; Vasavada 2013a; Yu 2016). The outcomes that were described in the registry search were consistent with those reported in the papers.
We could not obtain the protocol or trial registration number for the remaining 21 trials and judged them to be at unclear risk of reporting bias. The authors of one trial noted through email correspondence that they did not publish the protocol or register the trial.
Other potential sources of bias
We judged seven trials to be at low risk of other potential sources of bias because they were not funded by device manufacturers or had declared no conflict of interest (Can 2010; Li 2011; Li 2016; Luo 2012; Mastropasqua 2011; Musanovic 2012; Yu 2016). The remaining 19 trials did not report their source of funding or conflict of interest, therefore we judged them to be at unclear risk of bias.
Effects of interventions
See: Summary of findings for the main comparison Larger coaxial microincision cataract surgery (C‐MICS) versus standard phacoemulsification; Summary of findings 2 Smaller coaxial microincision cataract surgery (C‐MICS) versus standard phacoemulsification; Summary of findings 3 Smaller coaxial microincision cataract surgery (C‐MICS) versus larger C‐MICS; Summary of findings 4 Biaxial microincision cataract surgery (B‐MICS) versus standard phacoemulsification
1. The larger C‐MICS versus standard phacoemulsification
Fifteen trials reported outcomes for this comparison (Can 2010; Febbraro 2015; Hwang 2008; Hwang 2016; Jeong 2013; Li 2011; Li 2016; Lin 2013; Luo 2012; Moon 2011; Musanovic 2012; Shan 2016; Shi 2013; Wang 2009; Zhu 2014). Shi 2013 included both eyes of 34 of 98 participants (35%) in the study, but they did not report to which group the eyes were allocated and did not account for intraperson correlation in their analysis. The larger C‐MICS refers to the C‐MICS with 2.2‐millimeter incision.
Surgically induced astigmatism (SIA)
Surgically induced astigmatism was reported in nine out of the 15 trials at three months' follow‐up (Febbraro 2015; Hwang 2016; Lin 2013; Moon 2011; Musanovic 2012; Shan 2016; Shi 2013; Wang 2009; Zhu 2014). None of the trials reported on SIA at one year postoperatively. Moon 2011 reported the mean SIA in both groups, but did not report the standard deviation (SD) or standard error and also did not state clearly what the reported exact P value was testing. The mean SIA in the larger C‐MICS group was 0.54 D, while it was 0.72 D in the standard phacoemulsification group.
The small difference suggested from eight trials may not have clinical importance (Analysis 1.1; mean difference (MD) ‐0.19 D, 95% confidence interval (CI) ‐0.30 to ‐0.09; 996 eyes; I2 = 73%). We judged the evidence at three months to be very low‐certainty due to unexplained statistical heterogeneity (downgraded one level) and high risk of bias, as one study was at high risk of selection and attrition bias, while another study was at high risk of reporting bias (downgraded two levels).
Best‐corrected visual acuity (BCVA)
Seven of 15 trials reported BCVA at three months' follow‐up (Can 2010; Hwang 2008; Hwang 2016; Lin 2013; Moon 2011; Shan 2016; Wang 2009). Hwang 2008, Lin 2013, and Shan 2016 did not report the units of the BCVA measurement, which could be either decimal or logMAR units, therefore we did not include their data in the meta‐analysis. We also could not include Wang 2009's BCVA data as it was reported as the percentages of participants that had greater or equal to 1.0 D, 0.8 D, or 0.5 D. The authors of Wang 2009 also noted that "postoperative uncorrected distance visual acuity tended to be better with the smaller incisions, but this trend did not reach statistical significance (P = 0.07)."
At three months after surgery, three trials showed little or no difference between the larger C‐MICS group and the standard phacoemulsification group (Analysis 1.2; MD 0.00 logMAR units, 95% CI ‐0.02 to 0.02; 242 eyes; I2 = 29%). We judged the certainty of the evidence to be low due to unclear risk of selection bias and attrition bias (downgraded two levels).
Endothelial cell loss (ECL)
Four of 15 trials reported mean ECL at three months' follow‐up (Li 2011; Moon 2011; Shan 2016; Zhu 2014). No significant difference was found between the larger C‐MICS and standard phacoemulsification (Analysis 1.3; MD ‐7.23 cells/mm2, 95% CI ‐78.66 to 64.20; 596 eyes; 4 trials; I2 = 0%). We judged the certainty of the evidence to be low due to risk of bias, as the studies were at unclear risk of selection, performance, detection, and attrition bias (downgraded two levels).
Central corneal thickness (CCT)
Six of 15 trials reported this outcome at any time point (Can 2010; Hwang 2016; Jeong 2013; Li 2011; Wang 2009; Zhu 2014). Hwang 2016 did not report the standard deviation, but reported the mean % increase in CCT: the mean % increase in CCT was 1.00% in the larger C‐MICS group and 0.31% in the standard phacoemulsification group. Four of the five studies included in Analysis 1.4 reported the mean CCT at three months (Can 2010; Li 2011; Wang 2009; Zhu 2014). In contrast, Jeong 2013 reported the mean change in CCT. Since the reported the baseline mean CCT was similar in Jeong 2013, we decided it was appropriate to include their results in Analysis 1.4; at baseline the mean CCT was 530.02 (32.61) μm for the larger C‐MICS group and 534.86 (31.23) μm for the standard phacoemulsification group, therefore we included their data in the meta‐analysis.
Five trials showed little or no difference in CCT between the larger C‐MICS and standard phacoemulsification groups at three months' postoperatively (Analysis 1.4; MD ‐0.68 μm, 95% CI ‐3.26 to 1.90; 487 eyes; I2 = 0%). We judged the certainty of the evidence to be low due to risk of bias, as the studies were at unclear risk of selection, performance, detection, and attrition bias (downgraded two levels).
Intraoperative parameters
Six of 15 trials described intraoperative parameters (Can 2010; Jeong 2013; Li 2011; Luo 2012; Shan 2016; Wang 2009).
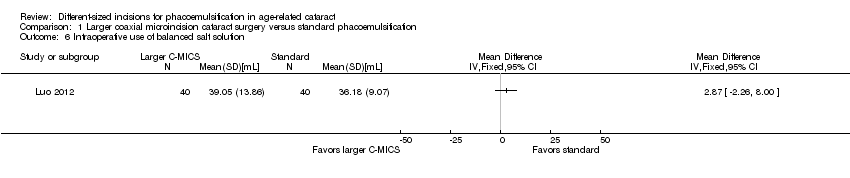
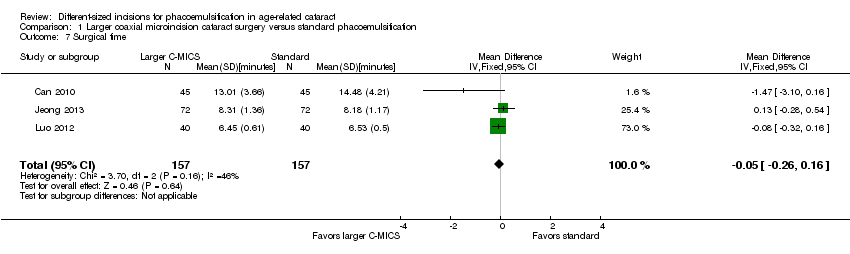
Studies comparing the larger C‐MICS with standard phacoemulsification showed little or no difference in intraoperative use of cumulative dissipated energy (CDE) (Analysis 1.5; MD ‐0.30%, 95% CI ‐1.33 to 0.72; 784 participants; 6 trials), intraoperative use of balanced salt solutions (BSS) (Analysis 1.6; MD 2.87 mL, 95% CI ‐2.26 to 8.00; 80 eyes; 1 trial), surgical time (Analysis 1.7; MD ‐0.05 minutes, 95% CI ‐0.26 to 0.16; 314 eyes; 3 trials; I2 = 46%), and phacoemulsification time (Analysis 1.8; MD ‐0.96 seconds, 95% CI ‐3.48 to 1.56; 608 eyes; 4 trials; I2 = 55%). The duration of surgical time and phacoemulsification time depends on the skills and preferences of different surgeons. We judged the certainty of the evidence to be low as we downgraded for unexplained statistical heterogeneity (downgraded two levels).
Adverse events
One of 15 trials reported that none of the participants experienced endophthalmitis or posterior capsule rupture (Shan 2016). The same trial reported little or no difference in the risk ratio (RR) of corneal edema (Analysis 1.9; RR 1.02, 95% CI 0.40 to 2.63; 362 eyes).
Wang 2009 reported "no intraoperative complications."
Quality of life
None of the 15 trials reported on quality of life.
2. The smaller C‐MICS versus standard phacoemulsification
Nine trials compared these surgical approaches with respect to one or more outcomes of interest (Capella 2010; Dosso 2008; Febbraro 2015; Hui 2016; Luo 2012; Moon 2011; Yao 2011; Yu 2016; Zhang 2014). The smaller C‐MICS refers to the C‐MICS with 1.8‐millimeter incision.
Surgically induced astigmatism (SIA)
Seven of nine trials reported this outcome at three months' follow‐up (Capella 2010; Febbraro 2015; Hui 2016; Moon 2011; Yao 2011; Yu 2016; Zhang 2014). Two trials did not provide sufficient data to be included in a meta‐analysis (Moon 2011; Yu 2016). Yu 2016 reported the group means and exact P value at three months' follow‐up, and did not report the standard deviation by group, therefore the data could not be included in the meta‐analysis. Moon 2011 reported the mean SIA in both groups, but did not report the group standard deviation. The mean SIA was 0.43 D in the smaller C‐MICS group, and 0.72 D in the standard phacoemulsification group.
Meta‐analysis of five trials favored the smaller C‐MICS group over standard phacoemulsification (Analysis 2.1; MD ‐0.23 D, 95% CI ‐0.34 to ‐0.13; 561 eyes; I2 = 74%). The certainty of evidence was very low as we downgraded for unexplained statistical heterogeneity and high risk of selection, performance, and detection biases.
Best‐corrected visual acuity (BCVA)
Three of nine trials reported this outcome at two to three months' follow‐up (Dosso 2008; Moon 2011; Yao 2011). The smaller C‐MICS group showed slightly better to no difference in BCVA results than standard phacoemulsification (Analysis 2.2; MD ‐0.02 logMAR unit, 95% CI ‐0.03 to ‐0.00; 192 eyes; I2 = 0%). The certainty of the evidence was low as we downgraded for high risk of bias as two studies were at unclear risk of selection, performance, detection, attrition, and reporting bias (downgraded two levels).
Endothelial cell loss (ECL)
Five of nine trials reported ECL after surgery (Capella 2010; Dosso 2008; Hui 2016; Moon 2011; Yao 2011). At three months' postoperatively, meta‐analysis of five trials showed little or no difference between the smaller C‐MICS and standard phacoemulsification groups (Analysis 2.3; MD 7.56 cells/mm2, 95% CI ‐67.65 to 82.77; 380 eyes; I2 = 12%). We judged the certainty of the evidence to be low as we downgraded for high risk of selection, performance, and detection bias (downgraded two levels).
Central corneal thickness (CCT)
Three of nine trials reported CCT change (Capella 2010; Dosso 2008; Yao 2011). The meta‐analysis of the three trials showed little or no difference between the smaller C‐MICS and standard phacoemulsification groups at three months' postoperatively (Analysis 2.4; MD ‐1.52 μm, 95% CI ‐6.29 to 3.25; 245 eyes; I2 = 49%). We judged the certainty of the evidence to be low due to high risk of bias, including selection, performance, and detection bias (downgraded two levels).
Intraoperative parameters
Three of nine trials reported intraoperative parameters (Dosso 2008; Luo 2012; Yao 2011). The smaller C‐MICS group was slightly favored over the standard phacoemulsification group in CDE (Analysis 2.5; MD ‐4.25%, 95% CI ‐5.43 to ‐3.07; 360 eyes; 2 trials; I2 = 78%). The evidence showed little or no difference between groups for the use of BSS (Analysis 2.6; MD ‐1.93 mL, 95% CI ‐6.32 to 2.46; 130 eyes; 2 trials; I2 = 85%), surgical time (Analysis 2.7; MD ‐0.14 minutes, 95% CI ‐0.35 to 0.07; 130 eyes; 2 trials; I2 = 93%), and phacoemulsification time (Analysis 2.8; MD 8.20 seconds, 95% CI 2.88 to 13.52; 130 eyes; 2 trials; I2 = 97%). Authors of Yao 2011 reported effective phacoemulsification time, which is a different measure than that reported by the authors of Dosso 2008 and Luo 2012. We were not able to identify a citation to convert effective phacoemulsification time to phacoemulsification time. The authors of Yao 2011 reported the mean effective phacoemulsification time was 6.71 seconds (SD = 4.14) in the smaller C‐MICS group and 6.84 seconds (SD = 4.01) in the standard phacoemulsification group, showing little or no difference between the groups (MD ‐0.13 seconds, 95% CI ‐1.92 to 1.66; 40 eyes). We downgraded the certainty of the evidence to very low for unexplained statistical heterogeneity (downgraded two levels) and wide confidence intervals (downgraded one level).
Adverse events
None of the nine trials reported on adverse events.
Quality of life
None of the nine trials reported on quality of life.
3. The smaller C‐MICS versus the larger C‐MICS
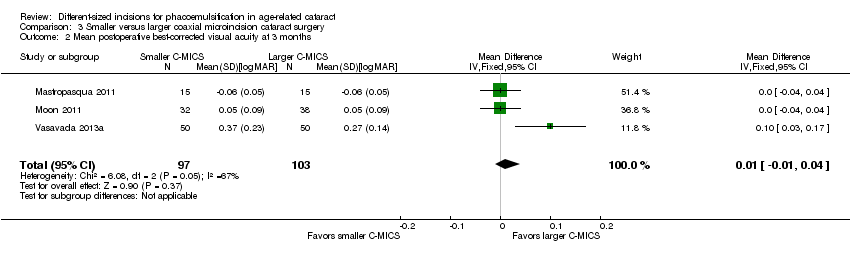
Six trials compared these surgical techniques (Can 2010; Febbraro 2015; Luo 2012; Mastropasqua 2011; Moon 2011; Vasavada 2013a). Since C‐MICS is used for two incision sizes and for clarity, we have referred to the smaller incision as C‐MICS with 1.8‐millimeter incision and the larger incision as C‐MICS with 2.2‐millimeter incision.
Surgically induced astigmatism (SIA)
Four of the six trials reported this outcome at three months' follow‐up (Febbraro 2015; Mastropasqua 2011; Moon 2011; Vasavada 2013a). We did not include Moon 2011 in the meta‐analysis as they reported the mean SIA in both groups, but did not report data to calculate SDs. The mean SIA was 0.43 D in the C‐MICS (1.8 mm) group, and 0.54 D in the larger C‐MICS group.
The meta‐analysis showed little or no difference in SIA between the smaller and larger C‐MICS groups in three trials (Analysis 3.1; MD 0.04 D, 95% CI ‐0.09 to 0.16; 259 eyes; I2 = 78%). We judged the evidence to be of low‐certainty as we downgraded for unexplained statistical heterogeneity (downgraded two levels).
Best‐corrected visual acuity (BCVA)
Three of the six trials reported this outcome (Mastropasqua 2011; Moon 2011; Vasavada 2013a). The meta‐analysis showed little or no difference in BCVA at three months' postoperatively (Analysis 3.2; MD 0.01 logMAR, 95% CI ‐0.01 to 0.04; 200 eyes; I2 = 67%). Moon 2011 reported a SD of 0.9 in both groups, which is abnormally high and therefore presumed to be a typo; we entered an SD of 0.09 instead. We judged the evidence to be of low‐certainty, downgrading for unexplained statistical heterogeneity (downgraded two levels).
Endothelial cell loss (ECL)
Moon 2011 was the only trial to report the mean ECL and showed less ECL in the larger C‐MICS group than in the smaller C‐MICS group (Analysis 3.3; MD 213.00 cells/mm2, 95% CI 11.15 to 414.85; 70 eyes). We judged the evidence to be of very low‐certainty, downgrading for risk of bias as the study was judged to be at unclear risk of selection, performance, detection, attrition, and reporting bias (downgraded one level) and imprecision, as only one trial reported ECL at three months' follow‐up (downgraded two levels).
Central corneal thickness (CCT)
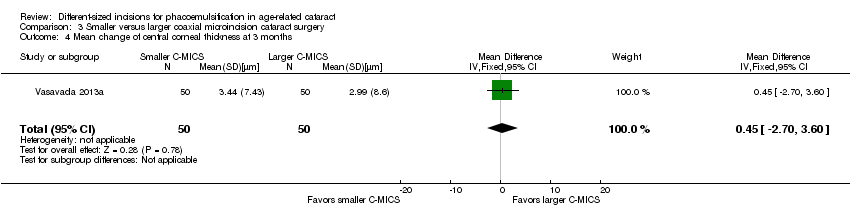
One of the six trials reported CCT (Vasavada 2013a). The mean change of CCT comparing smaller C‐MICS with larger C‐MICS was 3.44 ± 7.43 μm versus 2.99 ± 8.6 μm at three months' postoperatively, respectively. The difference in change of CCT was trivial or nonexistent comparing the two groups at three months' postoperatively (Analysis 3.4; MD 0.45 μm, 95% CI ‐2.70 to 3.60; 100 eyes). We judged the evidence to be of low‐certainty, downgrading for imprecision, as only one trial reported CCT at three months' follow‐up (downgraded two levels).
Intraoperative parameters
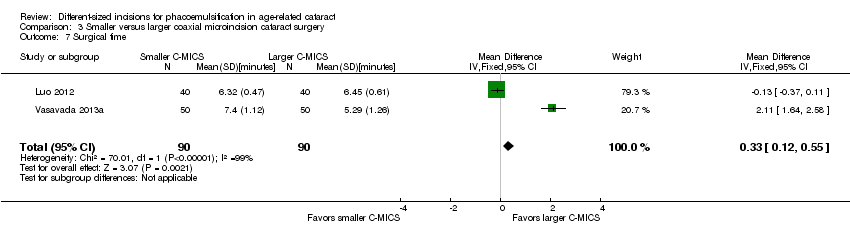
Four of five trials reported intraoperative parameters (Can 2010; Luo 2012; Mastropasqua 2011; Vasavada 2013a). Meta‐analysis showed little or no difference in the use of CDE (Analysis 3.5; MD ‐0.33%, 95% CI ‐3.72 to 3.07; 300 eyes; 4 trials; I2 = 82%) or the use of BSS (Analysis 3.6; MD 1.04 mL, 95% CI ‐2.45 to 4.53; 210 eyes; 3 trials; I2 = 82%). Two trials reported the mean surgical time for each group (Luo 2012; Vasavada 2013a). Meta‐analysis showed surgical times to be slightly longer in the smaller C‐MICS group compared with larger C‐MICS group (Analysis 3.7; MD 0.33 minutes, 95% CI 0.12 to 0.55; 180 eyes; I2 = 99%). The study investigators of Luo 2012 were the only ones to report mean phacoemulsification times and showed there was little or no difference in phacoemulsification time between the two groups (Analysis 3.8; MD ‐4.29 seconds, 95% CI ‐12.08 to 3.50; 80 eyes; I2 = 0%). We judged the evidence to be of low‐certainty, downgrading for unexplained statistical heterogeneity (downgraded one level) and imprecision of results (downgraded one level).
Adverse events
None of the six trials reported on adverse events.
Quality of life
None of the six trials reported on quality of life.
4. B‐MICS versus standard phacoemulsification
We found four trials that compared these procedures (Can 2010; Mao 2008; Morcillo‐Laiz 2009; Yao 2008).
Surgically induced astigmatism (SIA)
Two of four trials reported this outcome at different postoperative time points (Morcillo‐Laiz 2009; Yao 2008). Meta‐analysis showed little or no difference between the B‐MICS group and the standard phacoemulsification group at three months (Analysis 4.1; MD ‐0.01 D, 95% CI ‐0.03 to 0.01; 368 eyes; I2 = 0%). We judged the evidence to be of moderate‐certainty, downgrading only for risk of bias, as the trials were judged to be at unclear risk of selection and reporting bias (downgraded one level).
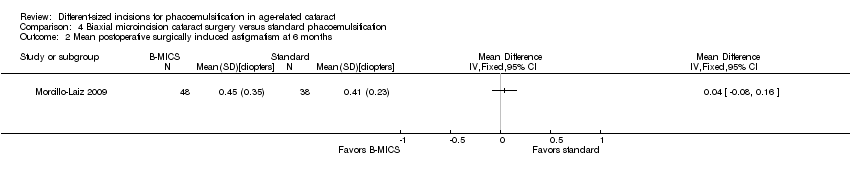
Only Morcillo‐Laiz 2009 reported SIA at six months' postoperatively; the mean SIA comparing the B‐MICS group and the standard phacoemulsification group was 0.45 ± 0.35 D versus 0.41 ± 0.23 D, respectively. The trial results showed little or no difference between the B‐MICS group and the standard phacoemulsification group (Analysis 4.2; MD 0.04 D, 95% CI ‐0.08 to 0.16; 86 eyes).
Best‐corrected visual acuity (BCVA)
Three of four trials reported this outcome at three months (Can 2010; Morcillo‐Laiz 2009; Yao 2008). The meta‐analysis of the three trials favored B‐MICS over standard phacoemulsification, but the difference was trivial (Analysis 4.3; MD ‐0.02 logMAR units, 95% CI ‐0.04 to ‐0.00; 464 eyes; I2 = 71%). We judged the evidence to be of low‐certainty, downgrading for unexplained statistical heterogeneity (downgraded two levels).
Endothelial cell loss (ECL)
One of four trials reported this outcome three months' postoperatively (Yao 2008). Evidence from study investigators of Yao 2008 reported that the mean ECL slightly favored B‐MICS over standard phacoemulsification, but this was clinically trivial (Analysis 4.4; MD 55.83 cells/mm2, 95% CI ‐34.93 to 146.59; 280 eyes). We graded the evidence as of low‐certainty, downgrading for imprecision and because only one trial reported ECL at three months' follow‐up (downgraded two levels).
Central corneal thickness (CCT)
One of four trials reported this outcome (Can 2010). Can 2010 found no clinically important difference between the two surgical approaches three months' postoperatively (Analysis 4.5; MD 0.10 μm, 95% CI ‐14.04 to 14.24; 90 eyes). We judged the evidence to be of low‐certainty, downgrading for imprecision and because only one trial reported CCT at three months' follow‐up (downgraded two levels).
Intraoperative parameters
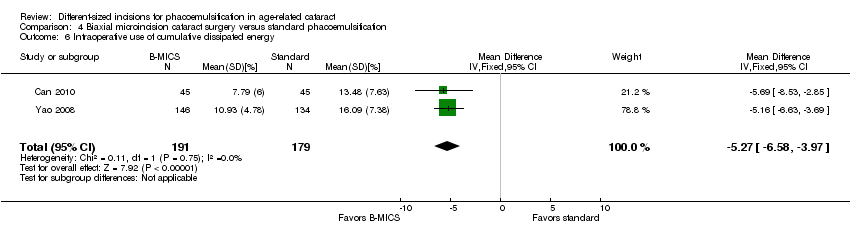
Two of four trials reported these outcomes (Can 2010; Yao 2008). Less CDE was used in the B‐MICS group than in the standard phacoemulsification group (Analysis 4.6; MD ‐5.27%, 95% CI ‐6.58 to ‐3.97; 370 eyes; 2 trials; I2 = 0%). The mean surgical time, reported by one study, was longer in the B‐MICS group compared with the standard phacoemulsification group (Analysis 4.7; MD 4.31 minutes, 95% CI 2.03 to 6.59; 90 eyes); however, the phacoemulsification time in the B‐MICS group was less than in the standard phacoemulsification group in two studies (Analysis 4.8; MD ‐5.58 seconds, 95% CI ‐9.52 to ‐1.63; 370 eyes; I2 = 0%).
We judged the evidence to be of low‐certainty, downgrading for imprecision of results and inconsistency (downgraded two levels).
Adverse events
None of the four trials reported on adverse events.
Quality of life
None of the four trials reported on quality of life.
Discussion
Summary of main results
Comparison between larger C‐MICS and standard phacoemulsification
Fifteen trials compared these interventions, but half of these trials or fewer reported data for each outcome of interest in this review (summary of findings Table for the main comparison). The larger C‐MICS group was favored over the standard phacoemulsification group for SIA and BCVA at three months' follow‐up, but all differences were clinically small. The ECL, CCT change, and four intraoperative parameters showed little or no difference between the two groups. One trial reported on corneal edema, and another trial reported that there were no complications.
Comparison between smaller C‐MICS and standard phacoemulsification
Nine trials compared these phacoemulsification approaches. The smaller C‐MICS was favored over standard phacoemulsification for SIA and BCVA, but the differences were small (summary of findings Table 2). There was little or no difference with respect to ECL and CCT change. Of the four intraoperative parameters, only CDE favored the smaller C‐MICS. The included trials did not report on adverse events.
Comparison between smaller C‐MICS and larger C‐MICS
Six trials reported on this comparison. We found little or no difference in SIA, BCVA, and CCT change at three months' follow‐up (summary of findings Table 3). The surgical time in the larger C‐MICS showed a slight advantage over the smaller C‐MICS. However, other intraoperative parameters including CDE, phacoemulsification time, and the use of BSS showed little or no difference. None of the trials reported on adverse events.
Comparison between B‐MICS and standard phacoemulsification
Four trials reported on this comparison. We found no difference or a clinically unimportant difference in SIA, BCVA, ECL, and CCT at three months' follow‐up (summary of findings Table 4). The surgical time was longer in the B‐MICS group than in the standard phacoemulsification group, whereas phacoemulsification time and CDE in the B‐MICS group was less than in the standard phacoemulsification group. None of the included trials reported on adverse events.
Overall completeness and applicability of evidence
We included 26 RCTs, of which half were conducted in China. Meta‐analysis was possible for the primary review outcome comparing all four different‐sized incisions: <= 1.5 mm, 1.8 mm, 2.2 mm, and approximately 3.0 mm. However, the meta‐analysis results were inconsistent when comparing all four different‐sized incisions, and the study methods were poorly reported. The low‐ to very low‐certainty evidence did not consistently show that phacoemulsification with smaller incisions was associated with less surgically induced astigmatism compared with phacoemulsification with larger incisions. Poor reporting of the methods of all included studies resulted in a judgement of mostly unclear risk of bias.
Potential biases in the review process
We followed standard Cochrane methods and have no potential biases to report.
Agreements and disagreements with other studies or reviews
Shentu 2016 conducted a meta‐analysis of 15 RCTs, reported as of May 2015, to compare the larger C‐MICS with 2.2‐millimeter incision and standard phacoemulsification. In this review, the larger C‐MICS had less SIA at one week and one month postoperatively; no between‐group differences were detected in BSS use, CDE, BCVA, or CCT change. Their findings were consistent with our review except for that of BCVA. Seventeen studies included in this review were not included in Shentu 2016 (Capella 2010; Febbraro 2015; Hui 2016; Hwang 2008; Jeong 2013; Li 2016; Lin 2013; Mao 2008; Mastropasqua 2011; Moon 2011; Musanovic 2012; Shan 2016; Shi 2013; Vasavada 2013a; Yao 2008; Yu 2016; Zhang 2014).
Our review findings that the astigmatic effects were the same for the smaller and larger C‐MICS are consistent with the conclusions of Febbraro 2015. Also, we agree with Lee 2009 that there were no significant differences in SIA, postoperative BCVA, or amount of BSS used between these two groups.
A meta‐analysis of 11 RCTs, Yu 2012, evaluated the outcomes of B‐MICS versus standard phacoemulsification and showed CDE and phacoemulsification time to be significantly less in the B‐MICS group, which is consistent with our review. However, their review showed less SIA in the B‐MICS group, which is not consistent with our review. The difference in conclusions might be the result of the inclusion of different trials. We excluded eight RCTs that were included in Yu 2012; our reasons for exclusion are listed in the Characteristics of excluded studies table (Alio 2005; Crema 2007; Denoyer 2008; Kahraman 2007; Kurz 2006; Kurz 2009; Mencucci 2006). Also, Mao 2008, which was included in this review, was not included in Yu 2012.

Study flow diagram.

Risk of bias graph: review authors' judgements about each risk of bias item presented as percentages across all included studies.

Risk of bias summary: review authors' judgements about each risk of bias item for each included study.

Comparison 1 Larger coaxial microincision cataract surgery versus standard phacoemulsification, Outcome 1 Mean postoperative surgically induced astigmatism at 3 months.
Comparison 1 Larger coaxial microincision cataract surgery versus standard phacoemulsification, Outcome 2 Mean postoperative best‐corrected visual acuity at 3 months.

Comparison 1 Larger coaxial microincision cataract surgery versus standard phacoemulsification, Outcome 3 Mean change of endothelial cell loss at 3 months.

Comparison 1 Larger coaxial microincision cataract surgery versus standard phacoemulsification, Outcome 4 Mean change of central corneal thickness at 3 months.

Comparison 1 Larger coaxial microincision cataract surgery versus standard phacoemulsification, Outcome 5 Intraoperative use of cumulative dissipated energy.
Comparison 1 Larger coaxial microincision cataract surgery versus standard phacoemulsification, Outcome 6 Intraoperative use of balanced salt solution.
Comparison 1 Larger coaxial microincision cataract surgery versus standard phacoemulsification, Outcome 7 Surgical time.

Comparison 1 Larger coaxial microincision cataract surgery versus standard phacoemulsification, Outcome 8 Phacoemulsification time.

Comparison 1 Larger coaxial microincision cataract surgery versus standard phacoemulsification, Outcome 9 Corneal edema.

Comparison 2 Smaller coaxial microincision cataract surgery versus standard phacoemulsification, Outcome 1 Mean postoperative surgically induced astigmatism at 3 months.

Comparison 2 Smaller coaxial microincision cataract surgery versus standard phacoemulsification, Outcome 2 Mean postoperative best‐corrected visual acuity at 3 months.
Comparison 2 Smaller coaxial microincision cataract surgery versus standard phacoemulsification, Outcome 3 Mean change of endothelial cell loss at 3 months.
Comparison 2 Smaller coaxial microincision cataract surgery versus standard phacoemulsification, Outcome 4 Mean change of central corneal thickness at 3 months.

Comparison 2 Smaller coaxial microincision cataract surgery versus standard phacoemulsification, Outcome 5 Intraoperative use of cumulative dissipated energy.
Comparison 2 Smaller coaxial microincision cataract surgery versus standard phacoemulsification, Outcome 6 Intraoperative use of balanced salt solution.

Comparison 2 Smaller coaxial microincision cataract surgery versus standard phacoemulsification, Outcome 7 Surgical time.

Comparison 2 Smaller coaxial microincision cataract surgery versus standard phacoemulsification, Outcome 8 Phacoemulsification time.

Comparison 3 Smaller versus larger coaxial microincision cataract surgery, Outcome 1 Mean postoperative surgically induced astigmatism at 3 months.
Comparison 3 Smaller versus larger coaxial microincision cataract surgery, Outcome 2 Mean postoperative best‐corrected visual acuity at 3 months.

Comparison 3 Smaller versus larger coaxial microincision cataract surgery, Outcome 3 Mean endothelial cell loss at 3 months.
Comparison 3 Smaller versus larger coaxial microincision cataract surgery, Outcome 4 Mean change of central corneal thickness at 3 months.

Comparison 3 Smaller versus larger coaxial microincision cataract surgery, Outcome 5 Intraoperative use of cumulative dissipated energy.

Comparison 3 Smaller versus larger coaxial microincision cataract surgery, Outcome 6 Intraoperative use of balanced salt solution.
Comparison 3 Smaller versus larger coaxial microincision cataract surgery, Outcome 7 Surgical time.

Comparison 3 Smaller versus larger coaxial microincision cataract surgery, Outcome 8 Phacoemulsification time.

Comparison 4 Biaxial microincision cataract surgery versus standard phacoemulsification, Outcome 1 Mean postoperative surgically induced astigmatism at 3 months.
Comparison 4 Biaxial microincision cataract surgery versus standard phacoemulsification, Outcome 2 Mean postoperative surgically induced astigmatism at 6 months.

Comparison 4 Biaxial microincision cataract surgery versus standard phacoemulsification, Outcome 3 Mean postoperative best‐corrected visual acuity at 3 months.

Comparison 4 Biaxial microincision cataract surgery versus standard phacoemulsification, Outcome 4 Mean endothelial cell loss at 3 months.

Comparison 4 Biaxial microincision cataract surgery versus standard phacoemulsification, Outcome 5 Postoperative central corneal thickness at 3 months.
Comparison 4 Biaxial microincision cataract surgery versus standard phacoemulsification, Outcome 6 Intraoperative use of cumulative dissipated energy.

Comparison 4 Biaxial microincision cataract surgery versus standard phacoemulsification, Outcome 7 Surgical time.

Comparison 4 Biaxial microincision cataract surgery versus standard phacoemulsification, Outcome 8 Phacoemulsification time.
| Larger C‐MICS compared with standard phacoemulsification for age‐related cataract | ||||||
| Patient or population: adults with age‐related cataract Settings: eye clinics Intervention: larger C‐MICS with 2.2‐millimeter incision Comparison: standard phacoemulsification with about 3.0‐millimeter incision | ||||||
| Outcomes | Illustrative comparative risks* (95% CI) | Relative effect | No. of eyes | Certainty of the evidence | Comments | |
| Assumed risk | Corresponding risk | |||||
| Standard phacoemulsification | Larger C‐MICS | |||||
| Mean postoperative surgically induced astigmatism Follow‐up: 3 months | The mean surgically induced astigmatism was 0.7 to 1.34 diopters. | The mean surgically induced astigmatism in the intervention groups was 0.19 diopters lower (0.30 to 0.09 diopters lower). | ‐ | 996 | ⊕⊝⊝⊝ | A lower diopter value is a better clinical outcome. |
| Mean postoperative best‐corrected visual acuity Follow‐up: 3 months | The mean best‐corrected visual acuity was 0.05 to 0.11 logMAR. | The mean best‐corrected visual acuity in the intervention groups was 0.00 logMAR lower (0.02 logMAR lower to 0.02 logMAR higher). | ‐ | 242 | ⊕⊕⊝⊝ | |
| Mean endothelial cell loss Follow‐up: 3 months | The mean of endothelial cell loss ranged across control groups was 2054.0 to 2339.0 cells/mm2. | The mean change of endothelial cell loss in the intervention groups was 7.23 cells/mm2 lower (78.66 cells/mm2 lower to 64.20 cells/mm2 higher). | ‐ | 596 (4 RCTs) | ⊕⊕⊝⊝ | Little or no difference between groups is a clinically positive result. |
| Central corneal thickness Follow‐up: 3 months | The mean change of central corneal thickness was 9.24 μm. The mean central corneal thickness ranged across control groups from 546.0 to 580.0 μm. | The mean change of central corneal thickness in the intervention groups was 0.68 μm lower (3.26 μm lower to 1.90 μm higher). | ‐ | 487 (5 RCTs) | ⊕⊕⊝⊝ | Hwang 2016 did not report the standard deviation, but reported that the mean % decrease in central corneal thickness was 1.00 in the 2.2‐millimeter group and 0.31 in the 2.75‐millimeter group. Little or no difference between groups is a clinically positive result. |
| Adverse events (corneal edema) Follow‐up: 3 months | 46 per 1000 | 47 per 1000 (19 to 122) | RR 1.02 (0.40 to 2.63 | 362 (1 RCT) | Wang 2009 reported "no intraoperative complications." | |
| Quality of life | Not reported | |||||
| *The basis for the assumed risk (e.g. the median control group risk across studies) is provided in footnotes. The corresponding risk (and its 95% confidence interval) is based on the assumed risk in the comparison group and the relative effect of the intervention (and its 95% CI). | ||||||
| GRADE Working Group grades of evidence | ||||||
| aDowngraded two levels for risk of bias, as one study was at high risk of selection and attrition bias, while another study was at high risk of reporting bias. | ||||||
| Smaller C‐MICS compared with standard phacoemulsification for age‐related cataract | ||||||
| Patient or population: adults with age‐related cataract Settings: eye clinics Intervention: smaller C‐MICS with 1.8‐millimeter incision Comparison: standard phacoemulsification with about 3.0‐millimeter incision | ||||||
| Outcomes | Illustrative comparative risks* (95% CI) | Relative effect | No. of eyes | Certainty of the evidence | Comments | |
| Assumed risk | Corresponding risk | |||||
| Standard phacoemulsification | Smaller C‐MICS | |||||
| Mean postoperative surgically induced astigmatism Follow‐up: 3 months | The mean postoperative surgically induced astigmatism ranged across control groups from 0.03 to 0.94 diopters. | The mean postoperative surgically induced astigmatism in the intervention groups was 0.23 lower (0.34 diopters to 0.13 diopters lower). | ‐ | 561 | ⊕⊝⊝⊝ | A lower diopter value is a better clinical outcome. |
| Mean postoperative best‐corrected visual acuity Follow‐up: 2 to 3 months | The mean postoperative best‐corrected visual acuity ranged across control groups from | The mean postoperative best‐corrected visual acuity in the intervention groups was 0.02 logMAR units lower (0.03 logMAR units lower to 0.00 logMAR units). | ‐ | 192 | ⊕⊕⊝⊝ | |
| Mean change of endothelial cell loss Follow‐up: 3 months | The mean change of endothelial cell loss ranged across control groups from 2231.22 to 3077.0 cells/mm2. | The mean change of endothelial cell loss in the intervention groups was | ‐ | 380 | ⊕⊕⊝⊝ | |
| Mean change of central corneal thickness Follow‐up: 3 months | The mean change of central corneal thickness ranged across control groups from 3.74 to 63.5 μm. | The mean change of central corneal thickness in the intervention groups was 1.52 μm lower (6.29 μm lower to 3.25 μm higher). | ‐ | 245 | ⊕⊕⊝⊝ | |
| Adverse events Follow‐up: 3 months | None of the trials reported on adverse events. | |||||
| Quality of life | Not reported | |||||
| *The basis for the assumed risk (e.g. the median control group risk across studies) is provided in footnotes. The corresponding risk (and its 95% confidence interval) is based on the assumed risk in the comparison group and the relative effect of the intervention (and its 95% CI). | ||||||
| GRADE Working Group grades of evidence | ||||||
| aDowngraded two levels for high risk of selection, performance, and detection bias. | ||||||
| Smaller coaxial microincision cataract surgery (C‐MICS) compared with larger C‐MICS for age‐related cataract | ||||||
| Patient or population: adults with age‐related cataract Settings: eye clinics Intervention: smaller C‐MICS with 1.8‐millimeter incision Comparison: larger C‐MICS with 2.2‐millimeter incision | ||||||
| Outcomes | Illustrative comparative risks* (95% CI) | Relative effect | No. of eyes | Certainty of the evidence | Comments | |
| Assumed risk | Corresponding risk | |||||
| Larger C‐MICS | Smaller C‐MICS | |||||
| Mean postoperative surgically induced astigmatism Follow‐up: 3 months | The mean postoperative surgically induced astigmatism ranged across control groups from 0.48 to 1.08 diopters. | The mean postoperative surgically induced astigmatism in the intervention groups was | ‐ | 259 | ⊕⊕⊝⊝ | A lower diopter value is a better clinical outcome. |
| Mean postoperative best‐corrected visual acuity Follow‐up: 3 months | The mean postoperative best‐corrected visual acuity ranged across control groups from | The mean postoperative best‐corrected visual acuity in the intervention groups was 0.01 logMAR units higher (0.01 logMAR units lower to 0.04 logMAR units higher). | ‐ | 200 | ⊕⊕⊝⊝ | |
| Mean change of endothelial cell loss Follow‐up: 3 months | The mean change in endothelial cell loss was 2303.0 cells/mm2. | The mean change in endothelial cell loss was 213.00 cells/mm2 higher (11.15 to 414.85 cells/mm2 higher). | ‐ | 70 (1 RCT) | ⊕⊝⊝⊝ | |
| Mean central corneal thickness Follow‐up: 3 months | The mean change in central corneal thickness was 2.99 μm. | The mean change in central corneal thickness was 0.45 μm higher (2.70 μm lower to 3.60 μm higher). | ‐ | 100 | ⊕⊕⊝⊝ | |
| Adverse events Follow‐up: end of trial | None of the trials reported on adverse events. | |||||
| Quality of life | Not reported | |||||
| *The basis for the assumed risk (e.g. the median control group risk across studies) is provided in footnotes. The corresponding risk (and its 95% confidence interval) is based on the assumed risk in the comparison group and the relative effect of the intervention (and its 95% CI). | ||||||
| GRADE Working Group grades of evidence | ||||||
| aDowngraded two levels for unexplained statistical heterogeneity, as the I2 was greater than 70%. | ||||||
| B‐MICS compared with standard phacoemulsification for age‐related cataract | ||||||
| Patient or population: adults with age‐related cataract Settings: eye clinics Intervention: B‐MICS with equal to or smaller than 1.5‐millimeter incision Comparison: standard phacoemulsification with about 3.0‐millimeter incision | ||||||
| Outcomes | Illustrative comparative risks* (95% CI) | Relative effect | No. of eyes | Certainty of the evidence | Comments | |
| Assumed risk | Corresponding risk | |||||
| Standard phacoemulsification | B‐MICS | |||||
| Mean postoperative surgically induced astigmatism Follow‐up: 3 months | The mean postoperative surgically induced astigmatism ranged across control groups from 0.12 diopters to 0.44 diopters. | The mean postoperative surgically induced astigmatism in the intervention groups was | ‐ | 368 | ⊕⊕⊕⊝ | A lower diopter value is a better clinical outcome. |
| Mean postoperative best‐corrected visual acuity Follow‐up: 3 months | The mean postoperative best‐corrected visual acuity ranged across control groups from | The mean postoperative best‐corrected visual acuity in the intervention groups was 0.02 logMAR units lower (0.04 logMAR units lower to 0.00 LogMAR units). | ‐ | 464 | ⊕⊕⊝⊝ | |
| Mean endothelial cell loss Follow‐up: 3 months | The mean endothelial cell loss in the control groups was 2410 cells/mm2. | The mean endothelial cell loss in the intervention groups was (34.93 cells/mm2 lower to 146.59 cells/mm2 higher). | ‐ | 280 | ⊕⊕⊝⊝ | |
| Postoperative central corneal thickness Follow‐up: 3 months | The mean change in central corneal thickness in the control group was 546 μm. | The mean change of central corneal thickness in the intervention groups was 0.10 μm higher (14.04 μm lower to 14.24 μm higher). | ‐ | 90 | ⊕⊕⊝⊝ | |
| Adverse events Follow‐up: end of study | None of the trials reported on adverse events. | |||||
| Quality of life | Not reported | |||||
| *The basis for the assumed risk (e.g. the median control group risk across studies) is provided in footnotes. The corresponding risk (and its 95% confidence interval) is based on the assumed risk in the comparison group and the relative effect of the intervention (and its 95% CI). | ||||||
| GRADE Working Group grades of evidence | ||||||
| aDowngraded one level for risk of bias, as the trials were at unclear risk of selection and reporting bias. | ||||||
| Outcome or subgroup title | No. of studies | No. of participants | Statistical method | Effect size |
| 1 Mean postoperative surgically induced astigmatism at 3 months Show forest plot | 8 | 996 | Mean Difference (IV, Random, 95% CI) | ‐0.19 [‐0.30, ‐0.09] |
| 2 Mean postoperative best‐corrected visual acuity at 3 months Show forest plot | 3 | 242 | Mean Difference (IV, Random, 95% CI) | 0.00 [‐0.02, 0.02] |
| 3 Mean change of endothelial cell loss at 3 months Show forest plot | 4 | 596 | Mean Difference (IV, Random, 95% CI) | ‐7.23 [‐78.66, 64.20] |
| 4 Mean change of central corneal thickness at 3 months Show forest plot | 5 | 487 | Mean Difference (IV, Random, 95% CI) | ‐0.68 [‐3.26, 1.90] |
| 5 Intraoperative use of cumulative dissipated energy Show forest plot | 6 | 784 | Mean Difference (IV, Random, 95% CI) | ‐0.30 [‐1.33, 0.72] |
| 6 Intraoperative use of balanced salt solution Show forest plot | 1 | Mean Difference (IV, Fixed, 95% CI) | Totals not selected | |
| 7 Surgical time Show forest plot | 3 | 314 | Mean Difference (IV, Fixed, 95% CI) | ‐0.05 [‐0.26, 0.16] |
| 8 Phacoemulsification time Show forest plot | 4 | 608 | Mean Difference (IV, Random, 95% CI) | ‐0.96 [‐3.48, 1.56] |
| 9 Corneal edema Show forest plot | 1 | Risk Ratio (M‐H, Fixed, 95% CI) | Totals not selected | |
| Outcome or subgroup title | No. of studies | No. of participants | Statistical method | Effect size |
| 1 Mean postoperative surgically induced astigmatism at 3 months Show forest plot | 5 | 561 | Mean Difference (IV, Random, 95% CI) | ‐0.23 [‐0.34, ‐0.13] |
| 2 Mean postoperative best‐corrected visual acuity at 3 months Show forest plot | 3 | 192 | Mean Difference (IV, Fixed, 95% CI) | ‐0.02 [‐0.03, ‐0.00] |
| 3 Mean change of endothelial cell loss at 3 months Show forest plot | 5 | 380 | Mean Difference (IV, Random, 95% CI) | 7.56 [‐67.65, 82.77] |
| 4 Mean change of central corneal thickness at 3 months Show forest plot | 3 | 245 | Mean Difference (IV, Fixed, 95% CI) | ‐1.52 [‐6.29, 3.25] |
| 5 Intraoperative use of cumulative dissipated energy Show forest plot | 2 | 360 | Mean Difference (IV, Fixed, 95% CI) | ‐4.25 [‐5.43, ‐3.07] |
| 6 Intraoperative use of balanced salt solution Show forest plot | 2 | 130 | Mean Difference (IV, Fixed, 95% CI) | ‐1.93 [‐6.32, 2.46] |
| 7 Surgical time Show forest plot | 2 | 130 | Mean Difference (IV, Fixed, 95% CI) | ‐0.14 [‐0.35, 0.07] |
| 8 Phacoemulsification time Show forest plot | 2 | 130 | Mean Difference (IV, Fixed, 95% CI) | 8.20 [2.88, 13.52] |
| Outcome or subgroup title | No. of studies | No. of participants | Statistical method | Effect size |
| 1 Mean postoperative surgically induced astigmatism at 3 months Show forest plot | 3 | 259 | Mean Difference (IV, Fixed, 95% CI) | 0.04 [‐0.09, 0.16] |
| 2 Mean postoperative best‐corrected visual acuity at 3 months Show forest plot | 3 | 200 | Mean Difference (IV, Fixed, 95% CI) | 0.01 [‐0.01, 0.04] |
| 3 Mean endothelial cell loss at 3 months Show forest plot | 1 | 70 | Mean Difference (IV, Fixed, 95% CI) | 213.00 [11.15, 414.85] |
| 4 Mean change of central corneal thickness at 3 months Show forest plot | 1 | 100 | Mean Difference (IV, Fixed, 95% CI) | 0.45 [‐2.70, 3.60] |
| 5 Intraoperative use of cumulative dissipated energy Show forest plot | 4 | 300 | Mean Difference (IV, Random, 95% CI) | ‐0.33 [‐3.72, 3.07] |
| 6 Intraoperative use of balanced salt solution Show forest plot | 3 | 210 | Mean Difference (IV, Fixed, 95% CI) | 1.04 [‐2.45, 4.53] |
| 7 Surgical time Show forest plot | 2 | 180 | Mean Difference (IV, Fixed, 95% CI) | 0.33 [0.12, 0.55] |
| 8 Phacoemulsification time Show forest plot | 1 | Mean Difference (IV, Fixed, 95% CI) | Totals not selected | |
| Outcome or subgroup title | No. of studies | No. of participants | Statistical method | Effect size |
| 1 Mean postoperative surgically induced astigmatism at 3 months Show forest plot | 2 | 368 | Mean Difference (IV, Fixed, 95% CI) | ‐0.01 [‐0.03, 0.01] |
| 2 Mean postoperative surgically induced astigmatism at 6 months Show forest plot | 1 | Mean Difference (IV, Fixed, 95% CI) | Totals not selected | |
| 3 Mean postoperative best‐corrected visual acuity at 3 months Show forest plot | 3 | 464 | Mean Difference (IV, Fixed, 95% CI) | ‐0.02 [‐0.04, ‐0.00] |
| 4 Mean endothelial cell loss at 3 months Show forest plot | 1 | 280 | Mean Difference (IV, Fixed, 95% CI) | 55.83 [‐34.93, 146.59] |
| 5 Postoperative central corneal thickness at 3 months Show forest plot | 1 | 90 | Mean Difference (IV, Fixed, 95% CI) | 0.10 [‐14.04, 14.24] |
| 6 Intraoperative use of cumulative dissipated energy Show forest plot | 2 | 370 | Mean Difference (IV, Fixed, 95% CI) | ‐5.27 [‐6.58, ‐3.97] |
| 7 Surgical time Show forest plot | 1 | Mean Difference (IV, Fixed, 95% CI) | Totals not selected | |
| 8 Phacoemulsification time Show forest plot | 2 | 370 | Mean Difference (IV, Fixed, 95% CI) | ‐5.58 [‐9.52, ‐1.63] |