Música para el insomnio en adultos
Resumen
Antecedentes
El insomnio es un trastorno del sueño frecuente en la sociedad moderna. Provoca una reducción en la calidad de vida y se asocia con deterioro de la salud física y mental. Escuchar música es un método muy utilizado como ayuda para el sueño, pero todavía no está claro si en realidad puede mejorar el insomnio en adultos.
Objetivos
Evaluar los efectos de escuchar música para el insomnio en adultos y evaluar la influencia de variables específicas que puedan moderar el efecto.
Métodos de búsqueda
Se hicieron búsquedas en CENTRAL, PubMed, Embase, en otras nueve bases de datos y en dos registros de ensayos en mayo 2015. Además, se realizaron búsquedas manuales en revistas de musicoterapia específicas, listas de referencias de los estudios incluidos y se estableció contacto con autores de estudios publicados para identificar estudios adicionales elegibles para inclusión, incluido cualquier ensayo no publicado o en curso.
Criterios de selección
Ensayos controlados aleatorizados y ensayos controlados cuasialeatorizados que compararon los efectos de escuchar música con ningún tratamiento o tratamiento habitual sobre la mejoría del sueño en adultos con insomnio.
Obtención y análisis de los datos
Dos autores de la revisión examinaron de forma independiente los resúmenes, seleccionaron los estudios, evaluaron el riesgo de sesgo y extrajeron los datos de todos los estudios elegibles para la inclusión. Se realizaron metanálisis con los datos de las medidas de resultado predefinidas cuando se informaron de forma consistente por al menos dos estudios. Los metanálisis se realizaron mediante modelos de efectos fijos y de efectos aleatorios. La heterogeneidad entre los estudios incluidos se evaluó con la estadística I².
Resultados principales
Se incluyeron seis estudios con un total de 314 participantes. Los estudios examinaron el efecto de escuchar diariamente música pregrabada, de 25 a 60 minutos, durante un período de tres días a cinco semanas.
Según el enfoque Grades of Recommendations, Assessment, Development and Evaluation (GRADE), la evidencia de cinco estudios que midieron el efecto de escuchar música sobre la calidad del sueño se calificaron de calidad moderada. La evidencia de un estudio que examinó otros aspectos del sueño (ver a continuación) se calificó de calidad baja. La calidad de la evidencia se disminuyó principalmente debido a limitaciones en el diseño o por ser el único estudio publicado. En cuanto al riesgo de sesgo, la mayoría de los estudios presentaban un alto riesgo de sesgo en al menos un ámbito: un estudio presentaba un alto riesgo de sesgo de selección y uno se consideró de riesgo poco claro; seis estudios presentaban un alto riesgo de sesgo de rendimiento; tres estudios presentaban un alto riesgo de sesgo de detección; un estudio presentaba un alto riesgo de sesgo de desgaste y uno se consideró de riesgo poco claro; dos estudios se consideraron de riesgo poco claro de sesgo de notificación; y cuatro estudios presentaban un alto riesgo de otro tipo de sesgo.
Cinco estudios (n = 264) que informaron sobre la calidad de sueño evaluada según el Pittsburgh Sleep Quality Index (PSQI) se incluyeron en el metanálisis. Los resultados de un meta‐análisis de efectos aleatorios revelaron un efecto a favor de la escucha de música (diferencia de medias (DM) ‐2,80; intervalo de confianza (IC) del 95%: ‐3,42 a ‐2,17; Z = 8,77, P < 0,00001; evidencia de calidad moderada). El tamaño del efecto indica un aumento en la calidad de sueño de un tamaño cercano a una desviación estándar a favor de la intervención en comparación con ningún tratamiento o tratamiento habitual.
Sólo un estudio (N = 50; evidencia de baja calidad) informó datos sobre la latencia de aparición del sueño, el tiempo total de sueño, la interrupción del sueño y la eficiencia del sueño. Sin embargo, no encontró evidencia que indicara que la intervención tuvo efectos beneficiosos sobre estos resultados. Ninguno de los estudios informó ningún evento adverso.
Conclusiones de los autores
Los resultados de esta revisión aportan evidencia de que la música puede ser efectiva para mejorar la calidad subjetiva del sueño en adultos con síntomas de insomnio. La intervención es segura y fácil de administrar. Se necesitan más estudios de investigación para establecer el efecto de escuchar música sobre otros aspectos del sueño, así como las consecuencias diurnas del insomnio.
PICO
Resumen en términos sencillos
Música para el insomnio en adultos
Pregunta de la revisión
Esta revisión evaluó los efectos de escuchar música sobre el insomnio en adultos y la repercusión de los factores que pueden influir en el efecto.
Antecedentes
En todo el mundo, millones de personas presentan insomnio. Las personas pueden tener dificultades para dormir, permanecer dormido o pueden experimentar una calidad del sueño deficiente.
El sueño deficiente afecta la salud física y mental de las personas. Las consecuencias del sueño deficiente son costosas para los individuos y para la sociedad. Muchas personas escuchan música para mejorar el sueño, pero el efecto de escuchar música no está claro.
Características de los estudios
Se efectuaron búsquedas en las bases de datos electrónicas y las revistas de musicoterapia para identificar los estudios relevantes. Se incluyeron seis estudios, con un total de 314 participantes. Los estudios compararon el efecto de escuchar música solo o con atención estándar con atención estándar sola o ningún tratamiento. Los estudios examinaron el efecto de escuchar música pregrabada diariamente, durante 25 a 60 minutos, por un período de tres días a cinco semanas. La evidencia está actualizada hasta el 22 de mayo de 2015.
Resultados clave
Cinco estudios midieron la calidad del sueño. Los hallazgos sugieren que escuchar música puede mejorar la calidad del sueño. Solamente un estudio informó datos sobre otros aspectos del sueño, incluido el período de tiempo que tarda en quedar dormido, la cantidad de sueño real que logra y el número de veces que la persona despierta. Este estudio no encontró ninguna evidencia que sugiera que escuchar música beneficia a estos resultados. Ninguno de los estudios informó ningún efecto secundario negativo causado por escuchar música.
Calidad de la evidencia
La calidad de la evidencia de los cinco estudios que examinaron la calidad del sueño era moderada. La calidad de la evidencia para los otros aspectos del sueño fue baja. Se necesitan más estudios de investigación de alta calidad para investigar y establecer el efecto de escuchar música sobre otros aspectos del sueño, además de la calidad del sueño, y sobre medidas diurnas relevantes.
Authors' conclusions
Summary of findings
| Listening to music compared to no treatment or treatment‐as‐usual (TAU) for adults with insomnia | ||||||
| Patient or population: adults with insomnia | ||||||
| Outcomes | Illustrative comparative risks* (95% CI) | Relative effect | Number of participants | Quality of the evidence | Comments | |
| Assumed risk | Corresponding risk | |||||
| No treatment or TAU | Listening to music | |||||
| Sleep quality ‐ immediately post‐treatment Follow‐up: 21 to 35 days | The mean score in the intervention groups was | 264 | ⊕⊕⊕⊝ | A lower score indicates better sleep quality (i.e. fewer sleep problems). The change is about the size of one standard deviation which is considered a clinically relevant change. The studies included participants with a complaint of poor sleep (PSQI > 5)¹. | ||
| Sleep onset latency ‐ immediately post‐treatment Follow‐up: 3 days | See comment | See comment | 50 | ⊕⊕⊝⊝ | The one trial reporting this outcome found no evidence of an effect of the intervention. The data were not available for analysis. The study included participants that had reported poor sleep for at least one month (PSQI > 5)¹. | |
| Total sleep time ‐ immediately post‐treatment | See comment | See comment | 50 | ⊕⊕⊝⊝ | The one study reporting this outcome found no evidence of an effect of the intervention. The data were not available for analysis. The study included participants that had reported poor sleep for at least one month (PSQI > 5)¹. | |
| Sleep interruption ‐ immediately post‐treatment | See comment | See comment | 50 | ⊕⊕⊝⊝ | The one study reporting this outcome found no evidence of an effect of the intervention. The data are not available for analysis. The study included participants that had reported poor sleep for at least one month (PSQI > 5)¹. | |
| Sleep efficiency ‐ immediately post‐treatment | See comment | See comment | 50 | ⊕⊕⊝⊝ | The one study reporting this outcome found no evidence of an effect of the intervention. The data were not available for analysis. The study included participants that had reported poor sleep for at least one month (PSQI > 5)¹. | |
| *The basis for the assumed risk (e.g. the median control group risk across studies) is provided in footnotes. The corresponding risk (and its 95% confidence interval) is based on the assumed risk in the comparison group and the relative effect of the intervention (and its 95% CI) | ||||||
| GRADE Working Group grades of evidence | ||||||
| 1 Pittsburgh Sleep Quality Index. 0 indicates good sleep quality and 21 indicates severe sleep problems. Clinical cut off > 5 (Buysse 1989). | ||||||
Background
Description of the condition
Insomnia is one of the most common sleep disorders and affects millions of people worldwide. Insomnia can be defined as a subjective complaint of disturbed sleep in the presence of adequate opportunity and circumstance for sleep (NIH 2005). It is characterised by dissatisfaction with the quality, duration or continuity of sleep, such as problems falling asleep, maintaining sleep, early morning awakenings or complaints of non‐restorative sleep (Morin 2013). The diagnostic criteria for insomnia disorder as a clinical diagnosis vary depending on the diagnostic manual used. The fourth edition of the American Psychiatric Association's (APA) Diagnostic and Statistical Manual for Mental Disorders (DSM‐IV) defines primary insomnia as a subjective complaint of difficulty in initiating or maintaining sleep, or the presence of non‐restorative sleep, lasting for at least one month (APA 1994). According to these criteria, disturbed sleep causes clinically significant distress or impairment in social, occupational or other important areas of functioning. According to the APA criteria, primary insomnia is not the consequence of any substance use and is not linked to a major general medical condition, any mental disorder or an otherwise specified sleep disorder (APA 1994). However, the distinction between primary and secondary insomnia has been removed in the most recent update. Instead, 'insomnia disorder' is recognized as a condition requiring clinical attention independently of other medical conditions that may be present (APA 2013). Other diagnostic manuals, such as the the World Health Organization's (WHO) International Classification of Diseases, 10ͭʰ Revision (ICD‐10) and the International Classification of Sleep Disorders (ICSD‐2) distinguish between different insomnia subtypes and introduce different duration and frequency criteria (AASM 2005; WHO 1992).
Insomnia is common in people with medical or psychiatric illness and trials have found consistent relationships between insomnia and depression, anxiety disorders, and other psychological disorders, as well as substance abuse and dependence. Furthermore, insomnia is associated with a number of medical problems such as decreased immune functioning (Taylor 2003), cardiovascular disorders, hypertension, chronic pain, breathing difficulties, and gastrointestinal and urinary problems (Taylor 2007). Insomnia itself can have a number of negative daytime consequences and it is well recognised that people with insomnia experience impairments in everyday life such as fatigue and greater irritability (Riedel 2000; Shekleton 2010). People with insomnia report significantly lower quality of life than those without insomnia, and the reduction in quality of life is correlated with symptom severity (Léger 2001). Insomina affects occupational function and social relations and is associated with higher work absenteeism and increased risk of accidents, and therefore represents a condition with great costs for both the individual and society (Walsh 2004).
Estimates of the prevalence of insomnia vary according to the definitions used. A review of epidemiological trials revealed that about one third of the general population experiences symptoms of insomnia, such as difficulties initiating or maintaining sleep. When adding daytime consequences to the definition of insomnia, the prevalence rate drops to about 9% to 15% (Ohayon 2002). Sleep dissatisfaction is reported by 8% to 18% of the general population; using the DSM‐IV criteria for insomnia, a point‐prevalence rate of 6% is reported within the literature, with primary insomnia as the most frequent diagnosis (2% to 4%), followed by insomnia related to another mental disorder (1% to 3%) (Ohayon 2002).
Description of the intervention
Available treatments for insomnia include pharmacotherapy (medication), psychological and behavioural interventions, and a variety of complementary and alternative therapies. Basic education in sleep hygiene is commonly used to inform patients about lifestyle and environmental factors that may interfere with or promote sleep (Morin 2005). Although good sleep hygiene can be helpful, it is not considered sufficient to improve severe and chronic insomnia. Therefore, the most common treatment of insomnia is the use of pharmacotherapeutic interventions, including over‐the‐counter and prescribed medications (NIH 2005). Benzodiazepine receptor agonists have been approved for the treatment of insomnia by the U.S. Food and Drug Administration (FDA) and trials report beneficial short‐term effects of these agents. With the exception of eszopiclone, approved use is limited to 35 days or less (NIH 2005). However, there are some concerns about the long‐term use of these medications, due to risk of abuse, dependence, and adverse effects such as residual daytime sedation, cognitive impairments, and reduced motor co‐ordination. Furthermore, the use of hypnotics has been associated with increased mortality (Frandsen 2014; Kripke 2012).
Psychological and behavioural treatments show good efficacy in the treatment of persistent insomnia (Morin 2006b). These treatments include cognitive behavioural therapy, stimulus control therapy, sleep restriction therapy, and relaxation training, often combined in multi‐component approaches. In spite of good results, psychological and behavioural treatments appear to be under‐utilised, perhaps because they require considerable time and effort for the patient (Krystal 2004). Furthermore, there is a problem of availability, with relatively few well‐trained professionals in the field (Wilson 2010).
Given the current limitations of psychological and pharmacological treatments, different alternative and complementary interventions, one of which is music, are available to combat insomnia in adults. Trials show that listening to music is often used by adults as a self‐help intervention to improve sleep (Aritake‐Okada 2009; Morin 2006a; Urponen 1988), and a simple Google search on 'music' and 'sleep' reveals a huge market of music that is promoted for its sleep‐inducing properties. However, the efficiency of music as an intervention for insomnia remains unclear. Music is used as a therapeutic intervention in a number of areas, including pain relief (Cepeda 2006), psychiatry (Maratos 2008; Mössler 2011), neuro‐rehabilitation (Bradt 2010), and for improving psychological outcomes in medical conditions such as cancer and heart disease (Bradt 2011; Bradt 2013). Experimental and clinical studies show that music can affect autonomous nervous system functioning (Hodges 2009) as well as psychological factors such as mood and attention (Garza‐Villarreal 2014; Juslin 2001); as such, it may potentially impact sleep (see How the intervention might work). Research on the impact of music on sleep has evolved during the past 20 years, and methods for applying music listening to improve sleep quality vary across trials. Generally, the intervention involves the use of pre‐recorded music in relation to sleep initiation. Music listening can be used passively, or it can be used actively with specific instructions (e.g. relaxation instructions). The duration of the intervention period and the time spent listening to music may vary. The choice of music may be determined by the researcher or by the participants themselves. Relatively few trials on music and insomnia are randomised controlled trials (RCTs). Since the impact of the music intervention may differ depending on the design of the intervention, there is a need to evaluate the results of both RCTs and quasi‐randomised controlled trials (qRCTS) in order to retain valuable and reliable evidence.
How the intervention might work
Music has been found to influence human beings on many levels (Juslin 2001) and the impact of music listening on sleep has been attributed to different mechanisms. Several authors argue that improvement of sleep is obtained because slow soothing music enhances relaxation (Deshmukh 2009; Hernández‐Ruiz 2005; Jespersen 2012; Lai 2005). This suggestion is substantiated by trials showing reduced levels of cortisol as an effect of music listening (Koelsch 2011; Nilsson 2009), and changes in autonomous measures such as heart‐rate and blood pressure (Korhan 2011; Su 2013; Trappe 2010). These trials show that music can affect various physiological measures that reflect autonomic nervous system responses, and as such, slow soothing music may lead to a decrease in sympathetic arousal and thus improve sleep (Su 2013). From a psychological perspective, trials have shown that listening to music can reduce anxiety and stress responses (Dileo 2007; Zhang 2012), which can lead to greater relaxation and improvement of sleep. Another possible mechanism for the effect of music on sleep is the distracting power of music. Hernández‐Ruiz 2005 suggests that music can function as a focal point of attention that distracts from stressful thoughts and thereby improves sleep. A number of individual factors are also likely to influence the music experience, such as age and gender (Juslin 2011; Nieminen 2012), music preference (Vuust 2010), musical training (Brattico 2009; Vuust 2006), and culture (Hargreaves 1997). Different effects may therefore be found depending on the type of music used, the etiology of insomnia symptoms, and the length and duration of the intervention.
Why it is important to do this review
Music is commonly used to relieve sleep problems and the use of music as a non‐pharmacological intervention offers potential advantages of easy administration, low cost, and safety. Clinical trials have been performed to investigate the effect of music on sleep, but it remains unclear if the existing evidence is rigorous enough to reach conclusions about the general efficacy of the intervention. A systematic review is needed to establish the efficacy of music listening for improvement of sleep quality and thereby refute or validate the popular belief that music is helpful to promote sleep.
Objectives
To assess the effects of listening to music on sleep in adults with insomnia and to assess the influence of specific variables that may moderate the effect.
Methods
Criteria for considering studies for this review
Types of studies
The methods of this review were pre‐specified in the protocol (Jespersen 2013a).
We considered randomised controlled trials (RCTs) and quasi‐randomised controlled trials (qRCTs) that allocated participants to groups on the basis of a quasi‐random process, such as date of birth or alternate numbers for inclusion, for inclusion in the review. Since it is not possible to blind participants to the treatment (music), we included unblinded or single‐blinded trials.
Types of participants
We included adults with insomnia as documented by standardised measures (e.g. Pittsburgh Sleep Quality Index (PSQI; Buysse 1989)), objective measures (e.g. polysomnography or actigraphy), reports or diaries kept by participants, relatives or other informants; or individuals diagnosed with an insomnia disorder by standard diagnostic criteria, such as the International Classification of Diseases (ICD; WHO 1992), the Diagnostic and Statistical Manual of Mental Disorders (DSM; APA 1994) or International Classification of Sleep Disorders (ICSD; AASM 2005); or with an individual's complaint of sleep difficulties.
Types of interventions
We included any intervention that comprised listening to pre‐recorded music with or without relaxation instructions. The intervention could be self‐administered or administered by research or clinical personnel. Interventions included music listening compared with a no music control group or treatment‐as‐usual (TAU), and music therapy added to TAU compared to TAU alone.
Types of outcome measures
Primary outcomes
Our outcomes of interest were sleep‐ and insomnia‐related symptoms as measured by sleep diaries, polysomnography, actigraphy, or by standardised scales for the assessment of sleep and sleep‐related symptoms (e.g. PSQI or Insomnia Severity Index (ISI)). Furthermore, to establish the safety of the intervention, we considered the reporting of adverse events as a primary outcome. The primary outcomes were:
-
Sleep quality.
-
Sleep onset latency.
-
Total sleep time.
-
Sleep interruption (number of awakenings and waking after sleep onset).
-
Sleep efficiency (percent of time in bed spent asleep).
-
Adverse events (as reported by trialists; e.g. discomfort or hearing loss).
Secondary outcomes
Secondary outcomes of interest were waking‐related correlates and daytime consequences of insomnia. The relevant measures included:
-
Psychological outcomes.
-
Depression.
-
Anxiety.
-
Quality of life.
-
-
Physical outcomes.
-
Fatigue.
-
Daytime sleepiness.
-
Pain.
-
-
Physiological outcomes.
-
Heart rate.
-
Heart rate variability.
-
Blood pressure.
-
We included trials that measured psychological outcomes by standardized questionnaires with established reliability and validity (e.g. Beck Depression Inventory (BDI; Beck 1996), State‐Trait Anxiety Inventory (STAI; Spielberger 1983), Short‐Form 36 (SF‐36) health survey (Ware 1992)). We included trials that measured physical outcomes with standardised procedures such as the Multiple Sleep Latency Test (MSLT) or validated rating scales. We included trials that measured physiological outcomes with standardized procedures such as an electrocardiogram (ECG).
We considered the trial period and follow‐up as described in the included trials. When assessing outcomes in relation to time points, we grouped the data as: immediate post‐intervention, short‐term (post‐intervention to one month), medium‐term (between one and three months follow‐up), and long‐term (more than three months follow‐up) effects.
We reported all primary outcomes in summary of findings Table for the main comparison.
Search methods for identification of studies
We did not apply any restrictions on date, language, or publication status when searching for trials or when deciding on trial inclusion.
Electronic searches
To identify the relevant trials, we searched the following electronic databases on 22 May 2015.
-
Cochrane Central Register of Controlled Trials (CENTRAL), 2015, Issue 4, part of theCochrane Library, and includes the Cochrane Developmental Psychosocial and Learning Problems Group Specialised Register.
-
PubMed (ncbi.nlm.nih.gov/pubmed), 1950 to 22 May 2015.
-
Embase (Elsevier), 1980 to 22 May 2015.
-
CINAHL (EBSCOhost), 1982 to 22 May 2015.
-
PsycINFO (ProQuest), 1967 to 22 May 2015.
-
Web of Science (Science Citation Index Expanded, Social Sciences Citation Index, Arts and Humanities Citation Index, Conference Proceedings Citation Index ‐ Science, and Conference Proceedings Citation Index ‐ Social Science and Humanities), 1980 to 22 May 2015.
-
SCOPUS (Elsevier), 1960 to 22 May 2015.
-
ClinicalTrials.gov (ClinicalTrials.gov), all available years searched 22 May 2015.
-
Current Controlled Trials (controlled‐trials.com/), all available years searched 22 May 2015.
-
Répertoire International de Littérature Musicale (RILM; EBSCOhost), 1969 to 22 May 2015.
The search strategies for the databases can be found in Appendix 1.
Searching other resources
We handsearched 15 journals, which are listed in Appendix 2, and searched the bibliographies of retrieved articles and relevant reviews to identify potential trials missed by the electronic searches. We also performed a citation search in ISI Web of Science to identify reports that had cited any relevant trials retrieved by the search to discover more recent trials that could have been missed. In addition, we contacted experts in the field to identify any unpublished trials.
Data collection and analysis
Selection of studies
Two authors (KVJ and JK) independently screened all titles and abstracts. All papers for which the title or abstract referred to a trial on music and sleep were retrieved in full. In cases where there was insufficient information in the title or abstract to determine the relevance of a paper, we retrieved the full text. Both authors independently reviewed the full‐text papers against a previously prepared inclusion criteria form to assess the trial's eligibility for inclusion. Disagreements were discussed and a third author (PJ) was involved in making the final decision. We kept a record of excluded articles and the reason for their exclusion (Characteristics of excluded studies).
Data extraction and management
Using a standardized coding form, the first two authors (KVJ and JK), who were blinded to each other’s assessment, extracted the data. Disagreements were resolved by consensus. If outcome data were not available, we contacted the authors of the trial.
From each trial, we extracted the following information.
1. General information
-
Author
-
Year of publication
-
Title
-
Journal (title, volume, pages) or if unpublished source
-
Country
-
Language of publication
2. Trial design
-
Design (e.g. parallel or cross‐over design)
-
Method of randomisation (and concealment)
-
Nature of the control group (e.g. no treatment or TAU)
-
Losses to follow‐up
-
Blinding of trial evaluators
-
Washout period in cross‐over design
-
Inclusion criteria
-
Exclusion criteria
3. Participants
-
Total sample size
-
Number in experimental group
-
Number in control group
-
Age
-
Gender
-
Ethnicity
-
Diagnosis
-
Comorbidities
-
Sleep quality (and reason for poor sleep)
-
Duration of disorder
-
Previous or additional treatments
4. Intervention
-
Type of music employed (characteristics)
-
Music selection (selected by participant or researcher)
-
Who provided the music (participant or research personal)
-
Length and frequency of intervention sessions
-
Intervention period (duration of intervention)
-
How participants were exposed to music (e.g. headphones or loudspeakers)
-
Listening instructions
5. Outcomes
-
Methods of sleep assessment
-
Secondary outcome measures
-
Pre‐test means and post‐test means or change scores and standard deviations, for all groups for all outcomes specified above
-
Baseline differences
-
Follow‐up period
Assessment of risk of bias in included studies
Two authors (KVJ and JK) independently assessed the risk of bias by using the tool described (and the criteria outlined) in the Cochrane Handbook for Systematic Reviews of Interventions (Higgins 2011). They solved disagreements by discussion with the fourth author (PV). When information for evaluating methodological criteria was absent, we contacted the authors to obtain further information.
We graded each trial for risk of bias in each of the following domains.
1. Random sequence generation (checking for possible selection bias)
We assessed the method used to generate the allocation sequence for each included trial in sufficient detail to allow an assessment of whether it produced comparable groups.
We rated the risk of bias as follows.
-
Low risk of bias (adequate method of random sequence generation: e.g. any truly random process such as random number table; computer random number generator).
-
High risk of bias (inadequate method of random sequence generation: e.g. any non‐random process such as odd or even date of birth; hospital or clinic record number).
-
Unclear risk of bias (insufficient information about the method of random sequence generation to permit a judgement of low risk or high risk of bias).
2. Allocation concealment (checking for possible selection bias)
We assessed the method used to conceal the allocation sequence for each included trial and determined whether intervention allocation could have been foreseen in advance of, or during recruitment, or changed after assignment.
We rated the risk of bias as follows.
-
Low risk of bias (adequate method of allocation concealment: e.g. telephone or central randomisation; consecutively numbered sealed opaque envelopes).
-
High risk of bias (inadequate method of allocation concealment: e.g. open random allocation; unsealed or non‐opaque envelopes; alternation; date of birth).
-
Unclear risk of bias (insufficient information to permit a judgement of low risk or high risk of bias).
3. Blinding of participants and personnel (checking for possible performance bias)
We assessed the different methods used to blind personnel from knowledge of which intervention a participant received for each included trial. Since it is not possible to blind a participant to the treatment (music), we assessed trials at low risk of bias if we judged that the lack of blinding was not affecting the results. We assessed blinding of participants and personnel separately for different outcomes or classes of outcomes, since we expected certain outcomes (e.g. laboratory measurements and physiological data such as heart rate or blood pressure) to be unaffected by blinding of participants and personnel.
We rated the risk of bias as follows.
-
Low risk of bias (adequate method of blinding; outcome not likely to be influenced by lack of blinding).
-
High risk of bias (inadequate method of blinding; outcome likely to be influenced by lack of blinding).
-
Unclear risk of bias (insufficient information to permit a judgement of low risk or high risk of bias).
4. Blinding of outcome assessment (checking for possible detection bias)
We assessed the methods used to blind outcome assessment for each included trial. We assessed blinding separately for different outcomes or classes of outcomes, as stated above.
We rated the risk of bias as follows.
-
Low risk of bias (adequate method of blinding; outcome not likely to be influenced by lack of blinding).
-
High risk of bias (inadequate method of blinding; outcome likely to be influenced by lack of blinding).
-
Unclear risk of bias (insufficient information to permit a judgement of low risk or high risk of bias).
5. Incomplete outcome data (checking for possible attrition bias through withdrawals, dropouts, protocol deviations)
We assessed data on attrition, exclusions, and reasons to determine if they introduced bias. We described the completeness of data for each included trial and for each outcome or class of outcomes. We assessed whether attrition and exclusions were reported, the numbers of participants included at each stage of the analysis (compared with the total participants randomised), whether reasons for attrition or exclusion were reported, and whether missing data were balanced across groups or were likely to be related to outcomes.
We judged whether incomplete data was dealt with adequately and rated the risk of bias as follows.
-
Low risk of bias (no missing outcome data; balanced missing outcome data; appropriate methods of imputing missing data).
-
High risk of bias (missing outcome data; unbalanced missing outcome data; inappropriate methods of imputing missing data).
-
Unclear risk of bias (insufficient information to permit a judgement of low risk or high risk of bias).
6. Selective reporting bias
We investigated the possibility of selective outcome reporting bias for each included trial. We conducted electronic searches to identify protocols of respective trials as a source to judge selective reporting.
We rated the risk of bias as follows.
-
Low risk of bias (all pre‐specified and expected outcomes were reported).
-
High risk of bias (not all pre‐specified and expected outcomes were reported; outcome that was not pre‐specified was reported; outcome was reported incompletely).
-
Unclear risk of bias (insufficient information to permit a judgement of low risk or high risk of bias).
7. Other bias
We assessed other risks of bias, specifically a risk of bias from baseline differences and a risk of bias from carry‐over or period effects for cross‐over trials.
We rated the risk of bias as follows.
-
Low risk of bias (the trial appeared to be free of other sources of bias).
-
High risk of bias (there was at least one important risk of bias).
-
Unclear risk of bias (insufficient information to permit a judgement of low risk or high risk of bias).
With reference to each of the above domains, we assessed the likely magnitude and direction of the bias and whether we considered it likely to impact the findings. We explored the impact of the level of bias by undertaking sensitivity analyses – see subsection on Sensitivity analysis.
Measures of treatment effect
Two authors (KVJ and JK) independently extracted data from trials identified for inclusion to ensure accuracy. We used Review Manager 5 (RevMan; RevMan 2014) for data entry and analyses.
Continuous data
We analysed continuous outcomes measured on the same scale between trials (e.g. PSQI) using the mean difference (MD).
Ordinal data
We analysed ordinal data measured on scales (i.e. sleep quality on visual analogue scales) as continuous data and the intervention effect was expressed as a difference in means.
Please see Jespersen 2013 and Appendix 3 for additional methods archived for future updates of this review.
Unit of analysis issues
Cluster‐randomised trials
We did not identify any cluster‐randomised trials. For further information on how these kinds of studies will be dealt with in future updates of this review, see Jespersen 2013a and Appendix 3.
Cross‐over trials
We did not identify any cross‐over trials. For further information on how these kinds of studies will be dealt with in future updates of this review, see Jespersen 2013a and Appendix 3.
Trials with more than two treatment arms
If a trial reported multiple treatment arms, we only used comparisons between the music intervention and the control or TAU group. For further information on how we will deal with other trials with more than two treatment arms, see Jespersen 2013a and Appendix 3 .
Dealing with missing data
For included trials, we noted levels of attrition in the incomplete outcome data section of the 'Risk of bias' tables beneath the Characteristics of included studies tables. Where information about the presented data set was missing in the trial reports, or if there was a lack of detail or a discrepancy between different reports, or clarification was needed, we tried to retrieve relevant information by contacting the authors of the trial. Where data were missing due to loss to follow‐up or dropout, we attempted to obtain complete outcome data from trial authors to include all participants randomised to each group in the analyses. If any outcome data remained missing, or if trial authors did not respond within a reasonable time, we analysed data on an available case basis, based on the numbers of participants for whom outcome data (continuous and dichotomous) were known. We did not impute missing data. For more information on how we will deal with missing data in future updates of this review, see Jespersen 2013a and Appendix 3.
Assessment of heterogeneity
We assessed clinical and methodological heterogeneity by examining the characteristics of the trials. The similarities between interventions (e.g. dose, frequency), participants (e.g. age), trial design (e.g. allocation concealment, blinding, losses to follow‐up), and the outcomes are reported in the Included studies subsection. Heterogeneity of treatment response was assessed visually from the forest plot of the mean difference (MD) and the Chi² test. In addition, heterogeneity was assessed statistically according to the standard method using the I² statistic, calculated for each comparison on each outcome. Substantial heterogeneity was assumed if I² was greater than 50%, indicating that 50% of the variability in the outcome cannot be explained by sampling variation. For further information on how we will deal with heterogeneity in future updates of this review, see Jespersen 2013a and Appendix 3.
Assessment of reporting biases
We attempted to minimize the potential for publication bias by our comprehensive search strategy that included evaluating published and unpublished literature.
Where we suspected reporting bias, we contacted trial authors asking them to provide missing outcome data.
For further information on how we will deal with reporting bias in future updates of this review, see Jespersen 2013a and Appendix 3.
Data synthesis
We entered all trials included in the systematic review into Review Manager 5 (RevMan 2014) and checked for data entry errors. We conducted a meta‐analysis when there were data from at least two included trials and substantial heterogeneity was absent. We undertook meta‐analyses using both fixed‐effect and random‐effects models. Where there was agreement between the results of both analyses, we reported the results from random‐effects models as it conveys the variability better. If fixed‐effect and random‐effect models revealed different results, we investigated possible sources of heterogeneity or inconsistency among trials in the magnitude or direction of effects.
Assessing the quality of the evidence
Using the approach developed by the Grading of Recommendation, Assessment, Development and Evaluation (GRADE) working group, we rated the quality of the evidence as 'high', 'moderate', 'low' or 'very low' (GRADE 2013). Evidence from RCTs were given an initial 'high quality' rating, but the assessment was downgraded if the trial methodology had a risk of bias, if there was substantial inconsistency among the results, if the evidence was indirect or imprecise, and if there was evidence of publication bias. The assessment was upgraded if a large effect was found. The results of the GRADE assessment for the primary outcomes is found in summary of findings Table for the main comparison. The table was constructed using the GRADEpro software (GRADEpro 2014).
Subgroup analysis and investigation of heterogeneity
We carried out the following subgroup analyses (ranked in order of importance).
-
Researcher‐selected music versus participant‐selected music.
-
Music listening alone versus music listening with relaxation instructions.
The subgroup analyses were exploratory and conducted as recommended in section 9.6 of the Cochrane Handbook for Systematic Reviews of Interventions (Higgins 2011).
For further information on other intended subgroup analyses, see Jespersen 2013a and Appendix 3.
Sensitivity analysis
We conducted the following sensitivity analyses to determine the impact of trial quality and risks of bias on the results of the meta‐analyses.
-
Excluded trials with inadequate methods of random sequence generation.
-
Excluded trials using inadequate methods of allocation concealment.
-
Excluded trials using inadequate methods of blinding outcome assessment.
For additional information on other intended sensitivity analyses, see Jespersen 2013a and Appendix 3.
Results
Description of studies
Results of the search
After removing duplicates, we identified 465 records during the search conducted in May 2015 (see Figure 1). After screening titles and abstracts, we identified 71 references that were considered potentially relevant and retrieved them for further examination. One potentially relevant trial was published by two of the authors of this review. To avoid the influence of dual authorship, two authors with no involvement in the trial (JK and PJ) assessed the eligibility and risks of bias of this trial. We excluded 55 trials (from 61 reports) (see Excluded studies). We included six trials (eight reports) that matched the inclusion criteria. We categorised one trial (two reports) as 'awaiting classification', since there was insufficient information to assess inclusion and exclusion. We identified two relevant ongoing trials.

Study flow diagram
Included studies
Six trials met the inclusion criteria for this review (see Characteristics of included studies). Five were RCTs (Chang 2012; Harmat 2008; Kullich 2003; Lai 2005; Shum 2014) and one was a qRCT (Jespersen 2012). All trials used a parallel group design. One trial examined the effects of music listening on sleep quality in adults with insomnia related to pain (Kullich 2003), and one on its effects on insomnia related to psychological trauma (Jespersen 2012). Two trials included older adults with sleep problems (Lai 2005; Shum 2014), and two trials provided no information on the reason for poor sleep quality (Chang 2012; Harmat 2008).
The trials were conducted in five different countries. Two were conducted in Taiwan (Chang 2012; Lai 2005), one in Singapore (Shum 2014), one in Hungary (Harmat 2008), one in Denmark (Jespersen 2012), and one in Austria (Kullich 2003).
Trial size
The six included trials comprised a total of 314 participants. Trial sample sizes ranged from 15 to 65 participants with an average sample size of 52 (median 60). One trial had a small sample size of 15 participants (Jespersen 2012), and the remaining five trials had sample sizes between 50 and 65 participants (Chang 2012; Harmat 2008; Kullich 2003; Lai 2005; Shum 2014).
Setting
Four of the included trials measured the effect of the music listening intervention in the participants' own home (Harmat 2008; Jespersen 2012; Lai 2005; Shum 2014). In three of these trials, data were collected during a weekly visit to the participants' homes (Jespersen 2012; Lai 2005; Shum 2014), and in two of these trials, participants were also telephoned once or twice a week to ensure compliance with the protocol (Lai 2005; Shum 2014). In the fourth trial, the intervention group, but not the control group, was telephoned once a week to assess compliance (Harmat 2008).
Of the remaining two trials, one was conducted in a sleep laboratory (Chang 2012), and one implemented the intervention at an inpatient rehabilitation facility for persons with low‐back pain (Kullich 2003).
Participants
The participants in the included trials were between 19 and 83 years of age. One trial did not report gender (Lai 2005), but in the remaining five trials, the majority of participants were women (70%).
Five studies stated that they recruited participants with complaints of insomnia, and all trials used scores greater than five on the Pittsburgh Sleep Quality Index (PSQI) as evidence of insomnia symptoms. One trial did not include sleep difficulties as inclusion criteria, but all participants had PSQI scores greater than five, indicating insomnia problems (Kullich 2003). The severity of the sleep difficulties varied, with mean PSQI scores at baseline ranging from 6.8 to 16.0. Four of the trials reported mean baseline scores around 10 (Chang 2012; Kullich 2003; Lai 2005; Shum 2014).
The target populations in the six trials were diverse. One trial recruited traumatized refugees (Jespersen 2012), and another recruited patients undergoing rehabilitation for low‐back pain (Kullich 2003). Four trials recruited persons with insomnia that were otherwise healthy (Chang 2012; Harmat 2008; Lai 2005; Shum 2014), and two of these trials focused on older adults (Lai 2005; Shum 2014).
Interventions
All included trials used listening to pre‐recorded music as the main intervention. Four trials examined the effects of listening to music only (Chang 2012; Harmat 2008; Jespersen 2012; Shum 2014), and two trials examined music listening with relaxation instructions (Kullich 2003; Lai 2005). In all trials, music was used once a day. Four trials instructed participants to listen to the music at bedtime (Chang 2012; Harmat 2008; Jespersen 2012; Lai 2005). The remaining two trials did not specify what time of the day to listen to the music (Kullich 2003; Shum 2014). The length of the music listening sessions ranged from 25 to 60 minutes with an average of 43 minutes (median 45). The duration of the intervention period ranged from 3 to 35 days, with four trials having an intervention period of 21 days (Harmat 2008; Jespersen 2012; Kullich 2003; Lai 2005), one trial having an intervention period of three days (Chang 2012), and one trial assessing five weeks of intervention (Shum 2014).
The music used in the intervention was selected by the researchers in five trials (Harmat 2008; Jespersen 2012; Kullich 2003; Lai 2005; Shum 2014). Two of these trials gave participants a choice among four or six types of music in different genres (Lai 2005; Shum 2014 respectively). The remaining three trials used the same music for all participants. The sixth trial encouraged participants to bring their own preferred music for bedtime listening (Chang 2012). Those who did not bring their own music (more than half) listened to music prepared by the researchers. In total, 10 participants listened to their own preferred music and 149 participants listened to music chosen by the researcher.
All trials provided information on the music used in the study. The genres reported were Western and Chinese classical music, new age, eclectic, popular oldies, and jazz. Four trials gave information on the specific recordings used (composition title and composer) (Harmat 2008; Jespersen 2012; Kullich 2003; Lai 2005). Two trials stated the specific pieces of music used, but did not give performance‐specific information (Chang 2012; Shum 2014). Four trials described characteristics of the music (Chang 2012; Jespersen 2012; Lai 2005; Shum 2014). These shared common features such as low tempo (52 to 85 beats per minute), stable dynamic structure, and no strong rhythmic accentuation.
Four trials compared the music listening intervention to a no‐treatment control group (Chang 2012; Harmat 2008; Lai 2005; Shum 2014), and two trials compared music listening adjunctive to treatment‐as‐usual (TAU) versus TAU alone (Jespersen 2012; Kullich 2003). One trial had two active intervention groups (Harmat 2008), but only data from the music listening group compared to the no‐treatment control group were included in this review.
Outcomes
Five trials reported on sleep quality using the PSQI (Harmat 2008; Jespersen 2012; Kullich 2003; Lai 2005; Shum 2014). One trial used the polysomnography to objectively measure sleep onset latency, total sleep time, sleep interruption, and sleep efficiency (Chang 2012). The same trial also used a morning questionnaire to report subjective measures of sleep onset latency, total sleep time, and sleep interruption. No trials reported adverse events or deterioration of outcomes during the intervention period. None of the trials reported any secondary outcomes of interest to this review (see the Methods section). Harmat 2008 did measure levels of depression, but only in the intervention group and not in the control group.
Funding sources
Four trials were funded or partly funded by a grant from a national research council, university, government or foundation (Chang 2012; Harmat 2008; Jespersen 2012; Kullich 2003). Two trials reported no information on funding sources (Lai 2005; Shum 2014).
Excluded studies
We excluded 55 trials (from 61 reports) from this review. We excluded 19 trials because they did not have an RCT or qRCT design (e.g. no control group or no randomisation procedure); 19 trials because the participants were not adults with insomnia as defined in the Types of participants subsection (some trials used participants with no sleep problems, some included both good and poor sleepers, and some had no clear documentation of the insomnia problems). We excluded six trials because the intervention was not music listening (e.g. choir singing); six trials because they compared two active interventions (e.g. music versus muscle relaxation techniques); two trials because they had no sleep outcome measure, and three trials because they were not clinical trials (e.g. reflections on practice). We listed the reasons for exclusion for each individual trial in the Characteristics of excluded studies table.
Ongoing studies
Two relevant studies were still ongoing when this review was written (NCT02321826; NCT02376686); see Characteristics of ongoing studies.
Trials awaiting classification
One potentially relevant but unpublished trial was identified (Miller 2002). The trial is referred to in published material (Bernatzky 2011), but there is insufficient information to assess the trial for inclusion or exclusion. The author has been contacted, but has yet to respond (see Characteristics of studies awaiting classification).
Risk of bias in included studies
We assessed the six included trials for risk of bias across the following domains: 1) random sequence generation (selection bias); 2) allocation concealment (selection bias); 3) blinding of participants and personnel (performance bias); 4) blinding of outcome assessment (detection bias); 5) incomplete outcome data (attrition bias); 6) selective reporting (reporting bias); and 7) other bias. The results are depicted in Figure 2. Figure 3 provides a summary of the risk of bias results for each of the included trials. Reasons for the judgement are described in the risk of bias tables beneath the Characteristics of included studies tables.

Risk of bias graph: review authors' judgements about each risk of bias item presented as percentages across all included trials

Risk of bias summary: review authors' judgements about each risk of bias item for each included trial
Allocation
All trials described the randomisation procedures applied. Five trials used a true randomisation procedure (e.g. using a computerized randomisation table), and were judged to be at low risk of bias (Chang 2012; Harmat 2008; Kullich 2003; Lai 2005; Shum 2014). One trial used a quasi‐randomised alternation procedure and was judged to be at high risk of bias (Jespersen 2012).
Four trials described measures taken to conceal allocation and were rated as being at low risk of bias (Chang 2012; Kullich 2003; Lai 2005; Shum 2014). One trial had limited information on allocation concealment and was judged to be unclear for a risk of bias (Harmat 2008), and one trial had no concealment procedure and was judged at high risk of bias (Jespersen 2012).
Blinding
Due to the nature of the intervention, it is not possible to blind participants and it can be difficult to blind personnel or researchers. Bias was considered likely to have occurred in those trials using subjective reports of sleep quality when participants were not blinded (Harmat 2008; Jespersen 2012; Kullich 2003; Lai 2005; Shum 2014). Bias was considered less likely to have occurred in the one trial involving objective measures of sleep, although this trial also included subjective measures of sleep (Chang 2012). Therefore, all trials were judged to be at high risk of performance bias.
In one trial, the technician scoring the polysomnography and the researchers doing the statistical analyses were blinded to group allocation (Chang 2012). One trial reported that group allocation was coded to blind the outcome assessors (Harmat 2008, and another trial reported that the data assessment was done by administrative personnel who were unaware of group allocation (Kullich 2003). These three trials were judged to be at low risk of detection bias. However, the three remaining trials were unblinded and rated as being at high risk of detection bias (Jespersen 2012; Lai 2005; Shum 2014).
Incomplete outcome data
Four trials reported no attrition and no missing data and were rated as being at low risk of attrition bias (Chang 2012; Harmat 2008; Kullich 2003; Shum 2014). In two of these studies (Harmat 2008; Kullich 2003) the information on attrition was not included in the published report but was provided by the authors at our request. One trial had unclear information on attrition and was rated as being unclear for this risk of bias (Lai 2005). Another trial reported the dropout of four participants resulting in an uneven distribution between groups, and was consequently rated as being at high risk of attrition bias (Jespersen 2012). We conducted a sensitivity analysis and found that including or excluding this study did not change the results. Therefore, we included it in successive analyses.
Selective reporting
One trial did not include outcome measures for the no‐treatment control group in the published report, but this information was provided by the authors at our request and did not change the results or conclusions of the published paper (Harmat 2008). Hence, we did not suspect reporting bias and judged the trial to be at low risk of reporting bias. In two trials, there was some uncertainty about the full reporting of outcomes, so these trials were rated as being unclear for the risk of reporting bias (Chang 2012; Shum 2014). There was no evidence of selective reporting in the remaining three trials, which were judged to be at low risk of reporting bias (Jespersen 2012; Kullich 2003; Lai 2005).
Other potential sources of bias
Other potential sources of bias were detected in four trials (Chang 2012; Harmat 2008; Jespersen 2012; Lai 2005). Three trials reported baseline differences between the intervention and control group (Chang 2012; Jespersen 2012; Lai 2005), and in one trial, methods of data collection differed between the intervention and control group (Harmat 2008). Thus, these trials were judged to be at high risk for other biases. No other risks of bias was detected in the final two trials and so these trials were rated as being at low risk for other bias (Kullich 2003; Shum 2014).
Effects of interventions
For an overview, see summary of findings Table for the main comparison. All outcomes are reported as immediate post‐treatment effects.
Primary outcomes
Sleep quality
Five trials, comprising 264 participants, reported on sleep quality and were pooled in meta‐analyses (Harmat 2008; Jespersen 2012; Kullich 2003; Lai 2005; Shum 2014; Analysis 1.1). All trials measured sleep quality with the PSQI and had an intervention period of 21 to 35 days. Meta‐analyses using both fixed‐effect and random‐effects models revealed good agreement and thus we have reported the results from the random‐effects models. The results of the analysis revealed a significant effect in favour of the intervention (mean difference (MD) ‐2.80, 95% confidence interval (CI) ‐3.42 to ‐2.17; Z = 8.77, P < 0.00001; Figure 4). The size of the effect indicates an increase of sleep quality and a decrease of symptoms of insomnia of approximately one standard deviation (SD) in favour of the intervention compared to no treatment or TAU respectively. No statistical heterogeneity was indicated (Tau² = 0.00; I² = 0%).
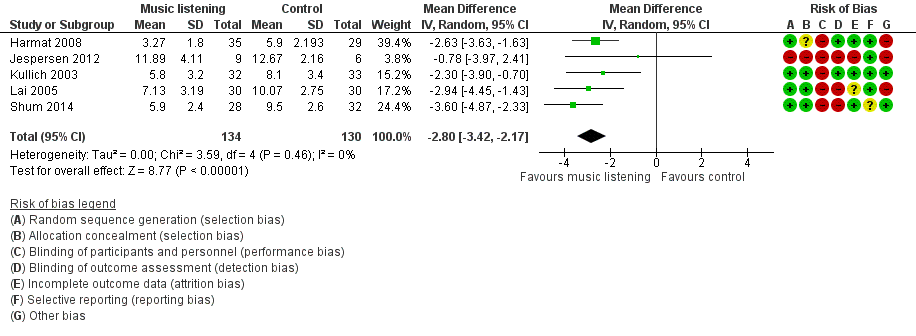
Forest plot of comparison: 1 Sleep quality: listening to music versus control ‐ Pittsburgh Sleep Quality Index (PSQI) ‐ global score, outcome: 1.1 Sleep quality: Pittsburgh Sleep Quality Index (PSQI) ‐ immediately post‐treatment.
Sleep onset latency
One trial, including 50 participants and a three‐day intervention period, measured sleep onset latency with polysomnography (PSG) and a morning questionnaire (Chang 2012). The trial found no evidence of an effect of the intervention on sleep onset latency.
Total sleep time
One trial registered total sleep time with PSG and a morning questionnaire and found no evidence of an effect of the intervention (Chang 2012).
Sleep interruption
One trial measured sleep interruption with PSG and a morning questionnaire (number of awakenings and wake time after sleep onset) (Chang 2012). The trial found no evidence of an effect of the intervention.
Sleep efficiency
Chang 2012 also measured sleep efficiency outcomes with PSG, and found no evidence of an effect of the intervention.
Adverse events
No trial reported a deterioration on a primary outcome or reported any other adverse events.
Secondary outcomes
The secondary outcomes included sleep‐related psychological outcomes (depression, anxiety, and quality of life), physical outcomes (fatigue, daytime sleepiness, and pain), and physiological outcomes (heart rate, heart rate variability, and blood pressure). Only one of these outcomes (i.e. quality of life) was reported in the included trials.
Quality of life
One trial reported an outcome that could be seen as a measure of quality of life. Jespersen 2012 measured the general well‐being of participants with a standardised questionnaire; the outcome was measured before and after the intervention period. They found a significant improvement in the music listening group (P < 0.025), but not in the control group. There were no statistically significant differences detected between the post‐intervention scores of the two groups. The result must be interpreted with caution since the data come from only one trial with a small sample size and high risk of bias.
Subgroup analyses
The included trials enabled us to conduct two of the pre‐defined subgroup analyses. The outcome for both subgroup analyses was sleep quality.
Researcher‐selected music versus participant‐selected music
We explored the influence of music selection, comparing researcher‐selected music (Harmat 2008; Jespersen 2012; Kullich 2003) and participant‐selected music (choice among researcher pre‐selected collection; Lai 2005; Shum 2014). The results of the analysis revealed significant effects on sleep quality regardless of whether music was selected by the researchers (MD ‐2.42; 95% CI ‐3.24 to ‐1.60; Z = 5.80; P < 0.0001; N = 144; Analysis 1.2), or by the participants based on a pre‐selected choice (MD ‐3.35, 95% CI ‐4.28 to ‐2.42; Z = 7.06, P < 0.0001; N = 130). Again, both effects reflected a difference of about one SD between groups, with slightly greater effects in trials that gave participants a choice among pre‐selected music. No significant subgroup differences were found (Figure 5). However, the statistical power available from these five studies was limited, and this may account for our inability to identify potential differences.

Forest plot of comparison: 1 Sleep quality: listening to music versus control ‐ Pittsburgh Sleep Quality Index (PSQI) ‐ global score, outcome: 1.2 Subgroup (PSQI) by music selection ‐ immediately post‐treatment.
Music listening alone versus music listening and relaxation instructions
Finally, we were able to compare trials that applied music listening alone (Harmat 2008; Jespersen 2012; Shum 2014) to trials that used music listening and relaxation instructions (Kullich 2003; Lai 2005). Again, the results of the analysis revealed significant effects on sleep quality regardless of whether the intervention was applied without relaxation instructions (MD ‐2.85; 95% CI ‐3.92 to ‐1.78; Z = 5.23; P < 0.00001; N = 149; Analysis 1.3) or with relaxation instructions (MD ‐2.64; 95% CI ‐3.74 to ‐1.54; Z = 4.71; P < 0.00001; N = 125), with similar effect sizes. No significant subgroup differences were found (Figure 6), but similar to the above mentioned subgroup analysis, it may be due to lack of statistical power.

Forest plot of comparison: 1 Sleep quality: listening to music versus control ‐ Pittsburgh Sleep Quality Index (PSQI) ‐ global score, outcome: 1.3 Subgroup (PSQI) by relaxation instructions ‐ immediately post‐treatment.
Sensitivity analyses
We conducted a series of sensitivity analyses to determine the impact of trial quality and risk of bias on the results of the meta‐analysis for the outcome of sleep quality. First, we excluded trials with inadequate methods of random sequence generation (Jespersen 2012). The effect of music listening on sleep quality was slightly enhanced (MD ‐2.88; 95% CI ‐3.52 to ‐2.24; K (number of trials) = 4) compared to the pooled analysis (Analysis 1.1). Second, we excluded trials using inadequate methods of allocation concealment (Harmat 2008; Jespersen 2012). Again, the effect of music listening on sleep quality was slightly enhanced (MD ‐3.05; 95% CI ‐3.88 to ‐2.22, K = 3). Lastly, we excluded trials using inadequate methods of blinding outcome assessment (Jespersen 2012; Lai 2005; Shum 2014). Compared to the pooled analysis; a similar effect was revealed (MD ‐2.54; 95% CI ‐3.38 to ‐1.69; K = 2). In sum, the sensitivity analyses revealed that excluding trials with inadequate randomisation, allocation concealment or blinding of outcome assessment did not change the results of the meta‐analyses.
Discussion
Summary of main results
We found six trials that met the inclusion criteria for this review. These trials evaluated the effect of listening to music for insomnia in adults. Music listening was compared to no treatment or standard care. We conducted a meta‐analysis using a random‐effects model for the primary outcome of sleep quality that was reported by five of the included trials. The meta‐analysis (Analysis 1.1) showed a large effect of about one standard deviation (SD) in favour of the intervention (Figure 4). The results were consistent across the included trials and sensitivity analyses showed that the beneficial effect of the intervention remained unchanged when excluding trials using inadequate methods of (1) random sequence generation (Jespersen 2012), (2) allocation concealment (Harmat 2008; Jespersen 2012), or (3) blinding outcome assessment (Jespersen 2012; Lai 2005; Shum 2014). Subgroup analyses revealed no difference whether (1) the music was selected by research personnel or the participant (Analysis 1.2), or (2) whether music listening was accompanied by relaxation instructions or not (Analysis 1.3). Only one trial reported on the additional primary outcomes and found no evidence of an effect of the intervention on sleep onset latency, total sleep time, sleep interruption or sleep efficiency (Chang 2012). Adverse events were not reported in any of the trials, and only one trial reported any of the secondary outcomes identified as relevant for this review; it found no clear effect on quality of life in the participants listening to music (Jespersen 2012). For an overview of the results see (summary of findings Table for the main comparison).
Overall completeness and applicability of evidence
Outcomes
Only one of the pre‐defined primary outcomes in this review (sleep quality) was reported by more than one trial. This outcome of sleep quality was reported in five of the six trials and measured with the same questionnaire (Pittsburg Sleep Quality Index (PSQI)), giving substantial weight for a meta‐analysis. The fact that people experienced improvement in sleep quality is important, and the improvement is large enough to be considered clinically relevant. As most trials focused narrowly on subjective sleep quality, there is little information on other aspects of sleep that might be affected by the intervention. However, one trial that did report other sleep outcomes, found no effect on 'sleep onset latency', 'total sleep time', 'sleep interruption', or 'sleep efficacy' (Chang 2012). Yet, it is worth noticing that the intervention period of this trial was only three days compared to 21 to 35 days in the other included trials (see duration, dosage, and setting below). It is unclear if these results are related to the short intervention period or the method for measuring sleep. Five of the six included trials used subjective measures of sleep. Only Chang 2012 used objective methods to measure sleep and found shortened stage two sleep and prolonged rapid eye movement (REM) sleep. The percentage of sleep in each sleep stage is a relatively common reported sleep outcome even though it is not included in the reporting standards for polysomnography in insomnia studies (Buysse 2006). Changes in the amount of sleep in each sleep stage are not always easily interpreted, and it was not included in the primary outcomes of this review in order to keep the list of primary outcomes simple and clear. Therefore, these results are not reported in the results section. Since there can be a discrepancy between subjective and objective measures of sleep, it is recommended to document treatment efficacy with multiple outcomes and multiple assessment modalities (Morin 2003). Currently, there is very limited knowledge as to whether listening to music can improve objective measures of sleep.
Only one of the pre‐defined secondary outcomes was reported in any of the trials. This reflects a lack of data on how the music intervention may affect the waking correlates and consequences of insomnia, such as mood, quality of life, daytime fatigue, pain, heart rate or blood pressure. These measures are important for determining effects beyond the reduction of insomnia symptoms. Insomnia is associated with considerable daytime dysfunction and an effective treatment should improve not only sleep, but also daytime functioning.
No trial reported a deterioration on a primary outcome or other adverse events. Even though adverse events were not among the primary outcomes of the individual trials, it is considered unethical not to report any such events. The absence of these reports may therefore support the safety of the intervention.
Population
The trials were heterogenous with regard to participant characteristics. The majority of the included trials did not describe the participants' characteristics in sufficient detail. All participants experienced insomnia as defined in this review as dissatisfaction with the quality, duration or continuity of sleep. However, the studies used different words to describe the condition (insomnia, poor sleep, sleep problems), and all trials relied on the PSQI for the identification of sleep problems. The PSQI is a well‐validated tool to measure sleep problems, with a clear cut‐off score distinguishing good and poor sleepers (Buysse 1989). However, it is not a specific screening tool for insomnia and the exact nature of the sleep problems are not revealed by the global PSQI score. It is therefore unclear if the participants suffered from difficulties initiating sleep, maintaining sleep, non‐restorative sleep or any combination of these. The amount of daytime dysfunction resulting from the insomnia was not described, and only one trial reported information on the duration of the insomnia (Chang 2012). It could be argued that other tools, such as the Insomnia Severity Index (Bastien 2001), would make a better screening tool for insomnia. It is important to note that none of the participants had a clinical diagnosis of an insomnia disorder (primary or secondary insomnia, psychophysiological insomnia, etc.). This means that the results of this review do not give us any information on the effect of the intervention on persons diagnosed with an insomnia disorder. Furthermore, none of the studies report screening for other sleep disorders, and it cannot be excluded that some of the sleep complaints of the participants was due to other sleep disorders such as sleep apnea or restless legs syndrome. Some trials did not give any information on the underlying cause of insomnia; others related insomnia to a wide range of different conditions, such as pain, psychological trauma or old age. Therefore, we cannot draw any conclusions regarding the effect of listening to music on different population groups. In spite of this high population diversity, the effect of the music intervention was consistent, and it may be that the efficacy of the music listening intervention is not dependent on a particular etiology or insomnia subtype. As mentioned in the Description of the condition, insomnia symptoms are associated with a number of disorders and may be seen as a precursor to depression (Baglioni 2011), as a factor affecting the long‐term outcomes in neurological diseases (Mayer 2011), or a factor contributing to risk of falling in the elderly population (Latimer Hill 2007). Early and safe interventions may therefore be of great importance to both healthy and diseased populations.
Intervention
All trials used pre‐recorded music for the intervention, which reflects the common use of music listening in many clinical and at‐home settings. We were interested in the effect of music interventions that can be used by the general population or in clinical settings, and therefore we did not include studies using live music interventions. Most of the included trials used researcher‐selected music without any clear rationale for the choice of the music. Some trials provided information on the specific characteristics of the music, and these features (e.g. slow tempo and low rhythmic accentuation) fit well with the literature describing the characteristics of potentially sedative music (Wigram 2002). Such detailed description of the music should be obligatory when reporting these kinds of trials since they can help clinicians make well‐informed music selections. Still, it is a limitation that almost all trials used only music chosen by the researchers. Musical taste varies widely among individuals and preferences as well as familiarity with the music may influence the efficacy of the intervention. Some trials gave participants a choice, but only among a limited number of pre‐selected music styles. To some degree this does take individual preferences into account and may enhance the participants' sense of control, which can be an important factor, especially in institutional or hospital settings where people can feel disempowered. When exploring the impact of giving participants a choice among pre‐selected music versus the use of researcher‐selected music, we found no difference in the effect on sleep quality (see Analysis 1.2). However, trials comparing the effects of researcher‐selected music to participant‐selected music are lacking. Some trials added relaxation instructions to the music listening intervention, but subgroup analyses showed no statistically significant differences in effect between trials with and without relaxation instructions (see Analysis 1.3). The music interventions used in these kinds of trials are called a number of names, including music listening, music therapy or simply, music. A common distinction is made between music medicine and music therapy, with music therapy involving an active therapeutic process between the patient and therapist, including the use of music (Bruscia 1998). This is not the case in any of the included trials, and the interventions in this review fall within the music medicine domain.
Duration and setting
Based on this review, listening to music daily for three weeks is sufficient to find an improvement of subjective sleep quality only. As described above, the trial using only three days of intervention did not find evidence of an effect of music on measures of 'sleep onset latency', 'total sleep time', 'sleep interruption', or 'sleep efficiency' (Chang 2012). There were too few trials to determine if these results were due to the short intervention period. The relationship between the duration of the intervention and the effect of the intervention remains unclear, and more research is needed to establish optimal duration of music interventions for adults with insomnia. There is also a lack of information on the long term effects of the intervention, since the longest intervention period implemented was 35 days.
In the included trials, music was used daily for about 45 minutes. This frequency and dosage of the intervention seems beneficial, given the reported effects on sleep quality. However, we cannot conclude if changes in these parameters would affect the effect of the intervention. Similarly, there is limited information on the significance of the timing of the intervention, even though most trials reported the use of music at bedtime. In most trials, the intervention was administered by participants in their own homes. This indicates that music listening can be effective as a self‐administered intervention. However, it is important to note that these trials included weekly contact from researchers to ensure compliance. This may be particularly important with elderly populations or populations with comorbid disorders.
Quality of the evidence
All included trials were at high risk of bias on at least one of the rated items, consequently the results of this review need to be interpreted with caution. Due to the nature of the intervention, blinding of the participants was not possible, and only half of the trials reported blinding of outcome assessors. This may result in overestimation of the treatment effects, especially since a self‐report questionnaire was used to assess the main outcome of sleep quality in most trials. A placebo effect cannot be excluded. It will be important to have more studies with objective outcome measures of sleep since these are less sensitive to the placebo effect than subjective measures. Sensitivity analyses revealed no impact of inadequate randomisation, allocation concealment or blinding of outcome assessors on the results. The positive effect on sleep quality was consistent across all trials, with small confidence intervals in most trials. Three trials reported baseline differences in some aspects of the sleep measures, and this may be due to the relatively small sample sizes (mean 52; median 60). For some trials, we received additional methodological and statistical information from the principal investigators, which improved the quality of the review. When summarizing the assessment of risk of bias of individual studies, the results of the sensitivity analyses, and taking into account GRADE judgements of the overall quality of the evidence (see summary of findings Table for the main comparison), the results indicate effectiveness of music listening for improving sleep quality in adults with insomnia symptoms.
Potential biases in the review process
We conducted extensive electronic searches and handsearches, and we contacted first authors and relevant experts for information on unpublished trials. Therefore, it seems unlikely that we missed important trials within this field. However, one can never be completely sure that all trials have been identified.
Agreements and disagreements with other studies or reviews
We found two other systematic reviews on the efficacy of music listening for improvement of sleep quality in the literature (De Niet 2009; Wang 2014). These reviews had different inclusion and exclusion criteria and therefore included a different set of trials. The major difference was the population under review. Both reviews included adults only, but in the trials included by Wang 2014, the participants did not necessarily suffer from insomnia, resulting in a broader range of included trials. The review by De Niet 2009 only included trials in which the participants were adults with sleep complaints. However, it seems that they did not strictly apply this inclusion criteria, since they included one trial in which not all participants had poor sleep (Hérnandez‐Ruíz 2005) and one trial with no clear documentation of the participants' sleep problems (Zimmerman 1996). These variations result in differences in the trials included in the reviews. De Niet 2009 included five trials (N = 308); three of these are also included in the present review (Harmat 2008; Kullich 2003; Lai 2005). The remaining trials included in this review were not published in 2009. Wang 2014 included 10 trials (N = 557); four of these are also included in this review (Chang 2012; Harmat 2008; Kullich 2003; Lai 2005). Both reviews included meta‐analyses with sleep quality as the primary outcome, and they found statistically significant moderate effect sizes consistent with the results of this review. The present review adds to the robustness of the findings by following rigorous methodology, including an extensive search strategy, clear inclusion criteria, and careful assessment and reporting of risk of bias.
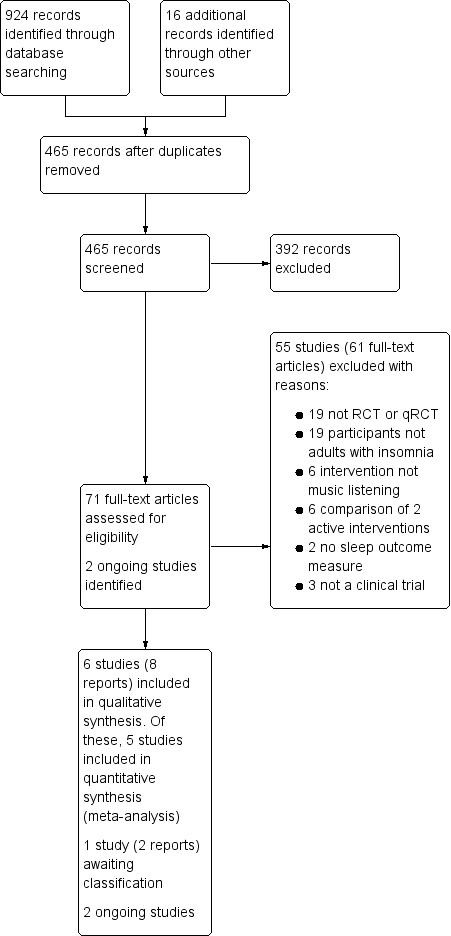
Study flow diagram
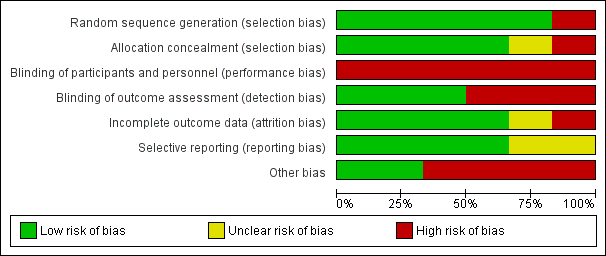
Risk of bias graph: review authors' judgements about each risk of bias item presented as percentages across all included trials
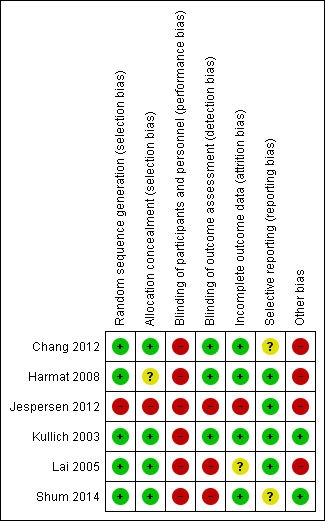
Risk of bias summary: review authors' judgements about each risk of bias item for each included trial

Forest plot of comparison: 1 Sleep quality: listening to music versus control ‐ Pittsburgh Sleep Quality Index (PSQI) ‐ global score, outcome: 1.1 Sleep quality: Pittsburgh Sleep Quality Index (PSQI) ‐ immediately post‐treatment.

Forest plot of comparison: 1 Sleep quality: listening to music versus control ‐ Pittsburgh Sleep Quality Index (PSQI) ‐ global score, outcome: 1.2 Subgroup (PSQI) by music selection ‐ immediately post‐treatment.

Forest plot of comparison: 1 Sleep quality: listening to music versus control ‐ Pittsburgh Sleep Quality Index (PSQI) ‐ global score, outcome: 1.3 Subgroup (PSQI) by relaxation instructions ‐ immediately post‐treatment.
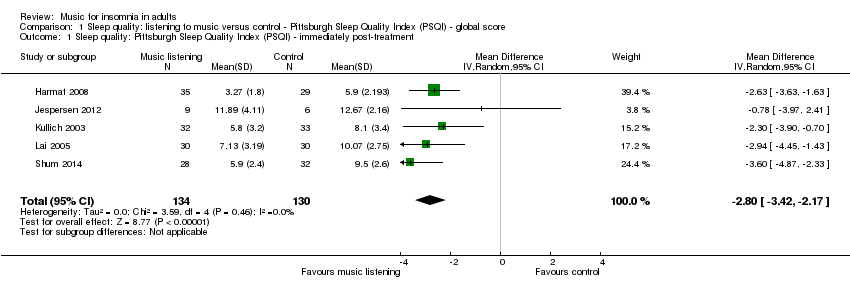
Comparison 1 Sleep quality: listening to music versus control ‐ Pittsburgh Sleep Quality Index (PSQI) ‐ global score, Outcome 1 Sleep quality: Pittsburgh Sleep Quality Index (PSQI) ‐ immediately post‐treatment.

Comparison 1 Sleep quality: listening to music versus control ‐ Pittsburgh Sleep Quality Index (PSQI) ‐ global score, Outcome 2 Subgroup (PSQI) by music selection ‐ immediatly post‐treatment.

Comparison 1 Sleep quality: listening to music versus control ‐ Pittsburgh Sleep Quality Index (PSQI) ‐ global score, Outcome 3 Subgroup (PSQI) by relaxation instructions ‐ immediately post‐treatment.
| Listening to music compared to no treatment or treatment‐as‐usual (TAU) for adults with insomnia | ||||||
| Patient or population: adults with insomnia | ||||||
| Outcomes | Illustrative comparative risks* (95% CI) | Relative effect | Number of participants | Quality of the evidence | Comments | |
| Assumed risk | Corresponding risk | |||||
| No treatment or TAU | Listening to music | |||||
| Sleep quality ‐ immediately post‐treatment Follow‐up: 21 to 35 days | The mean score in the intervention groups was | 264 | ⊕⊕⊕⊝ | A lower score indicates better sleep quality (i.e. fewer sleep problems). The change is about the size of one standard deviation which is considered a clinically relevant change. The studies included participants with a complaint of poor sleep (PSQI > 5)¹. | ||
| Sleep onset latency ‐ immediately post‐treatment Follow‐up: 3 days | See comment | See comment | 50 | ⊕⊕⊝⊝ | The one trial reporting this outcome found no evidence of an effect of the intervention. The data were not available for analysis. The study included participants that had reported poor sleep for at least one month (PSQI > 5)¹. | |
| Total sleep time ‐ immediately post‐treatment | See comment | See comment | 50 | ⊕⊕⊝⊝ | The one study reporting this outcome found no evidence of an effect of the intervention. The data were not available for analysis. The study included participants that had reported poor sleep for at least one month (PSQI > 5)¹. | |
| Sleep interruption ‐ immediately post‐treatment | See comment | See comment | 50 | ⊕⊕⊝⊝ | The one study reporting this outcome found no evidence of an effect of the intervention. The data are not available for analysis. The study included participants that had reported poor sleep for at least one month (PSQI > 5)¹. | |
| Sleep efficiency ‐ immediately post‐treatment | See comment | See comment | 50 | ⊕⊕⊝⊝ | The one study reporting this outcome found no evidence of an effect of the intervention. The data were not available for analysis. The study included participants that had reported poor sleep for at least one month (PSQI > 5)¹. | |
| *The basis for the assumed risk (e.g. the median control group risk across studies) is provided in footnotes. The corresponding risk (and its 95% confidence interval) is based on the assumed risk in the comparison group and the relative effect of the intervention (and its 95% CI) | ||||||
| GRADE Working Group grades of evidence | ||||||
| 1 Pittsburgh Sleep Quality Index. 0 indicates good sleep quality and 21 indicates severe sleep problems. Clinical cut off > 5 (Buysse 1989). | ||||||
| Outcome or subgroup title | No. of studies | No. of participants | Statistical method | Effect size |
| 1 Sleep quality: Pittsburgh Sleep Quality Index (PSQI) ‐ immediately post‐treatment Show forest plot | 5 | 264 | Mean Difference (IV, Random, 95% CI) | ‐2.80 [‐3.42, ‐2.17] |
| 2 Subgroup (PSQI) by music selection ‐ immediatly post‐treatment Show forest plot | 5 | Mean Difference (IV, Random, 95% CI) | Subtotals only | |
| 2.1 Researcher‐selected music | 3 | 144 | Mean Difference (IV, Random, 95% CI) | ‐2.42 [‐3.24, ‐1.60] |
| 2.2 Participant‐selected music (choice among researcher pre‐selected music) | 2 | 130 | Mean Difference (IV, Random, 95% CI) | ‐3.35 [‐4.28, ‐2.42] |
| 3 Subgroup (PSQI) by relaxation instructions ‐ immediately post‐treatment Show forest plot | 5 | Mean Difference (IV, Random, 95% CI) | Subtotals only | |
| 3.1 Music listening alone | 3 | 149 | Mean Difference (IV, Random, 95% CI) | ‐2.85 [‐3.92, ‐1.78] |
| 3.2 Music listening and relaxation instructions | 2 | 125 | Mean Difference (IV, Random, 95% CI) | ‐2.64 [‐3.74, ‐1.54] |