Scolaris Content Display Scolaris Content Display

Study flow diagram.
Figuras y tablas -
Figure 1

Study flow diagram.

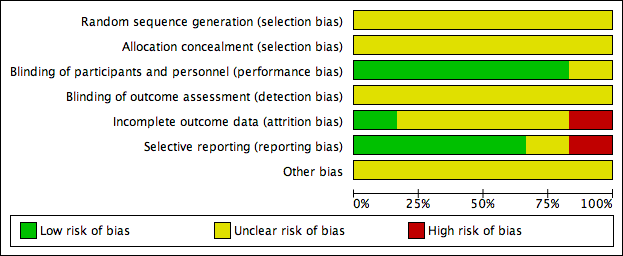
'Risk of bias' graph: authors' judgements about each risk of bias item presented as percentages across all included studies.
Figuras y tablas -
Figure 2

'Risk of bias' graph: authors' judgements about each risk of bias item presented as percentages across all included studies.

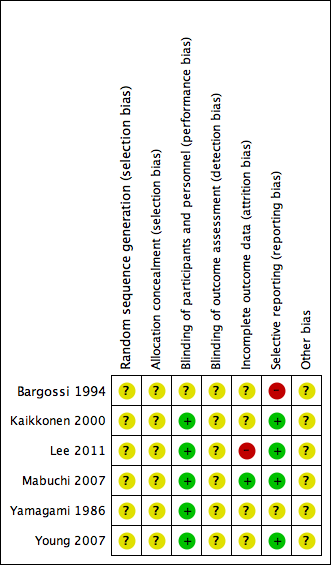
'Risk of bias' summary: authors' judgements about each risk of bias item for each included study.
Figuras y tablas -
Figure 3

'Risk of bias' summary: authors' judgements about each risk of bias item for each included study.

Comparison 1 CoQ10, Outcome 1 Systolic blood pressure.
Figuras y tablas -
Analysis 1.1

Comparison 1 CoQ10, Outcome 1 Systolic blood pressure.

Comparison 1 CoQ10, Outcome 2 Diastolic blood pressure.
Figuras y tablas -
Analysis 1.2

Comparison 1 CoQ10, Outcome 2 Diastolic blood pressure.

Comparison 1 CoQ10, Outcome 3 Total cholesterol.
Figuras y tablas -
Analysis 1.3

Comparison 1 CoQ10, Outcome 3 Total cholesterol.

Comparison 1 CoQ10, Outcome 4 HDL‐cholesterol.
Figuras y tablas -
Analysis 1.4

Comparison 1 CoQ10, Outcome 4 HDL‐cholesterol.

Comparison 1 CoQ10, Outcome 5 Triglycerides.
Figuras y tablas -
Analysis 1.5

Comparison 1 CoQ10, Outcome 5 Triglycerides.

Table 1. Country, baseline CoQ10 levels and dose of CoQ10 supplementation

Study

Country

Baseline CoQ10 level

Dose of CoQ10 level studied (mg/day)

Statin therapy

Duration of CoQ10 intervention

Bargossi 1994

Italy

Plasma

1.20 mg/dL equivalent to 12,000 µg/L (intervention group)

1.08 mg/dL equivalent to 10,800 µg/L (control group)

100

Yes

90 days

Kaikkonen 2000

Finland

Plasma

0.83 ± 0.04 µmol/L equivalent to 716.57 ± 34.53 µg/L (intervention group)

1.07 ± 0.10 µmol/L equivalent to 923.77 ± 86.33 µg/L (control group)

200

Yes

3 months

Lee 2011

Seoul, Republic of Korea

Serum

0.63 ± 0.25 µg/ml equivalent to 630 ± 250 µg/L (intervention group)

0.65 ± 0.27 µg/ml equivalent to 650 ± 270 µg/L (control group)

200

No

12 weeks

Mabuchi 2007

Japan

Plasma

1.113 ± 0.444 µmol/L equivalent to 960.90 ± 383.32 µg/L (intervention group)

1.180 ± 0.282 µmol/L equivalent to 1018.74 ± 243.46 µg/L (control group)

100

Yes

12 weeks

Yamagami 1986

Japan

Serum

0.704 ± 0.04 µg/ml equivalent to 704 ± 40µg/L (intervention group)

0.626 ± 0.05 µg/ml equivalent to 626 ± 50 µg/L (control group)

100

No

12 weeks

Young 2007

New Zealand

Plasma

1.3 (1.0 to 1.4) µmol/L equivalent to 1122.34 ± (863.34 to 1208.68) µg/L (intervention group)

1.4 (1.1 to 1.8) µmol/L equivalent to 1208.68 ± (949.67 to 1554.01) µg/L (control group)

200

Yes

12 weeks

Conversions:
Mass (g) = No moles(n) x molecular mass (gmol‐1)

Molecular mass CoQ10 is 863.34 g

Figuras y tablas -
Table 1. Country, baseline CoQ10 levels and dose of CoQ10 supplementation
Comparison 1. CoQ10

Outcome or subgroup title

No. of studies

No. of participants

Statistical method

Effect size

1 Systolic blood pressure Show forest plot

2

Mean Difference (IV, Fixed, 95% CI)

Totals not selected

2 Diastolic blood pressure Show forest plot

2

71

Mean Difference (IV, Random, 95% CI)

‐1.62 [‐5.20, 1.96]

3 Total cholesterol Show forest plot

1

51

Mean Difference (IV, Fixed, 95% CI)

0.30 [‐0.10, 0.70]

4 HDL‐cholesterol Show forest plot

1

51

Mean Difference (IV, Fixed, 95% CI)

0.02 [‐0.13, 0.17]

5 Triglycerides Show forest plot

1

51

Mean Difference (IV, Fixed, 95% CI)

0.05 [‐0.42, 0.52]

Figuras y tablas -
Comparison 1. CoQ10