Ejercicio para la artrosis de la mano
Información
- DOI:
- https://doi.org/10.1002/14651858.CD010388.pub2Copiar DOI

- Base de datos:
-
- Cochrane Database of Systematic Reviews
- Versión publicada:
-
- 31 enero 2017see what's new
- Tipo:
-
- Intervention
- Etapa:
-
- Review
- Grupo Editorial Cochrane:
-
Grupo Cochrane de Salud musculoesquelética
- Copyright:
-
- Copyright © 2017 The Cochrane Collaboration. Published by John Wiley & Sons, Ltd.
Cifras del artículo
Altmetric:
Citado por:
Autores
Contributions of authors
KBH and IK conceived the idea for the review. All review authors contributed to writing the protocol. NØ and GS screened records for eligibility, considered studies for inclusion, extracted (not NØ) and recorded study data and performed risk of bias assessment and methodological quality assessment. NØ drafted the review. All review authors discussed inclusion versus exclusion of studies, provided comments, made suggestions on draft versions of the review and approved the current version.
Sources of support
Internal sources
-
No sources of support supplied
External sources
-
The Norwegian Fund for Post‐Graduate Training in Physiotherapy, Norway.
Financial support through the FYSIOPRIM project is gratefully acknowledged.
Declarations of interest
Three of the review authors have been involved in two of the included randomised controlled trials conducted to assess the effect of hand exercises in hand OA (NØ, IK and KBH). None of these three were involved in data extraction.
Acknowledgements
The review authors would like to thank Hilde Iren Flaatten and Kari Engen Matre for local librarian assistance with the literature search strategy and the literature search, and Tamara Rader, of the Cochrane Musculoskeletal Review Group, for assistance with the literature search.
Version history
| Published | Title | Stage | Authors | Version |
| 2017 Jan 31 | Exercise for hand osteoarthritis | Review | Nina Østerås, Ingvild Kjeken, Geir Smedslund, Rikke H Moe, Barbara Slatkowsky‐Christensen, Till Uhlig, Kåre Birger Hagen | |
| 2013 Feb 28 | Exercises for hand osteoarthritis | Protocol | Nina Østerås, Ingvild Kjeken, Geir Smedslund, Rikke H Moe, Barbara Slatkowsky‐Christensen, Till Uhlig, Kåre Birger Hagen | |
Differences between protocol and review
We did not include the Osteoarthritis Research Society International/Outcome Measures/Outcome Measures in Rheumatology (OARSI/OMERACT) responder criteria as a minor outcome in the protocol, but half of the included studies reported fulfilment of these criteria, so we decided to include this as a minor outcome in the review.
Keywords
MeSH
Medical Subject Headings (MeSH) Keywords
Medical Subject Headings Check Words
Aged; Female; Humans; Male;
PICO

Study flow diagram.

Risk of bias graph: review authors' judgements about each risk of bias item presented as percentages across all included studies.

Risk of bias summary: review authors' judgements about each risk of bias item for each included study.

Forest plot of comparison: 1 Exercise versus no exercise, outcome: 1.1 Hand pain (short term).

Forest plot of comparison: 1 Exercise versus no exercise, outcome: 1.2 Hand function (short term).

Forest plot of comparison: 1 Exercise versus no exercise, outcome: 1.4 Finger joint stiffness (short term).

Comparison 1 Exercise versus no exercise (short term), Outcome 1 Hand pain (short term).

Comparison 1 Exercise versus no exercise (short term), Outcome 2 Self‐reported hand function (short term).

Comparison 1 Exercise versus no exercise (short term), Outcome 3 Quality of life (short term).

Comparison 1 Exercise versus no exercise (short term), Outcome 4 Finger joint stiffness (short term).

Comparison 1 Exercise versus no exercise (short term), Outcome 5 Adverse events.

Comparison 1 Exercise versus no exercise (short term), Outcome 6 Withdrawals due to adverse events.

Comparison 1 Exercise versus no exercise (short term), Outcome 7 Grip strength (short term).
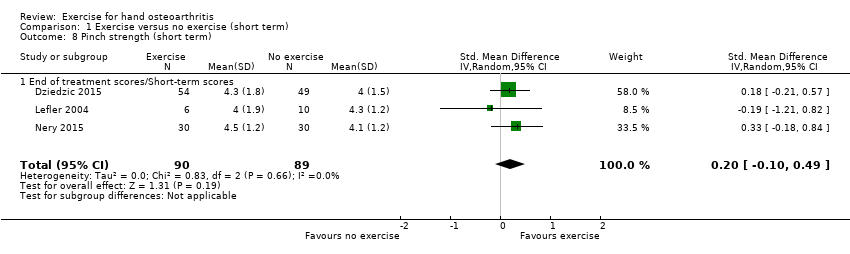
Comparison 1 Exercise versus no exercise (short term), Outcome 8 Pinch strength (short term).

Comparison 1 Exercise versus no exercise (short term), Outcome 9 OARSI/OMERACT responder criteria.

Comparison 2 Exercise versus no exercise (medium term), Outcome 1 Hand pain (6 months).

Comparison 2 Exercise versus no exercise (medium term), Outcome 2 Self‐reported hand function (6 months).

Comparison 2 Exercise versus no exercise (medium term), Outcome 3 Quality of life (6 months).

Comparison 2 Exercise versus no exercise (medium term), Outcome 4 Finger joint stiffness (6 months).

Comparison 2 Exercise versus no exercise (medium term), Outcome 5 Grip strength (6 months).

Comparison 3 Exercise versus no exercise (long term), Outcome 1 Hand pain (12 months).

Comparison 3 Exercise versus no exercise (long term), Outcome 2 Self‐reported hand function (12 months).

Comparison 3 Exercise versus no exercise (long term), Outcome 3 Finger joint stiffness (12 months).
| Study | Median specific exercise | IQR specific exercise group | N specific exercise group | Median general exercise group | IQR general exercise group | N general exercise group |
| Hand pain at rest (short term) | ||||||
| Davenport 2012 | 2.5 | 1.8‐4 | 13 | 1.1 | 0.2‐3.1 | 15 |
| Pinch strength (short term) | ||||||
| Davenport 2012 | 2.5 | 1.9‐3.4 | 13 | 3.8 | 3.1‐6.5 | 15 |
| Hand pain at rest (6 months) | ||||||
| Davenport 2012 | 2 | 0.9‐2.7 | 8 | 0.3 | 0‐3.2 | 14 |
| Pinch strength (6 months) | ||||||
| Davenport 2012 | 2.7 | 2‐3.2 | 8 | 3.9 | 2.8‐6.8 | 14 |
Comparison 4 Comparison of different exercise programmes, Outcome 1 Specific CMC exercises vs general CMC exercises.
| Hand exercise compared with no exercise for hand osteoarthritis (immediately post treatment/short term) | ||||||
| Patient or population: patients with hand osteoarthritis | ||||||
| Outcomes | Illustrative comparative risks* (95% CI) | Relative effect | Number of participants | Quality of the evidence | Comments | |
| Assumed risk | Corresponding risk | |||||
| No exercise | Hand exercise | |||||
| Hand pain Scale from 0 to 10 (0 represents no pain) | Mean hand pain in control groups was 3.9 pointsa | Mean hand pain in intervention groups was 0.5 points lower | 381 | ⊕⊕⊝⊝ | SMD ‐0.27 (‐0.47 to ‐0.07) Absolute reduction in pain 5% (1% to 9%) on a 0‐10 scale Relative change 13% (3% to 22%) NNTB: 9 (5 to 32) | |
| Hand function Scale from 0 to 36 (0 represents no physical disability) | Mean hand function in control groups was 14.5 pointsd | Mean hand function in intervention groups was 2.2 points lower | 369 | ⊕⊕⊝⊝ | SMD ‐0.28 (‐0.58 to 0.02) Absolute improvement in hand function 6% (0.4% worsening to 13% improvement) Relative change 15% (1% worsening to 32% improvement). NNTB: 9 (5 to 52) | |
| Radiographic joint structure changes | Not measured | Not measured | Not estimable | 0 | Not applicable | Radiographic joint changes not measured |
| Quality of life Scale from 0 to 100 (100 represents maximum quality of life) | Mean quality of life in control groups was 50.4 pointse | Mean quality of life in intervention groups was 0.3 points higher | 113 | ⊕⊝⊝⊝ | MD 0.30 (‐3.72 to 4.32) Absolute improvement in quality of life 0.3% (4% worsening to 4% improvement) Relative change 0.6% (7% worsening to 8% improvement) | |
| Finger joint stiffness Scale from 0 to 10 (0 represents no stiffness). | Mean finger joint stiffness in control groups was 4.5 pointsg | Mean finger joint stiffness in intervention groups was 0.7 points lower | 368 | ⊕⊕⊝⊝ | SMD ‐0.36 (‐0.58, ‐0.15) Absolute reduction in finger joint stiffness 7% (3% to 10%) Relative change 14% (6% to 23%) NNTB: 7 (4 to 15) | |
| Adverse events | 0 per 1000 | 32 per 1000h | RR 4.55 | 309 | ⊕⊝⊝⊝ | Absolute risk difference: 2% more events (2% fewer to 5% more) Relative difference 355% (47% decrease to 3831% increase) |
| Withdrawal due to adverse events | 0 per 1000 | 13 per 1000i | RR 2.88 | 309 | ⊕⊝⊝⊝ | Absolute risk difference: 1% more events (2% fewer to 3% more) Relative difference 188% (70% decrease to 2618% increase) |
| *The basis for the assumed risk (e.g. median control group risk across studies) is provided in footnotes. The corresponding risk (and its 95% confidence interval) is based on the assumed risk in the comparison group and the relative effect of the intervention (and its 95% CI). | ||||||
| GRADE Working Group grades of evidence | ||||||
| aControl group baseline hand pain mean (SD) 3.9 (1.8) from Østerås 2014. bDowngraded owing to risk of detection bias on self‐reported outcomes (lack of blinding of participants). cDowngraded owing to imprecision (few participants, wide confidence interval). gControl group baseline finger joint stiffness mean (SD) 4.5 (1.8) from Østerås 2014. | ||||||
| Study | Country | No | Trial type | Setting | Follow‐up | Gender | Age | Sympt | Diagn |
| UK | 39 | Pilot RCT | Hand centre | 3, 6 months | 82% female | 60 | |||
| UK | 130 | RCT | Primary care/Research clinic | 3, 6, 12 months | 66% female | 66 | 5 | ||
| Norway | 80 | RCT | Outpatient secondary care | 3 months | 100% female | 61 | 10 | 2 | |
| US | 19 | RCT | Elderly living community | 6 weeks | 90% female | 81 | |||
| Brazil | 60 | RCT | 6, 12 weeks | Both genders | |||||
| US | 76 | Cross‐over | Florida community | 16, 32, 48 weeks | 85% female | 75 | |||
| Norway | 130 | RCT | Primary/Secondary care | 3, 6 months | 90% female | 66 | 12 | ||
| Age: mean age of participants; Diagn: mean number of years since hand OA was diagnosed; No: number of participants randomly assigned; Sympt: mean number of years with hand OA symptoms. | |||||||||
| Study, country | Intervention | Comparison | Outcome measures |
| UK | Mode: home based, but all were seen at weeks 1, 3 and 7 for exercise review Aim: specific CMC joint exercises to reduce pain and to increase grip strength and range of motion Exercises (3): specific CMC joint exercises including passive extension, active extension and active abduction (abductor pollicis longus) against resistance + pinching/turning/twisting activities Dose: 3‐4 times a day, 10 seconds hold, 3‐10 reps, 3 levels for progression Duration: 6 months Personnel: 1 physiotherapist Number of sessions: > 600 Supervised sessions/review: 3 Adherence: not reported | Mode: home based, but all were seen at weeks 1, 3 and 7 for exercise review Aim: general exercise regimen for CMC Exercises (3): general exercises including passive extension, thumb to fingertip (slide and press), squeeze a peg between thumb and fingers, squeeze a sponge in the hand + pinching/turning/twisting activities Dose: 3‐4 times a day, 10 seconds hold, 3‐10 reps, 3 levels for progression Duration: 6 months Personel: 1 physiotherapist | + Disabilities of the Arm, Shoulder and Hand (DASH) Questionnaire + pinch strength + pain at rest and during pinch (VAS) + abductor pollicis longus (APL) moment |
| UK | Mode: hand exercises in 4 group sessions (1‐1.5 hours) first 4 weeks, the rest home based Aim: to improve strength and dexterity. Included stretching and strengthening hand and thumb exercises Exercises (10): stretching (wrist flexion + extension/pronation + supination, tendon gliding, radial finger walking, make "O" sign, thumb‐5th finger opposition, thumb extension/abduction) and strengthening exercises (elastic band/Play‐Doh providing resistance against thumb/finger abduction/extension, squeeze Play‐Doh, pinch off pieces of Play‐Doh, external weight during wrist movements) Dose: 3 reps initially, increasing up to 10 reps, daily (or most days); performed within limit of discomfort Duration: 12 months Personnel: 9 occupational therapists Number of sessions: 365 Supervised sessions/review: 4 Adherence: 78% reported to exercise ≥ 2×/wk at 6‐month follow‐up | No treatment provided, only written information on self‐management approaches for hand OA that was given to both groups | + OARSI/OMERACT responder criteria + hand pain (NRS) + pain, stiffness and function (AUSCAN) + grip strength (Jamar) + pinch strength (B & L pinch gauge) + grip ability test (GAT) + health‐related QoL (SF‐12) |
| Norway | Mode: home‐based hand exercises. Up to 8 telephone calls by an occupational therapist to facilitate adherence and to provide advice on exercise dosage Aim: maximise stable and pain‐free functional finger joint ROM, increase grip strength, maintain joint stability, prevent/delay development of fixed deformities Exercises (5): make "O" sign, roll into small + large fist, rubber ball squeeze, thumb abduction/extension against elastic band, finger stretch Dose: 3 times a week, 10 reps weeks 1‐2, 12 reps weeks 3‐4, 15 reps weeks 5‐13 Duration: 3 months (13 weeks) Personnel: 2 occupational therapists. Number of sessions: 39 Supervised sessions/review: 1 (but up to 8 phone calls from an occupational therapist) Adherence: median (min‐max) number of recorded sessions was 37 (26‐43) | No treatment provided, only leaflet with information about hand OA, ergonomic principles and advice | + Patient Specific Functional Scale (PSFS) + Functional Index for Hand OsteoArthritis (FIHOA) + hand pain, stiffness, function, fatigue, and patient global assessment of disease activity (NRS) + number of painful joints + grip strength (Jamar) + flexion deficit and thumb opposition + thumb web space (12 cylinders, diameter 1‐12 cm) + finger dexterity (Moberg Pick‐up Test) + OARSI/OMERACT responder criteria |
| US | Mode: supervised Aim: to improve grip strength, pinch strength, joint stability, finger range of motion and joint pain Exercises: isometric resistance for muscle groups in hand and forearm, rice grabs, pinch grip lifting and wrist rolls Dose: 3 times a week. Isometric resistance training 1‐10 reps, 6 seconds hold at low intensity (40%‐60% of 1 RM) 3 times a week. Isotonic resistance training at 40% of 1 RM in 10‐15 reps, progressed to moderate intensity (more than 60% of 1 RM) in 6‐8 reps. Performed below a 1.5 point increase in pain on a 6 point scale (no discomfort‐extreme discomfort) Duration: 6 weeks Personnel: not reported Number of sessions: 18 Supervised sessions/review: 18 Adherence: 67% completed 16‐18 sessions (3 participants missing > 2 sessions were excluded in analyses) | No treatment provided | + pain (6 point scale) + finger range of motion (goniometer) + grip strength (Jamar) + pinch strength (Jamar pinch gauge) |
| Brazil | A session on joint protection and energy conservation for hands was provided before randomisation. Mode: not reported Aim: to target pain, function and strength in hand OA Exercises: not reported Dose: 2 times a week, no more information Duration: 12 weeks Personnel: not reported Number of sessions: 24 Supervised sessions/review: not reported Adherence: not reported | A session on joint protection and energy conservation for hands was provided before randomisation. No treatment provided | + pain (NRS/VAS) + pain, stiffness, function (AUSCAN) + hand function (Cochin Hand Functional Scale) + grip and pinch strength (hydraulic hand and pinch gauge dynamometer) + satisfaction with treatment |
| US | Aim: to improve joint flexibility + grip and pinch strength Exercises (9): flexibility (6): flexion of 2‐5 MCP joints, small fist, large fist, Okay signs, finger spread, thumb reach. Strength (3): squeeze Thera‐Band Hand Exerciser ball until 50% depressed: in palm, key pinch and thumb‐index fingertip pinch Dose: daily Duration: 16 weeks Personnel: principal investigator Number of sessions: 112 Supervised sessions/review: 1 Adherence: not reported | Instructed to apply hand cream once per day using a gentle, non‐vigorous technique | + pain, stiffness, function (AUSCAN) + grip strength (Jamar) + key pinch strength (Jamar pinch dynamometer) + hand dexterity (Purdue Pegboard Model 32020) |
| Norway | Mode: 4 group sessions + 32 home‐based sessions of hand and upper arm exercises. Weekly telephone call by a project group member in weeks with no group session to facilitate adherence and provide advice on exercise dosage Aim: to improve grip strength and thumb stability, to maintain finger range of motion Exercises (8): shoulder extension and biceps curl in sitting position with elastic band, shoulder flexion in standing with elastic band, make "O"sign, roll into small + large fist, rubber tube squeeze (10 sec hold), thumb abduction/extension against elastic band, finger stretch Dose: 3 times a week, 10 reps weeks 1‐2, 15 reps weeks 3‐12, instructed to apply moderate to vigorous intensity Duration: 3 months (12 weeks) Personnel: 2 occupational therapists. Number of sessions: 36 Supervised sessions/review: 4 Adherence: 47% recorded 35‐36 sessions and 94% recorded ≥ 22 sessions. | No treatment provided | + Functional Index for Hand OsteoArthritis (FIHOA) + Patient Specific Functional Scale (PSFS) + hand pain, stiffness, function, fatigue, and patient global assessment of disease activity (NRS) + grip strength (Jamar) + thumb web space (12 cylinders, diameter 1‐12 cm) + finger dexterity (Moberg Pick‐up Test) + OARSI/OMERACT responder criteria |
| APL: abductor pollicis longus. AUSCAN: Australian/Canadian Hand Osteoarthritis Index. CMC: carpometacarpal. DASH: Disabilities of the Arm, Shoulder and Hand Questionnaire FIHOA: Functional Index for Hand OsteoArthritis. GAT: Grip Ability Test. NRS: numeric rating scale. OA: osteoarthritis. OARSI/OMERACT: Osteoarthritis Research Society International/Outcome Measures/Outcome Measures in Rheumatology PSFS: Patient Specific Functional Scale. RM: repetition maximum. SF‐12: The 12‐Item Short Form Health Survey VAS: visual analogue scale | |||
| Study | Primary outcome measure | NRS/VAS pain | AUSCAN pain/ function/stiffness | FIHOA function | NRS function | SF‐12 | NRS stiffness | Reported on adverse events | Grip strength | Pinch strength | OARSI/OMERACT responder criteria |
| DASH | √ | √ | |||||||||
| OMERACT/OARSI responder criteria | √ | √ | √ | √ | √ | √ | √ | ||||
| PSFS | √ | √ | √ | √ | √ | √ | √ | ||||
| ? | √ (6 categories) | √ | √ | ||||||||
| ? | √ | √ | √ | √ | |||||||
| AUSCAN Function | √ | √ | √ | √ | |||||||
| PSFS + FIHOA | √ | √ | √ | √ | √ | √ | √ | ||||
| AUSCAN: Australian/Canadian Hand Osteoarthritis Index. DASH: Disabilities of the Arm, Shoulder and Hand Questionnaire FIHOA: Functional Index for Hand OsteoArthritis. NRS: numeric rating scale. OARSI/OMERACT: Osteoarthritis Research Society International/Outcome Measures/Outcome Measures in Rheumatology PSFS: Patient Specific Functional Scale. SF‐12: The 12‐Item Short Form Health Survey VAS: visual analogue scale | |||||||||||
| Outcome or subgroup title | No. of studies | No. of participants | Statistical method | Effect size |
| 1 Hand pain (short term) Show forest plot | 5 | 381 | Std. Mean Difference (IV, Random, 95% CI) | ‐0.27 [‐0.47, ‐0.07] |
| 1.1 End of treatment scores/Short‐term scores | 5 | 381 | Std. Mean Difference (IV, Random, 95% CI) | ‐0.27 [‐0.47, ‐0.07] |
| 2 Self‐reported hand function (short term) Show forest plot | 4 | 369 | Std. Mean Difference (IV, Random, 95% CI) | ‐0.28 [‐0.58, 0.02] |
| 2.1 End of treatment scores/Short‐term scores | 4 | 369 | Std. Mean Difference (IV, Random, 95% CI) | ‐0.28 [‐0.58, 0.02] |
| 3 Quality of life (short term) Show forest plot | 1 | 113 | Mean Difference (IV, Random, 95% CI) | 0.30 [‐3.72, 4.32] |
| 3.1 End of treatment scores/Short‐term scores | 1 | 113 | Mean Difference (IV, Random, 95% CI) | 0.30 [‐3.72, 4.32] |
| 4 Finger joint stiffness (short term) Show forest plot | 4 | 368 | Std. Mean Difference (IV, Random, 95% CI) | ‐0.36 [‐0.58, ‐0.15] |
| 4.1 End of treatment scores/Short‐term scores | 4 | 368 | Std. Mean Difference (IV, Random, 95% CI) | ‐0.36 [‐0.58, ‐0.15] |
| 5 Adverse events Show forest plot | 3 | 309 | Risk Ratio (M‐H, Random, 95% CI) | 4.55 [0.53, 39.31] |
| 6 Withdrawals due to adverse events Show forest plot | 3 | 309 | Risk Ratio (M‐H, Random, 95% CI) | 2.88 [0.30, 27.18] |
| 7 Grip strength (short term) Show forest plot | 5 | 362 | Std. Mean Difference (IV, Random, 95% CI) | 0.34 [‐0.01, 0.69] |
| 7.1 End of treatment scores/Short‐term scores | 5 | 362 | Std. Mean Difference (IV, Random, 95% CI) | 0.34 [‐0.01, 0.69] |
| 8 Pinch strength (short term) Show forest plot | 3 | 179 | Std. Mean Difference (IV, Random, 95% CI) | 0.20 [‐0.10, 0.49] |
| 8.1 End of treatment scores/Short‐term scores | 3 | 179 | Std. Mean Difference (IV, Random, 95% CI) | 0.20 [‐0.10, 0.49] |
| 9 OARSI/OMERACT responder criteria Show forest plot | 3 | 305 | Risk Ratio (M‐H, Random, 95% CI) | 2.80 [1.40, 5.62] |
| Outcome or subgroup title | No. of studies | No. of participants | Statistical method | Effect size |
| 1 Hand pain (6 months) Show forest plot | 2 | 220 | Std. Mean Difference (IV, Random, 95% CI) | 0.09 [‐0.18, 0.35] |
| 2 Self‐reported hand function (6 months) Show forest plot | 2 | 228 | Std. Mean Difference (IV, Random, 95% CI) | ‐0.05 [‐0.31, 0.21] |
| 3 Quality of life (6 months) Show forest plot | 1 | 100 | Mean Difference (IV, Random, 95% CI) | 1.90 [‐2.27, 6.07] |
| 4 Finger joint stiffness (6 months) Show forest plot | 2 | 225 | Std. Mean Difference (IV, Random, 95% CI) | ‐0.12 [‐0.38, 0.14] |
| 5 Grip strength (6 months) Show forest plot | 1 | 106 | Std. Mean Difference (IV, Random, 95% CI) | ‐0.04 [‐0.42, 0.35] |
| Outcome or subgroup title | No. of studies | No. of participants | Statistical method | Effect size |
| 1 Hand pain (12 months) Show forest plot | 1 | 102 | Std. Mean Difference (IV, Random, 95% CI) | ‐0.22 [‐0.61, 0.17] |
| 2 Self‐reported hand function (12 months) Show forest plot | 1 | 108 | Std. Mean Difference (IV, Random, 95% CI) | ‐0.09 [‐0.47, 0.29] |
| 3 Finger joint stiffness (12 months) Show forest plot | 1 | 108 | Std. Mean Difference (IV, Random, 95% CI) | ‐0.33 [‐0.71, 0.05] |
| Outcome or subgroup title | No. of studies | No. of participants | Statistical method | Effect size |
| 1 Specific CMC exercises vs general CMC exercises Show forest plot | Other data | No numeric data | ||
| 1.1 Hand pain at rest (short term) | Other data | No numeric data | ||
| 1.2 Pinch strength (short term) | Other data | No numeric data | ||
| 1.3 Hand pain at rest (6 months) | Other data | No numeric data | ||
| 1.4 Pinch strength (6 months) | Other data | No numeric data | ||