نقش ورزش در مدیریت درمانی استئوآرتریت دست
چکیده
پیشینه
استئوآرتریت دست (osteoarthritis; OA) یک بیماری شایع مفصلی است که ممکن است منجر به درد، سفتی و مشکلات در انجام فعالیتهای مرتبط با دست در زندگی روزمره شود. در حال حاضر، هیچ درمانی برای OA شناخته نشده و روشهای غیر‐دارویی بهعنوان خط اول درمان توصیه میشوند. تأثیر مثبت ورزش در OA مفصل ران و زانو اثبات شده، اما تأثیر ورزش بر OA دست هنوز مشخص نیست.
اهداف
ارزیابی منافع و آسیبهای ورزش در مقایسه با مداخلات دیگر، شامل دارونما (placebo) یا عدم مداخله، در افراد مبتلا به OA دست. پیامدهای اصلی عبارت بودند از درد دست و عملکرد دست.
روشهای جستوجو
ما شش بانک اطلاعاتی الکترونیکی را تا سپتامبر 2015 جستوجو کردیم.
معیارهای انتخاب
همه کارآزماییهای بالینی تصادفیسازی و کنترل شده به مقایسه ورزش درمانی در برابر عدم انجام ورزش یا به مقایسه برنامههای مختلف ورزشی پرداختند.
گردآوری و تجزیهوتحلیل دادهها
دو نویسنده مرور بهطور مستقل از هم، کارآزماییها را انتخاب و دادهها را استخراج کرده، خطر سوگیری (bias) را برآورد و کیفیت بدنه شواهد را با کاربرد سیستم درجهبندی توصیه، ارزیابی، توسعه و ارزشیابی (GRADE) ارزیابی کردند. پیامدها شامل هر دو پیامدهای پیوسته (درد دست، عملکرد فیزیکی، سفتی مفصل دست و کیفیت زندگی) و پیامدهای دو حالتی (نسبت عوارض جانبی و خروج از مطالعه) بودند.
نتایج اصلی
ما هفت مطالعه را در این مرور انتخاب کردیم. اکثر مطالعات عاری از سوگیری انتخابی و گزارشدهی بودند، اما یک مطالعه فقط بهعنوان چکیده کنگره موجود بود. کورسازی شرکتکنندگان نسبت به تخصیص درمان ممکن نبود، و اگرچه اکثر مطالعات کورسازی ارزیابهای پیامد را گزارش کردند، برخی پیامدها (درد، عملکرد، سفتی و کیفیت زندگی) توسط خود افراد گزارش شده بودند (self‐reported). نتایج ممکن است به دلیل عدم کورسازی شرکتکنندگان و پیامدهای خود‐گزارش شده برای اجرا و سوگیری تشخیص غیر‐قابل دفاع باشند. دو مطالعه با نرخ بالای حذف (drop‐out rates) ممکن است به سوگیری ریزش نمونه (attrition bias) حساس باشند. به علت سوگیری بالقوه تشخیص (عدم کورسازی شرکتکنندگان در پیامدهای خود‐گزارش شده) و عدم دقت (مطالعات اندک بودند، تعداد شرکتکنندگان محدود بوده و فواصل اطمینان برای پیامدهای درد، عملکرد و سفتی مفصل، گسترده بودند)، سطح کیفیت کلی بدنه شواهد را پائین آوردیم (شواهد با کیفیت پائین). برای کیفیت زندگی، عوارض جانبی و خروج از مطالعه به علت عوارض جانبی، کیفیت کلی بدنه شواهد را بیشتر کاهش دادیم (شواهد با کیفیت بسیار پائین) زیرا مطالعات بسیار محدود و فواصل اطمینان بسیار گسترده بودند.
شواهدی با کیفیت پائین به دست آمده از پنج کارآزمایی (381 شرکتکننده) نشان داد که ورزش میزان درد دست را پس از مداخله کاهش داد (تفاوت میانگین استاندارد شده (SMD): 0.27‐؛ 95% فاصله اطمینان (CI): 0.47‐ تا 0.07‐). کاهش مطلق درد برای گروه ورزش در مقایسه با گروه کنترل: 5% (1% تا 9%) در مقیاس 0 تا 10 نقطه بود. درد در گروه کنترل به میزان 3.9 نقطه در این مقیاس (0 = بدون درد) تخمین زده شد و ورزش درد را 0.5 نقطه کاهش داد (95% CI؛ 0.1 تا 0.9؛ تعداد افراد مورد نیاز جهت درمان تا حصول یک پیامد مثبت اضافی (number needed to treat for an additional beneficial outcome; NNTB) = 9).
چهار مطالعه (369 شرکتکننده) نشان داد که ورزش عملکرد دست را پس از مداخله بهبود بخشید (SMD: ‐0.28؛ 95% CI؛ 0.58‐ تا 0.02). بهبود مطلق در عملکرد دست در گروه ورزش در مقایسه با گروه کنترل 6% بود (0.4% بدتر شدن به 13% بهبود یافتن). عملکرد در گروه کنترل 14.5 نقطه در مقیاس 0 تا 36 نقطهای برآورد شد (0 = عدم توانایی فیزیکی) و ورزش عملکرد را 2.2 نقطه بهبود داد (95% CI؛ 0.2‐ تا 4.6؛ NNTB: 9).
یک مطالعه (113 شرکتکننده) کیفیت زندگی را ارزیابی کرد و نشان داد که تأثیر ورزش بر کیفیت زندگی در حال حاضر نامشخص است (تفاوت میانگین (MD): 0.30؛ 95% CI؛ 3.72‐ تا 4.32). بهبود مطلق در کیفیت زندگی برای گروه ورزش در مقایسه با گروه کنترل 0.3% بود (4% بدتر شدن به 4% بهبود یافتن). کیفیت زندگی در گروه کنترل 50.4 نقطه در مقیاس 0 تا 100 نقطهای گزارش شد (حداکثر کیفیت زندگی = 100) و میانگین نمره در گروه ورزش 0.3 نقطه بالاتر بود (3.5 نقطه پائینتر تا 4.1 نقطه بالاتر).
چهار مطالعه (369 شرکتکننده) نشان داد که ورزش سفتی مفصل انگشت را پس از مداخله کاهش داد (SMD: ‐0.36؛ 95% CI؛ 0.58‐ تا 0.15‐). کاهش مطلق در سفتی مفصل انگشت برای گروه ورزش در مقایسه با گروه کنترل 7% (3% تا 10%) بود. سفتی مفصل انگشت در گروه کنترل 4.5 نقطه در مقیاس 0 تا 10 نقطهای (0 = بدون سفتی بدن) برآورد شد و ورزش سفتی مفصل را تا 0.7 نقطه بهبود بخشید (95% CI؛ 0.3 تا 1.0؛ NNTB: 7).
سه مطالعه عوارض جانبی مربوط به مداخله و خروج از مطالعه را ناشی از عوارض جانبی گزارش کردند. معدود عوارض جانبی گزارش شده عبارت بود از افزایش التهاب مفصل انگشت و درد دست. شواهدی با کیفیت پائین از سه مطالعه احتمال افزایش عوارض جانبی (خطر نسبی) (RR: 4.55؛ 95% CI؛ 0.53 تا 39.31) و خروج از مطالعه را به علت عوارض جانبی در گروه ورزش نسبت به گروه کنترل (RR: 2.88؛ 95% CI؛ 0.30 تا 27.18) نشان دادند، اما تاثیر مداخله نامعلوم است و انجام تحقیقات بیشتر ممکن است این برآوردها را تغییر دهند.
مطالعات انتخاب شده تغییرات ساختاری رادیوگرافیکی مفصل را اندازهگیری نکردند. دو مطالعه، دادههای پیگیری شش ماهه (220 شرکتکننده) و یکی (102 شرکتکننده) دادههای پیگیری 12 ماهه را ارائه دادند. تأثیر مثبت ورزش بر درد، عملکرد و سفتی مفصل در پیگیری متوسط و بلندمدت پایدار نبود.
مداخله ورزش تا حد زیادی از لحاظ مقدار، محتوا و تعداد جلسات تحت نظارت متنوع بود. در چهار مطالعه شرکتکنندگان آموزش داده شدند که دو تا سه بار در هفته ورزش انجام دهند؛ در دو مطالعه روزانه و در یک مطالعه دیگر سه تا چهار بار در روز. مداخلات ورزشی در هر هفت مطالعه با هدف بهبود قدرت عضلانی و ثبات یا عملکرد مفاصل بودند، اما تعداد و نوع تمرینات بهطور عمده در مطالعات متفاوت بود. چهار مطالعه پایبندی را به برنامه ورزشی گزارش دادند؛ در سه مطالعه، خود بیماران گزارش کرده بودند. پایبندی خود‐گزارشی به تعداد جلسات ورزشی توصیه شده، بین 78% تا 94% بود. در مطالعه چهارم، 67% حداقل 16 جلسه را از 18 جلسه ورزش برنامهریزی شده انجام دادند.
نتیجهگیریهای نویسندگان
هنگامی که نتایج پنج مطالعه را جمع کردیم، شواهدی را با کیفیت پائین یافتیم که نشاندهنده اثرات مفید کمی از ورزش بر درد دست، عملکرد و سفتی مفصل انگشت بودند. اندازههای تاثیرگذاری تخمین زده شده کوچک بودند، و اینکه آنها نشاندهنده یک تغییر مهم بالینی هستند یا خیر، ممکن است جای شک داشته باشد. یک مطالعه کیفیت زندگی را گزارش کرد، و اثر مداخله نامشخص است. سه مطالعه در مورد عوارض جانبی گزارش کردند، که بسیار اندک بوده و شدید نبودند.
PICO
خلاصه به زبان ساده
نقش ورزش در مدیریت درمانی استئوآرتریت دست
پیشینه – استئوآرتریت دست چیست و ورزش چیست؟
استئوآرتریت (osteoarthritis; OA) یک بیماری مفاصل است که باعث درد، سفتی و تورم مفصل میشود. این بیماری ممکن است مانع از آن شود که افراد آنچه را میخواهند و نیاز دارند، انجام دهند. معمولا، نشانهها به آرامی شروع شده اما در طول زمان بدتر میشوند. OA ممکن است در هر مفصلی اتفاق افتد اما اغلب در مفصل ران، زانو و مفاصل کوچک دست مشاهده میشود. هیچ درمانی برای OA شناخته نشده، اما جایگزینهای درمانی موجود ممکن است درد و سفتی را کاهش داده، عملکرد را افزایش و خود‐مدیریتی بیماری را بهبود بخشند.
ورزش، فعالیتی است که برای بهبود یا حفظ تناسب اندام، توانایی و عملکرد انجام میشود. یک دوره تمرین برنامهریزی شده معمولا با هدف بهبود یا حفظ قدرت عضلانی، تناسب فیزیکی، تحرک مفصل و سلامت کلی انجام میشود.
ویژگیهای مطالعه
این مرور کاکرین آنچه را که ما در مورد تاثیر ورزش بر افراد مبتلا به OA در مفاصل دست میدانیم، ارائه میدهد. پس از جستوجو برای مطالعات مرتبط تا سپتامبر 2015، هفت مطالعه را وارد کردیم (534 شرکتکننده). این مطالعات، بیشتر شامل زنان بودند تا مردان. در شش مطالعه نیمی از افراد تحت برنامه ورزش دست قرار گرفتند و با افرادی مقایسه شدند که ورزش نکردند. یک مطالعه دو گروه از افرادی را مقایسه کرد که تحت دو برنامه ورزشی مختلف قرار گرفتند. شواهد حاصل از پنج مطالعه تأثیر ورزش را بلافاصله پس از برنامه ورزشی نشان داده و دو مطالعه نتایجی را روی پایداری متوسط و بلندمدت ورزش ارائه کردند. در زیر فقط نتایج گزارش شده را بلافاصله پس از تکمیل برنامه ورزشی ارائه میدهیم.
نتایج اصلی
در یک مقیاس 0 تا 10 نقطهای (نمرات پائینتر به معنای درد کمتر)، افرادی که یک برنامه ورزشی را به اتمام رساندند درد دست آنها در پایان درمان نسبت به افرادی که ورزش نکردند 0.5 نقطه پائینتر ارزیابی شد (5% بهبود مطلق). درد در افرادی که ورزش نکردند، 3.9 نقطه ارزیابی شد.
در یک مقیاس 0 تا 36 نقطهای (نمرات پائینتر به معنای عملکرد بهتر) افرادی که یک برنامه ورزشی را تکمیل کردند در مقایسه با افرادی که ورزش نکردند، به عملکرد دست خود 2.2 نقطه پائینتر نمره دادند (6% بهبود مطلق). در افرادی که ورزش نکردند، عملکرد دست آنها 14.5 نقطه ارزیابی شد.
در یک مقیاس 0 تا 100 امتیازی (نمرات بالاتر به معنی کیفیت بهتر زندگی)، افرادی که یک برنامه ورزشی را به پایان رساندند، کیفیت زندگی خود را 0.3 امتیاز بالاتر (0.3% بهبودی مطلق) از افرادی که ورزش نکردند، ارزیابی کردند. رتبه کیفیت زندگی افرادی که ورزش نکردند 50.4 نقطه ارزیابی شد.
در یک مقیاس 0 تا 10 نقطهای (نمرات پائینتر به معنی سفتی کمتر مفصل انگشت)، سفتی مفاصل انگشت در افرادی که یک برنامه ورزشی را تکمیل کردند، در مقایسه با افرادی که ورزش نکردند، در پایان درمان 0.7 نقطه پائینتر ارزیابی شد (7% بهبود مطلق). رتبه سفتی مفاصل انگشت افرادی که ورزش نکردند، 4.5 نقطه ارزیابی شد.
تعداد کمی از افراد در گروه ورزش، عوارض جانبی را مانند افزایش درد یا تورم مفصل گزارش کردند. ما مطمئن نیستیم که ورزش تعداد افرادی را که دچار عوارض جانبی میشوند افزایش میدهد یا خیر.
کیفیت شواهد
ما کیفیت شواهد را (بسیار) پائین درجهبندی کردیم. فقدان کورسازی شرکتکنندگان، تعداد کم مطالعات وارد شده و انتخاب تعداد کمی از افراد در تجزیهوتحلیلها، قدرت و دقت این یافتهها را کاهش داده و انجام تحقیقات بیشتر ممکن است نتایج را تغییر دهند. فقط نیمی از مطالعات انتخاب شده اثرات جانبی را گزارش کردند و عوارض جانبی معدودی که در گروه ورزش رخ داده بود، گزارش شد.
Authors' conclusions
Summary of findings
| Hand exercise compared with no exercise for hand osteoarthritis (immediately post treatment/short term) | ||||||
| Patient or population: patients with hand osteoarthritis | ||||||
| Outcomes | Illustrative comparative risks* (95% CI) | Relative effect | Number of participants | Quality of the evidence | Comments | |
| Assumed risk | Corresponding risk | |||||
| No exercise | Hand exercise | |||||
| Hand pain Scale from 0 to 10 (0 represents no pain) | Mean hand pain in control groups was 3.9 pointsa | Mean hand pain in intervention groups was 0.5 points lower | 381 | ⊕⊕⊝⊝ | SMD ‐0.27 (‐0.47 to ‐0.07) Absolute reduction in pain 5% (1% to 9%) on a 0‐10 scale Relative change 13% (3% to 22%) NNTB: 9 (5 to 32) | |
| Hand function Scale from 0 to 36 (0 represents no physical disability) | Mean hand function in control groups was 14.5 pointsd | Mean hand function in intervention groups was 2.2 points lower | 369 | ⊕⊕⊝⊝ | SMD ‐0.28 (‐0.58 to 0.02) Absolute improvement in hand function 6% (0.4% worsening to 13% improvement) Relative change 15% (1% worsening to 32% improvement). NNTB: 9 (5 to 52) | |
| Radiographic joint structure changes | Not measured | Not measured | Not estimable | 0 | Not applicable | Radiographic joint changes not measured |
| Quality of life Scale from 0 to 100 (100 represents maximum quality of life) | Mean quality of life in control groups was 50.4 pointse | Mean quality of life in intervention groups was 0.3 points higher | 113 | ⊕⊝⊝⊝ | MD 0.30 (‐3.72 to 4.32) Absolute improvement in quality of life 0.3% (4% worsening to 4% improvement) Relative change 0.6% (7% worsening to 8% improvement) | |
| Finger joint stiffness Scale from 0 to 10 (0 represents no stiffness). | Mean finger joint stiffness in control groups was 4.5 pointsg | Mean finger joint stiffness in intervention groups was 0.7 points lower | 368 | ⊕⊕⊝⊝ | SMD ‐0.36 (‐0.58, ‐0.15) Absolute reduction in finger joint stiffness 7% (3% to 10%) Relative change 14% (6% to 23%) NNTB: 7 (4 to 15) | |
| Adverse events | 0 per 1000 | 32 per 1000h | RR 4.55 | 309 | ⊕⊝⊝⊝ | Absolute risk difference: 2% more events (2% fewer to 5% more) Relative difference 355% (47% decrease to 3831% increase) |
| Withdrawal due to adverse events | 0 per 1000 | 13 per 1000i | RR 2.88 | 309 | ⊕⊝⊝⊝ | Absolute risk difference: 1% more events (2% fewer to 3% more) Relative difference 188% (70% decrease to 2618% increase) |
| *The basis for the assumed risk (e.g. median control group risk across studies) is provided in footnotes. The corresponding risk (and its 95% confidence interval) is based on the assumed risk in the comparison group and the relative effect of the intervention (and its 95% CI). | ||||||
| GRADE Working Group grades of evidence | ||||||
| aControl group baseline hand pain mean (SD) 3.9 (1.8) from Østerås 2014. bDowngraded owing to risk of detection bias on self‐reported outcomes (lack of blinding of participants). cDowngraded owing to imprecision (few participants, wide confidence interval). gControl group baseline finger joint stiffness mean (SD) 4.5 (1.8) from Østerås 2014. | ||||||
Background
Description of the condition
Hand osteoarthritis (OA) is a frequent joint disorder in the adult population. The prevalence of hand OA increases with age, and after the age of 50 years, more women than men are affected (Bijlsma 2011). In previous studies, the reported prevalence of hand OA varied, possibly as the result of differences in sample populations or disease definitions, or both (Pereira 2011; Zhang 2007). In a Norwegian population‐based study with persons aged 24 to 76 years, the prevalence of self‐reported symptomatic hand OA was 5.8% and 2.5% in women and men, respectively (Grotle 2008). The prevalence of symptomatic hand OA in an American population cohort with mean age 59 years was 15.9% in women and 8.2% in men (Haugen 2011). In a Dutch population cohort including both genders with mean age 66 years, the prevalence was 11% (Kwok 2011). In light of the ageing population trend in most parts of the world, the number of persons with hand OA is expected to increase over the next decades.
Hand OA can manifest as soft tissue swelling, inflammation, bony enlargement and bone erosion. People with hand OA often experience hand pain, finger joint stiffness and reduced grip strength, which may result in activity limitations and participation restrictions (Elliott 2007; Kjeken 2005; Kloppenburg 2007; Stamm 2009; Zhang 2002). Previous research has revealed an association between limited range of motion in finger joints, pain and grip strength (Slatkowsky‐Christensen 2010). Kjeken 2005 showed that the average grip strength in women with hand OA was less than 60% that of healthy age‐ and sex‐matched individuals, and that reduced grip strength was related to activity limitations and participation restrictions.
Description of the intervention
Currently, no cure for OA is known, and treatment aims to reduce pain and functional disability. Current pharmacological treatment for hand OA most often is confined to symptomatic treatment, and surgical treatment usually is limited to cases of severe OA in the first carpometacarpal (CMC1) joint. Non‐pharmacological modalities are recommended for all people with OA, and information, exercise and weight reduction constitute core treatment recommendations (Fernandes 2013; Hochberg 2012; McAlindon 2014; NICE 2014).
Hand exercise programmes may comprise exercises designed to improve muscle strength, joint mobility and/or joint stability. Guidelines from the European League Against Rheumatism (EULAR) recommend exercise therapy as a strategy for improving hand strength and joint mobility in persons with hand OA (Zhang 2007), whereas more recent guidelines from the American College of Rheumatology (ACR) do not include exercise for hand OA (Hochberg 2012). Guidelines from the National Institute for Health and Care Excellence (NICE) state that exercise should be a core treatment for people with clinical symptomatic OA, irrespective of age, comorbidity, pain severity and disability, but acknowledge that evidence showing effects of exercise in hand OA is limited, and that mechanisms of exercise for the hip and the hand may be different from those for knee OA (NICE 2014). Qualitative analyses performed in a recent review identified five categories of potential pathways for the effects of exercise in knee OA: neuromuscular, peri‐articular, intra‐articular, psychosocial and general fitness and health (Beckwee 2013). A recent systematic review identified increased upper leg strength, decreased extension impairment and improved proprioception as possible mediators in the association between exercise and OA symptoms in knee OA (Runhaar 2015). However, a better understanding of these suggested pathways is warranted ‐ also for hand OA. Increased knowledge may contribute to more targeted treatment strategies and potentially better effects of exercise treatment.
Why it is important to do this review
For knee OA and hip OA, the effect of exercise on pain and function has been well documented (Beumer 2016; Fransen 2014; Fransen 2015; Juhl 2014; Uthman 2013), but for hand OA, the effect remains uncertain. Seven reviews have been published to sum up the evidence on non‐pharmacological interventions for hand OA (Bertozzi 2015; Kjeken 2011; Mahendira 2009; Towheed 2005; Valdes 2010; Ye 2011; Zhang 2007). Kjeken 2011 included studies up to May 2010, and review authors conducted a meta‐analysis on the effect of hand splints, but not on the effect of exercise. Ye 2011 included studies up to October 2010 and compared outcomes of rehabilitative interventions. Review authors reported inconclusive results and calculated no overall effect of exercise (Ye 2011). Over the past four years, five randomised controlled trials (RCTs) on the effect of hand OA therapy have been published (Davenport 2012; Dziedzic 2015; Hennig 2015; Østerås 2014; Stukstette 2012). In a recent review (Bertozzi 2015), review authors presented results from meta‐analyses comparing therapeutic exercise versus control but included only one or two studies in the analyses. Hence, systematic evaluation of current research is needed, and review authors should suggest directions for future research on the effectiveness of exercise therapy in people with hand OA.
Objectives
To assess the benefits and harms of exercise compared with other interventions, including placebo or no intervention, in people with hand OA. Main outcomes are hand pain and physical function.
Methods
Criteria for considering studies for this review
Types of studies
We considered for inclusion randomised (parallel‐group or cross‐over, including cluster‐randomised and quasi‐randomised) and controlled clinical trials (CCTs) comparing therapeutic exercise versus non‐exercise, and trials comparing different exercise programmes.
Types of participants
We included studies of people 18 years of age and older with a physician‐confirmed (i.e. radiological or clinical or both) diagnosis of hand OA. We accepted studies including diverse populations only if we could extract data for the hand OA group separately.
Types of interventions
We considered for inclusion interventions assessing the benefits and harms of exercise versus other interventions for hand pain and function in people with hand OA. We defined exercise therapy as interventions targeting muscle strength, joint mobility, joint stability training or a combination of these. We excluded studies investigating postoperative exercise. However, we considered for inclusion studies that also applied other treatment modalities (e.g. patient education, self‐management strategies) if treatment, except for exercise therapy, was similar across intervention and control groups.
Specific comparisons to be made
We searched for trials that included one of the following group comparisons.
-
Exercise versus no exercise (e.g. usual care, wait control).
-
Exercise versus placebo (sham exercise).
-
Exercise versus other interventions.
-
Comparison of different exercise programmes.
We considered an attention control intervention provided to minimise the difference in placebo effect between the two groups a comparator intervention (other intervention). Such interventions could include patient education, use of assistive technology, functional activity training, hand cream, orthoses or any combination of two or more of these interventions.
Types of outcome measures
Published recommendations for a core set of outcome measures for phase 3 clinical trials in knee, hip and hand OA include physical function and pain and patient global assessment of disease impact, and for studies of one year or longer, joint imaging (Bellamy 1997; Maheu 2006). Recently, the Outcome Measures in Rheumatology (OMERACT) Hand OA Working Group published preliminary core sets for clinical trials of symptom and structure modification and for observational studies in hand OA (Kloppenburg 2015).
Major outcomes
The main outcomes for benefit were hand pain and hand function, in addition to radiographic joint structure changes, quality of life and finger joint stiffness, according to proposed outcomes for OA intervention reviews recommended by the Cochrane Musculoskeletal Group (CMSG). When available, we included information on the numbers of intervention‐related adverse events (i.e. sustained joint inflammation or increased pain) and the numbers of participants withdrawn from studies because of adverse events.
Listed are the seven main outcomes included in the 'Summary of findings' tables.
-
Hand pain: When more than one measure of pain was reported in a study, we chose the highest in the hierarchy of outcome measures.
-
Pain overall (e.g. visual analogue scale (VAS), numerical rating scale (NRS)).
-
Pain on hand usage.
-
Australian/Canadian Hand Osteoarthritis Index (AUSCAN) pain subscale.
-
Other algofunctional scale validated for use in hand OA.
-
Patient’s global assessment.
-
Physician’s global assessment.
-
-
Hand function: When more than one measure of physical function was reported in a study, we chose the highest in the hierarchy of outcome measures.
-
AUSCAN physical function subscale.
-
Other algofunctional scale validated for use in hand OA.
-
Hand function measured by performance‐based tests (e.g. grip strength, pinch strength).
-
Global disability score.
-
-
Radiographic joint structure changes.
-
Quality of life.
-
Finger joint stiffness.
-
Adverse events.
-
Withdrawals due to adverse events.
Minor outcomes
Minor outcomes included the following.
-
Fulfilment of Osteoarthritis Research Society International/Outcome Measures/Outcome Measures in Rheumatology (OARSI/OMERACT) responder criteria (Pham 2004).
-
Joint mobility.
-
Psychological well‐being.
-
Aesthetic damage.
-
Need for surgery.
Timing of outcome assessment
The main time point of interest was the first assessment after completion of the exercise programme. When data for longer‐term follow‐up were available, we extracted such data and categorised them by short‐term (< 6 months), medium‐term (six to 12 months) and long‐term (> 12 months) follow‐up.
Search methods for identification of studies
Electronic searches
We carried out a search of seven electronic databases for studies published from inception until the search date (last search September 2015): the Cochrane Central Register of Controlled Trials (CENTRAL; published in the Cochrane Library), MEDLINE, Embase, the Cumulative Index to Nursing and Allied Health Literature (CINAHL), the Allied and Complementary Medicine Database (AMED), the Physiotherapy Evidence Database (PEDro) and Occupational Therapy Systematic Evaluation of Evidence (OTseeker). We provided the search strategies in Appendix 1 (MEDLINE), Appendix 2 (Embase), Appendix 3 (CINAHL), Appendix 4 (AMED), Appendix 5 (PEDro), Appendix 6 (OTseeker) and Appendix 7 (CENTRAL). We developed these search strategies with the help of our local librarian and the CMSG Trials Search Co‐ordinator, and we applied no language restrictions.
Searching other resources
We screened the reference lists of all included full‐text articles. We performed searches for unpublished complete studies and ongoing studies using the International Clinical Trials Registry Platform of the World Health Organization (WHO) (http://www.who.int/ictrp/en/) and the following randomised controlled trials registers.
-
ClinicalTrials.gov (www.clinicaltrials.gov).
-
International Standard Randomised Controlled Trial Number Register (http://www.controlled‐trials.com/isrctn/).
-
Current Controlled Trials (www.controlled‐trials.com).
-
Australian New Zealand Clinical Trials Registry (www.actr.org.au).
-
University hospital Medical Information Network (UMIN) Clinical Trials Registry (www.umin.ac.jp/ctr).
We reviewed unpublished and grey literature using the database OpenSIGLE (System for Information on Grey Literature in Europe). Further, we searched congress proceedings from OARSI, EULAR and the ACR from 2008 until September 2015. We present a flow diagram for search results and selection of studies in Figure 1.
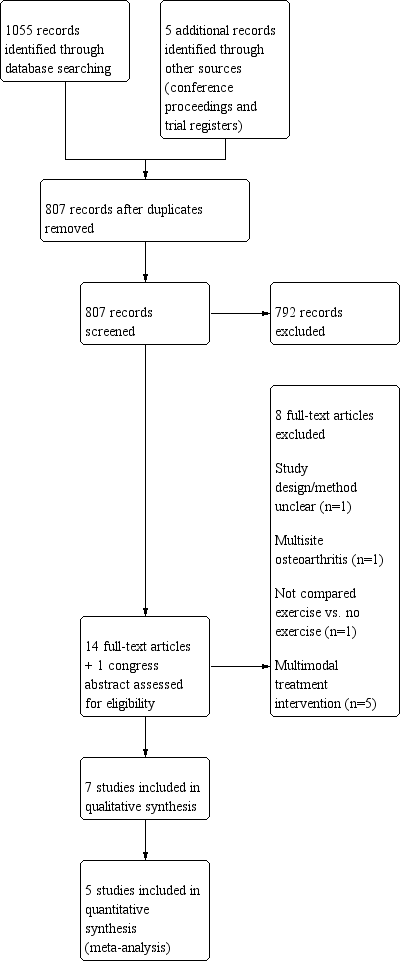
Study flow diagram.
Data collection and analysis
Selection of studies
The first review author (NØ) and one of the co‐review authors (GS) independently screened the records retrieved and conducted the risk of bias assessment. GS extracted data from all included studies. If agreement was not achieved at any stage, a third review author (IK or KBH) adjudicated.
The process of selecting studies included the following steps.
-
Merging search results using reference management software, and removing duplicate records.
-
Examining titles and abstracts to remove obviously irrelevant reports.
-
Retrieving the full text of potentially relevant reports.
-
Linking together multiple reports of the same study and identifying more than one study reported in the same article.
-
Examining full‐text reports against eligibility criteria.
-
Corresponding with investigators, when appropriate, to clarify study eligibility or other missing information.
-
Making final decisions on study inclusion.
Data extraction and management
We extracted the following data from all reports directly onto data collection forms.
-
Methods: study design, total study duration, recruitment method, random sequence generation, allocation sequence concealment, blinding, incomplete outcome data, selective reporting, other concerns about bias.
-
Participants: total number of participants, setting, diagnostic criteria, age, sex, country, comorbidity, inclusion and exclusion criteria.
-
Interventions: aims of the intervention, total numbers and types of intervention groups (i.e. placebo, control, comparative intervention), specific intervention, intervention details sufficient for replication, number of therapists providing study treatments, delivery mode (i.e. individual, group‐based, home programme), frequency (i.e. sessions per week), treatment content (i.e. muscle strength, joint mobility, joint stability), intensity (i.e. low, moderate, high), duration (i.e. total weeks of treatment), number of directly supervised contact occasions, number of follow‐up contacts (i.e. face‐to‐face; telephone, email or text messages).
-
Outcomes: outcome measures, time points.
-
Results: number of participants allocated to each intervention group, sample size, missing data or participants, summary data.
-
Miscellaneous: funding source, key conclusions, miscellaneous comments from study authors, miscellaneous comments from review authors.
Assessment of risk of bias in included studies
The first review author (NØ) and one of the co‐review authors (GS) independently assessed risk of bias, except for one study (Østerås 2014), which was assessed by two other co‐review authors (GS, TU). We assessed risk of bias of included studies by using the procedures recommended by Cochrane and described in Chapter 8 of the Cochrane Handbook for Systematic Reviews of Interventions (Higgins 2011). We assessed the following methodological domains.
-
Random sequence generation (selection bias).
-
Allocation concealment (selection bias).
-
Blinding of participants and personnel (performance bias).
-
Blinding of outcome assessment (detection bias): subjective outcomes.
-
Blinding of outcome assessment (detection bias): objective outcomes.
-
Incomplete outcome data (attrition bias).
-
Selective reporting (reporting bias).
-
Other potential threats to validity (e.g. substantial imbalance in participant characteristics at baseline that is strongly related to outcome measures, blocked randomisation in unblinded trials, contamination).
We explicitly judged each of these criteria as presenting 'low risk', 'high risk’ or 'unclear risk' of bias.
Measures of treatment effect
Dichotomous data
We calculated the risk ratio (RR) and the 95% confidence interval (CI) for dichotomous outcomes.
Continuous data
We calculated the standardised mean difference (SMD) with 95% CI, as these studies used different scales to evaluate continuous outcomes. The SMD expresses the size of the intervention effect in each study relative to the variability observed in that study. We calculated SMDs by dividing the mean difference (MD) by the standard deviation (SD) of outcomes among participants. We interpreted the SMD as described by Cohen (i.e. SMD of 0.2 was considered to indicate a small beneficial effect, 0.5 a medium effect and 0.8 a large effect of exercise therapy) (Cohen 1988). We analysed longer ordinal scales (i.e. 10 point NRSs) in meta‐analyses as continuous data.
Unit of analysis issues
Cross‐over studies
We considered cross‐over studies for inclusion only when outcome data from the first period were available or could be provided by the study authors upon request.
Studies with multiple treatment groups
When studies had multiple treatment groups, we contacted the investigators by email to ask for data or separate scores for relevant treatment groups to create a single pair‐wise comparison.
Dealing with missing data
We contacted investigators by email to request publications, missing outcomes or summary data. If we did not receive a response, we sent one email reminder.
Assessment of heterogeneity
We assessed heterogeneity by using Cochran Q to test the hypothesis that all studies measured the same effects. We assessed the magnitude of heterogeneity using the I2 statistic. We used the following thresholds for interpretation of I2(Higgins 2011).
-
0% to 40%: might not be important.
-
30% to 60%: may represent moderate heterogeneity.
-
50% to 90%: may represent substantial heterogeneity.
-
75% to 100%: shows considerable heterogeneity.
The importance of the observed value of I2 depended on both magnitude and direction of effects and strength of evidence for heterogeneity (e.g. P value from the Chi2 test, confidence interval for I2).
Assessment of reporting biases
To reduce the possibility of publication bias, we searched multiple sources for studies that met review eligibility criteria, including ‘grey’ literature.
Data synthesis
We assumed that results of included studies reflected a distribution of effect sizes rather than a fixed effect size; we therefore employed a random‐effects model to pool outcomes from a sufficiently homogeneous set of studies in meta‐analyses.
Subgroup analysis and investigation of heterogeneity
We did not perform planned subgroup analyses on age, gender, joint involvement, presence of erosive OA, exercise programme or exercise dosage, as we identified only a small number of studies. We evaluated the influence of using end of treatment scores versus change scores in investigating heterogeneity.
Sensitivity analysis
Owing to the small number of studies, we did not perform originally planned sensitivity analyses on inclusion/exclusion decisions, methodological quality, adequacy of the randomisation process or use of the intention‐to‐treat principle.
'Summary of findings' table
We used the GRADE approach, as described in Chapter 12 of the Cochrane Handbook for Systematic Reviews of Interventions (Schünemann 2011), to assess the quality of the body of evidence. We produced the 'Summary of findings (SoF)' table by using GRADEpro software. This table provides key information concerning the quality of the evidence and the magnitude of intervention effects on main outcomes.
We created an SoF table for the following comparison: exercise versus no exercise/intervention (e.g. usual care, wait control). The low number of included studies precluded completion of the other planned comparisons (exercise vs placebo, exercise vs other interventions, comparisons of different exercise programmes).
Outcomes (in order of importance) reported in the SOF table include the following.
-
Hand pain.
-
Hand function.
-
Radiographic joint structure changes.
-
Quality of life.
-
Finger joint stiffness.
-
Number of participants experiencing any adverse event.
-
Number of participants who withdrew because of an adverse event.
In addition to the absolute and relative magnitude of effect presented in the 'Summary of findings' table, we calculated the number needed to treat for an additional beneficial outcome (NNTB) from the control group event rate (unless the population event rate was known) and the risk ratio using the Visual RxNNT calculator (Cates 2013). For continuous outcomes, we calculated the NNTB by using Wells calculator software, provided by the CMSG editorial office. We determined the minimal important change (MIC) for each outcome for input into the calculator.
Results
Description of studies
Results of the search
The literature search yielded 1055 citations ‐ 802 after duplicates were removed. We identified five additional citations by handsearching congress proceedings and trial registers (Figure 1). We excluded 792 of 807 citations upon completion of abstract screening. Of 14 full texts and one congress abstract, seven met the inclusion criteria (Davenport 2012; Dziedzic 2015; Hennig 2015; Lefler 2004; Nery 2015; Østerås 2014; Rogers 2009). We excluded eight full‐text reports owing to unclear study design (one study), no comparison of exercise versus no exercise (one study), comorbidity/multi‐site OA (one study) and multi‐modal treatment (no investigation of effects of only exercise) (five studies). A handsearch of reference lists in the full‐text reports yielded no additional citations. We requested additional information from five trial authors and received responses from four of them. We performed the last literature search updates in September 2015. We did not examine funnel plots to determine possible publication bias, as the number of studies was insufficient (i.e. fewer than 10).
Included studies
We provide a full description of the seven included studies in the Characteristics of included studies table. An overview of the studies, a detailed description of the exercise interventions and details on outcomes measured can be found in the Additional tables (Table 1; Table 2; Table 3).
| Study | Country | No | Trial type | Setting | Follow‐up | Gender | Age | Sympt | Diagn |
| UK | 39 | Pilot RCT | Hand centre | 3, 6 months | 82% female | 60 | |||
| UK | 130 | RCT | Primary care/Research clinic | 3, 6, 12 months | 66% female | 66 | 5 | ||
| Norway | 80 | RCT | Outpatient secondary care | 3 months | 100% female | 61 | 10 | 2 | |
| US | 19 | RCT | Elderly living community | 6 weeks | 90% female | 81 | |||
| Brazil | 60 | RCT | 6, 12 weeks | Both genders | |||||
| US | 76 | Cross‐over | Florida community | 16, 32, 48 weeks | 85% female | 75 | |||
| Norway | 130 | RCT | Primary/Secondary care | 3, 6 months | 90% female | 66 | 12 |
Age: mean age of participants; Diagn: mean number of years since hand OA was diagnosed; No: number of participants randomly assigned; Sympt: mean number of years with hand OA symptoms.
| Study, country | Intervention | Comparison | Outcome measures |
| UK | Mode: home based, but all were seen at weeks 1, 3 and 7 for exercise review Aim: specific CMC joint exercises to reduce pain and to increase grip strength and range of motion Exercises (3): specific CMC joint exercises including passive extension, active extension and active abduction (abductor pollicis longus) against resistance + pinching/turning/twisting activities Dose: 3‐4 times a day, 10 seconds hold, 3‐10 reps, 3 levels for progression Duration: 6 months Personnel: 1 physiotherapist Number of sessions: > 600 Supervised sessions/review: 3 Adherence: not reported | Mode: home based, but all were seen at weeks 1, 3 and 7 for exercise review Aim: general exercise regimen for CMC Exercises (3): general exercises including passive extension, thumb to fingertip (slide and press), squeeze a peg between thumb and fingers, squeeze a sponge in the hand + pinching/turning/twisting activities Dose: 3‐4 times a day, 10 seconds hold, 3‐10 reps, 3 levels for progression Duration: 6 months Personel: 1 physiotherapist | + Disabilities of the Arm, Shoulder and Hand (DASH) Questionnaire + pinch strength + pain at rest and during pinch (VAS) + abductor pollicis longus (APL) moment |
| UK | Mode: hand exercises in 4 group sessions (1‐1.5 hours) first 4 weeks, the rest home based Aim: to improve strength and dexterity. Included stretching and strengthening hand and thumb exercises Exercises (10): stretching (wrist flexion + extension/pronation + supination, tendon gliding, radial finger walking, make "O" sign, thumb‐5th finger opposition, thumb extension/abduction) and strengthening exercises (elastic band/Play‐Doh providing resistance against thumb/finger abduction/extension, squeeze Play‐Doh, pinch off pieces of Play‐Doh, external weight during wrist movements) Dose: 3 reps initially, increasing up to 10 reps, daily (or most days); performed within limit of discomfort Duration: 12 months Personnel: 9 occupational therapists Number of sessions: 365 Supervised sessions/review: 4 Adherence: 78% reported to exercise ≥ 2×/wk at 6‐month follow‐up | No treatment provided, only written information on self‐management approaches for hand OA that was given to both groups | + OARSI/OMERACT responder criteria + hand pain (NRS) + pain, stiffness and function (AUSCAN) + grip strength (Jamar) + pinch strength (B & L pinch gauge) + grip ability test (GAT) + health‐related QoL (SF‐12) |
| Norway | Mode: home‐based hand exercises. Up to 8 telephone calls by an occupational therapist to facilitate adherence and to provide advice on exercise dosage Aim: maximise stable and pain‐free functional finger joint ROM, increase grip strength, maintain joint stability, prevent/delay development of fixed deformities Exercises (5): make "O" sign, roll into small + large fist, rubber ball squeeze, thumb abduction/extension against elastic band, finger stretch Dose: 3 times a week, 10 reps weeks 1‐2, 12 reps weeks 3‐4, 15 reps weeks 5‐13 Duration: 3 months (13 weeks) Personnel: 2 occupational therapists. Number of sessions: 39 Supervised sessions/review: 1 (but up to 8 phone calls from an occupational therapist) Adherence: median (min‐max) number of recorded sessions was 37 (26‐43) | No treatment provided, only leaflet with information about hand OA, ergonomic principles and advice | + Patient Specific Functional Scale (PSFS) + Functional Index for Hand OsteoArthritis (FIHOA) + hand pain, stiffness, function, fatigue, and patient global assessment of disease activity (NRS) + number of painful joints + grip strength (Jamar) + flexion deficit and thumb opposition + thumb web space (12 cylinders, diameter 1‐12 cm) + finger dexterity (Moberg Pick‐up Test) + OARSI/OMERACT responder criteria |
| US | Mode: supervised Aim: to improve grip strength, pinch strength, joint stability, finger range of motion and joint pain Exercises: isometric resistance for muscle groups in hand and forearm, rice grabs, pinch grip lifting and wrist rolls Dose: 3 times a week. Isometric resistance training 1‐10 reps, 6 seconds hold at low intensity (40%‐60% of 1 RM) 3 times a week. Isotonic resistance training at 40% of 1 RM in 10‐15 reps, progressed to moderate intensity (more than 60% of 1 RM) in 6‐8 reps. Performed below a 1.5 point increase in pain on a 6 point scale (no discomfort‐extreme discomfort) Duration: 6 weeks Personnel: not reported Number of sessions: 18 Supervised sessions/review: 18 Adherence: 67% completed 16‐18 sessions (3 participants missing > 2 sessions were excluded in analyses) | No treatment provided | + pain (6 point scale) + finger range of motion (goniometer) + grip strength (Jamar) + pinch strength (Jamar pinch gauge) |
| Brazil | A session on joint protection and energy conservation for hands was provided before randomisation. Mode: not reported Aim: to target pain, function and strength in hand OA Exercises: not reported Dose: 2 times a week, no more information Duration: 12 weeks Personnel: not reported Number of sessions: 24 Supervised sessions/review: not reported Adherence: not reported | A session on joint protection and energy conservation for hands was provided before randomisation. No treatment provided | + pain (NRS/VAS) + pain, stiffness, function (AUSCAN) + hand function (Cochin Hand Functional Scale) + grip and pinch strength (hydraulic hand and pinch gauge dynamometer) + satisfaction with treatment |
| US | Aim: to improve joint flexibility + grip and pinch strength Exercises (9): flexibility (6): flexion of 2‐5 MCP joints, small fist, large fist, Okay signs, finger spread, thumb reach. Strength (3): squeeze Thera‐Band Hand Exerciser ball until 50% depressed: in palm, key pinch and thumb‐index fingertip pinch Dose: daily Duration: 16 weeks Personnel: principal investigator Number of sessions: 112 Supervised sessions/review: 1 Adherence: not reported | Instructed to apply hand cream once per day using a gentle, non‐vigorous technique | + pain, stiffness, function (AUSCAN) + grip strength (Jamar) + key pinch strength (Jamar pinch dynamometer) + hand dexterity (Purdue Pegboard Model 32020) |
| Norway | Mode: 4 group sessions + 32 home‐based sessions of hand and upper arm exercises. Weekly telephone call by a project group member in weeks with no group session to facilitate adherence and provide advice on exercise dosage Aim: to improve grip strength and thumb stability, to maintain finger range of motion Exercises (8): shoulder extension and biceps curl in sitting position with elastic band, shoulder flexion in standing with elastic band, make "O"sign, roll into small + large fist, rubber tube squeeze (10 sec hold), thumb abduction/extension against elastic band, finger stretch Dose: 3 times a week, 10 reps weeks 1‐2, 15 reps weeks 3‐12, instructed to apply moderate to vigorous intensity Duration: 3 months (12 weeks) Personnel: 2 occupational therapists. Number of sessions: 36 Supervised sessions/review: 4 Adherence: 47% recorded 35‐36 sessions and 94% recorded ≥ 22 sessions. | No treatment provided | + Functional Index for Hand OsteoArthritis (FIHOA) + Patient Specific Functional Scale (PSFS) + hand pain, stiffness, function, fatigue, and patient global assessment of disease activity (NRS) + grip strength (Jamar) + thumb web space (12 cylinders, diameter 1‐12 cm) + finger dexterity (Moberg Pick‐up Test) + OARSI/OMERACT responder criteria |
APL: abductor pollicis longus.
AUSCAN: Australian/Canadian Hand Osteoarthritis Index.
CMC: carpometacarpal.
DASH: Disabilities of the Arm, Shoulder and Hand Questionnaire
FIHOA: Functional Index for Hand OsteoArthritis.
GAT: Grip Ability Test.
NRS: numeric rating scale.
OA: osteoarthritis.
OARSI/OMERACT: Osteoarthritis Research Society International/Outcome Measures/Outcome Measures in Rheumatology
PSFS: Patient Specific Functional Scale.
RM: repetition maximum.
SF‐12: The 12‐Item Short Form Health Survey
VAS: visual analogue scale
| Study | Primary outcome measure | NRS/VAS pain | AUSCAN pain/ function/stiffness | FIHOA function | NRS function | SF‐12 | NRS stiffness | Reported on adverse events | Grip strength | Pinch strength | OARSI/OMERACT responder criteria |
| DASH | √ | √ | |||||||||
| OMERACT/OARSI responder criteria | √ | √ | √ | √ | √ | √ | √ | ||||
| PSFS | √ | √ | √ | √ | √ | √ | √ | ||||
| ? | √ (6 categories) | √ | √ | ||||||||
| ? | √ | √ | √ | √ | |||||||
| AUSCAN Function | √ | √ | √ | √ | |||||||
| PSFS + FIHOA | √ | √ | √ | √ | √ | √ | √ |
AUSCAN: Australian/Canadian Hand Osteoarthritis Index.
DASH: Disabilities of the Arm, Shoulder and Hand Questionnaire
FIHOA: Functional Index for Hand OsteoArthritis.
NRS: numeric rating scale.
OARSI/OMERACT: Osteoarthritis Research Society International/Outcome Measures/Outcome Measures in Rheumatology
PSFS: Patient Specific Functional Scale.
SF‐12: The 12‐Item Short Form Health Survey
VAS: visual analogue scale
Design
All of the seven included studies were randomised controlled trials (RCTs), but one was characterised as a "pilot RCT" (Davenport 2012). Five studies used a parallel‐group design, one a 2 × 2 factorial design and one a cross‐over design. For the 2 × 2 study with multiple treatment groups (Dziedzic 2015), we received a data set and extracted data from only two arms ‐ the control group ('leaflet and advice') and the 'exercise only' group ‐ to perform a single pair‐wise comparison for this review. All studies were published in English.
Participants
Two studies were conducted in the United Kingdom, two in Norway, two in the USA and one in Brazil. The seven studies included in total 534 participants. The median sample size was 70, but sample size varied from 19 to 130 participants. Most participants were female (median 90% female), and one study included only female participants (Hennig 2015). The mean age of participants was between 60 and 66 years in five studies, but in two studies, the mean age was 75 (Rogers 2009) and 81 (Lefler 2004). The sample recruitment setting varied widely, with some studies recruiting from an elderly living community (Lefler 2004; Rogers 2009); other studies were population based (Dziedzic 2015; Østerås 2014), used an OA cohort (Østerås 2014; Rogers 2009) and recruited from people referred for specialist care (Davenport 2012; Hennig 2015). Half of these studies reported years with a hand problem (Dziedzic 2015: 5; Hennig 2015: 10) or years with an OA diagnosis (Hennig 2015: 2; Østerås 2014: 12).
Inclusion and exclusion criteria for each study shared some features, whereas others were different between studies. One study focused only on people with carpometacarpal (CMC1) joint OA (Davenport 2012). The other six included participants with a confirmed clinical diagnosis of hand OA, fulfilment of ACR criteria for features of hand OA and/or unilateral/bilateral CMC1 OA. Participants were referred by doctors for specialist care (Davenport 2012; Hennig 2015) and/or were required to report a minimum level of pain or functional impairment. All studies excluded participants with inflammatory rheumatic disease (i.e. rheumatoid arthritis). Some excluded participants who had undergone hand surgery in the previous two to six months (Dziedzic 2015; Hennig 2015; Østerås 2014; Rogers 2009), had received steroid injections (Dziedzic 2015; Hennig 2015; Nery 2015; Østerås 2014; Rogers 2009) or had performed hand exercises (Lefler 2004; Nery 2015; Rogers 2009).
Interventions
We provide an overview of exercise interventions and comparisons in Table 2. One of the seven studies evaluated the effects of two different exercise programmes for CMC1 OA (Davenport 2012), whereas the remaining six studies evaluated hand exercise versus no exercise (control intervention). The aims of the exercise interventions were relatively consistent among studies ‐ to reduce pain, increase grip and pinch strength, increase dexterity, maintain joint stability and increase or maintain range of motion. The number of exercises in each programme varied from three to ten. Davenport 2012 included three exercises: passive extension, active extension and active thumb abduction progressed into turning and twisting activities. Dziedzic 2015 included five stretching exercises (wrist flexion + extension/pronation + supination, tendon gliding, radial finger walking, "O‐sign", thumb extension/abduction + opposition to the base of the fifth finger) and five strengthening exercises (elastic band, Play‐Doh and external weight for thumb extension and abduction, finger extension, squeezing and pinching, wrist flexion/extension). Hennig 2015 and Østerås 2014 described almost identical exercise programmes ("O‐sign", roll into small + large fist, isometric squeeze, thumb abduction/extension against elastic band, finger stretch), but participants in Østerås 2014 squeezed a tube instead of a ball and performed three additional exercises for shoulder girdle/upper arm. The exercise programme in Lefler 2004 included isometric and isotonic resistance training of the hand and forearm muscles (rice grabs, pinch grip lifting, wrist rolls). Rogers 2009 included six flexibility exercises (metacarpophalangeal joint (MCP) flexion, small fist, large fist, Okay‐sign, finger spread, thumb opposition) and three strengthening exercises that involved squeezing a Thera‐Band Hand Exerciser ball (palm grip, key pinch, fingertip pinch).
Study authors described variation in delivery of the exercise intervention: One study reported supervision of all 18 sessions (Lefler 2004), whereas three studies provided a combination of three to four supervised group sessions (Dziedzic 2015; Østerås 2014) and individual exercise reviews (Davenport 2012), and two studies included no supervised sessions but reported that participants received up to eight regular phone calls from an occupational therapist (Hennig 2015) and monthly phone calls or emails from the principal investigator (Rogers 2009). Østerås 2014 also provided phone calls. Hence, the number of supervised sessions ranged from one to 18. Studies reported large variation in how often participants were instructed to exercise ‐ three to four times daily (Davenport 2012), daily (or on most days) (Dziedzic 2015; Rogers 2009) and two times a week (Nery 2015) to three times a week (Hennig 2015; Østerås 2014). The number of repetitions ranged from three to 15 and the number of series from one to three. Most studies emphasised that the programme should be progressed. Dziedzic 2015 instructed participants to perform exercises within their limit of discomfort, whereas in Lefler 2004, participants started at 40% to 60% of 1 repetition maximum (RM) and progressed to moderate intensity (> 60% of 1 RM), and Østerås 2014 instructed participants to apply moderate to vigorous intensity. For determination of exercise dosage, Hennig 2015 and Østerås 2014 referred to recommendations of the American College of Sports Medicine for developing strength and flexibility (ACSM 1998). In one study, the duration of the exercise intervention was six weeks (Lefler 2004), but in three studies, duration was 12 to 13 weeks (Hennig 2015; Nery 2015; Østerås 2014), in one study 16 weeks (Rogers 2009) and in the last two studies six months and 12 months (Davenport 2012; Dziedzic 2015), respectively. Four studies reported on adherence to the exercise programme. In Lefler 2004, 67% completed 16 or more of 18 sessions, and in Dziedzic 2015, 78% reported that they performed the exercise programme two or more times a week at six months. In Hennig 2015, the median number of recorded sessions in the exercise diary was 37 (of 39), and in Østerås 2014, 94% recorded two or more sessions a week.
Outcomes
The included studies chose somewhat different outcomes as their primary outcome ‐ Australian/Canadian Hand Osteoarthritis Index (AUSCAN) function subscale, Disabilities of the Arm, Shoulder and Hand (DASH) Questionnaire, OARSI/OMERACT responder criteria, Patient Specific Functional Scale (PSFS) and Functional Index for Hand OsteoArthritis (FIHOA). All but one study (Rogers 2009) included a global measure of hand pain (VAS or NRS; Lefler 2004: six pain categories). Three studies also used the AUSCAN to measure pain (Dziedzic 2015; Nery 2015; Rogers 2009). Two studies (Dziedzic 2015; Nery 2015) measured hand function and finger joint stiffness using AUSCAN, and two other studies (Hennig 2015; Østerås 2014) used FIHOA and PSFS to measure hand function, and NRS to measure finger joint stiffness. Only one study measured quality of life using Short Form (SF)‐12 (Dziedzic 2015). Only three studies (Dziedzic 2015; Hennig 2015; Østerås 2014) reported adverse events. All but one study (Davenport 2012) measured grip strength, and four (Davenport 2012; Dziedzic 2015; Lefler 2004; Nery 2015) measured pinch strength. Three studies (Dziedzic 2015; Hennig 2015; Østerås 2014) reported the numbers of participants fulfilling OARSI/OMERACT responder criteria.
For hand pain, all studies reported an immediate post‐treatment/short‐term outcome assessment, which was performed at three months (after baseline assessment), except Lefler 2004, which performed the assessment at six weeks. Only four studies (Dziedzic 2015; Hennig 2015; Nery 2015; Østerås 2014) reported on hand function and finger joint stiffness at immediate post‐treatment/short‐term outcome assessment. One study (Dziedzic 2015) assessed quality of life at three, six and 12 months. Two studies (Dziedzic 2015; Østerås 2014) performed medium‐term and long‐term sustainability assessments of pain and function at six months, and one (Dziedzic 2015) at 12 months.
Adverse events
Only three studies (Dziedzic 2015; Hennig 2015; Østerås 2014) specifically reported on adverse events. Dziedzic 2015 reported that no adverse events occurred as a result of the intervention. Hennig 2015 reported that one participant in the intervention group withdrew as the result of high and sustained pain. In Østerås 2014, participants in the exercise group reported four events that were possibly related to the exercise programme. One experienced increased pain and inflammation in one finger, two experienced increased pain and swelling in all fingers and one withdrew owing to sustained increased neck/shoulder pain related to shoulder exercises.
Excluded studies
We excluded eight studies for reasons provided in the study flow diagram (Figure 1) and in the Characteristics of excluded studies tables (Boustedt 2009; Garfinkel 1994; Masterson 2010; Norton 1997; Stamm 2002; Stukstette 2013; Villafane 2013; Wajon 2005).
Risk of bias in included studies
We provided results of the 'Risk of bias' assessment along with comments in the Characteristics of included studies tables. Figure 2 and Figure 3 present an overview of the assessment per risk of bias item and per study, respectively. The most recent study (Nery 2015) was published only as a congress abstract and provided insufficient information on the methods applied for assessment of all risk of bias items.
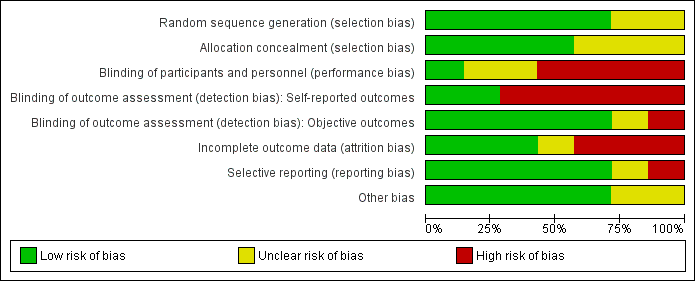
Risk of bias graph: review authors' judgements about each risk of bias item presented as percentages across all included studies.
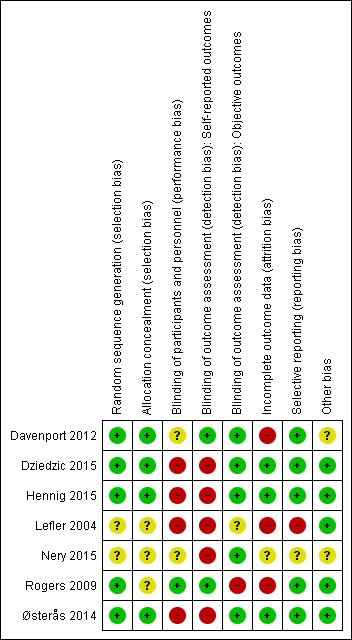
Risk of bias summary: review authors' judgements about each risk of bias item for each included study.
Allocation
We considered that four studies (Davenport 2012; Dziedzic 2015; Hennig 2015; Østerås 2014) described adequate generation of a randomised sequence and adequate allocation concealment procedures. Three studies did not describe their methods adequately, and we were unable to contact trial authors for two of them (Lefler 2004; Rogers 2009).
Blinding
Authors of two studies reported that participants, but not care personnel, were blinded to treatment allocation, as participants were told that investigators were comparing different exercise regimens for the CMC1 joint (Davenport 2012) or two different interventions (Rogers 2009). The other five studies compared exercise versus no exercise, which makes blinding of participants and care personnel impossible. In Rogers 2009, the outcome assessor was not blinded; Lefler 2004 did not report whether the outcome assessor was blinded to group allocation. For all other studies, this was clearly stated. However, as most outcomes evaluated in this review (pain, function, stiffness, quality of life, adverse events) were participant self‐reported, vulnerability to detection bias may be present.
Incomplete outcome data
Only half of the studies reported minimal loss to follow‐up and use of intention‐to‐treat (ITT) analyses (Dziedzic 2015; Hennig 2015; Østerås 2014). Three studies (Davenport 2012; Lefler 2004; Rogers 2009) had a relatively large drop‐out rate before follow‐up, and we had insufficient information about one study (Nery 2015).
Selective reporting
We confirmed study registration with prespecified (primary and secondary) outcomes for six studies, but one of these (Nery 2015) was registered after the study was initiated. The study with no registration (Lefler 2004) was published before study registration was required. We judged risk of bias for selective reporting as 'uncertain' for Nery 2015 and 'high' for Lefler 2004.
Other potential sources of bias
Davenport 2012 performed baseline assessments after randomisation, and the congress abstract by Nery 2015 included very limited information about the study. Therefore, we judged risk of bias as 'uncertain' for these two studies. For the remaining four studies, we judged risk of bias as 'low' because we identified no other potential threats to validity.
Effects of interventions
summary of findings Table for the main comparison presents immediate post‐treatment/short‐term effects of exercise compared with no exercise in people with hand OA. We attempted to contact six study authors (Davenport 2012; Dziedzic 2015; Hennig 2015; Lefler 2004; Nery 2015; Rogers 2009) to obtain additional data and details of methods. Four study authors (Davenport 2012; Dziedzic 2015; Hennig 2015; Nery 2015) responded, and two of them provided original (non‐imputed) data for extraction of post‐treatment scores (Hennig 2015) and isolated treatment arm scores (Dziedzic 2015). We requested but did not receive additional descriptions of methods from the investigators in one study (Nery 2015) because their study results had not yet been published and were available only as a congress abstract.
Comparison 1. Exercise versus no exercise
Major outcomes
Immediate post‐treatment/short‐term effects
Hand pain
Five studies assessed pain and provided post‐treatment/short‐term data on 381 participants (Figure 4Analysis 1.1). Pooled results of these five studies showed a beneficial effect of exercise on hand pain (SMD (random‐effects model) ‐0.27, 95% CI ‐0.47 to ‐0.07). This effect size would be considered a small beneficial effect (Cohen 1988). Between‐study heterogeneity was negligible (I2 = 0%). The demonstrated effect size for exercise was equivalent to pain reduction of 0.5 points (95% CI 0.1 to 0.9) on a 0 to 10 scale compared with control, or an absolute reduction in pain of 5% (1% to 9%) and a relative reduction of 13% (3% to 22%).
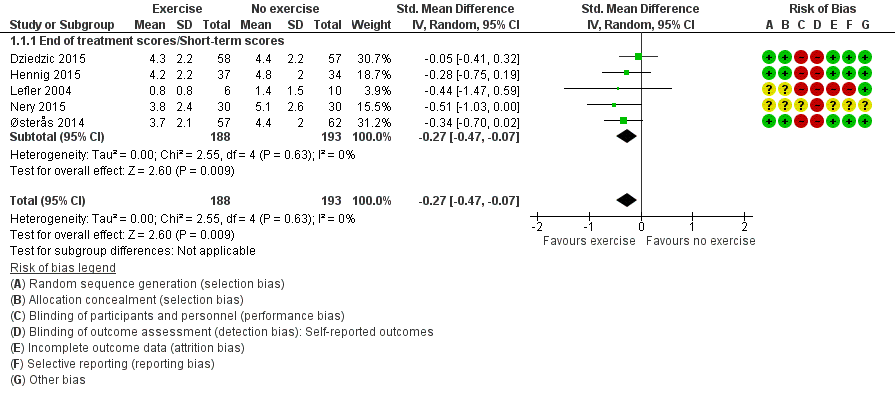
Forest plot of comparison: 1 Exercise versus no exercise, outcome: 1.1 Hand pain (short term).
Hand function
Four studies evaluated participant‐reported hand function and provided post‐treatment/short‐term data on 369 participants (Figure 5Analysis 1.2). Pooled results obtained when a random‐effects model was applied demonstrated a beneficial effect of exercise on function (SMD ‐0.28, 95% CI ‐0.58 to 0.02). The demonstrated effect size for exercise was equivalent to improvement in function of 2.2 points (95% CI ‐0.2 to 4.6) on a 0 to 36 scale compared with control, or an absolute reduction in pain of 6% (0.4% to 13%) and a relative reduction of 15% (1% to 32%).
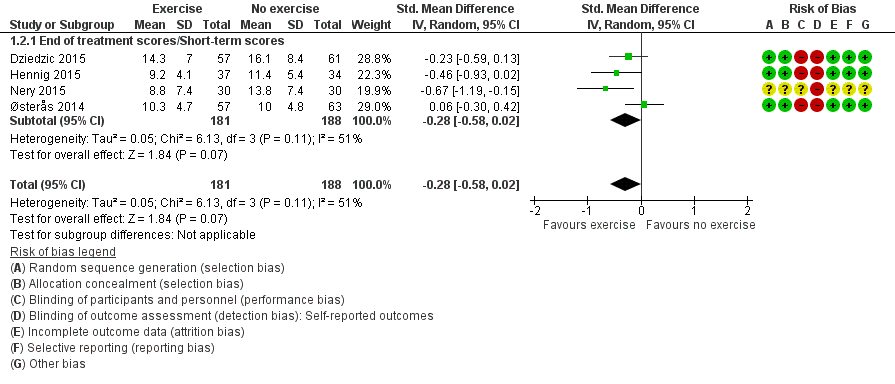
Forest plot of comparison: 1 Exercise versus no exercise, outcome: 1.2 Hand function (short term).
We considered between‐study heterogeneity to be moderate to substantial (I2 = 51%). We explored reasons for this heterogeneity and found that exclusion of data from Østerås 2014 reduced heterogeneity to a negligible level (I2 = 0%). Close inspection of scores revealed that the mean pain level at baseline was slightly higher for the exercise group than for the control group, and that the mean pain level was slightly reduced in the exercise group and was increased in the control group post treatment. Inclusion of change scores instead of post‐treatment scores from Østerås 2014 resulted in negligible heterogeneity (I2 = 5%) and demonstrated a beneficial effect of exercise on function (SMD ‐0.32, 95% CI ‐0.53 to ‐0.10).
Quality of life
One study assessed quality of life and provided post‐treatment/short‐term data on 113 participants (Analysis 1.3) showing that the effect of exercise on quality of life in people with hand OA is uncertain (MD 0.30, 95% CI ‐3.72 to 4.32). The effect size for exercise was equivalent to improvement in quality of life of 0.3 points (95% CI ‐0.2 to 4.1) on a 0 to 100 scale, or an absolute improvement of 0.3% (4% worsening to 4% improvement) and a relative improvement of 0.6% (7% worsening to 8% improvement).
Finger joint stiffness
Four studies assessed participant‐reported finger joint stiffness and provided post‐treatment/short‐term data on 368 participants (Figure 6Analysis 1.4). Pooled results of these studies when a random‐effects model was applied showed a beneficial effect of exercise on finger joint stiffness (SMD ‐0.36, 95% CI ‐0.58 to ‐0.15). This effect size would be considered a small to moderate beneficial effect (Cohen 1988). Between‐study heterogeneity was negligible (I2 = 6%). The demonstrated effect size for exercise was equivalent to a stiffness reduction of 0.7 points (95% CI 0.3 to 1.0) on a 0 to 10 scale compared with control, or an absolute reduction in stiffness of 7% (3% to 10%) and a relative reduction of 14% (6% to 23%).
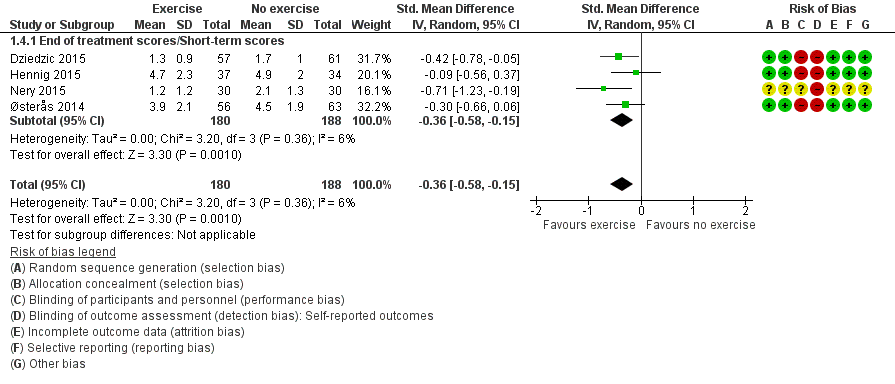
Forest plot of comparison: 1 Exercise versus no exercise, outcome: 1.4 Finger joint stiffness (short term).
Adverse events and withdrawals due to adverse events
Three studies reported on adverse events among 309 participants (Analysis 1.5). Dziedzic 2015 reported no adverse events, Hennig 2015 reported one adverse event in the exercise group and Østerås 2014 reported three adverse events in the exercise group. Reported adverse events were increased hand pain, finger joint inflammation or neck/shoulder pain. Pooled data showed that the likelihood of occurrence of adverse events was higher in the exercise group than in the no exercise group, but the effect was uncertain (RR 4.55, 95% CI 0.53 to 39.31). The absolute risk difference showed 2% more events (95% CI ‐2% to 5%) for the exercise group than for the no exercise group. The relative difference was 355% (95% CI 47% to 3831%) for the exercise group compared with the no exercise group.
Although one study (Dziedzic 2015) reported no adverse events, each of the other studies (Hennig 2015; Østerås 2014) reported one adverse event leading to study withdrawal. Pooled data showed that the likelihood of withdrawal due to adverse events was higher in the exercise group than in the no exercise group, but the effect was uncertain (RR 2.88, 95% CI 0.30 to 27.18; Analysis 1.6). The absolute risk difference showed 1% more events (95% CI ‐2% to 4%) for the exercise group than for the no exercise group. The relative difference was 188% (95% CI 70% to 2618%) for the exercise group compared with the no exercise group.
Sustainability of results at medium‐term and long‐term follow‐up
Two studies (Dziedzic 2015; Østerås 2014) provided six‐month follow‐up data (220 participants), and one of these (Dziedzic 2015; 102 participants) also provided 12‐month follow‐up data. Pooled results of these studies when a random‐effects model was applied showed an uncertain effect on hand pain (SMD 0.09, 95% CI ‐0.18 to 0.35; Analysis 2.1), hand function (SMD ‐0.05, 95% CI ‐0.31 to 0.21; Analysis 2.2) and finger joint stiffness (SMD ‐0.12, 95% CI ‐0.38 to 0.14; Analysis 2.4). This indicates that at six‐month and 12‐month follow‐up, the effect of the exercise intervention was uncertain.
Minor outcomes: immediate post‐treatment/short‐term effects
Grip and pinch strength
Five studies evaluated effects on grip strength among 362 participants and provided post‐treatment/short‐term data (Analysis 1.7). Pooled results when a random‐effects model was applied showed a beneficial effect on grip strength (SMD 0.34, 95% CI ‐0.01 to 0.69) that would be considered small to moderate (Cohen 1988). Between‐study heterogeneity was substantial (I2 = 59%). We explored reasons for this heterogeneity and found that exclusion of data from Østerås 2014 reduced heterogeneity to a moderate level (I2 = 42%).
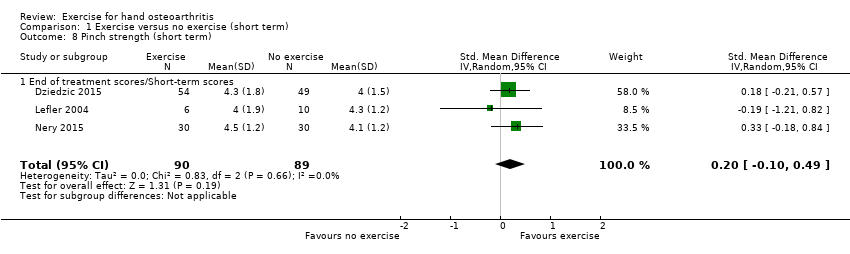
Three studies evaluated effects on pinch strength among 179 participants and provided post‐treatment/short‐term data (Analysis 1.8). Pooled results when a random‐effects model was applied showed a small but uncertain beneficial effect (SMD 0.20, 95% CI ‐0.10 to 0.49). Between‐study heterogeneity was negligible (I2 = 0%).
OARSI/OMERACT responder criteria
Three studies reported fulfilment of the OARSI/OMERACT responder criteria among 305 participants (Analysis 1.9). Pooled results when a random‐effects model was applied showed higher RR among the exercise group than in the no exercise group for fulfilling these criteria (RR 2.80, 95% CI 1.40 to 5.62). Between‐study heterogeneity was moderate (I2 = 42%). Omission of one study (Dziedzic 2015), in which the 95% CI for the RR crossed the value of 1, caused the I2 to drop to 35% (RR 3.76, 95% CI 1.60 to 8.84).
Comparison 2. Comparison of different exercise programmes
Only one included study compared different exercise programmes (Davenport 2012). Study authors compared specific dynamic stability exercises versus general exercises for CMC1 OA and reported no differences in pain, self‐reported function or pinch strength between groups at three‐month and six‐month follow‐up.
Discussion
Summary of main results
We conducted this review to evaluate scientific evidence for the benefits and harms of exercise compared with other interventions, including placebo or no intervention, in people with hand osteoarthritis (OA). Major outcomes evaluated were hand pain, hand function, quality of life, finger joint stiffness, intervention‐related adverse events and numbers of participants withdrawn from studies because of adverse events. None of the studies included in this review measured radiographic joint structure changes. Minor outcomes evaluated included grip and pinch strength and fulfilment of the Osteoarthritis Research Society International/Outcome Measures/Outcome Measures in Rheumatology (OARSI/OMERACT) responder criteria. Overall results of meta‐analyses suggest that performing exercise is beneficial in terms of reducing hand pain and finger joint stiffness immediately post intervention, but the effect is not sustained at later follow‐up. Investigators also found a beneficial effect of exercise on self‐reported hand function, but heterogeneity between studies was greater and the confidence interval was slightly larger. Evidence was insufficient to show the effect of exercise on quality of life among people with hand OA. Very few adverse events related to the exercise intervention resulted in very wide confidence intervals for the estimates. Baseline levels of pain, function and stiffness were generally mild to moderate, leaving a limited scope for improvement. Reductions in pain (0 to 10 scale), function (0 to 36 scale) and stiffness (0 to 10 scale) of 0.5, 2.2 and 0.7 points, respectively, probably would not be considered clinically important changes. We identified only a small number of studies and few participants for this review; therefore, future research is very likely to have an important impact on our confidence in the estimates of effect and is likely to change the estimates.
Overall completeness and applicability of evidence
We were able to include five studies in the meta‐analyses of this review. Participants were recruited in different settings from elderly living communities to primary or specialist care, and sample sizes varied largely from 19 to 130 participants. Most participants were female (range 66% to 100%), and mean age was mainly between 60 and 65 years, but one study included slightly older people (mean age 81). Exercise interventions varied largely in terms of content (types of exercises), mode, dose and supervision, but two studies used almost the same exercise programme (Hennig 2015; Østerås 2014). The few studies and participants included in this review did not allow for subgroup analyses. The most recent study (Nery 2015) seemed to show larger beneficial outcomes as compared with the others, but we could extract only limited information from a congress abstract, so several methodological and quality aspects of this study remain to be determined. Results of this review indicate a small to moderate beneficial effect of exercise in people with hand OA, but the absolute effect may not be clinically meaningful. Given that we have limited knowledge of the optimal exercise dosage for persons with hand OA, and that we rely mainly on self‐reported data on adherence to the prescribed dosage, the actual dosage followed by participants in the included studies may have been insufficient to produce an optimal effect. As with other exercise interventions, the effect did not seem to be sustained over the long term, which is reasonable if the exercise was discontinued. However, very few harms (adverse events) were reported, meaning that the exercise programme was well tolerated. The external validity of this review is limited by the small number of included studies, and results should be generalised with caution.
Quality of the evidence
Although five of the seven included studies reported blinded outcome assessments, the major outcomes included in this review are self‐reported (pain, function, stiffness and quality of life). Five of the seven studies in this review had limitations regarding blinding of participants and personnel (performance bias) as well as blinding of outcome assessment (detection bias) for self‐reported outcomes. Although it is difficult, or impossible, to blind participants and personnel to treatment allocation in studies comparing exercise versus no exercise, lack of blinding on self‐reported outcomes may have led to inflated effect sizes. Three studies had a high drop‐out rate and were considered to have high risk of attrition bias, but for all other risk of bias domains, we considered these studies to present low risk. One included study was available only as a congress abstract, and we could not properly evaluate risk of bias. All included studies showed beneficial results favouring exercise as compared with no exercise for the outcomes of pain, function and stiffness.
We downgraded the overall quality of the body of evidence for hand pain, hand function and finger joint stiffness to low owing to potential detection bias (lack of blinding of participants on self‐reported outcome measures) and imprecision (few studies, limited numbers of participants and wide confidence intervals). For quality of life, adverse events and withdrawals due to adverse events, we further downgraded the overall quality of the body of evidence to very low owing to very few studies and very wide confidence intervals.
Potential biases in the review process
We conducted an extensive literature search including handsearching of register databases and congress proceedings, but we may have missed relevant publications or ongoing trials. We expect minimal extracting and reporting bias, as two independent review authors performed these tasks, but we re‐analysed data from two studies for the possibility of error. One study was reported only as a congress abstract, and we were unable to contact study authors for two other trials, which had implications for the risk of bias assessment.
Agreements and disagreements with other studies or reviews
Seven systematic reviews (Bertozzi 2015; Kjeken 2011; Mahendira 2009; Towheed 2005; Valdes 2010; Ye 2011; Zhang 2007) and one overview of reviews (Moe 2009) on non‐surgical or non‐pharmacological treatment of people with hand OA have been published. Five of these reviews were not able to pool exercise data in a meta‐analysis. Conclusions from the two most recent reviews were inconsistent, as review authors concluded that exercise has "no overall effect" (Ye 2011) versus "may reduce pain and stiffness and improve function" (Kjeken 2011). However, the conclusions provided by previous reviews were based on a small number of studies with few participants and methodological shortfalls. Except for two studies (Lefler 2004; Rogers 2009), we excluded from this review all studies included in previous reviews for various reasons (Boustedt 2009; Garfinkel 1994; Stamm 2002; Wajon 2005; Characteristics of excluded studies). A recently published systematic review on non‐pharmacological interventions (Bertozzi 2015) included four studies, three of which we included in the present review (Dziedzic 2015; Lefler 2004, Rogers 2009) and one that we excluded (Stamm 2002). The authors of this previously published review concluded that they had found (very) low‐quality evidence showing no significant improvement in pain intensity, function and stiffness at short‐term and long‐term follow‐up, but they uncovered moderate‐quality evidence showing an effect on grip strength at short‐term follow‐up (Bertozzi 2015).

Study flow diagram.

Risk of bias graph: review authors' judgements about each risk of bias item presented as percentages across all included studies.

Risk of bias summary: review authors' judgements about each risk of bias item for each included study.

Forest plot of comparison: 1 Exercise versus no exercise, outcome: 1.1 Hand pain (short term).

Forest plot of comparison: 1 Exercise versus no exercise, outcome: 1.2 Hand function (short term).

Forest plot of comparison: 1 Exercise versus no exercise, outcome: 1.4 Finger joint stiffness (short term).

Comparison 1 Exercise versus no exercise (short term), Outcome 1 Hand pain (short term).

Comparison 1 Exercise versus no exercise (short term), Outcome 2 Self‐reported hand function (short term).

Comparison 1 Exercise versus no exercise (short term), Outcome 3 Quality of life (short term).

Comparison 1 Exercise versus no exercise (short term), Outcome 4 Finger joint stiffness (short term).

Comparison 1 Exercise versus no exercise (short term), Outcome 5 Adverse events.

Comparison 1 Exercise versus no exercise (short term), Outcome 6 Withdrawals due to adverse events.

Comparison 1 Exercise versus no exercise (short term), Outcome 7 Grip strength (short term).
Comparison 1 Exercise versus no exercise (short term), Outcome 8 Pinch strength (short term).

Comparison 1 Exercise versus no exercise (short term), Outcome 9 OARSI/OMERACT responder criteria.

Comparison 2 Exercise versus no exercise (medium term), Outcome 1 Hand pain (6 months).

Comparison 2 Exercise versus no exercise (medium term), Outcome 2 Self‐reported hand function (6 months).

Comparison 2 Exercise versus no exercise (medium term), Outcome 3 Quality of life (6 months).

Comparison 2 Exercise versus no exercise (medium term), Outcome 4 Finger joint stiffness (6 months).

Comparison 2 Exercise versus no exercise (medium term), Outcome 5 Grip strength (6 months).

Comparison 3 Exercise versus no exercise (long term), Outcome 1 Hand pain (12 months).

Comparison 3 Exercise versus no exercise (long term), Outcome 2 Self‐reported hand function (12 months).

Comparison 3 Exercise versus no exercise (long term), Outcome 3 Finger joint stiffness (12 months).
| Study | Median specific exercise | IQR specific exercise group | N specific exercise group | Median general exercise group | IQR general exercise group | N general exercise group |
| Hand pain at rest (short term) | ||||||
| Davenport 2012 | 2.5 | 1.8‐4 | 13 | 1.1 | 0.2‐3.1 | 15 |
| Pinch strength (short term) | ||||||
| Davenport 2012 | 2.5 | 1.9‐3.4 | 13 | 3.8 | 3.1‐6.5 | 15 |
| Hand pain at rest (6 months) | ||||||
| Davenport 2012 | 2 | 0.9‐2.7 | 8 | 0.3 | 0‐3.2 | 14 |
| Pinch strength (6 months) | ||||||
| Davenport 2012 | 2.7 | 2‐3.2 | 8 | 3.9 | 2.8‐6.8 | 14 |
Comparison 4 Comparison of different exercise programmes, Outcome 1 Specific CMC exercises vs general CMC exercises.
| Hand exercise compared with no exercise for hand osteoarthritis (immediately post treatment/short term) | ||||||
| Patient or population: patients with hand osteoarthritis | ||||||
| Outcomes | Illustrative comparative risks* (95% CI) | Relative effect | Number of participants | Quality of the evidence | Comments | |
| Assumed risk | Corresponding risk | |||||
| No exercise | Hand exercise | |||||
| Hand pain Scale from 0 to 10 (0 represents no pain) | Mean hand pain in control groups was 3.9 pointsa | Mean hand pain in intervention groups was 0.5 points lower | 381 | ⊕⊕⊝⊝ | SMD ‐0.27 (‐0.47 to ‐0.07) Absolute reduction in pain 5% (1% to 9%) on a 0‐10 scale Relative change 13% (3% to 22%) NNTB: 9 (5 to 32) | |
| Hand function Scale from 0 to 36 (0 represents no physical disability) | Mean hand function in control groups was 14.5 pointsd | Mean hand function in intervention groups was 2.2 points lower | 369 | ⊕⊕⊝⊝ | SMD ‐0.28 (‐0.58 to 0.02) Absolute improvement in hand function 6% (0.4% worsening to 13% improvement) Relative change 15% (1% worsening to 32% improvement). NNTB: 9 (5 to 52) | |
| Radiographic joint structure changes | Not measured | Not measured | Not estimable | 0 | Not applicable | Radiographic joint changes not measured |
| Quality of life Scale from 0 to 100 (100 represents maximum quality of life) | Mean quality of life in control groups was 50.4 pointse | Mean quality of life in intervention groups was 0.3 points higher | 113 | ⊕⊝⊝⊝ | MD 0.30 (‐3.72 to 4.32) Absolute improvement in quality of life 0.3% (4% worsening to 4% improvement) Relative change 0.6% (7% worsening to 8% improvement) | |
| Finger joint stiffness Scale from 0 to 10 (0 represents no stiffness). | Mean finger joint stiffness in control groups was 4.5 pointsg | Mean finger joint stiffness in intervention groups was 0.7 points lower | 368 | ⊕⊕⊝⊝ | SMD ‐0.36 (‐0.58, ‐0.15) Absolute reduction in finger joint stiffness 7% (3% to 10%) Relative change 14% (6% to 23%) NNTB: 7 (4 to 15) | |
| Adverse events | 0 per 1000 | 32 per 1000h | RR 4.55 | 309 | ⊕⊝⊝⊝ | Absolute risk difference: 2% more events (2% fewer to 5% more) Relative difference 355% (47% decrease to 3831% increase) |
| Withdrawal due to adverse events | 0 per 1000 | 13 per 1000i | RR 2.88 | 309 | ⊕⊝⊝⊝ | Absolute risk difference: 1% more events (2% fewer to 3% more) Relative difference 188% (70% decrease to 2618% increase) |
| *The basis for the assumed risk (e.g. median control group risk across studies) is provided in footnotes. The corresponding risk (and its 95% confidence interval) is based on the assumed risk in the comparison group and the relative effect of the intervention (and its 95% CI). | ||||||
| GRADE Working Group grades of evidence | ||||||
| aControl group baseline hand pain mean (SD) 3.9 (1.8) from Østerås 2014. bDowngraded owing to risk of detection bias on self‐reported outcomes (lack of blinding of participants). cDowngraded owing to imprecision (few participants, wide confidence interval). gControl group baseline finger joint stiffness mean (SD) 4.5 (1.8) from Østerås 2014. | ||||||
| Study | Country | No | Trial type | Setting | Follow‐up | Gender | Age | Sympt | Diagn |
| UK | 39 | Pilot RCT | Hand centre | 3, 6 months | 82% female | 60 | |||
| UK | 130 | RCT | Primary care/Research clinic | 3, 6, 12 months | 66% female | 66 | 5 | ||
| Norway | 80 | RCT | Outpatient secondary care | 3 months | 100% female | 61 | 10 | 2 | |
| US | 19 | RCT | Elderly living community | 6 weeks | 90% female | 81 | |||
| Brazil | 60 | RCT | 6, 12 weeks | Both genders | |||||
| US | 76 | Cross‐over | Florida community | 16, 32, 48 weeks | 85% female | 75 | |||
| Norway | 130 | RCT | Primary/Secondary care | 3, 6 months | 90% female | 66 | 12 | ||
| Age: mean age of participants; Diagn: mean number of years since hand OA was diagnosed; No: number of participants randomly assigned; Sympt: mean number of years with hand OA symptoms. | |||||||||
| Study, country | Intervention | Comparison | Outcome measures |
| UK | Mode: home based, but all were seen at weeks 1, 3 and 7 for exercise review Aim: specific CMC joint exercises to reduce pain and to increase grip strength and range of motion Exercises (3): specific CMC joint exercises including passive extension, active extension and active abduction (abductor pollicis longus) against resistance + pinching/turning/twisting activities Dose: 3‐4 times a day, 10 seconds hold, 3‐10 reps, 3 levels for progression Duration: 6 months Personnel: 1 physiotherapist Number of sessions: > 600 Supervised sessions/review: 3 Adherence: not reported | Mode: home based, but all were seen at weeks 1, 3 and 7 for exercise review Aim: general exercise regimen for CMC Exercises (3): general exercises including passive extension, thumb to fingertip (slide and press), squeeze a peg between thumb and fingers, squeeze a sponge in the hand + pinching/turning/twisting activities Dose: 3‐4 times a day, 10 seconds hold, 3‐10 reps, 3 levels for progression Duration: 6 months Personel: 1 physiotherapist | + Disabilities of the Arm, Shoulder and Hand (DASH) Questionnaire + pinch strength + pain at rest and during pinch (VAS) + abductor pollicis longus (APL) moment |
| UK | Mode: hand exercises in 4 group sessions (1‐1.5 hours) first 4 weeks, the rest home based Aim: to improve strength and dexterity. Included stretching and strengthening hand and thumb exercises Exercises (10): stretching (wrist flexion + extension/pronation + supination, tendon gliding, radial finger walking, make "O" sign, thumb‐5th finger opposition, thumb extension/abduction) and strengthening exercises (elastic band/Play‐Doh providing resistance against thumb/finger abduction/extension, squeeze Play‐Doh, pinch off pieces of Play‐Doh, external weight during wrist movements) Dose: 3 reps initially, increasing up to 10 reps, daily (or most days); performed within limit of discomfort Duration: 12 months Personnel: 9 occupational therapists Number of sessions: 365 Supervised sessions/review: 4 Adherence: 78% reported to exercise ≥ 2×/wk at 6‐month follow‐up | No treatment provided, only written information on self‐management approaches for hand OA that was given to both groups | + OARSI/OMERACT responder criteria + hand pain (NRS) + pain, stiffness and function (AUSCAN) + grip strength (Jamar) + pinch strength (B & L pinch gauge) + grip ability test (GAT) + health‐related QoL (SF‐12) |
| Norway | Mode: home‐based hand exercises. Up to 8 telephone calls by an occupational therapist to facilitate adherence and to provide advice on exercise dosage Aim: maximise stable and pain‐free functional finger joint ROM, increase grip strength, maintain joint stability, prevent/delay development of fixed deformities Exercises (5): make "O" sign, roll into small + large fist, rubber ball squeeze, thumb abduction/extension against elastic band, finger stretch Dose: 3 times a week, 10 reps weeks 1‐2, 12 reps weeks 3‐4, 15 reps weeks 5‐13 Duration: 3 months (13 weeks) Personnel: 2 occupational therapists. Number of sessions: 39 Supervised sessions/review: 1 (but up to 8 phone calls from an occupational therapist) Adherence: median (min‐max) number of recorded sessions was 37 (26‐43) | No treatment provided, only leaflet with information about hand OA, ergonomic principles and advice | + Patient Specific Functional Scale (PSFS) + Functional Index for Hand OsteoArthritis (FIHOA) + hand pain, stiffness, function, fatigue, and patient global assessment of disease activity (NRS) + number of painful joints + grip strength (Jamar) + flexion deficit and thumb opposition + thumb web space (12 cylinders, diameter 1‐12 cm) + finger dexterity (Moberg Pick‐up Test) + OARSI/OMERACT responder criteria |
| US | Mode: supervised Aim: to improve grip strength, pinch strength, joint stability, finger range of motion and joint pain Exercises: isometric resistance for muscle groups in hand and forearm, rice grabs, pinch grip lifting and wrist rolls Dose: 3 times a week. Isometric resistance training 1‐10 reps, 6 seconds hold at low intensity (40%‐60% of 1 RM) 3 times a week. Isotonic resistance training at 40% of 1 RM in 10‐15 reps, progressed to moderate intensity (more than 60% of 1 RM) in 6‐8 reps. Performed below a 1.5 point increase in pain on a 6 point scale (no discomfort‐extreme discomfort) Duration: 6 weeks Personnel: not reported Number of sessions: 18 Supervised sessions/review: 18 Adherence: 67% completed 16‐18 sessions (3 participants missing > 2 sessions were excluded in analyses) | No treatment provided | + pain (6 point scale) + finger range of motion (goniometer) + grip strength (Jamar) + pinch strength (Jamar pinch gauge) |
| Brazil | A session on joint protection and energy conservation for hands was provided before randomisation. Mode: not reported Aim: to target pain, function and strength in hand OA Exercises: not reported Dose: 2 times a week, no more information Duration: 12 weeks Personnel: not reported Number of sessions: 24 Supervised sessions/review: not reported Adherence: not reported | A session on joint protection and energy conservation for hands was provided before randomisation. No treatment provided | + pain (NRS/VAS) + pain, stiffness, function (AUSCAN) + hand function (Cochin Hand Functional Scale) + grip and pinch strength (hydraulic hand and pinch gauge dynamometer) + satisfaction with treatment |
| US | Aim: to improve joint flexibility + grip and pinch strength Exercises (9): flexibility (6): flexion of 2‐5 MCP joints, small fist, large fist, Okay signs, finger spread, thumb reach. Strength (3): squeeze Thera‐Band Hand Exerciser ball until 50% depressed: in palm, key pinch and thumb‐index fingertip pinch Dose: daily Duration: 16 weeks Personnel: principal investigator Number of sessions: 112 Supervised sessions/review: 1 Adherence: not reported | Instructed to apply hand cream once per day using a gentle, non‐vigorous technique | + pain, stiffness, function (AUSCAN) + grip strength (Jamar) + key pinch strength (Jamar pinch dynamometer) + hand dexterity (Purdue Pegboard Model 32020) |
| Norway | Mode: 4 group sessions + 32 home‐based sessions of hand and upper arm exercises. Weekly telephone call by a project group member in weeks with no group session to facilitate adherence and provide advice on exercise dosage Aim: to improve grip strength and thumb stability, to maintain finger range of motion Exercises (8): shoulder extension and biceps curl in sitting position with elastic band, shoulder flexion in standing with elastic band, make "O"sign, roll into small + large fist, rubber tube squeeze (10 sec hold), thumb abduction/extension against elastic band, finger stretch Dose: 3 times a week, 10 reps weeks 1‐2, 15 reps weeks 3‐12, instructed to apply moderate to vigorous intensity Duration: 3 months (12 weeks) Personnel: 2 occupational therapists. Number of sessions: 36 Supervised sessions/review: 4 Adherence: 47% recorded 35‐36 sessions and 94% recorded ≥ 22 sessions. | No treatment provided | + Functional Index for Hand OsteoArthritis (FIHOA) + Patient Specific Functional Scale (PSFS) + hand pain, stiffness, function, fatigue, and patient global assessment of disease activity (NRS) + grip strength (Jamar) + thumb web space (12 cylinders, diameter 1‐12 cm) + finger dexterity (Moberg Pick‐up Test) + OARSI/OMERACT responder criteria |
| APL: abductor pollicis longus. AUSCAN: Australian/Canadian Hand Osteoarthritis Index. CMC: carpometacarpal. DASH: Disabilities of the Arm, Shoulder and Hand Questionnaire FIHOA: Functional Index for Hand OsteoArthritis. GAT: Grip Ability Test. NRS: numeric rating scale. OA: osteoarthritis. OARSI/OMERACT: Osteoarthritis Research Society International/Outcome Measures/Outcome Measures in Rheumatology PSFS: Patient Specific Functional Scale. RM: repetition maximum. SF‐12: The 12‐Item Short Form Health Survey VAS: visual analogue scale | |||
| Study | Primary outcome measure | NRS/VAS pain | AUSCAN pain/ function/stiffness | FIHOA function | NRS function | SF‐12 | NRS stiffness | Reported on adverse events | Grip strength | Pinch strength | OARSI/OMERACT responder criteria |
| DASH | √ | √ | |||||||||
| OMERACT/OARSI responder criteria | √ | √ | √ | √ | √ | √ | √ | ||||
| PSFS | √ | √ | √ | √ | √ | √ | √ | ||||
| ? | √ (6 categories) | √ | √ | ||||||||
| ? | √ | √ | √ | √ | |||||||
| AUSCAN Function | √ | √ | √ | √ | |||||||
| PSFS + FIHOA | √ | √ | √ | √ | √ | √ | √ | ||||
| AUSCAN: Australian/Canadian Hand Osteoarthritis Index. DASH: Disabilities of the Arm, Shoulder and Hand Questionnaire FIHOA: Functional Index for Hand OsteoArthritis. NRS: numeric rating scale. OARSI/OMERACT: Osteoarthritis Research Society International/Outcome Measures/Outcome Measures in Rheumatology PSFS: Patient Specific Functional Scale. SF‐12: The 12‐Item Short Form Health Survey VAS: visual analogue scale | |||||||||||
| Outcome or subgroup title | No. of studies | No. of participants | Statistical method | Effect size |
| 1 Hand pain (short term) Show forest plot | 5 | 381 | Std. Mean Difference (IV, Random, 95% CI) | ‐0.27 [‐0.47, ‐0.07] |
| 1.1 End of treatment scores/Short‐term scores | 5 | 381 | Std. Mean Difference (IV, Random, 95% CI) | ‐0.27 [‐0.47, ‐0.07] |
| 2 Self‐reported hand function (short term) Show forest plot | 4 | 369 | Std. Mean Difference (IV, Random, 95% CI) | ‐0.28 [‐0.58, 0.02] |
| 2.1 End of treatment scores/Short‐term scores | 4 | 369 | Std. Mean Difference (IV, Random, 95% CI) | ‐0.28 [‐0.58, 0.02] |
| 3 Quality of life (short term) Show forest plot | 1 | 113 | Mean Difference (IV, Random, 95% CI) | 0.30 [‐3.72, 4.32] |
| 3.1 End of treatment scores/Short‐term scores | 1 | 113 | Mean Difference (IV, Random, 95% CI) | 0.30 [‐3.72, 4.32] |
| 4 Finger joint stiffness (short term) Show forest plot | 4 | 368 | Std. Mean Difference (IV, Random, 95% CI) | ‐0.36 [‐0.58, ‐0.15] |
| 4.1 End of treatment scores/Short‐term scores | 4 | 368 | Std. Mean Difference (IV, Random, 95% CI) | ‐0.36 [‐0.58, ‐0.15] |
| 5 Adverse events Show forest plot | 3 | 309 | Risk Ratio (M‐H, Random, 95% CI) | 4.55 [0.53, 39.31] |
| 6 Withdrawals due to adverse events Show forest plot | 3 | 309 | Risk Ratio (M‐H, Random, 95% CI) | 2.88 [0.30, 27.18] |
| 7 Grip strength (short term) Show forest plot | 5 | 362 | Std. Mean Difference (IV, Random, 95% CI) | 0.34 [‐0.01, 0.69] |
| 7.1 End of treatment scores/Short‐term scores | 5 | 362 | Std. Mean Difference (IV, Random, 95% CI) | 0.34 [‐0.01, 0.69] |
| 8 Pinch strength (short term) Show forest plot | 3 | 179 | Std. Mean Difference (IV, Random, 95% CI) | 0.20 [‐0.10, 0.49] |
| 8.1 End of treatment scores/Short‐term scores | 3 | 179 | Std. Mean Difference (IV, Random, 95% CI) | 0.20 [‐0.10, 0.49] |
| 9 OARSI/OMERACT responder criteria Show forest plot | 3 | 305 | Risk Ratio (M‐H, Random, 95% CI) | 2.80 [1.40, 5.62] |
| Outcome or subgroup title | No. of studies | No. of participants | Statistical method | Effect size |
| 1 Hand pain (6 months) Show forest plot | 2 | 220 | Std. Mean Difference (IV, Random, 95% CI) | 0.09 [‐0.18, 0.35] |
| 2 Self‐reported hand function (6 months) Show forest plot | 2 | 228 | Std. Mean Difference (IV, Random, 95% CI) | ‐0.05 [‐0.31, 0.21] |
| 3 Quality of life (6 months) Show forest plot | 1 | 100 | Mean Difference (IV, Random, 95% CI) | 1.90 [‐2.27, 6.07] |
| 4 Finger joint stiffness (6 months) Show forest plot | 2 | 225 | Std. Mean Difference (IV, Random, 95% CI) | ‐0.12 [‐0.38, 0.14] |
| 5 Grip strength (6 months) Show forest plot | 1 | 106 | Std. Mean Difference (IV, Random, 95% CI) | ‐0.04 [‐0.42, 0.35] |
| Outcome or subgroup title | No. of studies | No. of participants | Statistical method | Effect size |
| 1 Hand pain (12 months) Show forest plot | 1 | 102 | Std. Mean Difference (IV, Random, 95% CI) | ‐0.22 [‐0.61, 0.17] |
| 2 Self‐reported hand function (12 months) Show forest plot | 1 | 108 | Std. Mean Difference (IV, Random, 95% CI) | ‐0.09 [‐0.47, 0.29] |
| 3 Finger joint stiffness (12 months) Show forest plot | 1 | 108 | Std. Mean Difference (IV, Random, 95% CI) | ‐0.33 [‐0.71, 0.05] |
| Outcome or subgroup title | No. of studies | No. of participants | Statistical method | Effect size |
| 1 Specific CMC exercises vs general CMC exercises Show forest plot | Other data | No numeric data | ||
| 1.1 Hand pain at rest (short term) | Other data | No numeric data | ||
| 1.2 Pinch strength (short term) | Other data | No numeric data | ||
| 1.3 Hand pain at rest (6 months) | Other data | No numeric data | ||
| 1.4 Pinch strength (6 months) | Other data | No numeric data | ||