Scolaris Content Display Scolaris Content Display

Study flow diagram.
Figuras y tablas -
Figure 1

Study flow diagram.

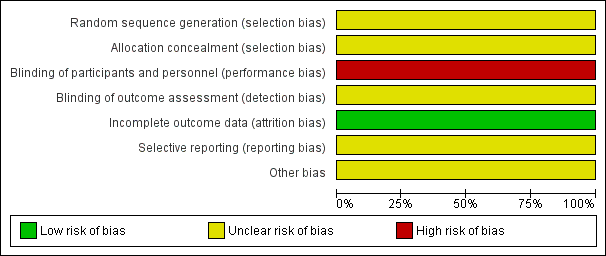
'Risk of bias' graph: review authors' judgements about each risk of bias item presented as percentages across all included studies.
Figuras y tablas -
Figure 2

'Risk of bias' graph: review authors' judgements about each risk of bias item presented as percentages across all included studies.

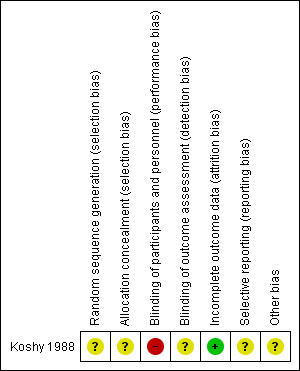
'Risk of bias' summary: review authors' judgements about each risk of bias item for each included study.
Figuras y tablas -
Figure 3

'Risk of bias' summary: review authors' judgements about each risk of bias item for each included study.

Comparison 1 Prophylactic versus selective blood transfusion, Outcome 1 Maternal death.
Figuras y tablas -
Analysis 1.1

Comparison 1 Prophylactic versus selective blood transfusion, Outcome 1 Maternal death.

Comparison 1 Prophylactic versus selective blood transfusion, Outcome 2 Severe maternal morbidity (pulmonary embolism).
Figuras y tablas -
Analysis 1.2

Comparison 1 Prophylactic versus selective blood transfusion, Outcome 2 Severe maternal morbidity (pulmonary embolism).

Comparison 1 Prophylactic versus selective blood transfusion, Outcome 3 Severe maternal morbidity (congestive cardiac failure).
Figuras y tablas -
Analysis 1.3

Comparison 1 Prophylactic versus selective blood transfusion, Outcome 3 Severe maternal morbidity (congestive cardiac failure).

Comparison 1 Prophylactic versus selective blood transfusion, Outcome 4 Severe maternal morbidity (acute chest syndrome).
Figuras y tablas -
Analysis 1.4

Comparison 1 Prophylactic versus selective blood transfusion, Outcome 4 Severe maternal morbidity (acute chest syndrome).

Comparison 1 Prophylactic versus selective blood transfusion, Outcome 5 Perinatal death.
Figuras y tablas -
Analysis 1.5

Comparison 1 Prophylactic versus selective blood transfusion, Outcome 5 Perinatal death.

Comparison 1 Prophylactic versus selective blood transfusion, Outcome 6 Sickle cell crisis (pain crisis).
Figuras y tablas -
Analysis 1.6

Comparison 1 Prophylactic versus selective blood transfusion, Outcome 6 Sickle cell crisis (pain crisis).

Comparison 1 Prophylactic versus selective blood transfusion, Outcome 7 Sickle cell crises (acute splenic sequestration).
Figuras y tablas -
Analysis 1.7

Comparison 1 Prophylactic versus selective blood transfusion, Outcome 7 Sickle cell crises (acute splenic sequestration).

Comparison 1 Prophylactic versus selective blood transfusion, Outcome 8 Sickle cell crisis (haemolysis).
Figuras y tablas -
Analysis 1.8

Comparison 1 Prophylactic versus selective blood transfusion, Outcome 8 Sickle cell crisis (haemolysis).

Comparison 1 Prophylactic versus selective blood transfusion, Outcome 9 Blood transfusion reaction.
Figuras y tablas -
Analysis 1.9

Comparison 1 Prophylactic versus selective blood transfusion, Outcome 9 Blood transfusion reaction.

Summary of findings for the main comparison. Prophylactic versus selective blood transfusion for sickle cell disease in pregnancy

Prophylactic versus selective blood transfusion for sickle cell disease in pregnancy

Patient or population: patients with sickle cell disease in pregnancy
Settings: secondary and tertiary hospital in USA
Intervention: prophylactic

Control: selective blood transfusion

Outcomes

Illustrative comparative risks* (95% CI)

Relative effect
(95% CI)

No of participants
(studies)

Quality of the evidence
(GRADE)

Comments

Assumed risk

Corresponding risk

Control

Prophylactic versus selective blood transfusion

Maternal death

See comment

See comment

Not estimable

72
(1 study)

⊕⊝⊝⊝
very low1,2,3

No woman in this study died.

Severe maternal morbidity (pulmonary embolism)

See comment

See comment

Not estimable

72
(1 study)

⊕⊝⊝⊝
very low1,2

No woman in this study experienced pulmonary embolism.

Severe maternal morbidity (congestive cardiac failure)

28 per 1000

28 per 1000
(2 to 427)

RR 1.00
(0.07 to 15.38)

72
(1 study)

⊕⊝⊝⊝
very low1,4

Perinatal death

54 per 1000

154 per 1000
(33 to 715)

RR 2.85
(0.61 to 13.22)

76
(1 study)

⊕⊝⊝⊝
very low1,4

Sickle cell crisis (pain crisis)

500 per 1000

140 per 1000
(60 to 335)

RR 0.28
(0.12 to 0.67)

72
(1 study)

⊕⊕⊝⊝
low1,5

Sickle cell crises (acute splenic sequestration)

28 per 1000

9 per 1000
(0 to 220)

RR 0.33
(0.01 to 7.92)

72
(1 study)

⊕⊕⊝⊝
low1,5

Blood transfusion reaction

83 per 1000

167 per 1000
(45 to 616)

RR 2.00
(0.54 to 7.39)

72
(1 study)

⊕⊝⊝⊝
very low1,4

*The basis for the assumed risk (e.g. the median control group risk across studies) is provided in footnotes. The corresponding risk (and its 95% confidence interval) is based on the assumed risk in the comparison group and the relative effect of the intervention (and its 95% CI).
CI: Confidence interval; RR: Risk ratio;

GRADE Working Group grades of evidence
High quality: Further research is very unlikely to change our confidence in the estimate of effect.
Moderate quality: Further research is likely to have an important impact on our confidence in the estimate of effect and may change the estimate.
Low quality: Further research is very likely to have an important impact on our confidence in the estimate of effect and is likely to change the estimate.
Very low quality: We are very uncertain about the estimate.

1 The only study was at uncertain risk of bias due to unclear methods of random sequence generation and allocation concealment, and lack of blinding.
2 No events and few study participants. Confidence interval expected to be very wide.
3 Reporting bias likely. Maternal death was not a pre‐specified study outcome but was reported in the result.
4 Very few events, small total number of participants, and wide confidence interval.
5 Few events and small total number of participants.

Figuras y tablas -
Summary of findings for the main comparison. Prophylactic versus selective blood transfusion for sickle cell disease in pregnancy
Comparison 1. Prophylactic versus selective blood transfusion

Outcome or subgroup title

No. of studies

No. of participants

Statistical method

Effect size

1 Maternal death Show forest plot

1

72

Risk Ratio (M‐H, Fixed, 95% CI)

0.0 [0.0, 0.0]

2 Severe maternal morbidity (pulmonary embolism) Show forest plot

1

72

Risk Ratio (M‐H, Fixed, 95% CI)

0.0 [0.0, 0.0]

3 Severe maternal morbidity (congestive cardiac failure) Show forest plot

1

72

Risk Ratio (M‐H, Fixed, 95% CI)

1.0 [0.07, 15.38]

4 Severe maternal morbidity (acute chest syndrome) Show forest plot

1

72

Risk Ratio (M‐H, Fixed, 95% CI)

0.67 [0.12, 3.75]

5 Perinatal death Show forest plot

1

76

Risk Ratio (M‐H, Fixed, 95% CI)

2.85 [0.61, 13.22]

6 Sickle cell crisis (pain crisis) Show forest plot

1

72

Risk Ratio (M‐H, Fixed, 95% CI)

0.28 [0.12, 0.67]

7 Sickle cell crises (acute splenic sequestration) Show forest plot

1

72

Risk Ratio (M‐H, Fixed, 95% CI)

0.33 [0.01, 7.92]

8 Sickle cell crisis (haemolysis) Show forest plot

1

72

Risk Ratio (M‐H, Fixed, 95% CI)

0.33 [0.04, 3.06]

9 Blood transfusion reaction Show forest plot

1

72

Risk Ratio (M‐H, Fixed, 95% CI)

2.0 [0.54, 7.39]

Figuras y tablas -
Comparison 1. Prophylactic versus selective blood transfusion