Йога в лечении астмы
Abstract
Background
Asthma is a common chronic inflammatory disorder affecting about 300 million people worldwide. As a holistic therapy, yoga has the potential to relieve both the physical and psychological suffering of people with asthma, and its popularity has expanded globally. A number of clinical trials have been carried out to evaluate the effects of yoga practice, with inconsistent results.
Objectives
To assess the effects of yoga in people with asthma.
Search methods
We systematically searched the Cochrane Airways Group Register of Trials, which is derived from systematic searches of bibliographic databases including the Cochrane Central Register of Controlled Trials (CENTRAL), MEDLINE, EMBASE, CINAHL, AMED, and PsycINFO, and handsearching of respiratory journals and meeting abstracts. We also searched PEDro. We searched ClinicalTrials.gov and the WHO ICTRP search portal. We searched all databases from their inception to 22 July 2015, and used no restriction on language of publication. We checked the reference lists of eligible studies and relevant review articles for additional studies. We attempted to contact investigators of eligible studies and experts in the field to learn of other published and unpublished studies.
Selection criteria
We included randomised controlled trials (RCTs) that compared yoga with usual care (or no intervention) or sham intervention in people with asthma and reported at least one of the following outcomes: quality of life, asthma symptom score, asthma control, lung function measures, asthma medication usage, and adverse events.
Data collection and analysis
We extracted bibliographic information, characteristics of participants, characteristics of interventions and controls, characteristics of methodology, and results for the outcomes of our interest from eligible studies. For continuous outcomes, we used mean difference (MD) with 95% confidence interval (CI) to denote the treatment effects, if the outcomes were measured by the same scale across studies. Alternatively, if the outcomes were measured by different scales across studies, we used standardised mean difference (SMD) with 95% CI. For dichotomous outcomes, we used risk ratio (RR) with 95% CI to measure the treatment effects. We performed meta‐analysis with Review Manager 5.3. We used the fixed‐effect model to pool the data, unless there was substantial heterogeneity among studies, in which case we used the random‐effects model instead. For outcomes inappropriate or impossible to pool quantitatively, we conducted a descriptive analysis and summarised the findings narratively.
Main results
We included 15 RCTs with a total of 1048 participants. Most of the trials were conducted in India, followed by Europe and the United States. The majority of participants were adults of both sexes with mild to moderate asthma for six months to more than 23 years. Five studies included yoga breathing alone, while the other studies assessed yoga interventions that included breathing, posture, and meditation. Interventions lasted from two weeks to 54 months, for no more than six months in the majority of studies. The risk of bias was low across all domains in one study and unclear or high in at least one domain for the remainder.
There was some evidence that yoga may improve quality of life (MD in Asthma Quality of Life Questionnaire (AQLQ) score per item 0.57 units on a 7‐point scale, 95% CI 0.37 to 0.77; 5 studies; 375 participants), improve symptoms (SMD 0.37, 95% CI 0.09 to 0.65; 3 studies; 243 participants), and reduce medication usage (RR 5.35, 95% CI 1.29 to 22.11; 2 studies) in people with asthma. The MD for AQLQ score exceeded the minimal clinically important difference (MCID) of 0.5, but whether the mean changes exceeded the MCID for asthma symptoms is uncertain due to the lack of an established MCID in the severity scores used in the included studies. The effects of yoga on change from baseline forced expiratory volume in one second (MD 0.04 litres, 95% CI ‐0.10 to 0.19; 7 studies; 340 participants; I2 = 68%) were not statistically significant. Two studies indicated improved asthma control, but due to very significant heterogeneity (I2 = 98%) we did not pool data. No serious adverse events associated with yoga were reported, but the data on this outcome was limited.
Authors' conclusions
We found moderate‐quality evidence that yoga probably leads to small improvements in quality of life and symptoms in people with asthma. There is more uncertainty about potential adverse effects of yoga and its impact on lung function and medication usage. RCTs with a large sample size and high methodological and reporting quality are needed to confirm the effects of yoga for asthma.
PICO
Резюме на простом языке
Йога как дополнительный вариант лечения для лиц, страдающих астмой
Актуальность
Астма является распространенным хроническим заболеванием, которое поражает около 300 миллионов человек во всем мире. Йога, популярность которой растет во всем мире, имеет потенциал для облегчения некоторых проблем, связанных с астмой. Однако, в связи с противоречивыми результатами существующих исследований, необходимо подтвердить эффекты йоги при астме.
Характеристика исследований
Мы проанализировали 15 исследований, в которых сравнивали эффекты йоги с обычным лечением или с «симуляцией» йоги у 1048 участников.
Результаты
Мы обнаружили, что йога, вероятно, в некоторой степени улучшает качество жизни и уменьшает симптомы астмы. Однако, наша уверенность в результатах низка, поскольку большинство исследований имели различные недостатки. Влияние йоги на функцию легких было непостоянным, и мы нашли немного данных, свидетельствующих о том, что йога может уменьшить использование лекарств. Информация о нежелательных побочных эффектах была очень ограничена; необходимы дальнейшие исследования, чтобы это оценить. Необходимы исследования высокого качества с большим числом участников, чтобы мы могли сделать твердый вывод об эффектах йоги в лечении астмы.
Authors' conclusions
Summary of findings
| Yoga compared with usual care or sham intervention for asthma | ||||||
| Patient or population: People with asthma (mostly mild or moderate) Settings: Outpatient clinic and at home (studies conducted in Ethiopia, Germany, India, UK, and USA) Intervention: Yoga (duration no more than 6 months on average; range 2 weeks to 54 months) Comparison: Usual care or sham intervention | ||||||
| Outcomes | Illustrative comparative risks* (95% CI) | Relative effect | No of Participants | Quality of the evidence | Comments | |
| Assumed risk | Corresponding risk | |||||
| Usual care or sham intervention | Yoga | |||||
| Quality of life (Asthma Quality of Life Questionnaire, with 32 items, 0 to 7 points per item) | The mean points per item of Asthma Quality of Life Questionnaire ranged from 4.06 to 4.50 points across control groups | The mean change from baseline in the intervention groups was on average 0.57 units higher (95% CI 0.37 to 0.77) | ‐ | 375 (5) | ⊕⊕⊕⊖ moderate1 | Minimal clinically important difference: 0.5 |
| Asthma symptoms (different severity scores; change from baseline) | The mean severity score ranged from 0.83 to 1.05 points across control groups on different scales | The mean severity score in the intervention groups was on average 0.37 SD units lower (95% CI 0.09 to 0.65) | ‐ | 243 (3) | ⊕⊕⊕⊖ moderate2 | Lower score indicates improvement Nagarathna 1985 and Sodhi 2009a used a 3‐point scoring system for severity of asthma symptoms from 1 (mild) to 3 (severe) Vedanthan 1998 used a 5‐point scoring system from A (no symptoms) to E (very severe symptoms). No established minimal clinically important difference in these scores is available |
| Asthma control (weekly number of attacks) | The mean weekly number of attacks ranged cross control groups from 0.58 to 2.10 | See comment | ‐ | 226 (2) | ⊕⊕⊖⊖ low3 | Two studies showed benefit, but the results were not combined due to very high heterogeneity between them |
| Forced expiratory volume in one second (change from baseline FEV1 (L)) | The mean FEV1 ranged across control groups from 2.24 to 4.19 L | The mean FEV1 in the intervention groups was on average 0.04 L higher (95% CI ‐0.10 to 0.19) | ‐ | 340 (7) | ⊕⊖⊖⊖ very low4 | ‐ |
| Reduced asthma medication usage | 8 per 100 | 43 per 100 (11 to 100) | RR 5.35 (1.29 to 22.11) | 48 (2) | ⊕⊕⊖⊖ low5 | ‐ |
| Adverse events | ‐ | ‐ | ‐ | 108 (3) | ⊕⊖⊖⊖ very low6 | Fluge 1994 reported 3 participants from the control group required oral steroids treatment due to acute exacerbations of their asthma, as compared with none in the yoga group. Sabina 2005 reported no adverse events associated with yoga or the control. In Singh 1990, 1 participant in the yoga group reported mild dyspnoea during yoga using the Pink City Lung Exerciser |
| *The basis for the assumed risk (e.g. the median control group risk across studies) is provided in footnotes. The corresponding risk (and its 95% confidence interval) is based on the assumed risk in the comparison group and the relative effect of the intervention (and its 95% CI). | ||||||
| GRADE Working Group grades of evidence | ||||||
| 1Downgraded once for study limitations; four out of five studies contributing to this outcome are at high risk of performance and detection bias, and one study is at high risk of attrition bias (see Figure 1). 2Downgraded once for study limitations; all three studies contributing to this outcome are at high risk of performance and detection bias, and one study is at high risk of selection bias (see Figure 1). 3Downgraded for (1) study limitations: both studies contributing to this outcome are at high risk of performance and detection bias, and one study is also at high risk of selection bias (see Figure 1), and (2) inconsistency: the studies could not be combined in a meta‐analysis due to very high levels of heterogeneity. 4Downgraded for (1) study limitations: six out of the seven studies contributing to this outcome are at unclear risk of selection bias (see Figure 1), (2) inconsistency: we detected substantial heterogeneity (I² = 68%) in the meta‐analysis, and (3) imprecision: the confidence intervals include both the possibility of harm or benefit of the intervention. 5Downgraded for (1) study limitations: both studies contributing to this outcome are at high risk of performance and detection bias and at unclear risk of selection bias, and one study is at high risk of other biases (see Figure 1), and (2) imprecision: despite the confidence intervals excluding no difference, the breadth of the confidence intervals and the small numbers of participants in the analysis reduces our confidence in the estimate. 6Downgraded for (1) study limitations: one study reporting adverse events is at high risk of performance, detection, and attrition bias, another is at high risk of attrition and reporting bias, and a third is at unclear risk of selection bias (see Figure 1), (2) imprecision: the very small number of studies reporting very rare events reduced our confidence in this outcome, and (3) potential publication bias due to no mention of adverse events (which were specified explicitly as one of the outcomes of interest in their research protocol) in Prem 2013. We decided not to pool these results. | ||||||

Risk of bias summary: review authors' judgements about each risk of bias item for each included study.
Background
Description of the condition
Asthma is a common chronic inflammatory disorder characterised by hypersensitivity of the airways and reversible, episodic airway obstruction (Miller 2001). Typical symptoms of asthma include wheezing, coughing, chest tightness, and dyspnoea (shortness of breath). In addition to physiologic dysfunction, many people with asthma also suffer from psychological distress in the form of depression, anxiety, and emotional disorders (Adams 2004; Van Lieshout 2008). Asthma attacks and the associated panic or anxiety can affect the lifestyle (for example social activities), well‐being, and perceived health status of people with asthma to varying degrees, making improving quality of life an important issue in asthma management. The prevalence of asthma has increased dramatically over the past decade. Globally, asthma affects about 300 million people, and this figure continues to rise (Masoli 2004; ISAAC 2006). Asthma represents a huge economic burden on society. In the USA, the management of asthma costs more than USD 12.7 billion per year (Weiss 2001). National studies in Germany, Switzerland, and Singapore have estimated the annual total costs for asthma to be USD 4.43 billion, USD 1.41 billion, and USD 49 million, respectively (Chew 1999; Szucs 1999; Stock 2005).
Current guidelines for asthma treatment recommend a severity‐based, stepwise approach (Global Initiative for Asthma 2011). Common agents used to treat people with asthma include inhaled corticosteroids and long‐acting beta agonists (Becker 2003). For severe cases, additional controller medications such as antileukotrienes, oral corticosteroids, and anti‐immunoglobulin E therapy are recommended (Peters 2006; Global Initiative for Asthma 2011).
Description of the intervention
Yoga originated from ancient India and remains an important aspect of India's diverse culture. Yoga includes such common components as breathing exercises (pranayama), postures (asanas), and meditation (dhyana) (Riley 2004). It is difficult to know exactly how many types of yoga are being practiced around the world, as different combinations of and variations in components could represent a 'new' type of yoga. To our knowledge, types of yoga include, but are not limited to, the following: aerial yoga, Ananda yoga, Anusara yoga, Ashtanga (or Astanga) yoga, Bhakti yoga, Bikram yoga (hot yoga), Chair yoga, Forrest yoga, Hatha yoga, ISHTA (Integral Science of Hatha and Tantric Arts), Iyengar yoga, Jivamukti yoga, Jnana yoga, Kali Ray TriYoga, Karma yoga, Kripalu, Kriya yoga, Kundalini yoga, Mantra yoga, Moksha, Power yoga, prenatal yoga, Purna yoga (integral yoga), Raja yoga, Restorative yoga, Sahaja yoga, Satyananda yoga, Sivananda yoga, stand‐up paddle yoga, Svaroopa yoga, Swara yoga, Tibetan yoga, Viniyoga yoga, Vinyasa yoga, and White Lotus yoga. There seems to be no estimate of the proportion of each type of yoga taught by practitioners worldwide. According to polls conducted by Yoga Journal in 2015, the most commonly practiced yoga in the USA is Vinyasa, followed by Iyengar and Ashtanga (Yoga Journal 2015). The common goal of yoga practitioners is to seek to attain a perfect integration of body, mind, and spirit (Anand 1991; Kappmeier 2006).
The popularity of yoga has expanded globally, in part due to its reputed physical and psychological benefits. The 2012 National Health Interview Survey found that 9.5% of adults in the USA (21 million) practiced yoga, significantly more than the 5.1% in 2002 and 6.1% in 2007 (Clarke 2015). According to the available data (which are not necessarily accurate), there were more than 3 million adult yoga practitioners in Germany in 2004, approximately 2 million (3% of the total population) in Great Britain in 2004, less than 1 million (around 8% of the total population) in Taiwan in 2005, 0.5 to 1 million (0.4% to 0.8% of the total population) in Japan in 2004, and 454,000 (2.8% of the total population) in Australia in 2007 (Lamb 2006; Penman 2008).
Yoga practice often incurs a financial cost, including the expense of attending classes and purchasing props, clothing, books, magazines, DVDs, and yoga mats. It has been reported that practitioners spend nearly USD 6 billion on yoga classes and products each year in the USA (Harris Interactive Service Bureau 2008). An Australian national survey showed that AUD 98.65 were spent on yoga practice per participant per month on average, amounting to a total of AUD 537.4 million per year for all yoga participants in Australia (Penman 2008). According to a "conservative estimate" made in a 2002 Yoga Journal article, a yoga practitioner spends USD 1500 on yoga practice yearly (Lamb 2006).
How the intervention might work
As a holistic therapy, yoga contains no asthma‐specific posture or breathing exercises (Goyeche 1982). The exact mechanism by which yoga may affect asthma symptoms is not fully understood (Vempati 2009). However, several explanations have been proposed.
The first explanation is related to the breathing pattern in yoga practice. One trigger of asthma attacks is frictional stress in airways, which could damage the airway wall, affect the dynamics of airway smooth muscle, and result in mast cell degranulation (Singh 1990; Solway 1997; Chowdhary 1999). Some studies have shown that the tidal volume and breathing rate decrease during yoga practice (Kesterson 1989; Sudsuang 1991), which may interfere with the process that triggers asthma attacks. Empirically, randomised controlled trials (RCTs) conducted in people with asthma have demonstrated that specific breathing exercises or techniques could help reduce acute exacerbations and rescue bronchodilator use as compared with no intervention, and could significantly improve quality of life as compared with asthma education (Fluge 1994; Bowler 1998; Opat 2000; Thomas 2003). However, in a Cochrane review comparing breathing exercises with usual care or asthma education control, data were insufficient to be able to draw conclusions to this effect (Holloway 2004). Consequently, yoga practice involving breathing techniques may have some impact on asthma symptoms. Breathing exercises in yoga practice could help release suppressed emotion, reduce anxiety and self consciousness, and relax muscle tension (Goyeche 1982).
Secondly, certain yoga postures may help expand the chest and increase breath‐holding time as well as vital capacity (Goyeche 1982). This could logically have some effect on the lung function of people with asthma.
Thirdly, by practicing yoga people with asthma may achieve a sense of relaxation and a positive mood, thus reducing the autonomic arousal factors (Goyeche 1982; Manocha 2002; Vempati 2009). Meditation, a common component of yoga, may even help practitioners reach a state of complete mental silence ('Sahaja' in Sanskrit), which yoga advocates consider to be an innately therapeutic process beneficial to people with chronic diseases, including asthma. Meditation may also help the control and feedback of respiratory muscles which would be adversely affected by asthma attacks (Nayak 2004).
Why it is important to do this review
Previous literature indicates that yoga might have been used for obstructive pulmonary disease (Donesky‐Curenco 2009), pulmonary tuberculosis (Visweswaraiah 2004), hypertension (Patel 1975; Sundar 1984; van Montfrans 1990), myocardial infarction (Bulavin 1993), chronic back pain (Groessl 2008; Tekur 2008), osteoarthritis (Bukowski 2007), and other medical disorders (Jain 1993; Ramaratnam 2000; Culos‐Reed 2006; DiStasio 2008). If its effects were confirmed, yoga could represent an additional option for people with asthma to relieve both physical and psychological suffering, especially in areas where access to traditional drug treatments is limited. However, as the National Center for Complementary and Alternative Medicine has stated, "there is not enough evidence to support the use of any complementary health practices for the relief of asthma" (NCCAM 2012). A number of clinical trials have been carried out to evaluate the efficacy of yoga for asthma. Some of them suggest that yoga may enhance pulmonary function and reduce airway hyper‐responsiveness, emotional stress, and asthma attacks (Nagarathna 1985; Sodhi 2009; Vempati 2009), while others showed that yoga conferred rather limited or even no benefit (Manocha 2002; Sabina 2005). Such information may confuse people with asthma when they are deciding whether or not to devote time and resources to the practice of yoga. We conducted the present review to better understand the current evidence and to investigate potential sources of heterogeneity between studies on yoga for asthma.
Objectives
To assess the effects of yoga in people with asthma.
Methods
Criteria for considering studies for this review
Types of studies
RCTs.
Types of participants
People with asthma of any duration and severity, irrespective of age, gender, ethnicity, or language spoken.
Types of interventions
We included the following comparisons:
-
Yoga versus usual care (or no intervention)
-
Yoga versus sham intervention
The interventions should last for at least two weeks, as a RCT showed that two weeks was sufficient for yoga‐based interventions to take effect in the management of bronchial asthma (Vempati 2009).
Types of outcome measures
The outcomes of interest in this review are listed below. Our pilot search suggested that relevant trials normally investigated a selection, rather than all, of these outcomes. Whether a study reported all of these outcomes or not was not a determinant of its inclusion or exclusion.
Primary outcomes
-
Self reported quality of life measured by validated questionnaires (e.g. Asthma Quality of Life Questionnaire (AQLQ))
-
Self reported symptom scores (e.g. asthma symptom scale)
Secondary outcomes
-
Asthma control (e.g. asthma control test)
-
Lung function, such as forced expiratory volume in one second (FEV1), peak expiratory flow rate (PEFR), forced vital capacity (FVC), forced expiratory flow between 25% and 75% of vital capacity (FEF 25‐75%), etc.
-
Asthma medication usage (e.g. frequency of inhaler use)
-
Adverse events
We chose quality of life and symptoms as the primary outcomes because they are patient‐important outcomes (Ozgen Alpaydin 2011). The physiological measures of lung function and medication usage may indirectly reflect the potential benefit of yoga, while adverse events indicate the related risk. We only considered studies with at least one month of follow‐up and included the outcomes measured at the end of the study for analysis.
Search methods for identification of studies
Electronic searches
We identified trials from the Cochrane Airways Group Register of Trials (CAGR), which is derived from systematic searches of bibliographic databases including the Cochrane Central Register of Controlled Trials (CENTRAL), MEDLINE, EMBASE, CINAHL, AMED, and PsycINFO, and handsearching of respiratory journals and meeting abstracts (please see Appendix 1 for further details). We searched all records in the CAGR using the strategy in Appendix 2 on 22 July 2015.
We performed an additional search of the Alternative Medicine Electronic Database (AMED) using the strategy in Appendix 3. We searched PEDro (www.pedro.org.au) as well with the terms 'yoga' and 'asthma', limited to clinical trials. We searched ClinicalTrials.gov using the terms related to yoga detailed in the Appendices above as 'Search Terms', and 'asthma' as 'Conditions' under the 'Advanced Search' tab. We searched the WHO ICTRP search portal (http://apps.who.int/trialsearch/Default.aspx) using these search terms in the 'Title', and 'asthma' as 'Conditions' under the 'Advanced Search' tab.
We searched all databases from their inception to 22 July 2015, and placed no restriction on language of publication.
Searching other resources
We checked the reference lists of eligible studies and relevant review articles for additional studies. We attempted to contact investigators of eligible studies and experts in the field to learn of other published and unpublished studies.
Data collection and analysis
Selection of studies
Two review authors (ZHB, MC) independently screened the titles and abstracts of the records identified through the literature search. We retrieved the full texts of potentially eligible studies. We considered studies meeting all the criteria listed above for inclusion. We excluded duplicates, and collated multiple reports of the same study so that each study, rather than each report, was the unit of interest in the review. Any disagreements between the two review authors were resolved by discussion or by consulting a third review author (TJL).
Data extraction and management
We used a predesigned and pilot‐tested data collection form to extract relevant data from eligible studies, including bibliographic information (for example title, authors, publication year), characteristics of participants (for example age, ethnicity, severity of asthma), characteristics of interventions (for example components, duration, frequency), characteristics of methodology (for example randomisation, blinding, follow‐up, methods for data analysis), and results on the outcomes of interest. This process was also performed independently by two review authors, with any inconsistencies resolved by discussion.
For continuous outcomes, the within‐group change from baseline was equal to post‐intervention mean minus pre‐intervention mean. Standard deviation of within‐group change was calculated according to the mean change and corresponding P value using the RevMan 2014 calculator or according to the formulas in Section 16.1.3.2 of the Cochrane Handbook for Systematic Reviews of Interventions (Higgins 2011), assuming a within‐group correlation coefficient of 0.5. With these data and number of participants, mean difference (MD), standardised mean difference (SMD), and their standard errors and 95% confidence intervals (CIs) could be calculated using the RevMan calculator. For studies reporting MD and its 95% CI or standard error, standard deviation of MD was equal to sqrt(N)*(upper limit ‐ lower limit)/(3.92) or (standard error)*sqrt(N), where N was total sample size, and then SMD and its standard error were calculated based on these data and the number of participants in each group using the RevMan calculator. To ensure that the meaning of SMD was consistent across different studies (for example SMD > 0 means that yoga was better, while SMD < 0 means that control was better), MD might be transformed to the same number with an opposite sign (for example from 0.35 to ‐0.35) when entered into RevMan software for meta‐analysis or used for calculating SMD. All extracted data and associated transformations are shown in Appendix 4.
Assessment of risk of bias in included studies
Two review authors (HYF, WXY) independently assessed the risk of bias for each included study using the criteria outlined in the Cochrane Handbook for Systematic Reviews of Interventions (Higgins 2011), which involve the following seven domains:
-
Random sequence generation
-
Allocation concealment
-
Blinding of participants and personnel
-
Blinding of outcome assessment
-
Incomplete outcome data
-
Selective reporting
-
Other bias
We classified the risk of bias in each domain as high, low, or unclear. Any disagreements between the two review authors were resolved by discussion or by consulting a third review author (TJL).
Measures of treatment effect
For continuous outcomes such as FEV1 and AQLQ, we used MD with 95% CI to denote the treatment effects, if the outcomes were measured by the same scale across studies. Alternatively, if the outcomes were measured by different scales across studies, we used SMD with 95% CI. For dichotomous outcomes, such as number of participants able to reduce their asthma medication, we used risk ratio with 95% CI to measure the treatment effects.
Unit of analysis issues
The majority of eligible studies we identified were individually randomised, parallel‐group trials, without multiple intervention groups. Hence, unit‐of‐analysis issues related to cluster‐randomised trials and multiple intervention groups did not arise in this review. There was a cross‐over trial (Singh 1990), for which we calculated SMD using the calculator in RevMan 2014, based on the standard deviations of the baseline and final scores, rather than the change (as it is correlated).
Dealing with missing data
We attempted to contact investigators of eligible studies and experts in the field to identify potential missing studies. However, we identified no additional studies eligible for this review. We had planned to use a funnel plot to assess potential publication bias resulting from missing studies, but we did not do this because none of the meta‐analyses we conducted included more than 10 studies (Higgins 2011). We contacted authors of the original studies as needed to clarify methodological ambiguity or to obtain additional results not available from the published data, or both. For some studies in which the summary data were missing, such as the difference in outcome between treatment groups, we tried to estimate it based on reported data.
Assessment of heterogeneity
We assessed heterogeneity across the studies included in the meta‐analysis by Cochran's Q test and the I² statistic. A P value ≤ 0.10 or an I² statistic ≥ 50% was considered as indicative of substantial heterogeneity.
Assessment of reporting biases
For studies with potential reporting bias (see Selective reporting (reporting bias)), we attempted to contact the original investigators to request any missing data. If we were unable to obtain missing data and we judged the selective reporting bias as high, we examined the impact of such studies together with other studies at high risk of bias on the overall results of the meta‐analyses by excluding them in the sensitivity analysis.
Data synthesis
We performed meta‐analysis with RevMan 5.3 for each outcome, provided that the outcome measures were similar enough and the data reported were sufficient for meta‐analysis (RevMan 2014). We used the fixed‐effect model to pool the data, unless there was substantial heterogeneity among studies, in which case we used the random‐effects model instead. For outcomes inappropriate or impossible to pool quantitatively, we conducted a descriptive analysis and summarised the findings narratively.
We created a 'Summary of findings' table according to the methods described in Section 8.5 and Chapter 12 of theCochrane Handbook for Systematic Reviews of Interventions (Higgins 2011), and by using GRADEpro software (http://gradepro.org/). We had planned to include the following outcomes in the 'Summary of findings' table: self reported quality of life, self reported symptom scores, lung function, asthma medication usage, and adverse events. As lung function can be measured in a number of ways, we decided to include FEV1 (L) change from baseline only in the 'Summary of findings' table. We chose this outcome because we were able to combine the result using natural units (L) aiding interpretation, and because change from baseline scores have a smaller variance.
Subgroup analysis and investigation of heterogeneity
In case of substantial between‐study heterogeneity, we conducted prespecified subgroup analyses according to the following factors to explore the potential source of heterogeneity:
-
Age: adults versus children
-
Gender: male versus female
-
Ethnicity: Asian versus white versus African
-
Severity of asthma: mild versus moderate‐to‐severe, as defined by the Global Initiative for Asthma (Yawn 2008; Global Initiative for Asthma 2011)
-
Yoga subtype: yoga that includes breathing exercises versus other types
-
Duration of intervention: ≤ 1 month versus 1 to 2 months versus > 2 months
We restricted subgroup analyses to the primary outcomes to avoid false‐positive results.
Sensitivity analysis
For the primary outcomes, we conducted sensitivity analyses where possible to assess the robustness of results by excluding studies at high risk of bias. We rated a study as having a high risk of bias when there was high risk of bias in any of the domains of The Cochrane Collaboration's 'Risk of bias' tool. If there was unclear risk of bias in some domains and low risk of bias in the remaining domains, we rated the study as having an unclear risk of bias. Having said that, it should be noted that all thresholds for high or low risk of bias are arbitrary, and studies may lie anywhere on the spectrum from 'free of bias' to 'undoubtedly biased' (Higgins 2011).
Results
Description of studies
Results of the search
We have summarised the results of the literature search and flow of study selection in Figure 2. We initially retrieved 190 records from electronic databases and clinical trials registries. After de‐duplication and reviewing the titles and abstracts, we further evaluated 29 records, finally including 15 studies in this review (Nagarathna 1985; Singh 1990; Fluge 1994; Vedanthan 1998; Cooper 2003; Sabina 2005; Sodhi 2009; Vempati 2009; Mekonnen 2010; Bidwell 2012; Lathadevi 2012; Satpathy 2012; Singh 2012; Kant 2013; Prem 2013). Except for one study (Kant 2013), which was available as an abstract only, we included all eligible studies in a qualitative synthesis. We twice tried to contact the investigators for more detailed data, but received no reply. We manually checked the reference lists of these reports and 10 traditional narrative or systematic reviews related to the topic of this review (Galantino 2008; Burgess 2011; Posadzki 2011; Boehm 2012; O'Connor 2012; Barker 2013; Eichenberger 2013; McCall 2013; Cramer 2014; Lorenc 2014), but identified no additional eligible studies.

Study flow diagram.
Included studies
See: Characteristics of included studies.
All studies were individually randomised, parallel‐group trials, except for one cross‐over trial (Singh 1990). Eight studies were from India (Nagarathna 1985; Sodhi 2009; Vempati 2009; Lathadevi 2012; Satpathy 2012; Singh 2012; Kant 2013; Prem 2013), three from the USA (Vedanthan 1998; Sabina 2005; Bidwell 2012), two from the UK (Singh 1990; Cooper 2003), one from Germany (Fluge 1994, published in German), and one from Ethiopia (Mekonnen 2010). We included 15 studies involving a total of 1048 participants. The number of included participants varied from 17 in the Vedanthan 1998 study to 276 in the Kant 2013 study.
Most studies were conducted in adults only. Two studies involved some children and adolescents, but the numbers of these participants were not reported, and there was no stratified analysis by age group (Nagarathna 1985; Mekonnen 2010). Two studies included male participants only (Lathadevi 2012; Satpathy 2012), one study included female participants only (Bidwell 2012), and the remaining studies included both sexes, with no preference. In two studies, most or all of the participants were white (Singh 1990; Sabina 2005), in one study, all participants were African (Mekonnen 2010), and the remaining studies did not report the ethnic composition of participants.
Where reported, asthma was diagnosed on the basis of objective pulmonary criteria (Nagarathna 1985; Singh 1990; Vedanthan 1998; Cooper 2003; Sabina 2005; Vempati 2009; Singh 2012; Prem 2013). Eleven studies reported the severity of asthma, which was mild in three studies (Singh 1990; Mekonnen 2010; Lathadevi 2012), mild‐to‐moderate in seven studies (Vedanthan 1998; Sabina 2005; Sodhi 2009; Vempati 2009; Bidwell 2012; Singh 2012; Kant 2013), and varied in one study (Fluge 1994). The mean duration of asthma varied from six months, in Sabina 2005, to 23 years, in Cooper 2003.
Five studies included yoga breathing alone (Singh 1990; Cooper 2003; Sodhi 2009; Satpathy 2012; Prem 2013); the other studies assessed yoga interventions that included breathing, postures, and meditation. In two studies including yoga breathing alone, a medical device called 'Pink City Lung Exerciser' was used to mimic the typical patterns of yoga breathing (Singh 1990; Cooper 2003). The duration of yoga intervention varied from two weeks to 54 months; it was no more than one month in five studies (Singh 1990; Fluge 1994; Sabina 2005; Vempati 2009; Mekonnen 2010), one to two months in five studies (Sodhi 2009; Bidwell 2012; Lathadevi 2012; Satpathy 2012; Singh 2012), and more than two months in the remaining five studies (Nagarathna 1985; Vedanthan 1998; Cooper 2003; Kant 2013; Prem 2013). In most studies, the outcomes were measured immediately after the completion of the intervention.
For the control groups, two studies used placebo ("placebo Pink City Lung Exerciser") (Singh 1990; Cooper 2003), one study used sham yoga (stretching) (Sabina 2005), and six studies used usual care (Nagarathna 1985; Fluge 1994; Bidwell 2012; Satpathy 2012; Kant 2013; Prem 2013). In one study (Lathadevi 2012), from which "patients having other lung diseases, tuberculosis, smokers, and acute exacerbation of asthmatic attack were excluded", "all the medications were fully stopped during the study", which, according to the reports, was applicable to the control group. In another study (Vempati 2009), the control group was offered a single session of health education relevant to their illness. We consider such a session negligible as compared to the two‐week intensive yoga practiced by the intervention group. This study was thus still included under the category of yoga versus usual care. Four studies did not report the control group intervention (Vedanthan 1998; Sodhi 2009; Mekonnen 2010; Singh 2012).
Lathadevi 2012 reported that "all the medications were fully stopped during the study", while another 12 studies explicitly allowed routine medication use (Nagarathna 1985; Singh 1990; Vedanthan 1998; Cooper 2003; Sabina 2005; Sodhi 2009; Vempati 2009; Mekonnen 2010; Satpathy 2012; Singh 2012; Kant 2013; Prem 2013). The remaining two studies reported that the control groups received standard or usual care (Fluge 1994; Bidwell 2012), which would presumably include routine medication use, but there was no mention of whether or not the yoga groups received asthma medication during the study. None of the included studies specified whether or not the participants were on comprehensive medication programs or whether the spirometry data were taken before or after use of asthma medication.
Excluded studies
See: Characteristics of excluded studies.
We excluded six studies that did not randomise, three for ineligible interventions, two for ineligible controls, and one for ineligible outcomes. Of the three studies excluded for ineligible interventions, one used the Buteyko technique (Cowie 2008), one used the Papworth method (Holloway 2007), and the remaining study used yoga as part of a multimodal intervention only (Kligler 2011). In the two studies excluded for ineligible controls, the control groups used relaxation methods, group discussion, and cognitive behaviour therapy, in Manocha 2002, or practiced meditation, in Saxena 2009, making the net comparison of intervention versus control not yoga alone. One study assessed the effects of yoga on biochemical profiles (Agnihotri 2014), which was not relevant to this review. The results on relevant outcomes from that study were reported by Kant 2013, which has already been included.
Risk of bias in included studies
Our judgements of risk of bias on the included studies and support for these judgements are shown in the Characteristics of included studies table. The assessment results are presented graphically in Figure 1. Briefly, we judged one study to be at low risk of bias in all domains (Cooper 2003), with the remainder as at either high or unclear risk of bias in at least one domain. We judged the overall risk of bias in the data for this review to be high, regardless of the outcome. We have provided details below. We have described the quality of evidence for different outcomes according to the Grading of Recommendations Assessment, Development and Evaluation (GRADE) Working Group (Guyatt 2008), which incorporates risk of bias and several other factors into one single grade; more detail on this is found under Quality of the evidence and is summarised in the summary of findings Table for the main comparison.
Allocation
Two studies explicitly reported that the random sequence used was generated by a computer (Cooper 2003; Sabina 2005), and were thus judged to be at low risk of bias for this domain. We judged one study using flawed randomisation to be at high risk of selection bias (Nagarathna 1985). None of the other studies provided details on random sequence generation, and were thus judged to be at unclear risk of bias for this domain. Random numbers for allocation were contained in sealed envelopes in three studies (Cooper 2003; Sabina 2005; Prem 2013). For these studies, we judged the risk of bias arising from allocation concealment issue to be low. The other studies did not mention allocation concealment, and were thus judged to be at unclear risk of bias for this domain.
Blinding
Two placebo‐ or sham intervention‐controlled studies were described as "double‐blind" (Singh 1990; Sabina 2005), and in another placebo‐controlled study, participants and outcome assessors were blinded (Cooper 2003). We judged these studies to be at low risk of detection and performance bias. Two open‐label studies only assessed lung function measures and were therefore considered to be at high risk of performance bias (Lathadevi 2012; Satpathy 2012), as participants' awareness of group assignment may have subconsciously affected their performance on these tests, but were judged to be at low risk for detection bias. The remaining studies were open‐label and did not describe measures to blind outcomes assessors and were therefore considered to be at high risk of both performance and detection bias.
We acknowledge that some subjective outcome measures, such as quality of life, are more prone to performance bias than other more objective measures, such as adverse events and lung function. In addition, we recognise that in the case of participant‐reported outcomes, such as asthma control or medication usage, the participant is the outcome assessor and therefore these outcomes are at high risk of detection bias in studies in which the participants were aware of group assignment, even if the trial outcome assessor was not. We have taken these considerations into account when assessing our confidence in the evidence presented.
Incomplete outcome data
We judged the studies with no dropouts (Vedanthan 1998; Mekonnen 2010; Lathadevi 2012), those with low drop‐out rates (Nagarathna 1985; Singh 1990; Vempati 2009; Singh 2012; Prem 2013), and those with high drop‐out rates and similar reasons for dropouts between the two groups (Cooper 2003), to be at a low risk of attrition bias. One study reported a low drop‐out rate (3 of 12 in the control group, 3 of 24 in total) (Fluge 1994), but the dropouts were all related to asthma, and so this study was thus judged to be at a high risk of attrition bias. We also assessed Sabina 2005 to be at high risk of bias as drop‐out was unbalanced, with more participants withdrawing from the control arm. The remaining studies provided no information on dropouts and were thus judged to be at an unclear risk of attrition bias (Sodhi 2009; Bidwell 2012; Kant 2013).
Selective reporting
We judged three studies to be at a high risk of reporting bias for not providing details on outcomes that were said to be investigated in the protocol (Sabina 2005; Bidwell 2012; Prem 2013); the other studies did not have this problem.
Other potential sources of bias
Frequent 'errors' or inconsistencies within a paper, which could also be due to bias from the other domains of The Cochrane Collaboration's 'Risk of bias' tool, could lead to concerns about study quality. We judged three studies to be at a high risk of other bias based on an assessment of the overall quality of the papers (Sabina 2005; Mekonnen 2010; Singh 2012).
Effects of interventions
See: Summary of findings for the main comparison
The extracted and transformed data from eligible studies are shown in detail in Appendix 4.
Primary outcomes
1. Quality of life
Eight studies of 736 participants assessed the impact of yoga on quality of life (Cooper 2003; Sabina 2005; Sodhi 2009; Vempati 2009; Bidwell 2012; Singh 2012; Kant 2013; Prem 2013). One study used St. George's Respiratory Questionnaire (Bidwell 2012); six studies used the Asthma Quality of Life Questionnaire (AQLQ)(Cooper 2003; Sodhi 2009; Vempati 2009; Singh 2012; Kant 2013; Prem 2013); and one study used the Mini Asthma Quality of Life Questionnaire(Sabina 2005). We included five studies using the AQLQ for meta‐analysis (Sabina 2005; Sodhi 2009; Vempati 2009; Singh 2012; Prem 2013). There was no substantial statistical heterogeneity among studies (I2 = 37%, P = 0.17). The fixed‐effect summary mean difference (MD) was 0.57 units on a 7‐point scale (95% confidence interval (CI) 0.37 to 0.77; 5 studies; 375 participants; Figure 3), indicating that yoga improved the quality of life of people with asthma. Among the studies not suitable for meta‐analysis, Kant 2013 (n = 276) reported that there was a significant improvement in AQLQ scores in the yoga group compared with the control group (P < 0.001), but provided no details; Bidwell 2012 (n = 19) reported no differences in St. George's Respiratory Questionnaire scores between groups at baseline, but found that the yoga group demonstrated a decreased score (‐13.49, equal to 45% improvement) compared to the control group (4.85) (difference: P < 0.05); and Cooper 2003 (n = 59) reported that the median change in AQLQ from baseline was 0.57 (interquartile range: 0.07 to 1.10) in the yoga group and 0.61 (interquartile range: ‐0.11 to 0.95) in the control group, with no significant difference between groups (P = 0.2).
![Forest plot of comparison: 1 Yoga vs usual care/sham intervention, outcome: 1.1 Change in AQLQ score [7 pt scale].](/cdsr/doi/10.1002/14651858.CD010346.pub2/media/CDSR/CD010346/image_n/nCD010346-AFig-FIG03.png)
Forest plot of comparison: 1 Yoga vs usual care/sham intervention, outcome: 1.1 Change in AQLQ score [7 pt scale].
2. Symptoms
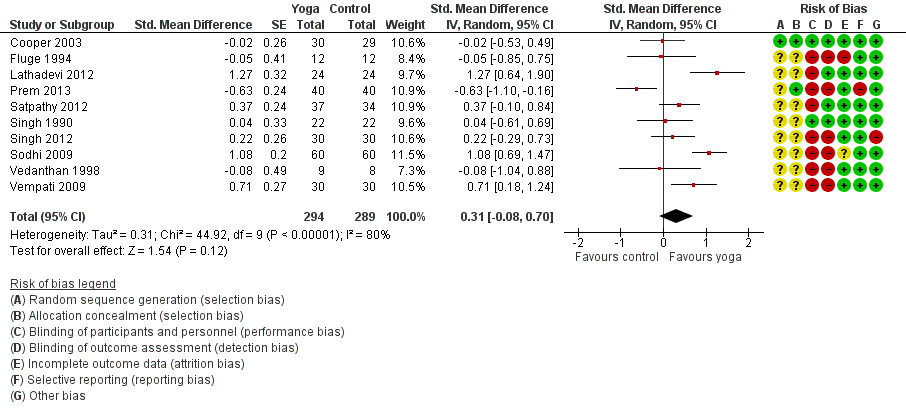
Seven studies assessed the impact of yoga on asthma symptoms (Nagarathna 1985; Singh 1990; Vedanthan 1998; Cooper 2003; Sabina 2005; Sodhi 2009; Kant 2013). Four studies used symptom score (Singh 1990; Cooper 2003; Sabina 2005; Kant 2013), while the other studies used different severity scores. We included three studies for meta‐analysis (Nagarathna 1985; Vedanthan 1998; Sodhi 2009). There was no substantial statistical heterogeneity among studies (I2 = 0%, P = 0.54). The fixed‐effect summary standardised mean difference (SMD) was 0.37 (95% CI 0.09 to 0.65; 3 studies; 243 participants; Figure 4), indicating that yoga improved symptoms of people with asthma. Among the studies not suitable for meta‐analysis, Kant 2013 (n = 276) and Sabina 2005 (n = 62) reported that there was a significant improvement in asthma symptoms in the yoga group compared to the control group, but provided no details; Cooper 2003 (n = 59) reported that the median change in symptom score from baseline was ‐1 (interquartile range: ‐2 to 0.75) in the yoga group and 0 (interquartile range: ‐1 to 1) in the control group, with a significant difference between groups in favour of yoga (P = 0.003). Singh 1990 (n = 22) reported that the difference in change from baseline of the geometric mean of symptom score (doubling increments) was ‐0.06 (95% CI ‐0.45 to 0.32), indicating no significant difference between groups.

Forest plot of comparison: 1 Yoga vs usual care/sham intervention, outcome: 1.2 Asthma symptom.
Secondary outcomes
1. Asthma control
Four studies assessed the impact of yoga on asthma control (Nagarathna 1985; Sodhi 2009; Mekonnen 2010; Prem 2013). One study used the Asthma Control Questionnaire (Prem 2013), while the other three studies used number of attacks of asthma as the outcome measure (Nagarathna 1985; Sodhi 2009; Mekonnen 2010). As the results of the only two studies that were potentially suitable for meta‐analysis were highly heterogeneous (I2 = 98%) (Nagarathna 1985; Sodhi 2009), we did not combine the studies. The MD in change of number of attacks of asthma from baseline between groups was 1.92 (95% CI 1.52 to 2.32) in Nagarathna 1985 (n = 106) and 0.20 (95% CI 0.07 to 0.33) in Sodhi 2009 (n = 120), respectively, both indicating that yoga improved asthma control in people with asthma. Mekonnen 2010 (n = 24) reported that both day and night attacks of asthma were significantly reduced by yoga, while no such effects were observed in the control group (P < 0.001 for both), but provided no details. Prem 2013 (n = 80) reported that the mean change in Asthma Control Questionnaire from baseline was not significant in either the yoga group (0.13, 95% CI ‐0.15 to 0.41; P = 0.356) or the control group (0.11, 95% CI ‐0.14 to 0.37; P = 0.383).
2. Lung function
(1) Forced expiratory volume in one second (FEV1)
Twelve studies assessed the impact of yoga on FEV1 (Singh 1990; Fluge 1994; Vedanthan 1998; Cooper 2003; Sabina 2005; Sodhi 2009; Vempati 2009; Bidwell 2012; Lathadevi 2012; Satpathy 2012; Singh 2012; Prem 2013). Three studies measured the changes in percentage of predicted value (Fluge 1994; Sodhi 2009; Vempati 2009), while the other studies directly measured the changes in volume (in L). We included 10 of the studies for meta‐analysis (Singh 1990; Fluge 1994; Vedanthan 1998; Cooper 2003; Sodhi 2009; Vempati 2009; Lathadevi 2012; Satpathy 2012; Singh 2012; Prem 2013). There was substantial statistical heterogeneity among studies (I2 = 80%, P < 0.00001).
The random‐effects summary was SMD 0.31 (95% CI ‐0.08 to 0.70; 10 studies; 561 participants; Figure 5), indicating that evidence that yoga improved FEV1 in people with asthma was insufficient. The two studies not suitable for meta‐analysis, Sabina 2005 (n = 62) and Bidwell 2012 (n = 19), also reported no significant differences between treatment groups, but provided no details.

Forest plot of comparison: 1 Yoga vs usual care/sham intervention, outcome: 1.3 FEV1.
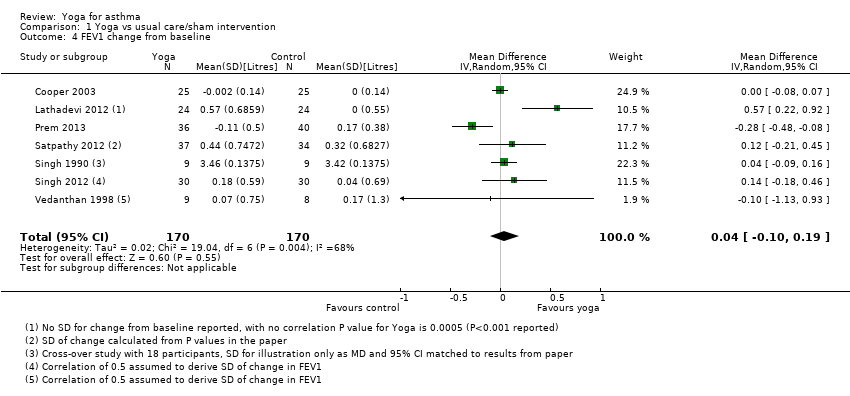
Seven of the studies reported change from baseline in FEV1 in litres, and these have been combined to show the MD in natural units. When analysed in this way, the MD was 0.04 litres (95% CI ‐0.10 to 0.19; 7 studies; 340 participants; Figure 6).
![Forest plot of comparison: 1 Yoga vs usual care/sham intervention, outcome: 1.4 FEV1 change from baseline [litres].](/cdsr/doi/10.1002/14651858.CD010346.pub2/media/CDSR/CD010346/image_n/nCD010346-AFig-FIG06.png)
Forest plot of comparison: 1 Yoga vs usual care/sham intervention, outcome: 1.4 FEV1 change from baseline [litres].
(2) Forced vital capacity (FVC)
Eight studies assessed the impact of yoga on FVC (Vedanthan 1998; Sabina 2005; Sodhi 2009; Vempati 2009; Bidwell 2012; Lathadevi 2012; Satpathy 2012; Singh 2012). Two studies measured the changes in percentage of predicted value (Sodhi 2009; Vempati 2009), while the other studies directly measured the changes in volume (in L). We included six of the studies for meta‐analysis (Vedanthan 1998; Sodhi 2009; Vempati 2009; Lathadevi 2012; Satpathy 2012; Singh 2012). There was substantial statistical heterogeneity among studies (I2 = 77%, P = 0.0005). The random‐effects summary SMD was 0.67 (95% CI 0.20 to 1.14; 6 studies; 376 participants; P = 0.005; Analysis 1.5), indicating that yoga improved FVC of people with asthma. However, the other two studies (Sabina 2005; Bidwell 2012), with a total sample size of 81, reported no significant differences between treatment groups, but provided no details.
(3) FEV1/FVC
Seven studies assessed the impact of yoga on FEV1/FVC (Sabina 2005; Sodhi 2009; Vempati 2009; Lathadevi 2012; Satpathy 2012; Singh 2012; Prem 2013). The unit of FEV1/FVC was percentage (% predicted). We included six of the studies for meta‐analysis (Sodhi 2009; Vempati 2009; Lathadevi 2012; Satpathy 2012; Singh 2012; Prem 2013). There was substantial statistical heterogeneity among studies (I2 = 77%, P = 0.0005). The random‐effects summary MD was 0.62 (95% CI ‐1.63 to 2.87; 6 studies; 435 participants; P = 0.59; Analysis 1.6), indicating that evidence that yoga improved FEV1/FVC of people with asthma was insufficient. The remaining study (Sabina 2005), with a sample size of 62, also reported no significant differences between treatment groups, but provided no details.
(4) Peak expiratory flow rate (PEFR)
Ten studies assessed the impact of yoga on PEFR (Nagarathna 1985; Singh 1990; Vedanthan 1998; Sabina 2005; Sodhi 2009; Vempati 2009; Mekonnen 2010; Bidwell 2012; Lathadevi 2012; Singh 2012). The units of measurement varied widely across studies: L/minute in three studies (Nagarathna 1985; Singh 1990; Vedanthan 1998), L/second in one study (Singh 2012), L in one study (Lathadevi 2012), percentage in two studies (Sodhi 2009; Vempati 2009), and unclear in the remaining three studies. We included seven of the 10 studies for meta‐analysis (Nagarathna 1985; Singh 1990; Vedanthan 1998; Sodhi 2009; Vempati 2009; Lathadevi 2012; Singh 2012). There was substantial statistical heterogeneity among studies (I2 = 68%, P = 0.004). The random‐effects summary SMD was 0.73 (95% CI 0.36 to 1.09; 7 studies; 433 participants; P < 0.0001; Analysis 1.7), indicating that yoga improved PEFR of people with asthma. Three studies reported both morning and evening values of PEFR (Singh 1990; Vedanthan 1998; Singh 2012). In this review, for consistency we used the morning values for meta‐analysis. When the evening values were used instead, the summary SMD did not change significantly (data not shown). Of the three studies not suitable for meta‐analysis, Mekonnen 2010 (n = 24) reported a significant improvement of PEFR after the yoga intervention as compared to control; Bidwell 2012 (n = 19) reported no significant differences between treatment groups; and Sabina 2005 (n = 62) claimed to have investigated PEFR, but did not mention this outcome in their results.
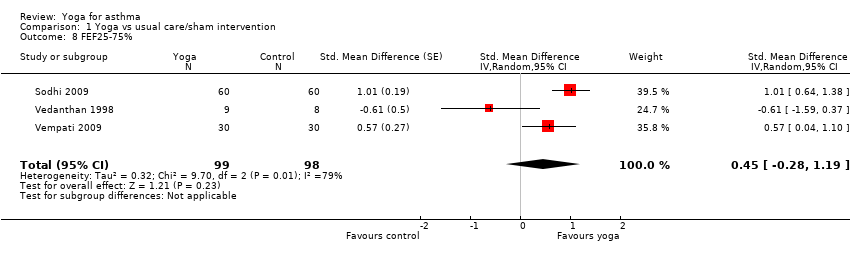
(5) Forced expiratory flow between 25% and 75% of vital capacity (FEF 25‐75%)
Four studies assessed the impact of yoga on FEF 25‐75% (Vedanthan 1998; Sabina 2005; Sodhi 2009; Vempati 2009). Two studies measured the change in percentage of predicted value (Sodhi 2009; Vempati 2009), one measured the changes in volume in L (Sabina 2005), and the remaining study measured the changes over time (L/second) (Vedanthan 1998). We included three of the studies for meta‐analysis (Vedanthan 1998; Sodhi 2009; Vempati 2009). There was substantial statistical heterogeneity among studies (I2 = 79%, P = 0.008). The random‐effects summary SMD was 0.45 (95% CI ‐0.28 to 1.19; 3 studies; 197 participants; P = 0.23; Analysis 1.8), indicating that evidence that yoga improved FEF 25‐75% of people with asthma was insufficient. The study not suitable for meta‐analysis, Sabina 2005 (n = 62), also reported no significant differences between treatment groups, but provided no details.
3. Asthma medication usage
Nine studies assessed the impact of yoga on asthma medication usage (Nagarathna 1985; Singh 1990; Vedanthan 1998; Cooper 2003; Sabina 2005; Sodhi 2009; Vempati 2009; Mekonnen 2010; Kant 2013). The drugs used varied across studies; examples include beta2 agonist inhalers, inhaled steroids, and theophylline. The outcome measures varied across studies as well, including change in dose, days requiring rescue medication use, times per day, drug treatment score, number of participants with decrease in dosage of asthma medication, etc. Meta‐analysis of three studies measuring frequency of medication usage yielded a SMD of 0.69 (95% CI 0.41 to 0.96; 3 studies; 228 participants; P < 0.00001; Analysis 1.9) (Nagarathna 1985; Sabina 2005; Vempati 2009), with no substantial statistical heterogeneity among studies (I2 = 26%, P = 0.26). Meta‐analysis of two studies measuring the percentage of participants with decreasing dosage of asthma medication yielded a risk ratio of 5.35 (95% CI 1.29 to 22.11; 2 studies; 48 participants; P = 0.02; Analysis 1.10), with no statistical heterogeneity among studies (I2 = 0%, P = 0.64). The summary SMD and risk ratio indicated that yoga decreased the use of medication in people with asthma. Among the three studies not suitable for meta‐analysis, Kant 2013 (n = 276) reported that "the rescue medication use has a significant decrease in comparison to control group", but provided no details. Singh 1990 (n = 22) reported that the difference in change from baseline of the geometric mean of inhaler use (doubling increments) was ‐0.10 (95% CI ‐0.37 to 0.17), indicating no significant difference between groups. Cooper 2003 (n = 59) reported that the median change in beta2 agonist use (puffs per day) was 0 (interquartile range: ‐2 to 0) in both yoga and control groups, with no significant difference.
4. Adverse events
Four studies of 188 participants reported investigating adverse events during their trials (Singh 1990; Fluge 1994; Sabina 2005; Prem 2013). In Fluge 1994, three participants from the control group required oral steroids treatment due to acute exacerbations of their asthma, as compared with none in the yoga group, but the investigators argued that this could not be counted as an adverse effect of yoga. Sabina 2005 reported no adverse events associated with yoga or the control. In Singh 1990, one participant in the yoga group using the Pink City Lung Exerciser reported mild dyspnoea during the exercise. Prem 2013 claimed to have recorded adverse events in the protocol, but did not mention this outcome in their results.
Subgroup analysis
We had planned to conduct subgroup analyses for quality of life and asthma symptoms according to age (adults versus children), gender (male versus female), ethnicity, severity of asthma, subtype of yoga, and duration of intervention. For age, only two studies involved children (Nagarathna 1985; Mekonnen 2010), and neither of them stratified analyses by age group. We were thus unable to conduct subgroup analysis according to this factor.
For gender, two studies included male participants only (Lathadevi 2012; Satpathy 2012), and one included female participants only (Bidwell 2012), while the other studies included participants of both genders and did not stratify analyses by gender. Lathadevi 2012 (n = 48) found that yoga could significantly improve FEV1, FVC, and PEFR as compared with control, Satpathy 2012 (n = 71) found that yoga could significantly improve FEV1, FVC, and FEV1/FVC ratio as compared with control, while Bidwell 2012 (n = 19) found no significant differences between treatment groups. However, based on these three small studies, especially considering the small sample size of females in Bidwell 2012, it was difficult to make a valid comparison of the effects of yoga in males with those in females.
For ethnicity, only three studies clearly reported the ethnic composition of their participants, and it was difficult to make a valid comparison of the effects of yoga in different ethnic groups. However, as most studies were from either India or Western countries, we argue that subgroup analyses according to geographical areas of studies may to some extent reflect the difference in effects of yoga, if any, in different ethnic populations. Based on the three Indian studies with relevant data (Sodhi 2009; Vempati 2009; Prem 2013), the MD in change of quality of life from baseline between yoga and control groups was 0.47 (95% CI 0.35 to 0.59), and the corresponding result based on two Western studies was 0.83 (95% CI 0.39 to 1.28) (P for subgroup difference: 0.12). For asthma symptoms, the SMD based on the two Indian studies was 0.38 (95% CI 0.09 to 0.67) (Nagarathna 1985; Sodhi 2009), and the corresponding result from the Western study was 0.28 (95% CI ‐0.68 to 1.24) (P for subgroup difference: 0.85) (Vedanthan 1998).
All studies that specified severity of asthma included mild or mild‐to‐moderate asthma, and none of them conducted subgroup analysis according to asthma severity. It was thus impossible for us to conduct subgroup analysis according to severity of asthma.
For subtype of yoga, we conducted separate analyses for studies that included yoga breathing alone and those that included yoga breathing, posture, and meditation together. We did not find strong evidence that a yoga intervention consisting of breathing, posture, and meditation led to greater improvements in quality of life (MD 0.85 7‐point scale, 95% CI 0.47 to 1.22) as compared with yoga breathing alone (MD 0.46 7‐point scale, 95% CI 0.23 to 0.69). The difference was not statistically significant and should be interpreted cautiously, as there were numerous differences between the studies (P for subgroup difference: 0.09; Figure 3).
For the duration of the intervention, the results of subgroup analyses showed little difference in the quality of life improvement with the yoga intervention at less than one month (MD 0.60 7‐point scale, 95% CI 0.09 to 1.11) (Sabina 2005; Vempati 2009), at one to two months (MD 0.58 7‐point scale, 95% CI 0.34 to 0.82) (Sodhi 2009; Singh 2012), and at more than two months (MD 0.50 7‐point scale, 95% CI 0.02 to 0.98) (Prem 2013). Similarly, we observed no subgroup difference for asthma symptoms.
Sensitivity analysis
We had planned to conduct sensitivity analyses to examine whether risk of bias would affect the results of our meta‐analyses. However, as the only study with a low risk of bias was not included in the meta‐analysis for quality of life or asthma symptoms (Cooper 2003), we did not conduct the pre‐planned sensitivity analyses. As suggested by the peer referees, we also compared the results of studies in which the control group received placebo or sham intervention (Singh 1990; Cooper 2003; Sabina 2005), with those of studies in which participants in the control group received usual care only. Cooper 2003 and Sabina 2005 investigated asthma quality of life. The results of both studies were statistically insignificant, unlike the other six studies contributing to this outcome, which did not have a sham or placebo control (Sodhi 2009; Vempati 2009; Bidwell 2012; Singh 2012; Kant 2013; Prem 2013). The three placebo/sham intervention‐controlled studies all investigated asthma symptoms. The results of Singh 1990 (n = 22) were statistically insignificant, but Cooper 2003 (n = 59) and Sabina 2005 (n = 62), which had larger sample sizes, both yielded similar results to the other four studies on this outcome (Nagarathna 1985; Vedanthan 1998; Sodhi 2009; Kant 2013).
Discussion
Summary of main results
This review included 15 RCTs with a total of 1048 participants to evaluate the effects of yoga in people with asthma. There was some evidence that yoga may improve quality of life (MD in Asthma Quality of Life Questionnaire score per item 0.57 units on a 7‐point scale, 95% CI 0.37 to 0.77; 5 studies; 375 participants), symptoms (SMD 0.37, 95% CI 0.09 to 0.65; 3 studies; 243 participants), forced vital capacity (SMD 0.67, 95% CI 0.20 to 1.14; 6 studies) and peak expiratory flow rate (SMD 0.73, 95% CI 0.36 to 1.09; 7 studies), and reduce medication usage (SMD 0.69, 95% CI 0.41 to 0.96; 3 studies) (risk ratio for decreasing dosage 5.35, 95% CI 1.29 to 22.11; 2 studies) in people with asthma. The effects of yoga on forced expiratory volume in one second (SMD 0.31, 95% CI ‐0.08 to 0.70; 10 studies; 561 participants) were not statistically significant. None of the studies reported serious adverse events associated with yoga, but the data on this outcome was very limited.
However, the following issues must be considered in interpreting the above results. First, while the improvement in Asthma Quality of Life Questionnaire score by yoga exceeded the minimal clinically important difference (MCID) (0.5 unit per item) (Juniper 1994; Jones 2002; Bateman 2015), the two trials that included a placebo or sham intervention found no difference (Cooper 2003; Sabina 2005). For symptom score, the other primary outcome of this review, the improvement by yoga was equivalent to 0.37 standard deviation units of the severity scores used; however, whether or not it was clinically important is uncertain, as no established MCID for those severity scores is available. Second, most of the included trials were at high risk of bias for one or more domains, especially those related to blinding. Sensitivity analyses indicated that the results of meta‐analyses were not robust against bias. Third, we observed substantial heterogeneity in all meta‐analyses about lung functions. Fourth, the data on adverse events of yoga was very limited. The evidence presented here suggests that while yoga may improve a number of outcomes for people with asthma, the problems described preclude us from drawing a firm conclusion. The findings of this review are at best preliminary and suggestive and should be interpreted cautiously.
Overall completeness and applicability of evidence
The outcomes evaluated in this review were comprehensive. We assessed both efficacy and safety, and included both participant‐reported and physiological measures. Several studies were available for meta‐analysis for each outcome. However, one study that investigated all the outcomes of our interest was available as abstract only (Kant 2013), with no details available in spite of our efforts to contact the investigators. Data on lung function measured by spirometry were not reported in detail in another two studies (Sabina 2005; Bidwell 2012). In addition, data on adverse events was not available from one study (Prem 2013). The evidence summarised in this review is thus considered incomplete.
The studies included in this review were mostly from India, followed by Western countries. The ethnic populations represented by them are presumably different. However, subgroup analyses according to country of study failed to show any significant difference in the effects of yoga between India and Western countries. There is thus currently no evidence to suggest that the results of this review are only applicable to particular ethnic populations. As most studies included both males and females without preference, and evidence to suggest that the effects of yoga vary with gender was insufficient, we cannot conclude that the applicability of results of this review would be limited by gender.
As most studies were conducted in adults, whether the evidence summarised here is generalisable to children or adolescents is open to question. In addition, the majority of studies included people with mild or mild‐to‐moderate asthma only; thus, whether the evidence is applicable to people with severe asthma is also unclear.
Most of the included studies allowed the use of asthma medication. As meta‐analyses showed that yoga may lead to reduced medication use, the improvement (if any) in outcomes in the yoga groups were less likely to be a result of asthma medication use, but more likely to be caused by yoga or other factors (for example bias). However, most studies provided no details of the medical regimens used, which could vary across studies. In addition, only one study explicitly reported that all drugs were fully stopped during the study (Lathadevi 2012). It thus remains uncertain whether the evidence summarised in this review is applicable to different settings in terms of medical regimens.
Due to the different outcome measures used by different studies, we had to use SMD in the meta‐analyses. However, SMD itself is difficult to interpret and conveys no information on the absolute effects of practicing yoga. This may limit the applicability of evidence to some extent. In addition, the effects of yoga were assessed immediately after the intervention in most of the existing studies, so we cannot comment on whether any of the potential benefits identified were sustained.
Quality of the evidence
The studies included in this review were all RCTs. According to the GRADE Working Group (Guyatt 2008), there are five factors that may decrease the quality of evidence from RCTs: study limitations, inconsistency of results, indirectness of evidence, imprecision, and publication bias. In this review, study limitations are mainly reflected by risk of bias, which we judged to be high for all outcomes. This could lead to distorted results by reducing the comparability of participants between treatment groups (selection bias), influencing the performance of participants and clinicians (performance bias), etc. We thus downgraded the quality of evidence on every outcome due to risk of bias (see summary of findings Table for the main comparison). Inconsistency of results is mainly reflected by between‐study heterogeneity. In this review, we observed substantial heterogeneity in the meta‐analyses for asthma control and lung functions, but not in the meta‐analyses for other outcomes. We thus downgraded the quality of evidence on asthma control and lung functions for 'inconsistency'. As this review contains no indirect comparison of yoga with control, we did not consider indirectness of evidence to be a major problem. Imprecision of results is often seen in the scenario where the point estimate indicates a likely beneficial or harmful effect while the confidence interval is wide, usually crossing the null‐effect line. This problem is mainly caused by limited data available for an outcome, either because few studies investigated the outcome or because the outcome itself is rare. In this review, we downgraded the quality of evidence on forced expiratory volume in one second, reduction in asthma medication usage, and adverse events for 'imprecision'. Publication bias is usually judged by visual inspection of funnel plots. As the number of studies in all meta‐analyses of this review was no more than 10, we did not construct funnel plots (which would have very limited statistical power in this case) to detect publication bias. It is thus difficult to conclude whether publication bias existed or not. However, we judged there to be a high risk of publication bias for adverse events, due to no mention of adverse events in Prem 2013 (which were specified explicitly as one of the outcomes of interest in their research protocol). In summary, we have graded the quality of evidence on different outcomes in this review as moderate to very low.
Potential biases in the review process
There are several sources of potential bias in the review process. First, as mentioned above, data on lung function and adverse events were not available from some studies. Such missing data could be important to the overall results. Second, some studies did not report the within‐group pre‐post changes (mean and standard deviation) of outcomes, which we had to estimate based on the reported data, such as baseline and postintervention values. Some of the estimates might not be sufficiently accurate, and thus could have influenced the summary estimates of meta‐analyses to some extent. Third, as mentioned above, due to the limited number of studies available for each meta‐analysis, we did not construct funnel plots, and thus cannot exclude the possibility of publication bias.
Agreements and disagreements with other studies or reviews
To our knowledge, two systematic reviews on the effects of yoga for asthma have been published (Posadzki 2011; Cramer 2014). Posadzki 2011 included seven trials. Among them was Manocha 2002, which we excluded for irrelevant control group (see the Characteristics of excluded studies). We included all the remaining six trials identified by Posadzki 2011 in the present review. However, Posadzki 2011 did not include two studies fulfilling its inclusion criteria and published before its time of literature search (October 2010) (Singh 1990; Cooper 2003). The other seven studies included in this review but not in Posadzki 2011 were all published later than its time of literature search.
Cramer 2014 included 14 trials. It included Manocha 2002 and Saxena 2009, both of which we excluded for irrelevant control groups (see the Characteristics of excluded studies). However, Cramer 2014 missed three studies that met their inclusion criteria (Lathadevi 2012; Satpathy 2012; Kant 2013).
There are three possible explanations for the difference in included studies between this review and the previous two reviews. First, the inclusion criteria are different. In this review, we considered only studies with a net comparison of yoga versus placebo or no treatment to be eligible, while the previous two reviews also included trials comparing yoga with behavioural intervention or meditation. Second, our time of literature search is more recent than that of the previous two reviews, so that we were more likely to identify a larger number of studies. Third, the previous two reviews could have missed some eligible studies due to the limitations in their search strategy or screening process, or both.
Posadzki 2011 did not conduct meta‐analyses, without offering any reasons, and just presented the results of different studies narratively. Considering that it included a much smaller number of studies than the present review and that it was not based on quantitative synthesis of existing data, we think Posadzki 2011's findings about the effects of yoga for asthma are not directly comparable to ours. Cramer 2014 found some evidence that yoga may improve quality of life, asthma control, asthma symptoms, and lung functions, which is similar to this review. However, Posadzki 2011, Cramer 2014, and the present review all recognised the low quality of existing trials and emphasised the need for more rigorous studies with larger sample sizes to confirm the effects of yoga for asthma.
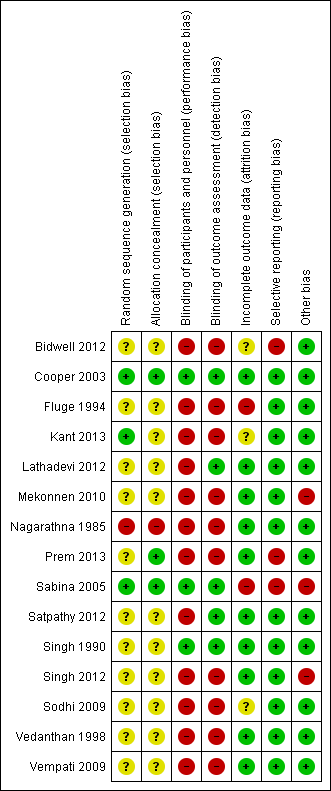
Risk of bias summary: review authors' judgements about each risk of bias item for each included study.

Study flow diagram.
![Forest plot of comparison: 1 Yoga vs usual care/sham intervention, outcome: 1.1 Change in AQLQ score [7 pt scale].](/es/cdsr/doi/10.1002/14651858.CD010346.pub2/media/CDSR/CD010346/image_n/nCD010346-AFig-FIG03.png)
Forest plot of comparison: 1 Yoga vs usual care/sham intervention, outcome: 1.1 Change in AQLQ score [7 pt scale].

Forest plot of comparison: 1 Yoga vs usual care/sham intervention, outcome: 1.2 Asthma symptom.
Forest plot of comparison: 1 Yoga vs usual care/sham intervention, outcome: 1.3 FEV1.
![Forest plot of comparison: 1 Yoga vs usual care/sham intervention, outcome: 1.4 FEV1 change from baseline [litres].](/es/cdsr/doi/10.1002/14651858.CD010346.pub2/media/CDSR/CD010346/image_n/nCD010346-AFig-FIG06.png)
Forest plot of comparison: 1 Yoga vs usual care/sham intervention, outcome: 1.4 FEV1 change from baseline [litres].

Comparison 1 Yoga vs usual care/sham intervention, Outcome 1 Change in AQLQ score.

Comparison 1 Yoga vs usual care/sham intervention, Outcome 2 Asthma symptom.

Comparison 1 Yoga vs usual care/sham intervention, Outcome 3 FEV1.
Comparison 1 Yoga vs usual care/sham intervention, Outcome 4 FEV1 change from baseline.

Comparison 1 Yoga vs usual care/sham intervention, Outcome 5 FVC.

Comparison 1 Yoga vs usual care/sham intervention, Outcome 6 FEV1/FVC.
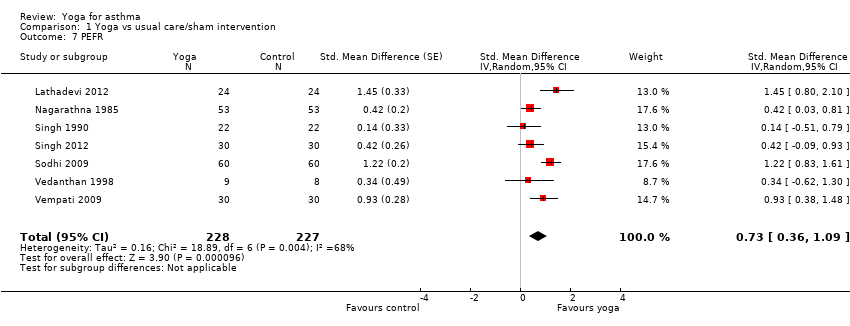
Comparison 1 Yoga vs usual care/sham intervention, Outcome 7 PEFR.
Comparison 1 Yoga vs usual care/sham intervention, Outcome 8 FEF25‐75%.
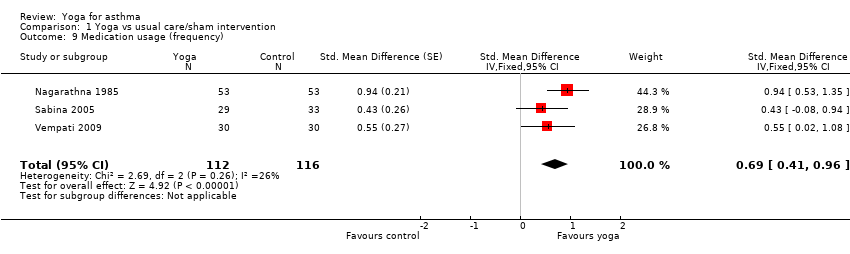
Comparison 1 Yoga vs usual care/sham intervention, Outcome 9 Medication usage (frequency).

Comparison 1 Yoga vs usual care/sham intervention, Outcome 10 Medication usage (percentage of participants with decreasing dosage).
| Yoga compared with usual care or sham intervention for asthma | ||||||
| Patient or population: People with asthma (mostly mild or moderate) Settings: Outpatient clinic and at home (studies conducted in Ethiopia, Germany, India, UK, and USA) Intervention: Yoga (duration no more than 6 months on average; range 2 weeks to 54 months) Comparison: Usual care or sham intervention | ||||||
| Outcomes | Illustrative comparative risks* (95% CI) | Relative effect | No of Participants | Quality of the evidence | Comments | |
| Assumed risk | Corresponding risk | |||||
| Usual care or sham intervention | Yoga | |||||
| Quality of life (Asthma Quality of Life Questionnaire, with 32 items, 0 to 7 points per item) | The mean points per item of Asthma Quality of Life Questionnaire ranged from 4.06 to 4.50 points across control groups | The mean change from baseline in the intervention groups was on average 0.57 units higher (95% CI 0.37 to 0.77) | ‐ | 375 (5) | ⊕⊕⊕⊖ moderate1 | Minimal clinically important difference: 0.5 |
| Asthma symptoms (different severity scores; change from baseline) | The mean severity score ranged from 0.83 to 1.05 points across control groups on different scales | The mean severity score in the intervention groups was on average 0.37 SD units lower (95% CI 0.09 to 0.65) | ‐ | 243 (3) | ⊕⊕⊕⊖ moderate2 | Lower score indicates improvement Nagarathna 1985 and Sodhi 2009a used a 3‐point scoring system for severity of asthma symptoms from 1 (mild) to 3 (severe) Vedanthan 1998 used a 5‐point scoring system from A (no symptoms) to E (very severe symptoms). No established minimal clinically important difference in these scores is available |
| Asthma control (weekly number of attacks) | The mean weekly number of attacks ranged cross control groups from 0.58 to 2.10 | See comment | ‐ | 226 (2) | ⊕⊕⊖⊖ low3 | Two studies showed benefit, but the results were not combined due to very high heterogeneity between them |
| Forced expiratory volume in one second (change from baseline FEV1 (L)) | The mean FEV1 ranged across control groups from 2.24 to 4.19 L | The mean FEV1 in the intervention groups was on average 0.04 L higher (95% CI ‐0.10 to 0.19) | ‐ | 340 (7) | ⊕⊖⊖⊖ very low4 | ‐ |
| Reduced asthma medication usage | 8 per 100 | 43 per 100 (11 to 100) | RR 5.35 (1.29 to 22.11) | 48 (2) | ⊕⊕⊖⊖ low5 | ‐ |
| Adverse events | ‐ | ‐ | ‐ | 108 (3) | ⊕⊖⊖⊖ very low6 | Fluge 1994 reported 3 participants from the control group required oral steroids treatment due to acute exacerbations of their asthma, as compared with none in the yoga group. Sabina 2005 reported no adverse events associated with yoga or the control. In Singh 1990, 1 participant in the yoga group reported mild dyspnoea during yoga using the Pink City Lung Exerciser |
| *The basis for the assumed risk (e.g. the median control group risk across studies) is provided in footnotes. The corresponding risk (and its 95% confidence interval) is based on the assumed risk in the comparison group and the relative effect of the intervention (and its 95% CI). | ||||||
| GRADE Working Group grades of evidence | ||||||
| 1Downgraded once for study limitations; four out of five studies contributing to this outcome are at high risk of performance and detection bias, and one study is at high risk of attrition bias (see Figure 1). 2Downgraded once for study limitations; all three studies contributing to this outcome are at high risk of performance and detection bias, and one study is at high risk of selection bias (see Figure 1). 3Downgraded for (1) study limitations: both studies contributing to this outcome are at high risk of performance and detection bias, and one study is also at high risk of selection bias (see Figure 1), and (2) inconsistency: the studies could not be combined in a meta‐analysis due to very high levels of heterogeneity. 4Downgraded for (1) study limitations: six out of the seven studies contributing to this outcome are at unclear risk of selection bias (see Figure 1), (2) inconsistency: we detected substantial heterogeneity (I² = 68%) in the meta‐analysis, and (3) imprecision: the confidence intervals include both the possibility of harm or benefit of the intervention. 5Downgraded for (1) study limitations: both studies contributing to this outcome are at high risk of performance and detection bias and at unclear risk of selection bias, and one study is at high risk of other biases (see Figure 1), and (2) imprecision: despite the confidence intervals excluding no difference, the breadth of the confidence intervals and the small numbers of participants in the analysis reduces our confidence in the estimate. 6Downgraded for (1) study limitations: one study reporting adverse events is at high risk of performance, detection, and attrition bias, another is at high risk of attrition and reporting bias, and a third is at unclear risk of selection bias (see Figure 1), (2) imprecision: the very small number of studies reporting very rare events reduced our confidence in this outcome, and (3) potential publication bias due to no mention of adverse events (which were specified explicitly as one of the outcomes of interest in their research protocol) in Prem 2013. We decided not to pool these results. | ||||||
| Outcome or subgroup title | No. of studies | No. of participants | Statistical method | Effect size |
| 1 Change in AQLQ score Show forest plot | 5 | 375 | Mean Difference (IV, Fixed, 95% CI) | 0.57 [0.37, 0.77] |
| 1.1 Yoga breathing alone vs. control | 2 | 196 | Mean Difference (IV, Fixed, 95% CI) | 0.46 [0.23, 0.69] |
| 1.2 Combination of yoga breathing, postures and meditation vs. control | 3 | 179 | Mean Difference (IV, Fixed, 95% CI) | 0.85 [0.47, 1.22] |
| 2 Asthma symptom Show forest plot | 3 | 218 | Std. Mean Difference (Fixed, 95% CI) | 0.37 [0.09, 0.65] |
| 3 FEV1 Show forest plot | 10 | 583 | Std. Mean Difference (Random, 95% CI) | 0.31 [‐0.08, 0.70] |
| 4 FEV1 change from baseline Show forest plot | 7 | 340 | Mean Difference (IV, Random, 95% CI) | 0.04 [‐0.10, 0.19] |
| 5 FVC Show forest plot | 6 | 376 | Std. Mean Difference (Random, 95% CI) | 0.67 [0.20, 1.14] |
| 6 FEV1/FVC Show forest plot | 6 | 435 | Mean Difference (IV, Random, 95% CI) | 0.62 [‐1.63, 2.87] |
| 7 PEFR Show forest plot | 7 | 455 | Std. Mean Difference (Random, 95% CI) | 0.73 [0.36, 1.09] |
| 8 FEF25‐75% Show forest plot | 3 | 197 | Std. Mean Difference (Random, 95% CI) | 0.45 [‐0.28, 1.19] |
| 9 Medication usage (frequency) Show forest plot | 3 | 228 | Std. Mean Difference (Fixed, 95% CI) | 0.69 [0.41, 0.96] |
| 10 Medication usage (percentage of participants with decreasing dosage) Show forest plot | 2 | 48 | Risk Ratio (M‐H, Fixed, 95% CI) | 5.35 [1.29, 22.11] |