Вмешательства для предотвращения прогрессирования аутосомно‐доминантной поликистозной болезни почек
Abstract
Background
Autosomal dominant polycystic kidney disease (ADPKD) is the most common inherited disorder causing kidney disease. Current clinical management of ADPKD focuses primarily on symptom control and reducing associated complications, particularly hypertension. In recent years, improved understanding of molecular and cellular mechanisms involved in kidney cyst growth and disease progression has resulted in new pharmaceutical agents to target disease pathogenesis to prevent progressive disease.
Objectives
We aimed to evaluate the effects of interventions for preventing ADPKD progression on kidney function, kidney endpoints, kidney structure, patient‐centred endpoints (such as cardiovascular events, sudden death, all‐cause mortality, hospitalisations, BP control, quality of life, and kidney pain), as well as the general and specific adverse effects related to their use.
Search methods
We searched the Cochrane Renal Group's Specialised Register to 6 June 2015 using relevant search terms.
Selection criteria
Randomised controlled trials (RCTs) comparing any interventions for preventing the progression of ADPKD with other interventions or placebo were considered for inclusion without language restriction.
Data collection and analysis
Two authors independently assessed study risks of bias and extracted data. We summarised treatment effects on clinical outcomes, kidney function and structure and adverse events using random effects meta‐analysis. We assessed heterogeneity in estimated treatment effects using the Cochran Q test and I2 statistic. Summary treatment estimates were calculated as a mean difference (MD) or standardised mean difference (SMD) for continuous outcomes and a risk ratio (RR) for dichotomous outcomes together with their 95% confidence intervals.
Main results
We included 30 studies (2039 participants) that investigated 11 pharmacological interventions (angiotensin‐converting enzyme inhibitors (ACEi), angiotensin receptor blockers (ARBs), calcium channel blockers, beta blockers, vasopressin receptor 2 (V2R) antagonists, mammalian target of rapamycin (mTOR) inhibitors, somatostatin analogues, antiplatelet agents, eicosapentaenoic acids, statins and vitamin D compounds) in this review.
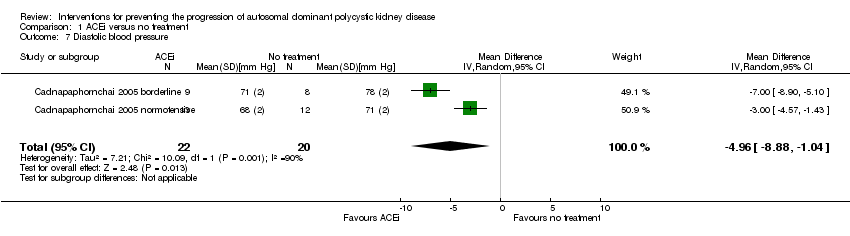
ACEi significantly reduced diastolic blood pressure (9 studies, 278 participants: MD ‐4.96 mm Hg, 95% CI ‐8.88 to ‐1.04), but had uncertain effects on kidney volumes (MD ‐42.50 mL, 95% CI ‐115.68 to 30.67), GFR (MD ‐3.41 mL/min/1.73 m2, 95% CI ‐15.83 to 9.01), and SCr (MD ‐0.02 mg/dL, 95% CI ‐0.14 to 0.09), in data largely restricted to children. ACEi did not show different effects on GFR (MD ‐8.19 mL/min/1.73 m2, 95% CI ‐29.46 to 13.07) and albuminuria (SMD ‐0.19, 95% CI ‐1.77 to 1.39) when compared with beta‐blockers, or SCr (MD 0.00 mg/dL, 95% CI ‐0.09 to 0.10) when compared with ARBs.
Data for effects of V2R antagonists on kidney function and volumes compared to placebo were limited to narrative information within a single study while these agents increased thirst (1444 participants: RR 2.70, 95% CI 2.24 to 3.24) and dry mouth (1455 participants: RR 1.33, 95% CI 1.01 to 1.76).
Compared with no treatment, mTOR inhibitors had uncertain effects on kidney function (2 studies, 115 participants: MD 4.45 mL/min/1.73 m2, 95% CI ‐3.20 to 12.11) and kidney volume (MD ‐0.08 L, 95% CI ‐0.75 to 0.59) but in three studies (560 participants) caused angioedema (RR 13.39, 95% CI 2.56 to 70.00), oral ulceration (RR 6.77, 95% CI 4.42 to 10.38), infections (RR 1.14, 95% CI 1.04 to 1.25) and diarrhoea (RR 1.70, 95% CI 1.26 to 2.29).
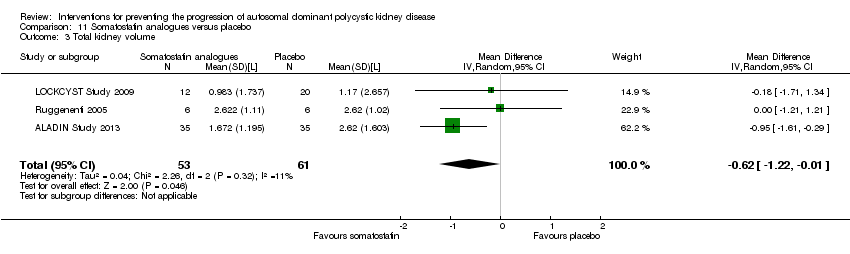
Somatostatin analogues (6 studies, 138 participants) slightly improved SCr (MD ‐0.43 mg/dL, 95% CI ‐0.86 to ‐0.01) and total kidney volume (MD ‐0.62 L, 95% CI ‐1.22 to ‐0.01) but had no definite effects on GFR (MD 9.50 mL/min, 95% CI ‐4.45 to 23.44) and caused diarrhoea (RR 3.72, 95% CI 1.43 to 9.68).
Data for calcium channel blockers, eicosapentaenoic acids, statins, vitamin D compounds and antiplatelet agents were sparse and inconclusive.
Random sequence generation was adequate in eight studies, and in almost half of the studies, blinding was not present or not specified. Most studies did not adequately report outcomes, which adversely affected our ability to assess this bias. The overall drop‐out rate was over 10% in nine studies, and few were conducted using intention‐to‐treat analyses.
Authors' conclusions
Although several interventions are available for patients with ADPKD, at present there is little or no evidence that treatment improves patient outcomes in this population and is associated with frequent adverse effects. Additional large randomised studies focused on patient‐centred outcomes are needed.
PICO
Резюме на простом языке
Какие методы лечения являются наиболее эффективными для профилактики прогрессирования аутосомно‐доминантной поликистозной болезни почек?
В настоящее время клиническая помощь людям с аутосомно‐доминантной поликистозной болезнью почек (АДПБП) фокусируется на контроле будущих рисков в отношении необходимости диализа и симптоматического лечения, в основном боли и кровотечений. Недавно открытые молекулы, которые могут замедлить рост кисты почки, переключили внимание с ухода и лечения на профилактику прогрессирования болезни и контроль симптомов.
В этом обзоре мы стремились проанализировать пользу и вред вмешательств, направленных на профилактику прогрессирования АДПБП. Литературный поиск актуален по 6 июня 2015 года. Мы нашли 30 исследований (с участием 2039 участников), в которые испытали 11 различных вариантов лечения.
Исходы, представленные в публикациях, в основном ограничивались функцией и объемом почек. В доказательствах, в основном касающихся детей, было установлено, что И‐АПФ (ингибиторы ангиотензин‐превращающего фермента) значительно снижали диастолическое давление крови, но их влияние на объем почек и на работу почек было неопределенным. Работу почек оценивали путем измерения скорости клубочковой фильтрации (СКФ) и уровня креатинина сыворотки крови пациентов. У взрослых, И‐АПФ не показали различий по влиянию на СКФ и количество белка, называемого альбумином, выделяемого с мочой (альбуминурия) при сравнении с бета‐блокаторами, или по влиянию на уровень креатинина сыворотки крови при сравнении с лекарствами, известными как БРА (блокаторы рецепторов ангиотензина II). Данные одного исследования были неубедительными в отношении влияния блокаторов [антагонистов] рецепторов вазопрессина 2 на функцию и объем почек. Однако эти лекарства вызывали у пациентов жажду и сухость во рту. По сравнению с отсутствием лечения, группа лекарств, известных как mTOR ингибиторы (ингибиторы механистической мишени для рапамицина у млекопитающих), оказывали неопределенное влияние на функцию и объем почек, но вызвали отек мягких тканей, язвы ротовой полости, инфекции и диарею. Лекарства, известные как аналоги соматостатина, немного улучшали уровень сывороточного креатинина и общий объем почек, но не имели никаких определенного влияния на СКФ и вызвали диарею. Данные в отношении других лекарств были разрозненными и неубедительными.
В настоящее время доказательств недостаточно, чтобы показать, что лекарства, используемые у лиц с АДПБП, могут защитить функцию почек и тем самым отсрочить необходимость диализа или пересадки почки. Необходимы дальнейшие доказательства из крупных, хорошо спланированных клинических исследований для информирования процесса принятия решений в здравоохранении, прежде чем можно будет выбирать эти лекарства на рутинной основе [в ежедневной практике] для достижения лучших результатов в отношении здоровья у людей с АДПБП.
Authors' conclusions
Background
Description of the condition
ADPKD is the most common inherited disorder that affects kidney function and is a major cause of end‐stage kidney disease (ESKD). ADPKD is characterised by uncontrolled growth of kidney cysts that alter normal kidney structure and progressively impair kidney function. This means that people with ADPKD often require dialysis or kidney transplantation. Globally, over 12 million people currently live with ADPKD, of whom about 700,000 live in the US (Harris 2009). Annual incidence rates range from 4.0 to 8.7 per million people globally (Torres 2007). Recent data suggest that ADPKD accounts for about 5% of new patients commencing RRT in the US (USRDS 2008) and 3% to 10% in Europe (ERA‐EDTA 2011). By 60 years of age, about half of all people with ADPKD develop ESKD (Torres 2009).
ADPKD is a heterogeneous genetic disorder: it can evolve from mutation of the PKD1 (on chromosome 16p13.3) or PKD2 (on chromosome 4q21) genes, which encode two different polycystins. PKD1 mutations account for about 85% of all ADPKD and are usually associated with a more severe phenotype characterised by an earlier appearance, greater numbers of cysts and faster progression to ESKD. Increases in cyst numbers and size over time lead to hypertension, bleeding, infections, discomfort and pain. Cyst expansion is a major factor for the progressive loss of functional kidney tissue and function, which results from both direct (parenchymal compression) or indirect (fibrosis) mechanisms.
Description of the intervention
Healthcare for people with ADPKD principally focuses on controlling secondary conditions, particularly hypertension, to limit morbidity and mortality after the disease becomes symptomatic. Specific interventions targeting the pathogenesis of ADPKD have yet to be validated in clinical practice. Recent developments arising from better mechanistic understanding of the molecular pathways involved in cyst growth have made targeting disease pathogenesis, rather than disease complications, possible. However, although many interventions have shown promise in experimental models, few have been tested in clinical studies, and available interventions data have not been summarised previously.
How the intervention might work
Cyst growth can be targeted at different levels. Cyclic adenosine monophosphate (cAMP) plays a central role in cystogenesis (Hanaoka 2000). A hormone, arginine‐vasopressin (AVP), is the main inductor of cAMP production, working to activate an enzyme, adenylate‐cyclase, via vasopressin receptor‐2 (VR2) binding. Administration of V2R antagonists has been shown to reduce cyst and kidney volume and prevent kidney function impairment in polycystic kidney disease/vasopressin (PKD/AVP) knock‐out rats (Gattone 2003). cAMP levels can also be lowered by reducing the amount of circulating AVP by increasing water intake to reduce serum osmolality that can suppress the central release of AVP. Experimental findings confirm that chronic high fluid intake is effective in limiting cyst growth (Nagao 2006).
cAMP accumulation can be prevented by stimulating the somatostatin receptors (SRs) SST2 (Masyuk 2007). The unexpected finding that somatostatin administration was effective in stabilising cyst volume in an ADPKD patient with pituitary adenoma (a type of brain tumour) prompted interest in testing the efficacy of SR‐agonists (octreotide, lanreotide) using systematic approaches (Torres 2007).
A protein, tuberin, a regulator of mTOR kinase, is another potential target. This was initially investigated following a retrospective analysis that showed both liver and kidney volume decreased among people with ADPKD who received rapamycin therapy following kidney transplantation (Qian 2008) and confirmed by experimental models (Wahl 2006; Wu 2007) where the administration of mTOR inhibitors limited cyst enlargement and slowed progression of chronic kidney disease (CKD).
Other interventions, including dietary supplements of long‐chain omega 3 polyunsaturated (eicosapentaenoic) fatty acids (Ogborn 2000), and administration of statins (Gile 1995), have demonstrated efficacy to slow kidney impairment and contract cyst growth in different experimental models of PKD, probably as a result of a specific kidney anti‐inflammatory effect. However, it remains unclear whether other interventions broadly used to slow CKD, such as ACEis and ARBs, produce similar beneficial effects on kidney function in people with ADPKD (Schrier 2009). An ongoing clinical study, HALT‐PKD (Torres 2012), has been designed to clarify whether the combination of ACEi and ARBs could be more effective than ACEi alone to slow the decline of GFR in people with ADPKD who have stage 3 CKD and prevent CKD onset in earlier stages.
Why it is important to do this review
Kidney cyst growth usually precedes GFR decline by several years (Grantham 2006; Grantham 2008). This suggests that early approaches targeting ADPKD biology could be helpful to slow the progression of kidney disease and improve patient outcomes. However, no systematic assessments of the existing efficacy and safety evidence are yet available to inform practice or policy.
Objectives
Our objectives were to evaluate:
-
the effects of interventions to prevent progression of ADPKD as measured by kidney function (GFR, SCr), doubling of SCr concentration, proteinuria or urinary albumin excretion) and clinical endpoints (ESKD, need for RRT)
-
the effects of those interventions on kidney structure (total kidney volume, parenchymal volume, and kidney cyst volume)
-
the effects of those interventions on patient‐centred endpoints such as incidence of fatal and nonfatal cardiovascular events, sudden death, all‐cause mortality, hospitalisations, blood pressure control, quality of life, and kidney pain
-
general and specific adverse effects related to those interventions such as dizziness, diarrhoea, abdominal cramps and nausea (all treatments); hypernatraemia, thirst, dry mouth, and headache (V2R antagonists); angioedema and infections (mTOR inhibitors); alopecia (somatostatin agonists); and hyperkalaemia (ACEi and ARBs).
Methods
Criteria for considering studies for this review
Types of studies
All randomised controlled trials (RCTs) and quasi‐RCTs (RCTs in which allocation to treatment was obtained by alternation, use of alternate medical records, date of birth or other predictable methods) looking at interventions directed at preventing the progression of ADPKD have been included, without duration restrictions. The first period only was considered for randomised cross‐over studies. There were no language restrictions.
Types of participants
Inclusion criteria
Studies enrolling patients (adults or children) with clinical diagnosis of ADPKD (assessed by magnetic resonance imaging (magnetic nuclear imaging) or echo tomography fulfilling Ravine criteria) confirmed or unconfirmed by genetic tests, with kidney and cyst volumes of any dimension, and CKD stages 1 to 4, as defined by the by the US National Kidney Foundation's Kidney Disease Outcomes Quality Initiative (KDOQI) guidelines were eligible for inclusion.
Exclusion criteria
ADPKD patients with CKD stage 5 (GFR < 15 mL/min/1.73 m2) and/or on haemodialysis and/or having undergone kidney transplantation were excluded from our analysis. Patients with autosomal recessive polycystic kidney disease (ARPKD) or other liver or kidney cystic diseases different from ADPKD were also excluded from the review.
Types of interventions
-
ACEi alone versus placebo, other therapy or both
-
ARB alone versus placebo, other therapy or both
-
ACEi versus ARB and standard therapy
-
ARB versus ACEi and standard therapy
-
ACEi plus ARB versus ACEi or ARB alone
-
VR2 antagonists (selective or nonselective) versus placebo and/or standard therapy
-
mTOR selective inhibitors alone or in association with other therapies versus placebo other therapy or both
-
Somatostatin agonists alone or in association with other therapies versus placebo and/or other therapies
-
Antiplatelet agents versus placebo, standard therapy or both
-
Eicosapentaenoic acids versus placebo, standard therapy or both
-
Statins versus placebo, standard therapy or both
-
Vitamin D or vitamin D derivatives versus other therapies
-
Increased versus standard fluid intake (as required).
Types of outcome measures
Outcomes were analysed at the end of treatment, and as change from beginning to end of treatment, where applicable.
Primary outcomes
-
Kidney function: SCr (mg/dL), measured or estimated GFR (eGFR) (mL/min or mL/min/1.73 m2), creatinine clearance (CrCl), doubling of creatinine, need for RRT or transplantation at the end of treatment.
Secondary outcomes
-
Total kidney volume (mL or L), total cyst volume (mL or L), total parenchymal volume (mL or L) assessed by magnetic nuclear imaging scan, echo tomography or computed tomography (CT)
-
Urinary protein excretion: 24 hour proteinuria or 24 hour albuminuria (mg/dL) (mg/d) or urine protein‐creatinine ratio (mg/g or g/g) or urine albumin‐creatinine ratio (mg/g or g/g)
-
Blood pressure (BP): systolic BP and diastolic BP (mm Hg), mean BP (mm Hg)
-
Fatal and nonfatal cardiovascular events including but not limited to myocardial infarction (MI), cerebrovascular accident (CVA), congestive heart failure (CHF)
-
All‐cause mortality
-
Quality of life (assessed by validated scales or any other instrument as reported by authors, such as SF‐36 or KDQOL‐SF questionnaires)
-
Kidney pain (rate of episodes or subjective perception as assessed by any analogue pain scale)
-
Any admission to hospital and duration of hospital stay (if long‐term data were available from the studies)
-
Adverse events: including but not limited to dizziness, diarrhoea, abdominal cramps and nausea (all treatments), hypernatraemia, thirst, dry mouth, transaminases elevation, and headache (V2R antagonists), angioedema, hyperlipidaemia, anaemia, oral ulcers and infections (mTOR inhibitors), alopecia (somatostatin agonists), hyperkalaemia (ACEi and ARBs).
Search methods for identification of studies
Electronic searches
We searched the Cochrane Renal Group's Specialised Register to 6 June 2015 through contact with the Trials' Search Co‐ordinator using search terms relevant to this review. The Cochrane Renal Group’s Specialised Register contains studies identified from:
-
Monthly searches of the Cochrane Central Register of Controlled Trials CENTRAL
-
Weekly searches of MEDLINE OVID SP
-
Handsearching of kidney‐related journals and the proceedings of major kidney conferences
-
Searching of the current year of EMBASE OVID SP
-
Weekly current awareness alerts for selected kidney journals
-
Searches of the International Clinical Trials Register (ICTRP) Search Portal and ClinicalTrials.gov.
Studies contained in the Specialised Register have been identified through search strategies for CENTRAL, MEDLINE, and EMBASE based on the scope of the Cochrane Renal Group. Details of these strategies as well as a list of hand‐searched journals, conference proceedings and current awareness alerts are available in the Specialised Register section of information about the Cochrane Renal Group.
See Appendix 1 for search terms used in strategies for this review.
Searching other resources
-
Reference lists of review articles, relevant studies and clinical practice guidelines.
-
Letters seeking information about unpublished or incomplete studies to investigators known to be involved in previous studies.
Data collection and analysis
Selection of studies
The search strategy described was used to obtain titles and abstracts of studies relevant to the review. Titles and abstracts were screened independently by two authors (DB, MR) who discarded studies that were not applicable; however, studies and reviews that might include relevant data or information were retained initially and reviewed in detail. The same two authors independently assessed retrieved abstracts, and if necessary the full text of these studies, to determine which satisfied the inclusion criteria.
Data extraction and management
Data extraction was carried out independently by two authors (DB, MR) using a standardised electronic data extraction form. Studies reported in non‐English and non‐Italian language journals were translated before assessment. Where more than one report of one study existed, reports were grouped together and the report with the most complete data was used in the analyses. Where relevant outcomes were only published in earlier reports, these data were used. Any discrepancies between reports were highlighted.
Assessment of risk of bias in included studies
Risk of bias was independently assessed by two authors using the risk of bias assessment tool (Higgins 2011) (see Appendix 2).
Measures of treatment effect
For dichotomous outcomes (ESKD, need for RRT, all‐cause mortality, cardiovascular events, hospitalisations, adverse effects) results were expressed as risk ratio (RR) with 95% confidence intervals (CI). Where continuous scales of measurement were used to assess the effects of treatment, results were reported as mean difference (MD) or standardised mean difference (SMD) if different scales were reported (SCr, GFR, proteinuria or albuminuria, BP, cyst and organ volumes, quality of life, kidney pain).
Unit of analysis issues
Data reported at the end of the first period of randomised cross‐over studies were considered.
Dealing with missing data
Any further information required from the original author was requested by written correspondence (e.g. emailing corresponding author) and any relevant information obtained in this manner was included in the review. Evaluation of important numerical data such as screened, randomised patients as well as intention‐to‐treat, as‐treated and per‐protocol population were carefully performed. Attrition rates, such as drop‐outs, losses to follow‐up and withdrawals were investigated. Issues of missing data and imputation methods (such as last‐observation‐carried‐forward) were critically appraised (Higgins 2011).
Assessment of heterogeneity
Heterogeneity was analysed using a Chi² test on N‐1 degrees of freedom, with an alpha of 0.10 used for statistical significance and with the I² test (Higgins 2003). I² values of 25%, 50% and 75% were considered to correspond to low, medium and high levels of heterogeneity, respectively.
Assessment of reporting biases
Although we had planned to investigate the existence possible small study bias, the overall paucity of available studies meant that it was not possible to conduct such assessment (Higgins 2011).
Data synthesis
Data for treatment effects were pooled using the random‐effects model.
Subgroup analysis and investigation of heterogeneity
We attempted to analyse where age (adults or children), stage and severity of disease (cyst and kidney dimensions at baseline, presence or absence of CKD), genetic background (mutations in PKD1 or PKD2 genes) and study follow‐up duration, were effect modifiers of the interventions studied. However, this was not possible due to the small number of included studies.
Sensitivity analysis
Sensitivity analyses were performed to explore the influence of the following factors on effect size:
-
repeating the analysis excluding unpublished studies
-
repeating the analysis taking account of risk of bias
-
repeating the analysis excluding any very long or large studies to establish how much they dominate the results
-
repeating the analysis excluding studies using the following filters: diagnostic criteria, language of publication, source of funding (industry versus other), and country.
Results
Description of studies
Results of the search
The search identified 232 records; one additional record identified from personal research was added. Full‐text assessment of 93 records resulted in the inclusion of 30 eligible studies (69 reports) that enrolled a total of 2039 participants with ADPKD (AIPRI Study 1996; ALADIN Study 2013; ELATE Study 2011; Biao 1997; Cadnapaphornchai 2005; Ecder 1999; Fassett 2010; Higashihara 2008; Hogan 2010; LOCKCYST Study 2009; Melemadathil 2013; Mora 2013; Nakamura 2001d; Nakamura 2012a; Nutahara 2005; RAPYD Study 2012; Ruggenenti 2005; SIRENA Study 2010; Soliman 2009; SUISSE ADPKD Study 2007; Temmerman 2012; TEMPO 248 & 249 2005; TEMPO 250 2011; TEMPO 3‐4 Study 2011; Ulusoy 2010; van Dijk 2001; van Dijk 2003; Walz 2010; Watson 1999; Zeltner 2008) and three ongoing studies (three reports) (DIPAK 1 Study 2014; NCT00345137; NCT01932450). Authors of some included studies were contacted for additional information with respect to study methods and/or unreported data; four investigators responded to our queries (LOCKCYST Study 2009; Soliman 2009; Temmerman 2012; Walz 2010). Figure 1 depicts the study inclusion and exclusion process.

Study flow diagram
Prior to publication of this review a final search of the Specialised Register identified three new potential studies and these will be assessed for inclusion in a future update of this review (Braun 2014; NCT01233869; Vienna RAP Study 2015).Two ongoing studies have recently been completed and will be assessed in a future update of this review (Cadnapaphornchai 2011; HALT‐PKD Study 2008)
Included studies
Among the included studies, three were cross‐over studies (Ruggenenti 2005; SIRENA Study 2010; van Dijk 2001). In five studies (AIPRI Study 1996; ELATE Study 2011; Hogan 2010; LOCKCYST Study 2009; Temmerman 2012) ADPKD patients represented a subpopulation of the study cohort, but separate data for the main study outcomes were only available in two (ELATE Study 2011; LOCKCYST Study 2009). The number of participants was not specified in Watson 1999. With the exception of Cadnapaphornchai 2005 and Mora 2013, all studies were conducted in adults. Study duration ranged from five days to 60 months.
ADPKD assessment at baseline and end of treatment was performed by echo tomography in 12 studies (Biao 1997; Cadnapaphornchai 2005; Ecder 1999; Fassett 2010; Nakamura 2001d; Nakamura 2012a; Nutahara 2005; Ulusoy 2010; van Dijk 2001; van Dijk 2003; Watson 1999; Zeltner 2008); computed tomography in seven studies (ELATE Study 2011; Higashihara 2008; Hogan 2010; LOCKCYST Study 2009; Ruggenenti 2005; SIRENA Study 2010; Temmerman 2012); and magnetic nuclear resonance imaging in nine studies (ALADIN Study 2013; Melemadathil 2013; Mora 2013; RAPYD Study 2012; Soliman 2009; SUISSE ADPKD Study 2007; TEMPO 250 2011; TEMPO 3‐4 Study 2011; Walz 2010). Methods of assessment were not specified in two studies (AIPRI Study 1996; TEMPO 248 & 249 2005).
Genetic characterisation of PKD mutations was only made only in RAPYD Study 2012, Melemadathil 2013 (according to both study protocols only participants with the PKD1 mutation were enrolled), and Ruggenenti 2005 (patients with PKD1 and PKD2 mutations were both enrolled).
All studies excluded patients with eGFR < 15 mL/min/1.73 m2. Mean eGFR ranged from 38.2 to 124 mL/min in adult ADPKD patients and from 102 to 142 mL/min in children.
Total kidney volume was estimated in 16 studies (ALADIN Study 2013; Cadnapaphornchai 2005; ELATE Study 2011; Higashihara 2008; Hogan 2010; LOCKCYST Study 2009; Melemadathil 2013; Mora 2013; RAPYD Study 2012; Ruggenenti 2005; SIRENA Study 2010; Soliman 2009; SUISSE ADPKD Study 2007; Hogan 2010; TEMPO 3‐4 Study 2011; Walz 2010) with mean values ranging from 1000 to 2845 mL in adults and from 157 to 315 mL in children.
Total cyst volume was analysed in six studies (ALADIN Study 2013; Melemadathil 2013; RAPYD Study 2012; Ruggenenti 2005; SIRENA Study 2010; Walz 2010) with mean values ranging from 140 to 1709 mL. Total parenchymal volume was calculated in five studies (ALADIN Study 2013; Melemadathil 2013; Ruggenenti 2005; SIRENA Study 2010; Walz 2010) with values ranging from 242 to 680 mL.
Enalapril, ramipril or benazepril (ACEi) were compared to the following.
-
Placebo or standard therapy in three studies (Cadnapaphornchai 2005; van Dijk 2003; AIPRI Study 1996; 147 participants)
-
Amlodipine (calcium channel blocker) in one study (Ecder 1999; 24 participants)
-
Losartan or telmisartan (ARB) in two studies (Nakamura 2012a; Ulusoy 2010; 42 participants)
-
Atenolol or metoprolol (beta blockers) in three studies (van Dijk 2003; Watson 1999; Zeltner 2008; 65 participants).
Other comparisons were as follows.
-
Ramipril at a starting dose of 2.5 mg versus ramipril plus rapamycin (mTOR inhibitor) at low or high target doses (RAPYD Study 2012; 55 participants)
-
Telmisartan alone versus telmisartan plus sirolimus (mTOR inhibitor) (Soliman 2009; 16 participants)
-
Candesartan (ARB) 2 to 8 mg/d versus to amlodipine (Nutahara 2005) (49 participants)
-
High doses (60 + 30 mg/d) tolvaptan (selective V2R antagonist) versus low doses (45 + 15 mg/d) (TEMPO 250 2011; 46 participants)
-
Tolvaptan versus placebo (TEMPO 250 2011; TEMPO 3‐4 Study 2011; 1491 participants)
-
Rapamycin, everolimus or sirolimus (mTOR inhibitors) alone versus placebo or standard therapy in five studies (Melemadathil 2013; Mora 2013; SIRENA Study 2010; SUISSE ADPKD Study 2007; Walz 2010; 616 participants).
-
Octreotide or lanreotide (long‐acting somatostatin analogues) versus placebo in one parallel (ALADIN Study 2013; 79 participants) and four cross‐over studies (Ruggenenti 2005 (12 participants); LOCKCYST Study 2009 (32 participants); Hogan 2010; Temmerman 2012 (48 participants))
-
Octreotide alone versus octreotide plus everolimus (ELATE Study 2011; 15 participants)
-
Dilazep dihydrochloride (antiplatelet agent) versus placebo (Nakamura 2001d; 22 participants)
-
Eicosapentaenoic acids (2.4 g/d) versus standard therapy (Higashihara 2008; 41 participants)
-
Pravastatin or simvastatin (statins) versus placebo or standard therapy (Fassett 2010; van Dijk 2001; 69 participants)
-
Calcitriol (vitamin D) at 0.25 to 1 µg/d versus traditional Chinese medicine (herbs) (Biao 1997; 34 participants).
Excluded studies
After title and abstract review we excluded 139 records Figure 1. Reasons for initial exclusion were: inappropriate population (92); inappropriate intervention (12); not randomised (22); non‐clinical studies (12); outcomes not relevant to this review (2). Four studies (five reports) were excluded after full text evaluation; two studies were not RCTs (Kanno 1996; Sharma 2004); and two studies investigated outcomes that were not relevant to this review (Doulton 2006; Nakamura 2005a). One study was excluded as it was halted in 2008 due to lack of funding (ISRCTN57653760).
Risk of bias in included studies
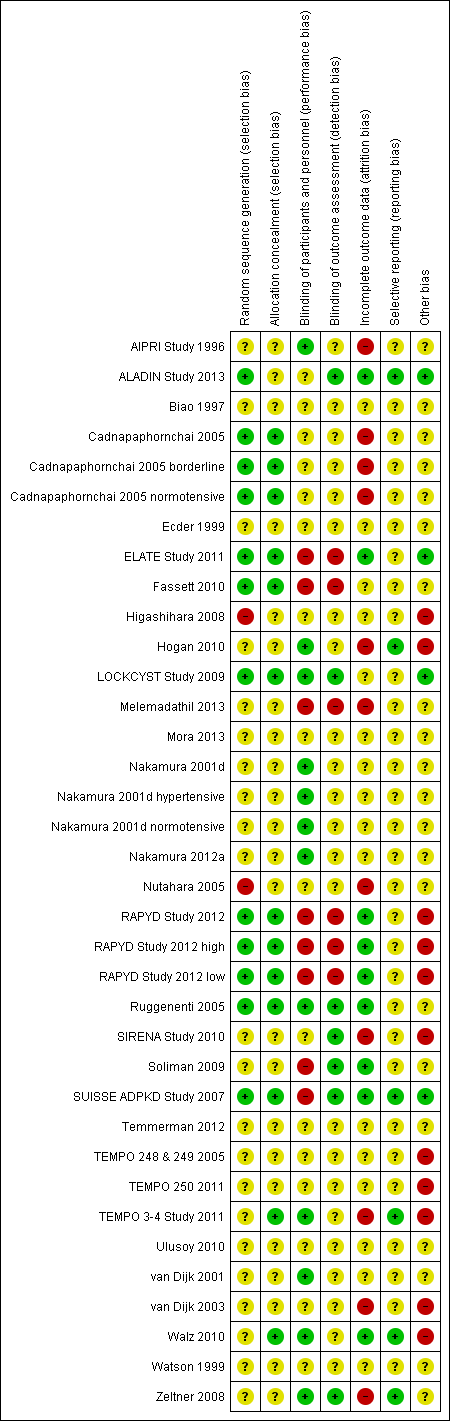
Summaries of risk of bias in the included studies are depicted in Figure 2 and Figure 3. The overall risk of bias was highly variable since in most studies the information provided (particularly on allocation, blinding of investigators and outcome assessors and attrition) was not sufficient to permit judgment. In some cases, authors were contacted for additional information but only four investigators responded to our queries (LOCKCYST Study 2009; Soliman 2009; Temmerman 2012; Walz 2010)

Risk of bias summary: review authors' judgements about each risk of bias item for each included study

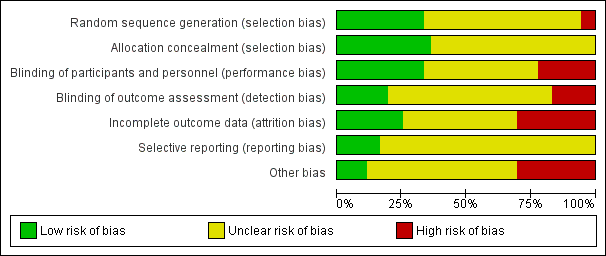
Risk of bias graph: review authors' judgements about each risk of bias item presented as percentages across all included studies
Allocation
Random sequence generation was low risk in eight studies (ALADIN Study 2013; Cadnapaphornchai 2005; ELATE Study 2011; Fassett 2010; LOCKCYST Study 2009; RAPYD Study 2012; Ruggenenti 2005; SUISSE ADPKD Study 2007), high risk in two studies (Higashihara 2008; Nutahara 2005); and there were insufficient data to inform assessment in the remaining 20 studies.
Allocation concealment was low risk in nine studies (Cadnapaphornchai 2005; ELATE Study 2011; Fassett 2010; LOCKCYST Study 2009; RAPYD Study 2012; Ruggenenti 2005; SUISSE ADPKD Study 2007; TEMPO 3‐4 Study 2011; Walz 2010) and unclear in 21 studies.
Blinding
The quality of blinding overall was variable. In most cases, blinding of investigators and outcome assessors was not specified. Participants and investigators were blinded in 10 studies (AIPRI Study 1996; Hogan 2010; LOCKCYST Study 2009; Nakamura 2001d; Nakamura 2012a; Ruggenenti 2005; TEMPO 3‐4 Study 2011; van Dijk 2001; Walz 2010; Zeltner 2008) and not blinded in six studies (ELATE Study 2011; Fassett 2010; Melemadathil 2013; RAPYD Study 2012; Soliman 2009; SUISSE ADPKD Study 2007).
In ALADIN Study 2013, participants were blinded to the treatment while investigators were aware of the allocated group. Blinding was not specified in the remainder of the studies.
Outcome assessors were blinded in seven studies (ALADIN Study 2013; LOCKCYST Study 2009; Ruggenenti 2005; SIRENA Study 2010; Soliman 2009; SUISSE ADPKD Study 2007; Zeltner 2008) whereas in four studies (ELATE Study 2011; Fassett 2010; Melemadathil 2013; RAPYD Study 2012) assessors were aware of treatment allocation. Outcome assessor blinding was unclear in the remaining 19 studies.
Incomplete outcome data
Attrition bias overall was variable; in most studies, the information provided was insufficient to permit assessment. The overall drop‐out rate ranged from 1.6% to 33% with no apparent differences among groups, with the exception of seven studies (Cadnapaphornchai 2005; ELATE Study 2011; Melemadathil 2013; Nutahara 2005; RAPYD Study 2012; TEMPO 3‐4 Study 2011; Zeltner 2008). We found that the overall drop‐out rate was greater than 10% in nine studies (AIPRI Study 1996; Cadnapaphornchai 2005; ELATE Study 2011; Hogan 2010; Nutahara 2005; SIRENA Study 2010; TEMPO 3‐4 Study 2011; van Dijk 2003; Zeltner 2008). Six studies (ALADIN Study 2013; Nutahara 2005; RAPYD Study 2012; SUISSE ADPKD Study 2007; TEMPO 3‐4 Study 2011; Walz 2010) were analysed on an intention‐to‐treat basis. ELATE Study 2011 was analysed on both per‐protocol and intention‐to‐treat bases.
Selective reporting
All predefined outcomes were reported in six studies (ALADIN Study 2013; Hogan 2010; SUISSE ADPKD Study 2007; TEMPO 3‐4 Study 2011; Walz 2010; Zeltner 2008). Selective reporting was unclear in the remaining 24 studies.
Other potential sources of bias
We found that 12 studies reported receiving funding from industry (ALADIN Study 2013; ELATE Study 2011; Higashihara 2008; Hogan 2010; LOCKCYST Study 2009; RAPYD Study 2012; SIRENA Study 2010; TEMPO 248 & 249 2005; TEMPO 250 2011; TEMPO 3‐4 Study 2011; van Dijk 2003; Walz 2010). In three studies (ALADIN Study 2013; ELATE Study 2011; LOCKCYST Study 2009) the authors specified that the sponsor was not involved in the study design, data collection, data analysis, interpretation of the study results, or writing the manuscript.
Effects of interventions
Overall, outcomes reported were mostly confined to eGFR, SCr and kidney structure (kidney and cyst volumes) while patient‐centred outcomes including RRT, mortality, and treatment‐related hazards were infrequently reported.
Kidney function
Serum creatinine
Somatostatin analogues significantly reduced SCr compared to placebo (Analysis 11.1 (ALADIN Study 2013; Ruggenenti 2005, 91 participants): MD ‐0.43 mg/dL, 95% CI ‐0.86 to ‐0.01; I2 = 0%).
There were no significant differences in SCr for the following comparisons.
-
ACEi versus no treatment (Analysis 1.1 (Cadnapaphornchai 2005, 42 participants): MD ‐0.02 mg/dL, 95% CI ‐0.14 to 0.09; I2 = 23%)
-
ACEi versus CCB (Analysis 2.1 (Ecder 1999, 24 participants): MD 0.01 mg/dL, 95% CI ‐0.10 to 0.12)
-
ACEi versus ARB (Analysis 3.1 ( Nakamura 2012a; Ulusoy 2010, 52 participants): MD 0.00 mg/dL, 95% CI ‐0.09 to 0.10; I2 = 0%)
-
ACEi versus beta‐blockers (Analysis 4.1 (Zeltner 2008, 37 participants) MD 0.18 mg/dL, 95% CI ‐0.12 to 0.48)
-
ARB versus CCB (Analysis 7.1 (Nutahara 2005, 40 participants) MD ‐0.45 mg/dL, 95% CI ‐0.90 to ‐0.00)
-
VR2 antagonists versus placebo (Analysis 8.1 (TEMPO 3‐4 Study 2011, 1154 participants): MD ‐0.01 mg/dL, 95% CI ‐0.08 to 0.06)
-
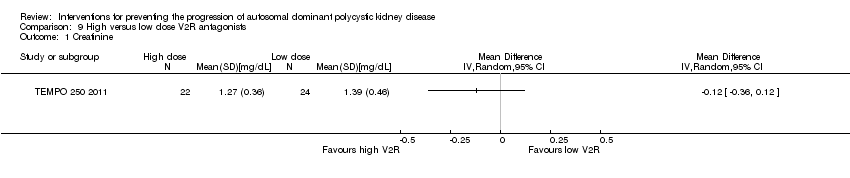
High versus low dose V2R antagonists (Analysis 9.1 (TEMPO 250 2011, 46 participants): MD ‐0.12 mg/dL, 95% CI ‐0.36 to 0.12)
-
Antiplatelet agents versus placebo (Analysis 13.1 (Nakamura 2001d, 22 participants): MD ‐0.13 mg/dL, 95% CI ‐0.52 to 0.26; I2 = 69%)
-
Eicosapentaenoic acid versus standard therapy (Analysis 14.1 (Higashihara 2008, 41 participants): RR 0.16, 95% CI ‐0.55 to 0.87)
Glomerular filtration rate
Ecder 1999 reported GFR was significantly lower in the ACEi group compared to the CCB group (Analysis 2.2 (24 participants): (MD ‐13.00 mL/min/1.73 m3, 95% CI ‐17.56 to ‐8.44).
Biao 1997 reported GFR was significantly higher in the vitamin D group compared to the Chinese herbal medicine group (Analysis 16.2 (34 participants): MD 22.60 mL/min, 95% CI 0.92 to 44.28).
There were no significant differences in GFR for the following comparisons.
-
ACEi versus not treatment (Analysis 1.2 (Cadnapaphornchai 2005; van Dijk 2003, 103 participants) MD ‐3.41 mL/min/1.73 m3, 95% CI ‐15.83 to 9.01; I2 = 46%)
-
ACEi versus ARB (Analysis 3.2 (Ulusoy 2010, 32 participants): MD ‐3.40 mL/min/1.73 m3, 95% CI ‐22.69 to 15.89)
-
ACEi versus beta‐blockers (Analysis 4.2 (van Dijk 2003; Zeltner 2008, 65 participants): MD ‐8.06 mL/min/1.73 m3, 95% CI ‐29.62 to 13.50; I2 = 95%)
-
ARB alone versus ARB + mTOR inhibitor (Analysis 6.1 (1 study, 16 participants): MD ‐9.60 mL/min/1.73 m3, 95% CI ‐28.18 to 8.98)
-
ARB versus CCB (Analysis 7.2 (Nutahara 2005, 31 participants): MD 6.30 mL/min/1.73 m3, 95% CI ‐8.49 to 21.09)
-
mTOR inhibitor versus no treatment (Analysis 10.1 (SIRENA Study 2010; SUISSE ADPKD Study 2007, 115 participants): MD 4.45 mL/min/1.73 m3, 95% CI ‐3.20 to 12.11; I2 = 0%)
-
Somatostatin analogues versus placebo (Analysis 11.2 (ALADIN Study 2013; Ruggenenti 2005, 79 participants): MD 9.50 mL/min/1.73 m3, 95% CI ‐4.45 to 23.44; I2 = 0%)
-
Antiplatelet agents versus placebo (Analysis 13.2 (Nakamura 2001d, 22 participants): MD 2.24 mL/min/1.73 m3, 95% CI ‐8.05 to 12.53; I2 = 0%)
-
Eicosapentaenoic acid versus standard therapy (Analysis 14.2 (Higashihara 2008, 41 participants): MD 6.10 mL/min/1.73 m3, 95% CI ‐11.16 to 23.36)
Doubling of creatinine
Fours studies reported doubling of creatinine; none reported any significant differences between the treatments studied.
-
ACEi versus no treatment (Analysis 1.3 (AIPRI Study 1996, 64 participants): RR 1.01, 95% CI 0.45 to 2.28)
-
ARB alone versus ARB + mTOR inhibitor (Analysis 6.2 (Soliman 2009, 16 participants): RR 3.00, 95% CI 0.39 to 23.07)
-
ARB versus CCB (Analysis 7.3 (Nutahara 2005, 49 participants): RR 0.17, 95% CI 0.02 to 1.34)
-
V2R antagonists versus placebo (Analysis 8.3 (TEMPO 3‐4 Study 2011, 1444 participants): RR 0.96, 95% CI 0.73 to 1.25).
Need for renal replacement therapy or transplantation
Two studies reported need for RRT or transplantation; none reported any significant difference between the treatments studied.
-
ACEi versus beta‐blockers (Analysis 4.4 (Zeltner 2008, 37 participants): RR 0.39, 95% CI 0.02 to 8.97)
-
mTOR inhibitor versus no treatment: RRT (Analysis 10.3 (Walz 2010, 431 participants): RR 3.04, 95% CI 0.12 to 74.26); transplantation (Analysis 10.4 (Walz 2010, 431 participants): RR 1.01, 95% CI 0.06 to 16.11).
Total kidney, cyst and parenchymal volume
Total kidney volume
Soliman 2009 reported a significant increase in total kidney volume with ARB alone compared to ARB + mTOR inhibitor (Analysis 6.3 (16 participants): MD 0.37 L, 95% CI 0.04 to 0.70).
Somatostatin analogues significantly decreased total kidney volume compared to placebo (Analysis 11.3 (ALADIN Study 2013; LOCKCYST Study 2009; Ruggenenti 2005, 114 participants) MD ‐0.62 L, 95% CI ‐1.22 to ‐0.01; I2 = 11%).
There were no significant differences in total kidney volume for the following comparisons.
-
ACEi versus no treatment (Analysis 1.4 (Cadnapaphornchai 2005, 42 participants): MD ‐42.50 mL, 95% CI ‐115.68 to 30.67; I2 = 0%)
-
ACEi alone versus ACEi + mTOR inhibitor (Analysis 5.2; (RAPYD Study 2012, 69 participants): MD 285.79 mL, 95% CI ‐21.92 to 593.50; I2 = 0%)
-
mTOR inhibitor versus no treatment Analysis 10.5; (SIRENA Study 2010; SUISSE ADPKD Study 2007, 115 participants): MD ‐0.08 L, 95% CI ‐0.75 to 0.59; I2 = 0%)
-
Eicosapentaenoic acid versus standard therapy Analysis 14.3 (Higashihara 2008, 41 studies): MD ‐209.00 mL, 95% CI ‐729.06 to 311.06)
Cyst volume
Four studies reported cyst volume; none reported any significant differences between the treatments studied.
-
ACEi alone versus ACEi + mTOR inhibitor (Analysis 5.3 (RAPYD Study 2012, 69 participants): MD 36.32 mL, 95% CI ‐6.99 to 79.64; I2 = 0%)
-
mTOR inhibitor versus no treatment (Analysis 10.7 (SIRENA Study 2010, 15 participants): MD ‐55.00 mL, 95% CI ‐862.98 to 752.98)
-
Somatostatin analogues versus placebo (Analysis 11.4 (ALADIN Study 2013; Ruggenenti 2005, 82 participants): MD ‐0.50 L, 95% CI ‐1.18 to 0.18; I2 = 37%).
Total parenchymal volume
Three studies reported total parenchymal volume; none reported any significant differences between the treatments studied.
-
mTOR inhibitor versus no treatment (Analysis 10.9 (SIRENA Study 2010, 15 participants): MD 15.00 mL, 95% CI ‐75.44 to 105.44)
-
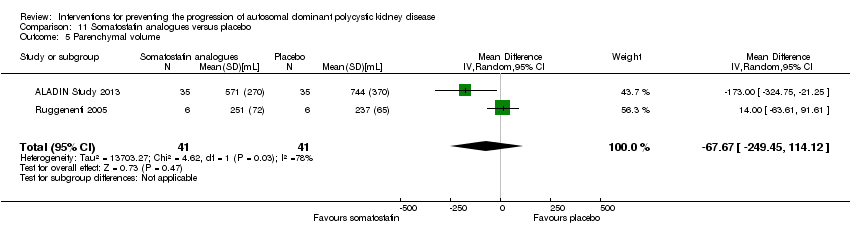
Somatostatin analogues versus placebo (Analysis 11.5 (ALADIN Study 2013; Ruggenenti 2005, 82 participants): MD ‐67.67 mL, 95% CI ‐249.45 to 114.12; I2 = 78%).
Urinary protein excretion
Ecder 1999 reported a significant decrease in albuminuria with ACEi compared to CCB (Analysis 2.3 (24 participants): MD ‐134.00 mg/g, 95% CI ‐176.01 to ‐91.99).
Nutahara 2005 reported ARB significantly decreased albuminuria (Analysis 7.4 (25 participants): MD ‐304.00 mg/d, 95% CI ‐578.54 to ‐29.46) and proteinuria (Analysis 7.5 (24 participants): MD ‐238.00 mg/d, 95% CI ‐394.61 to ‐81.39) compared to CCB.
There were no significant differences in either proteinuria or albuminuria for the following comparisons.
-
ACEi versus no treatment (Analysis 1.5 (Nakamura 2001d; van Dijk 2003, 103 participants): SMD ‐0.12, 95% CI ‐0.51 to 0.26; I2 = 0%)
-
ACEi versus beta‐blockers (Analysis 4.5 (van Dijk 2003; Zeltner 2008, (65 participants) SMD ‐0.19, 95% CI ‐1.77 to 1.39; I2 = 89%)
-
V2R antagonists versus placebo (Analysis 8.5 (TEMPO 3‐4 Study 2011, 1157 participants): MD ‐1.60 mg/mmol, 95% CI ‐3.95 to 0.75)
-
mTOR inhibitor versus no treatment: proteinuria (Analysis 10.11 (SIRENA Study 2010; Walz 2010, 446 participants): (SMD 0.34, 95% CI ‐0.29 to 0.98; I2 = 45%); albuminuria (Analysis 10.13 (SIRENA Study 2010; SUISSE ADPKD Study 2007, 115 participants): SMD 0.25, 95% CI ‐0.27 to 0.78; participants; I2 = 23%)
-
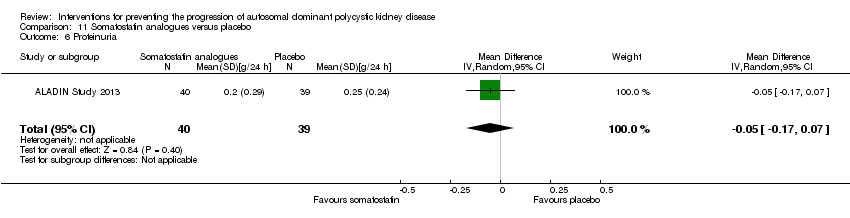
Somatostatin analogues versus placebo: proteinuria (Analysis 11.6 (ALADIN Study 2013, 79 participants): MD ‐0.05 g/24 h, 95% CI ‐0.17 to 0.07); albuminuria (Analysis 11.7, (ALADIN Study 2013; Ruggenenti 2005, 91 participants): SMD ‐0.10, 95% CI ‐0.51 to 0.31; I2 = 0%)
-
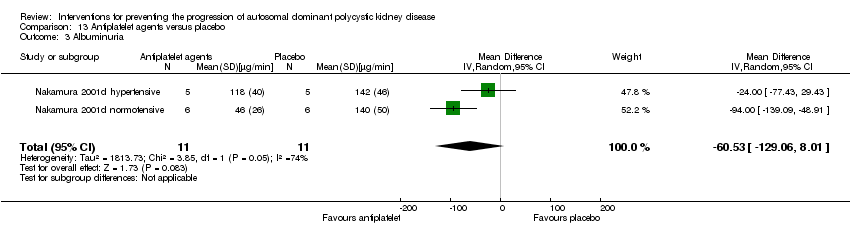
Antiplatelet agent versus placebo (Analysis 13.3 (Nakamura 2001d, 22 participants): MD ‐60.53 µg/min, 95% CI ‐129.06 to 8.01; I2 = 74%).
Blood pressure
Systolic blood pressure
Ecder 1999 reported ACEi significantly decreased systolic BP compared to CCB (Analysis 2.4 (24 participants): MD ‐5.00 mm Hg, 95% CI ‐8.62 to ‐1.38).
TEMPO 250 2011 reported high dose V2R antagonists significantly reduced systolic BP compared to low dose V2R antagonists (Analysis 9.2 ( 46 participants): MD ‐9.00 mm Hg, 95% CI ‐16.98 to ‐1.02).
There were no significant differences in systolic BP for the following comparisons.
-
ACEi versus no treatment (Analysis 1.6 (Cadnapaphornchai 2005, 42 participants): MD ‐5.44 mm Hg, 95% CI ‐14.26 to 3.38; I2 = 96%)
-
ACEi versus ARB (Analysis 3.3 (Ulusoy 2010, 32 participants): MD ‐3.50 mm Hg, 95% CI ‐9.75 to 2.75)
-
ACEi versus beta‐blocker (Analysis 4.6 (Zeltner 2008, 37 participants): MD ‐1.00 mm Hg, 95% CI ‐2.29 to 0.29)
-
mTOR inhibitor versus no treatment (Analysis 10.14 (SIRENA Study 2010; SUISSE ADPKD Study 2007, 112 participants): MD 2.48 mm Hg, 95% CI ‐2.07 to 7.03; I2 = 0%)
-
Somatostatin analogues versus placebo (Analysis 11.8 (ALADIN Study 2013; Ruggenenti 2005, 91 participants): MD 0.79 mm Hg, 95% CI ‐3.54 to 5.13; I2 = 0%)
-
Antiplatelet agent versus placebo (Analysis 13.4 (Nakamura 2001d, 22 participants): MD 5.04 mm Hg, 95% CI ‐7.34 to 17.43; I2 = 0%)
-
Statins versus no treatment (Analysis 15.4 (Fassett 2010, 49 participants): MD 1.70 mm Hg, 95% CI ‐6.39 to 9.79).
Diastolic blood pressure
Cadnapaphornchai 2005 reported ACEi significantly reduce diastolic BP compared to no treatment (Analysis 1.7 (42 participants): MD ‐4.96 mm Hg, 95% CI ‐8.88 to ‐1.04; I2 = 90%)
Ecder 1999 reported ACEi significantly decreased diastolic BP compared to CCB (Analysis 2.5 (24 participants): MD ‐3.00 mm Hg, 95% CI ‐5.40 to ‐0.60)
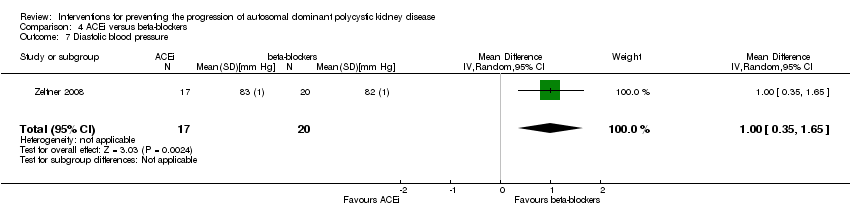
Zeltner 2008 reported beta‐blockers significantly decrease diastolic BP compared to ACEi (Analysis 4.7 (37 participants): MD 1.00 mm Hg, 95% CI 0.35 to 1.65)
TEMPO 250 2011 reported high dose V2R antagonists significantly reduced diastolic BP compared to low dose V2R antagonists (Analysis 9.3 (46 participants): MD ‐6.00 mm Hg, 95% CI ‐11.21 to ‐0.79)
There were no significant differences in diastolic BP for the following comparisons.
-
ACEi versus ARB (Analysis 3.4 (Ulusoy 2010, 32 participants): MD ‐1.80 mm Hg, 95% CI ‐5.23 to 1.63)
-
mTOR inhibitor versus no treatment (Analysis 10.15 (SIRENA Study 2010; SUISSE ADPKD Study 2007, 112 participants): MD 0.27 mm Hg, 95% CI ‐3.30 to 3.85; I2 = 0%)
-
Somatostatin analogues versus placebo (Analysis 11.9 (ALADIN Study 2013; Ruggenenti 2005, 91 participants): MD ‐0.38 mm Hg, 95% CI ‐3.68 to 2.92; I2 = 0%)
-
Antiplatelet agent versus placebo (Analysis 13.5 (Nakamura 2001d, 22 participants): MD 6.24 mm Hg, 95% CI ‐3.27 to 15.74; I2 = 0%)
-
Statins versus no treatment (Analysis 15.5 (Fassett 2010, 49 participants): MD ‐1.40 mm Hg, 95% CI ‐5.54 to 2.74).
Mean arterial pressure
van Dijk 2003 reported ACEi significantly decreased MAP compared to no treatment (Analysis 1.8 (61 participants): MD ‐5.00 mm Hg, 95% CI ‐6.29 to ‐3.71).
Ecder 1999 reported ACEi significantly decreased MAP compared to CCB (Analysis 2.6 (24 participants): MD ‐3.00 mm Hg, 95% CI ‐5.40 to ‐0.60).
van Dijk 2003 reported ACEi significantly decreased MAP compared to beta‐blockers (Analysis 4.8 (28 participants): MD ‐3.00 mm Hg, 95% CI ‐4.92 to ‐1.08).
There were no significant differences in MAP for the following comparisons.
-
ACEi versus ARB (Analysis 3.5 (Ulusoy 2010, 32 participants): MD ‐2.20 mm Hg, 95% CI ‐6.41 to 2.01)
-
ACEi alone versus ACEi plus mTOR inhibitors (Analysis 5.5 (RAPYD Study 2012, 69 participants): MD 0.64 mm Hg, 95% CI ‐6.21 to 7.50)
-
Somatostatin analogues versus placebo (Analysis 11.10 (ALADIN Study 2013, 79 participants): MD ‐0.10 mm Hg, 95% CI ‐3.66 to 3.46).
Cardiovascular events
Cardiovascular events were only reported in Zeltner 2008. There was no significant difference in the number of cardiovascular events between ACEi and beta‐blockers (Analysis 4.10 (37 participants): (RR 1.18, 95% CI 0.08 to 17.42).
All‐cause mortality
Death was only reported in Walz 2010. There was no significant difference in the number of deaths between mTOR inhibitors and no treatment (Analysis 10.17 (431 participants): RR 2.03, 95% CI 0.19 to 22.20).
Quality of life
Quality of life was not reported in any of the included studies.
Kidney pain
Kidney pain was only reported in TEMPO 3‐4 Study 2011. There was no significant difference in the number with kidney between V2R antagonists and placebo (Analysis 8.6 (1444 participants); (RR 0.77, 95% CI 0.66 to 0.90).
Admission to hospital
Admission to hospital was not reported in any of the included studies.
Adverse events
RAPYD Study 2012 reported no significant differences between ACEi alone and ACEi plus mTOR inhibitors in anaemia (Analysis 5.6.1 (53 participants): RR 0.45, 95% CI 0.02 to 8.82), hyperlipidaemia (Analysis 5.6.2 (53 participants): RR 0.10, 95% CI 0.01 to 1.56), infection (Analysis 5.6.3 (53 participants): RR 0.45, 95% CI 0.02 to 8.82), or oral ulcers (Analysis 5.6.4 (53 participants): RR 0.13, 95% CI 0.01 to 2.15).
Soliman 2009 reported no significant difference between ARB alone and ARB plus mTOR inhibitors for infection (Analysis 6.5 (16 participants): RR 0.50, 95% CI 0.13 to 2.00).
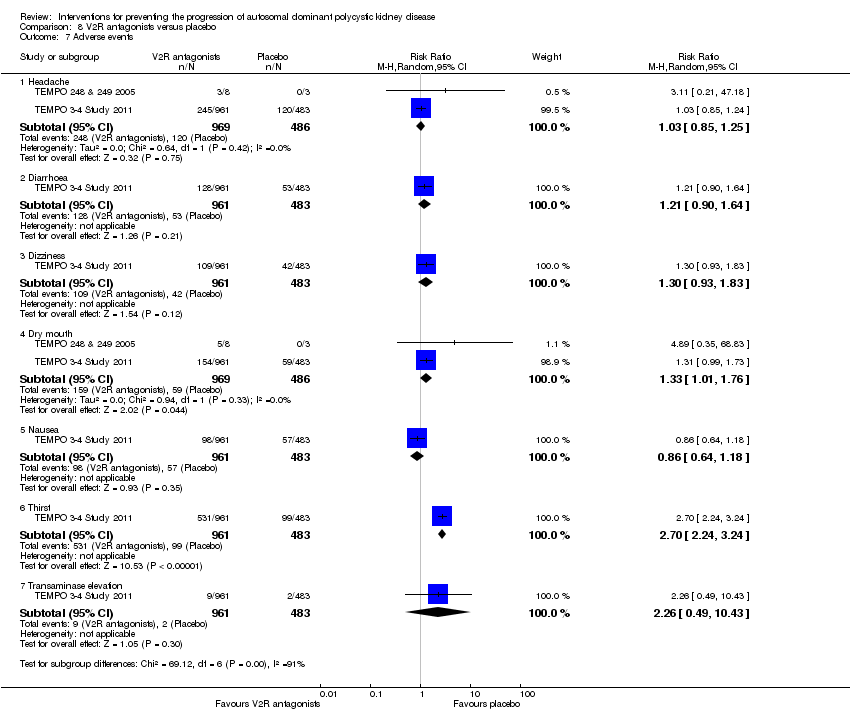
Compared to placebo, V2R antagonists significantly increased dry mouth (Analysis 8.7.4 (2 studies, 1455 participants): RR 1.33, 95% CI 1.01 to 1.76; I2 = 0%) and thirst (Analysis 8.7.6 (1 study, 1444 participants): RR 2.70, 95% CI 2.24 to 3.24). There were no significant differences in headache (Analysis 8.7.1 (2 studies,1455 participants): RR 1.03, 95% CI 0.85 to 1.25; I2 = 0%), diarrhoea (Analysis 8.7.2 (1 study, 1444 participants): RR 1.21, 95% CI 0.90 to 1.64), dizziness (Analysis 8.7.3 1 study, 1444 participants): RR 1.30, 95% CI 0.93 to 1.83), nausea (Analysis 8.7.5 (1 study, 1444 participants): RR 0.86, 95% CI 0.64 to 1.18), or liver enzyme elevation (Analysis 8.7.7 (1 study, 1444 participants): RR 2.26, 95% CI 0.49 to 10.43).
Compared with no treatment, mTOR inhibitors were associated with significant increases in anaemia (Analysis 10.18.1 (1 study, 431 participants): RR 3.41, 95% CI 1.79 to 6.51), angioedema (Analysis 10.18.2 (3 studies, 560 participants): RR 13.39, 95% CI 2.56 to 70.00; I2 = 0%), diarrhoea (Analysis 10.18.3 (3 studies 560 participants): RR 1.70, 95% CI 1.26 to 2.29; I2 = 0%); hyperlipidaemia (Analysis 10.18.4 (1 study, 431 participants): RR 5.68, 95% CI 2.23 to 14.43), infection (Analysis 10.18.5 (3 studies, 560 participants): RR 1.14, 95% CI 1.04 to 1.25; I2 = 0%), and oral ulcers (Analysis 10.18.7 (3 studies, 560 participants): RR 6.77, 95% CI 4.42 to 10.38; I2 = 0%), but not nausea (Analysis 10.18.6 (1 study, 431 participants): RR 1.69, 95% CI 0.85 to 3.37).
Somatostatin analogues were associated with significant risk of diarrhoea compared to placebo (Analysis 11.11.3 (2 studies, 91 participants): RR 3.72, 95% CI 1.43 to 9.68; I2 = 0%) but not alopecia (Analysis 11.11.1 (1 study, 79 participants): RR 4.88, 95% CI 0.24 to 98.47), anaemia (Analysis 11.11.2 (1 study, 79 participants): RR 1.30, 95% CI 0.50 to 3.40), dizziness (Analysis 11.11.4 (1 study, 79 participants): RR 0.97, 95% CI 0.06 to 15.05), or infection (Analysis 11.11.5 (1 study, 79 participants): RR 1.24, 95% CI 0.64 to 2.39).
Discussion
Summary of main results
In this systematic review we could include 30 randomised studies (2039 adults with ADPKD) evaluating 11 interventions (ACEi, ARBs, calcium channel blockers, beta blockers, V2R antagonists, mTOR inhibitors, somatostatin analogues, antiplatelet agents, eicosapentaenoic acids, statins and vitamin D). For most interventions, data were available only from single studies and provided information for surrogate outcomes such as GFR, blood pressure and kidney and cyst volumes, leading to low confidence in estimated treatment effects. Overall, there was little or no evidence that currently available interventions improve patient‐related or kidney health outcomes while evidence for adverse events was sparse and showed potential for increased harm.
ACEi significantly reduced diastolic BP but had uncertain effects on mortality, ESKD, kidney volumes, GFR, creatinine levels and albuminuria. ACEi did not produce different effects on kidney function when compared with beta blockers or ARBs.
In meta‐analyses of data pooled from two studies, V2R antagonists increased thirst and dry mouth. In addition, data from a single RCT (TEMPO 3‐4 Study 2011) showed a greater proportion of patients treated with these drugs had elevations of liver‐enzyme levels. V2R antagonists showed apparent benefits on kidney function and volumes but confident interferences about their impact on the progression to ESKD could not be drawn as such benefits were only shown by a single study (TEMPO 3‐4 Study 2011). Furthermore, in this study data were analysed on an intention‐to‐treat basis. A higher percentage of patients in the intervention than in the placebo arm (22.9% versus 13.8%) discontinued the study, mostly due to low compliance to the treatment. This may introduce a significant attrition bias limiting the confidence and the overall applicability of findings.
mTOR inhibitors had uncertain effects on GFR, total kidney volume, BP and other secondary outcomes (albuminuria, proteinuria) but caused oral ulceration, infection, and diarrhoea. Of note the use of these drugs was associated with a remarkable increase in the risk of angioedema (RR 13.39), although the clinical reliability of this point estimate might be questioned due to the very wide confidence interval observed (2.56 to 70.00). Few data were available on mortality and RRT outcomes and treatment effects were accordingly absent.
When compared with placebo, somatostatin analogues reduced SCr and total kidney volume, but had uncertain benefits on GFR and other secondary outcomes, while causing diarrhoea. As shown in a three‐year duration study (ALADIN Study 2013), the benefits of these drugs on kidney outcomes (particularly, kidney volumes) seemed to be more evident in the early treatment phase (one year) while they tended to dilute at later stages (three years).
Little or no evidence was found to exist for the impact of calcium channel blockers, eicosapentaenoic acids, statins, vitamin D compounds and antiplatelet agents on disease progression and patient outcomes. These treatments were associated with undefined benefits in terms of kidney function and other secondary endpoints, such as BP or proteinuria.
Overall completeness and applicability of evidence
The evidence on available interventions for slowing progression of ADPKD was sparse in both adults and children. Information on ADPKD progression, both in terms of cyst/kidney volumes and deteriorating kidney function was limited, restricted to few interventions and mostly inconclusive because of the availability of single studies only. Most key mortality and cardiovascular outcomes were only marginally addressed. There were few or no data on major patient‐centred outcomes, such as CKD progression, mortality, major morbid events, quality of life and disease‐related symptoms. Conversely, the vast majority of studies only demonstrated sparse benefits in surrogate endpoints (e.g. change in total kidney or cyst volumes, blood pressure control, proteinuria, albuminuria) without evidence of clear benefits on outcomes of CKD progression (e.g. RRT). Surrogate outcomes are indeed useful as proxies for patient‐centred outcomes, particularly in slow‐progressing diseases such as ADPKD. However, the main disadvantage of using surrogate outcomes is that favourable effects of interventions do not always translate into clear benefits to harder endpoints. In some cases, surrogate outcomes may even be "hypothesis‐generating" at best. Although GFR remains the preferable outcome measure for treatment effectiveness, in the majority of ADPKD patients this parameter remains relatively steady until late in the disease. Total kidney volume has been extensively adopted as surrogate outcome measure in ADPKD studies. However, whether a reduced rate of kidney enlargement effectively translates into slowed kidney function deterioration is still object of debate. Accordingly, recently the FDA did not consider the observed improvement in kidney volumes in the TEMPO studies as enough to justify lifelong therapy with the V2R‐antagonist Tolvaptan.
The extreme heterogeneity in study length (ranging from five days to 60 months) also deserves mentioning. Many studies were indeed designed to assess treatment effects in very short time as per their exploratory nature (e.g. pilot or small cross‐over studies: Biao 1997; TEMPO 248 & 249 2005; van Dijk 2003). Short‐time studies preclude interpretations on hard outcomes (death, dialysis), particularly in slowly progressing chronic diseases. In addition, short‐term studies can be powered to investigate the effect of treatments on surrogate endpoints only, showing no proof of significant clinical changes in the long‐term. Performing cumulative outcome analyses with such study heterogeneity in follow‐up duration is potentially unreliable.
All studies were pilot or cross‐over studies conducted on very small populations, with the exception of two multicentre studies (TEMPO 3‐4 Study 2011; Walz 2010). Results from small studies are inconclusive in nature and probably more useful to set the stage for larger confirmation studies rather than for providing definite indications for clinical practice.
The applicability of findings is also limited by the large number of drop‐out found in most studies. Although the overall drop‐out rate varied widely across the studies (1.6% to 33%), this was greater than 10% in nine studies which included all the largest studies conducted on ADPKD patients. Furthermore, in most cases drop‐outs were unbalanced among the study groups, being more frequently observed in the active rather than in the control arm (Cadnapaphornchai 2005; ELATE Study 2011; Melemadathil 2013; Nutahara 2005; RAPYD Study 2012; TEMPO 3‐4 Study 2011; Zeltner 2008). High dropout rates may introduce important attrition bias and limit the internal validity of findings. Per‐protocol analyses can be useful to bypass limitations related with high dropout rates. However, such approaches convey a high risk of bias due to selection of patients and may provide clinically dubious information as they may over‐estimate the benefit or underestimate the harm of an intervention.
Quality of the evidence
Three of the included studies were cross‐over studies (Ruggenenti 2005; SIRENA Study 2010; van Dijk 2001). Most studies focused on small cohorts, were not powered to observe differences in patient‐centred outcomes and did not provide adequate study reporting or information on blinding of patients or investigators or both to assess risks of bias properly.
Limitations in study reporting and design markedly reduced confidence in the results. Actual treatment effects may differ significantly from those calculated from existing studies.
Random sequence generation was adequate in only eight studies (ALADIN Study 2013; Cadnapaphornchai 2005; ELATE Study 2011; Fassett 2010; LOCKCYST Study 2009; RAPYD Study 2012; Ruggenenti 2005; SUISSE ADPKD Study 2007), and in almost half the studies, blinding was not present or not specified.
The overall drop‐out rate was over 10% in nine studies (AIPRI Study 1996; Cadnapaphornchai 2005; ELATE Study 2011; Hogan 2010; Nutahara 2005; SIRENA Study 2010; TEMPO 3‐4 Study 2011; van Dijk 2003; Zeltner 2008) and only six were conducted using intention‐to‐treat analyses (ALADIN Study 2013; Nutahara 2005; RAPYD Study 2012; SUISSE ADPKD Study 2007; TEMPO 3‐4 Study 2011; Walz 2010).
Potential biases in the review process
Despite being the first overall summary of treatment for ADPKD based on a peer‐reviewed protocol, a systematic search of electronic databases including the Cochrane Renal Group’s specialised register of studies, and applying a standardised procedure for data extraction and analysis incorporating assessment of study methodology, the findings of our review should be interpreted with caution. The lack of data in the available studies represents the key limitation. In most cases, the effect of a given intervention was addressed by single studies, which prevented meta‐analyses with sufficient power to draw definitive conclusions on relevant outcomes. Furthermore, data on patient‐level outcomes (such as ESKD, mortality and cardiovascular events and adverse effects) were collectively scarce or absent. Study design was heterogeneous with marked differences among studies with respect to follow up duration, baseline kidney function and methods of assessment of ADPKD severity. Finally, in most cases, ADPKD assessment was made by echo tomography, a technique widely recognised to be inaccurate for identifying small changes in kidney volumes and poorly suited for very expanded kidneys.
Agreements and disagreements with other studies or reviews
After decades of symptomatic treatment for ADPKD, we now have several novel interventions targeting ADPKD biology arising from a wealth of experimental and non‐randomised studies (Chang 2012). Unfortunately, despite great optimism based on preliminary results, to date there has not been sufficient evidence from the available RCTs to demonstrate clear therapeutic benefits that outweigh treatment hazards. In addition, large RCTs are needed before these interventions could be considered as effective treatments to improve outcomes in ADPKD.
The Consortium for Radiologic Imaging for the Study of Polycystic Kidney Disease (Rule 2006) demonstrated that in people with ADPKD, baseline kidney volume values predicted the rate of increase in kidney volumes regardless of age, and accordingly, higher rates of kidney enlargement reflected a faster decline in kidney function. Kidney volumes have therefore been proposed and extensively used in studies as surrogate endpoints of disease progression to overcome the difficulty of following kidney function slope for very long periods of time in RCTs. Despite this, the benefits of some interventions (e.g. mTOR inhibitors) on kidney volumes in ADPKD have not corresponded with substantial changes in kidney function decline. This raises the question as to whether these biomarkers are appropriate as outcomes for assessing treatment effectiveness of novel interventions in ADPKD when used in isolation (Grantham 2011) and whether other surrogates of kidney function or damage would be more appropriate in studies of ADPKD patients (Helai 2012). In this regard, negative results of mTOR inhibitors studies were largely disappointing. These drugs have been demonstrated to be powerful inhibitors of cyst growth in experimental models (Wu 2007) and retrospective observations clearly showed a reduced cystic phenotype in the livers of kidney transplant recipients undergoing immunosuppression with mTOR inhibitors (Qian 2008). Future directions have been hypothesised for exploring whether there is room for mTOR inhibitors in the pathogenetic treatment of ADPKD, including higher doses or longer regimens of treatment, lower doses in combination with other therapeutic approaches (to minimise adverse events) or the use of analogues with better side‐effects profiles or improved kidney penetration (Wüthrich 2009). We suggest that any future study of higher dose mTOR inhibition requires careful systematic measurement of adverse effects and is based on patient‐relevant outcomes.
Although preliminary findings in animal and human studies have suggested that V2R antagonists and somatostatin analogues can be efficacious in slowing cyst growth (Harris 2009), our analyses demonstrated no conclusive effects for V2R and only small effects for somatostatin analogues on kidney function or kidney volumes. On the other hand, concerns might arise concerning the safety profile of these agents because their use is associated with thirst and dry mouth (V2R antagonists) and diarrhoea (somatostatin analogues). Future studies focusing on the effects on kidney function decline rather than kidney volume surrogates are eagerly awaited to confirm and generalise the benefits of these agents in retarding ADPKD progression.
Blood pressure control is currently one of the mainstays of ADPKD management in clinical practice. Hypertensive ADPKD patients have greater and faster annual rates of kidney volumes growth and an increased prevalence of cardiovascular comorbidities and complications with respect to normotensive people (Ecder 2013). Since hypertensive ADPKD patients are at higher risk of kidney disease progression, these people might represent a higher risk population for future studies which would then be powered to capture patient‐centred kidney and mortality outcomes.
In our review, the use of ACEi was associated with significant improvement in BP control. Unfortunately, this benefit was mostly confined to children, and meta‐analyses were underpowered to detect differences in treatment effects on disease progression. Potentially, results from the ongoing HALT‐PKD Study 2008a testing the efficacy of RAAS‐blockade on the progression of cystic disease and decline in kidney function, will clarify whether an intensive (≤ 110/75 mm Hg) versus standard (≤ 130/80 mm Hg) BP control might produce different effects on the disease course in ADPKD patients with both early (GFR > 60 mL/min/1.73 m2) and advanced (GFR 25 to 60 mL/min/1.73 m2) kidney impairment.

Study flow diagram
Risk of bias summary: review authors' judgements about each risk of bias item for each included study
Risk of bias graph: review authors' judgements about each risk of bias item presented as percentages across all included studies

Comparison 1 ACEi versus no treatment, Outcome 1 Serum creatinine.
![Comparison 1 ACEi versus no treatment, Outcome 2 GFR [mL/min/1.73 m²].](/es/cdsr/doi/10.1002/14651858.CD010294.pub2/media/CDSR/CD010294/image_n/nCD010294-CMP-001-02.png)
Comparison 1 ACEi versus no treatment, Outcome 2 GFR [mL/min/1.73 m²].

Comparison 1 ACEi versus no treatment, Outcome 3 Doubling of serum creatinine.

Comparison 1 ACEi versus no treatment, Outcome 4 Total kidney volume.

Comparison 1 ACEi versus no treatment, Outcome 5 Albuminuria.

Comparison 1 ACEi versus no treatment, Outcome 6 Systolic blood pressure.
Comparison 1 ACEi versus no treatment, Outcome 7 Diastolic blood pressure.

Comparison 1 ACEi versus no treatment, Outcome 8 Mean arterial pressure.

Comparison 2 ACEi versus CCB, Outcome 1 Creatinine.
![Comparison 2 ACEi versus CCB, Outcome 2 GFR [mL/min/1.73 m²].](/es/cdsr/doi/10.1002/14651858.CD010294.pub2/media/CDSR/CD010294/image_n/nCD010294-CMP-002-02.png)
Comparison 2 ACEi versus CCB, Outcome 2 GFR [mL/min/1.73 m²].
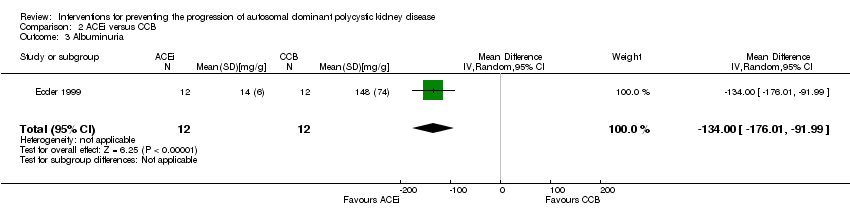
Comparison 2 ACEi versus CCB, Outcome 3 Albuminuria.
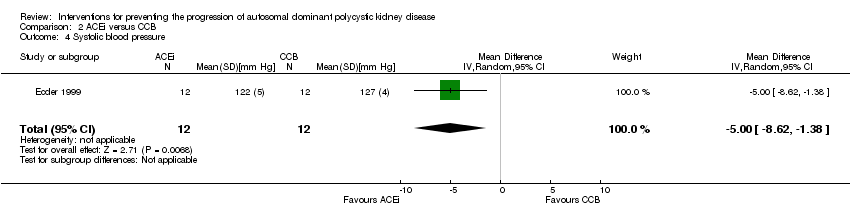
Comparison 2 ACEi versus CCB, Outcome 4 Systolic blood pressure.

Comparison 2 ACEi versus CCB, Outcome 5 Diastolic blood pressure.
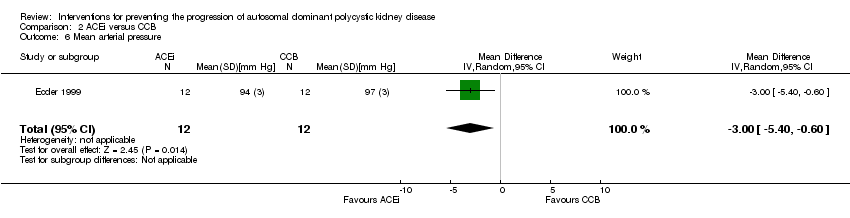
Comparison 2 ACEi versus CCB, Outcome 6 Mean arterial pressure.

Comparison 3 ACEi versus ARB, Outcome 1 Serum creatinine.
![Comparison 3 ACEi versus ARB, Outcome 2 GFR [mL/min/1.73 m²].](/es/cdsr/doi/10.1002/14651858.CD010294.pub2/media/CDSR/CD010294/image_n/nCD010294-CMP-003-02.png)
Comparison 3 ACEi versus ARB, Outcome 2 GFR [mL/min/1.73 m²].

Comparison 3 ACEi versus ARB, Outcome 3 Systolic blood pressure.

Comparison 3 ACEi versus ARB, Outcome 4 Diastolic blood pressure.

Comparison 3 ACEi versus ARB, Outcome 5 Mean arterial pressure.
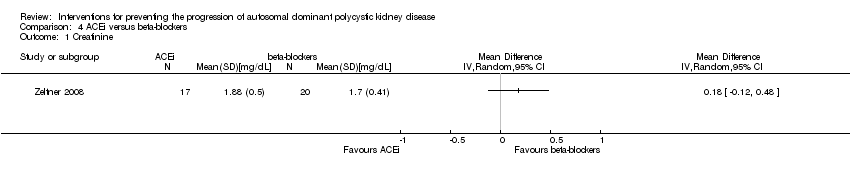
Comparison 4 ACEi versus beta‐blockers, Outcome 1 Creatinine.
![Comparison 4 ACEi versus beta‐blockers, Outcome 2 GFR [mL/min/1.73 m²].](/es/cdsr/doi/10.1002/14651858.CD010294.pub2/media/CDSR/CD010294/image_n/nCD010294-CMP-004-02.png)
Comparison 4 ACEi versus beta‐blockers, Outcome 2 GFR [mL/min/1.73 m²].
| Study | |
| Watson 1999 | eGFR (Cockcroft‐Gault formula) significantly decreased in both groups over the 3 year period (ACEi: 19.3 mL/min/1.73 m2; beta‐blockers: 14.3 mL/min/1.73 m2) but there was no difference in the rate of decline between groups. |
Comparison 4 ACEi versus beta‐blockers, Outcome 3 GFR descriptive data.

Comparison 4 ACEi versus beta‐blockers, Outcome 4 Need for renal replacement therapy.

Comparison 4 ACEi versus beta‐blockers, Outcome 5 Albuminuria.
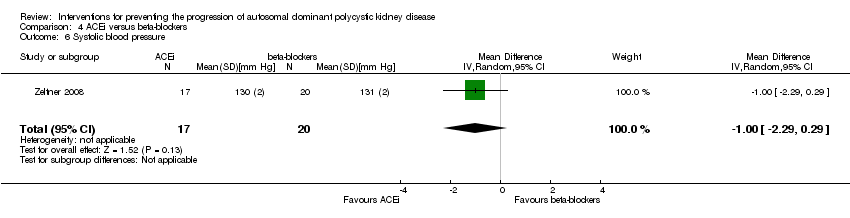
Comparison 4 ACEi versus beta‐blockers, Outcome 6 Systolic blood pressure.
Comparison 4 ACEi versus beta‐blockers, Outcome 7 Diastolic blood pressure.

Comparison 4 ACEi versus beta‐blockers, Outcome 8 Mean arterial pressure.
| Study | |
| Watson 1999 | Good blood pressure control was achieved in both groups (ACEi: 132.6/84.6 mm Hg; beta‐blockers: 130.9/84.5 mm Hg) |
Comparison 4 ACEi versus beta‐blockers, Outcome 9 Blood pressure descriptive data.
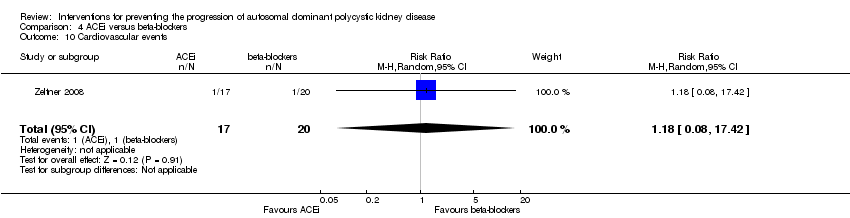
Comparison 4 ACEi versus beta‐blockers, Outcome 10 Cardiovascular events.
![Comparison 5 ACEi alone versus ACEi + mTOR inhibitors, Outcome 1 GFR [mL/min/1.73 m²].](/es/cdsr/doi/10.1002/14651858.CD010294.pub2/media/CDSR/CD010294/image_n/nCD010294-CMP-005-01.png)
Comparison 5 ACEi alone versus ACEi + mTOR inhibitors, Outcome 1 GFR [mL/min/1.73 m²].

Comparison 5 ACEi alone versus ACEi + mTOR inhibitors, Outcome 2 Total kidney volume.
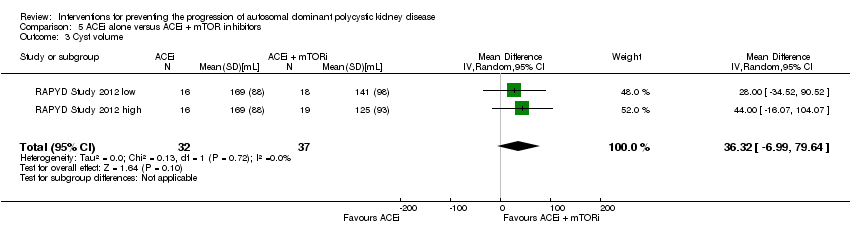
Comparison 5 ACEi alone versus ACEi + mTOR inhibitors, Outcome 3 Cyst volume.

Comparison 5 ACEi alone versus ACEi + mTOR inhibitors, Outcome 4 Proteinuria.

Comparison 5 ACEi alone versus ACEi + mTOR inhibitors, Outcome 5 Mean arterial pressure.

Comparison 5 ACEi alone versus ACEi + mTOR inhibitors, Outcome 6 Adverse events.
![Comparison 6 ARB alone versus ARB + mTOR inhibitors, Outcome 1 GFR [mL/min/1.73 m²].](/es/cdsr/doi/10.1002/14651858.CD010294.pub2/media/CDSR/CD010294/image_n/nCD010294-CMP-006-01.png)
Comparison 6 ARB alone versus ARB + mTOR inhibitors, Outcome 1 GFR [mL/min/1.73 m²].

Comparison 6 ARB alone versus ARB + mTOR inhibitors, Outcome 2 Doubling of serum creatinine.

Comparison 6 ARB alone versus ARB + mTOR inhibitors, Outcome 3 Total kidney volume.
| Study | |
| Soliman 2009 | The mean diastolic pressure decreased by 2.5 to 4.0 mm Hg in the ARB + mTOR group and increased by 0.5 to 1.5 mm Hg in the ARB alone group The mean systolic pressure decreased by 2.5 to 5.0 mm Hg in the ARB + mTOR group and increased by 1.0 to 2.5 mm Hg in the ARB alone group |
Comparison 6 ARB alone versus ARB + mTOR inhibitors, Outcome 4 Blood pressure descriptive data.

Comparison 6 ARB alone versus ARB + mTOR inhibitors, Outcome 5 Infection.

Comparison 7 ARB versus CCB, Outcome 1 Creatinine.
![Comparison 7 ARB versus CCB, Outcome 2 GFR [mL/min/1.73 m²].](/es/cdsr/doi/10.1002/14651858.CD010294.pub2/media/CDSR/CD010294/image_n/nCD010294-CMP-007-02.png)
Comparison 7 ARB versus CCB, Outcome 2 GFR [mL/min/1.73 m²].
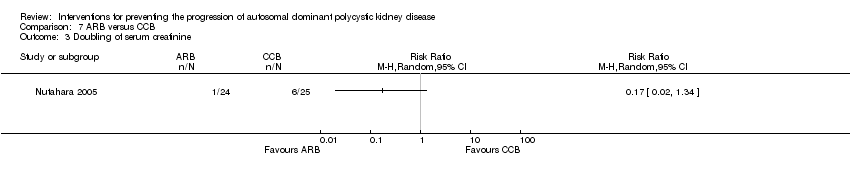
Comparison 7 ARB versus CCB, Outcome 3 Doubling of serum creatinine.

Comparison 7 ARB versus CCB, Outcome 4 Proteinuria.

Comparison 7 ARB versus CCB, Outcome 5 Albuminuria.
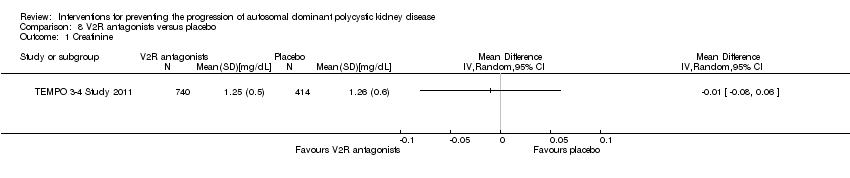
Comparison 8 V2R antagonists versus placebo, Outcome 1 Creatinine.
| Study | |
| TEMPO 3‐4 Study 2011 | The slope of kidney function (as assessed by means of the reciprocal of the SCr level) from the end of dose escalation to month 36, favoured V2R‐antagonists, with a slope of −2.61 (mg/mL)−1 per year, as compared with −3.81 (mg/mL)−1 per year with placebo; the treatment effect was an increase of 1.20 (mg/mL)−1 per year (95% CI 0.62 to 1.78; P < 0.001) |
Comparison 8 V2R antagonists versus placebo, Outcome 2 GFR descriptive data.

Comparison 8 V2R antagonists versus placebo, Outcome 3 Doubling of serum creatinine.
| Study | |
| TEMPO 3‐4 Study 2011 | quote: "Over the 3‐year period, total kidney volume increased by 2.8% per year (95% confidence interval [CI], 2.5 to 3.1) with V2R‐antagonists versus 5.5% per year (95% CI, 5.1 to 6.0) with placebo" |
Comparison 8 V2R antagonists versus placebo, Outcome 4 Total kidney volume descriptive data.
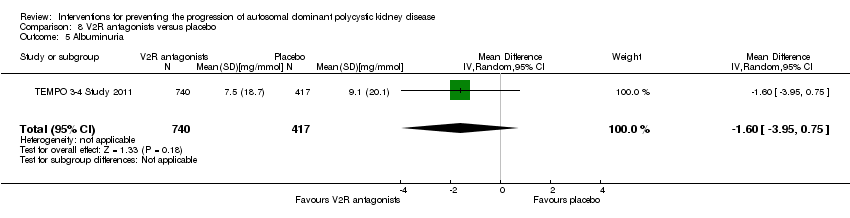
Comparison 8 V2R antagonists versus placebo, Outcome 5 Albuminuria.

Comparison 8 V2R antagonists versus placebo, Outcome 6 Kidney pain.
Comparison 8 V2R antagonists versus placebo, Outcome 7 Adverse events.
Comparison 9 High versus low dose V2R antagonists, Outcome 1 Creatinine.

Comparison 9 High versus low dose V2R antagonists, Outcome 2 Systolic blood pressure.

Comparison 9 High versus low dose V2R antagonists, Outcome 3 Diastolic blood pressure.
![Comparison 10 mTOR inhibitors versus no treatment, Outcome 1 GFR [mL/min/1.73 m²].](/es/cdsr/doi/10.1002/14651858.CD010294.pub2/media/CDSR/CD010294/image_n/nCD010294-CMP-010-01.png)
Comparison 10 mTOR inhibitors versus no treatment, Outcome 1 GFR [mL/min/1.73 m²].
| Study | |
| Walz 2010 | quote: "The estimated GFR decreased by 8.9 ml per minute in the mTOR‐inhibitors group and 7.7 ml per minute in the placebo group (P = 0.15) over the 2‐year study period" |
Comparison 10 mTOR inhibitors versus no treatment, Outcome 2 GFR descriptive data.

Comparison 10 mTOR inhibitors versus no treatment, Outcome 3 Need for renal replacement therapy.

Comparison 10 mTOR inhibitors versus no treatment, Outcome 4 Need for transplantation.

Comparison 10 mTOR inhibitors versus no treatment, Outcome 5 Total kidney volume.
| Study | |
| Melemadathil 2013 | quote: "there was a statistically significant reduction in total kidney volume when mTOR treatment was extended for 1 year" |
| Mora 2013 | quote: "the mTOR group showed a kidney volume growth of 9,4 ±1,2mL/year compared with 11 ± 1.4 mL/year in control group" |
| Walz 2010 | quote: "among patients receiving mTOR‐inhibitors, the mean total kidney volume increased from 2028 ml to 2063 ml at 1 year and to 2176 ml at 2 years, and among those receiving placebo, it increased from 1911 ml to 2061 ml and to 2287 ml, respectively" |
Comparison 10 mTOR inhibitors versus no treatment, Outcome 6 Total kidney volume descriptive data.

Comparison 10 mTOR inhibitors versus no treatment, Outcome 7 Cyst volume.
| Study | |
| Melemadathil 2013 | quote: "there was a statistically significant reduction in total cyst volume when mTOR treatment was extended for 1 year" |
| Walz 2010 | quote: "The cyst volume increased by 76 ml at 1 year and 181 ml at 2 years in the mTOR‐inhibitors group and by 98 ml and 215 ml, respectively, in the placebo group" |
Comparison 10 mTOR inhibitors versus no treatment, Outcome 8 Cyst volume descriptive data.

Comparison 10 mTOR inhibitors versus no treatment, Outcome 9 Parenchymal volume.
| Study | |
| Melemadathil 2013 | quote: "there was a small but significant increase in renal parenchymal volume in patients receiving mTOR" |
| Walz 2010 | quote: "The parenchymal volume increased by 26 ml at 1 year and by 56 ml at 2 years in the mTOR‐inhibitors group; the corresponding changes in the placebo group were 62 and 93 ml" |
Comparison 10 mTOR inhibitors versus no treatment, Outcome 10 Parenchymal volume descriptive data.

Comparison 10 mTOR inhibitors versus no treatment, Outcome 11 Proteinuria.
| Study | |
| Melemadathil 2013 | quote: "there was a statistically significant increase in proteinuria in the mTOR arm as compared to the standard treatment group at the end of 6 months" |
Comparison 10 mTOR inhibitors versus no treatment, Outcome 12 Proteinuria descriptive data.

Comparison 10 mTOR inhibitors versus no treatment, Outcome 13 Albuminuria.

Comparison 10 mTOR inhibitors versus no treatment, Outcome 14 Systolic blood pressure.

Comparison 10 mTOR inhibitors versus no treatment, Outcome 15 Diastolic blood pressure.
| Study | |
| Walz 2010 | quote: "The change from baseline in the systolic blood pressure at 24 months was −2.0 mm Hg in the mTOR‐inhibitors group and −1.5 mm Hg in the placebo group (P = 0.76); the corresponding changes in diastolic blood pressure were −2.7 mm Hg and −2.6 mm Hg (P = 0.89)" |
Comparison 10 mTOR inhibitors versus no treatment, Outcome 16 Blood pressure descriptive data.

Comparison 10 mTOR inhibitors versus no treatment, Outcome 17 All‐cause mortality.

Comparison 10 mTOR inhibitors versus no treatment, Outcome 18 Adverse effects.

Comparison 11 Somatostatin analogues versus placebo, Outcome 1 Creatinine.
![Comparison 11 Somatostatin analogues versus placebo, Outcome 2 GFR [mL/min/1.73 m²].](/es/cdsr/doi/10.1002/14651858.CD010294.pub2/media/CDSR/CD010294/image_n/nCD010294-CMP-011-02.png)
Comparison 11 Somatostatin analogues versus placebo, Outcome 2 GFR [mL/min/1.73 m²].
Comparison 11 Somatostatin analogues versus placebo, Outcome 3 Total kidney volume.

Comparison 11 Somatostatin analogues versus placebo, Outcome 4 Cyst volume.
Comparison 11 Somatostatin analogues versus placebo, Outcome 5 Parenchymal volume.
Comparison 11 Somatostatin analogues versus placebo, Outcome 6 Proteinuria.

Comparison 11 Somatostatin analogues versus placebo, Outcome 7 Albuminuria.

Comparison 11 Somatostatin analogues versus placebo, Outcome 8 Systolic blood pressure.

Comparison 11 Somatostatin analogues versus placebo, Outcome 9 Diastolic blood pressure.

Comparison 11 Somatostatin analogues versus placebo, Outcome 10 Mean arterial pressure.

Comparison 11 Somatostatin analogues versus placebo, Outcome 11 Adverse events.
| Study | |
| ELATE Study 2011 | quote: "The median kidney volume was not affected by octreotide and did not change significantly in the 6 patients through the course of the trial (from 798 mL (IQR 675–1960 mL) at baseline to 811 mL (IQR 653–1960 mL) after 48 weeks, p=0.75). Likewise, octreotide‐everolimus combination treatment (n=6) did not affect kidney volume over the course of 48 weeks (from 623 mL (IQR 483–1110 ml) to 602 mL (IQR 493–1259 mL), p=0.75). Change in kidney volume did not differ between treatment arms (p=1.00)" |
Comparison 12 Somatostatin analogues + mTOR inhibitors versus somatostatin analogues alone, Outcome 1 Total kidney volume descriptive data.

Comparison 13 Antiplatelet agents versus placebo, Outcome 1 Creatinine.
![Comparison 13 Antiplatelet agents versus placebo, Outcome 2 GFR [mL/min/1.73 m²].](/es/cdsr/doi/10.1002/14651858.CD010294.pub2/media/CDSR/CD010294/image_n/nCD010294-CMP-013-02.png)
Comparison 13 Antiplatelet agents versus placebo, Outcome 2 GFR [mL/min/1.73 m²].
Comparison 13 Antiplatelet agents versus placebo, Outcome 3 Albuminuria.

Comparison 13 Antiplatelet agents versus placebo, Outcome 4 Systolic blood pressure.
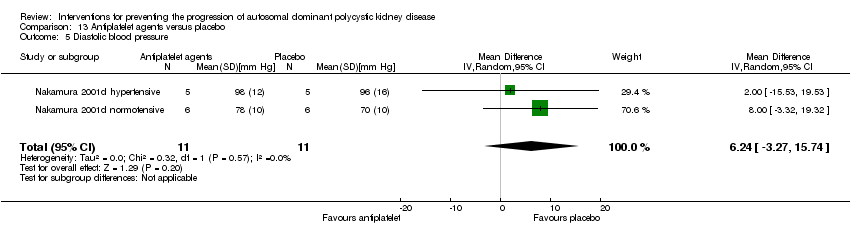
Comparison 13 Antiplatelet agents versus placebo, Outcome 5 Diastolic blood pressure.

Comparison 14 Eicosapentaenoic acids versus standard therapy, Outcome 1 Creatinine.
![Comparison 14 Eicosapentaenoic acids versus standard therapy, Outcome 2 GFR [mL/min/1.73 m²].](/es/cdsr/doi/10.1002/14651858.CD010294.pub2/media/CDSR/CD010294/image_n/nCD010294-CMP-014-02.png)
Comparison 14 Eicosapentaenoic acids versus standard therapy, Outcome 2 GFR [mL/min/1.73 m²].

Comparison 14 Eicosapentaenoic acids versus standard therapy, Outcome 3 Total kidney volume.

Comparison 14 Eicosapentaenoic acids versus standard therapy, Outcome 4 Albuminuria.
| Study | |
| Fassett 2010 | There was a 23% reduction in the rate of GFR change in statins‐treated patients compared with controls, although not statistically significant |
Comparison 15 Statins versus no treatment, Outcome 1 GFR descriptive data.
| Study | |
| van Dijk 2001 | Compared to placebo, treatment with statins significantly increased GFR from 124 ± 4 mL/min to 132 ± 6 mL/min (p < 0.05) |
Comparison 15 Statins versus no treatment, Outcome 2 GFR descriptive data from cross‐over studies.
| Study | |
| Fassett 2010 | Urinary protein excretion decreased by 2.8% in statins‐treated patients and increased by 21.2% in controls |
Comparison 15 Statins versus no treatment, Outcome 3 Proteinuria descriptive data.
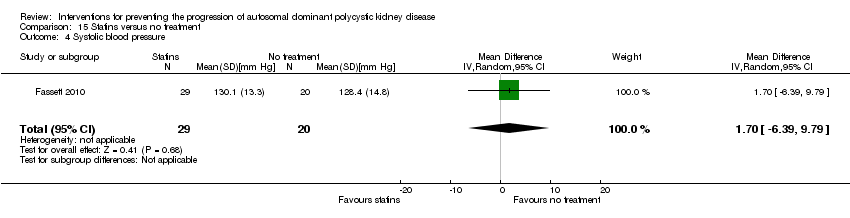
Comparison 15 Statins versus no treatment, Outcome 4 Systolic blood pressure.

Comparison 15 Statins versus no treatment, Outcome 5 Diastolic blood pressure.
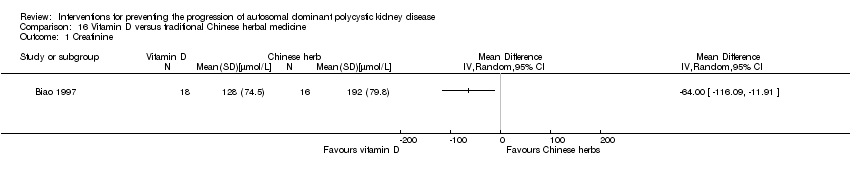
Comparison 16 Vitamin D versus traditional Chinese herbal medicine, Outcome 1 Creatinine.

Comparison 16 Vitamin D versus traditional Chinese herbal medicine, Outcome 2 GFR.
| Outcome or subgroup title | No. of studies | No. of participants | Statistical method | Effect size |
| 1 Serum creatinine Show forest plot | 2 | 42 | Mean Difference (IV, Random, 95% CI) | ‐0.02 [‐0.14, 0.09] |
| 2 GFR [mL/min/1.73 m²] Show forest plot | 3 | 103 | Mean Difference (IV, Random, 95% CI) | ‐3.41 [‐15.83, 9.01] |
| 3 Doubling of serum creatinine Show forest plot | 1 | Risk Ratio (M‐H, Random, 95% CI) | Totals not selected | |
| 4 Total kidney volume Show forest plot | 2 | 42 | Mean Difference (IV, Random, 95% CI) | ‐42.50 [‐115.68, 30.67] |
| 5 Albuminuria Show forest plot | 3 | 103 | Std. Mean Difference (IV, Random, 95% CI) | ‐0.12 [‐0.51, 0.26] |
| 6 Systolic blood pressure Show forest plot | 2 | 42 | Mean Difference (IV, Random, 95% CI) | ‐5.44 [‐14.26, 3.38] |
| 7 Diastolic blood pressure Show forest plot | 2 | 42 | Mean Difference (IV, Random, 95% CI) | ‐4.96 [‐8.88, ‐1.04] |
| 8 Mean arterial pressure Show forest plot | 1 | 61 | Mean Difference (IV, Random, 95% CI) | ‐5.0 [‐6.29, ‐3.71] |
| Outcome or subgroup title | No. of studies | No. of participants | Statistical method | Effect size |
| 1 Creatinine Show forest plot | 1 | Mean Difference (IV, Random, 95% CI) | Totals not selected | |
| 2 GFR [mL/min/1.73 m²] Show forest plot | 1 | 24 | Mean Difference (IV, Random, 95% CI) | ‐13.00 [‐17.56, ‐8.44] |
| 3 Albuminuria Show forest plot | 1 | 24 | Mean Difference (IV, Random, 95% CI) | ‐134.0 [‐176.01, ‐91.99] |
| 4 Systolic blood pressure Show forest plot | 1 | 24 | Mean Difference (IV, Random, 95% CI) | ‐5.0 [‐8.62, ‐1.38] |
| 5 Diastolic blood pressure Show forest plot | 1 | 24 | Mean Difference (IV, Random, 95% CI) | ‐3.0 [‐5.40, ‐0.60] |
| 6 Mean arterial pressure Show forest plot | 1 | 24 | Mean Difference (IV, Random, 95% CI) | ‐3.0 [‐5.40, ‐0.60] |
| Outcome or subgroup title | No. of studies | No. of participants | Statistical method | Effect size |
| 1 Serum creatinine Show forest plot | 2 | 52 | Mean Difference (IV, Random, 95% CI) | 0.00 [‐0.09, 0.10] |
| 2 GFR [mL/min/1.73 m²] Show forest plot | 1 | 32 | Mean Difference (IV, Random, 95% CI) | ‐3.40 [‐22.69, 15.89] |
| 3 Systolic blood pressure Show forest plot | 1 | 32 | Mean Difference (IV, Random, 95% CI) | ‐3.5 [‐9.75, 2.75] |
| 4 Diastolic blood pressure Show forest plot | 1 | 32 | Mean Difference (IV, Random, 95% CI) | ‐1.80 [‐5.23, 1.63] |
| 5 Mean arterial pressure Show forest plot | 1 | 32 | Mean Difference (IV, Random, 95% CI) | ‐2.20 [‐6.41, 2.01] |
| Outcome or subgroup title | No. of studies | No. of participants | Statistical method | Effect size |
| 1 Creatinine Show forest plot | 1 | Mean Difference (IV, Random, 95% CI) | Totals not selected | |
| 2 GFR [mL/min/1.73 m²] Show forest plot | 2 | 65 | Mean Difference (IV, Random, 95% CI) | ‐8.06 [‐29.62, 13.50] |
| 3 GFR descriptive data Show forest plot | Other data | No numeric data | ||
| 4 Need for renal replacement therapy Show forest plot | 1 | 37 | Risk Ratio (M‐H, Random, 95% CI) | 0.39 [0.02, 8.97] |
| 5 Albuminuria Show forest plot | 2 | 65 | Std. Mean Difference (IV, Random, 95% CI) | ‐0.19 [‐1.77, 1.39] |
| 6 Systolic blood pressure Show forest plot | 1 | 37 | Mean Difference (IV, Random, 95% CI) | ‐1.0 [‐2.29, 0.29] |
| 7 Diastolic blood pressure Show forest plot | 1 | 37 | Mean Difference (IV, Random, 95% CI) | 1.0 [0.35, 1.65] |
| 8 Mean arterial pressure Show forest plot | 1 | 28 | Mean Difference (IV, Random, 95% CI) | ‐3.0 [‐4.92, ‐1.08] |
| 9 Blood pressure descriptive data Show forest plot | Other data | No numeric data | ||
| 10 Cardiovascular events Show forest plot | 1 | 37 | Risk Ratio (M‐H, Random, 95% CI) | 1.18 [0.08, 17.42] |
| Outcome or subgroup title | No. of studies | No. of participants | Statistical method | Effect size |
| 1 GFR [mL/min/1.73 m²] Show forest plot | 2 | 69 | Mean Difference (IV, Random, 95% CI) | ‐5.42 [‐15.04, 4.20] |
| 2 Total kidney volume Show forest plot | 2 | 69 | Mean Difference (IV, Random, 95% CI) | 285.79 [‐21.92, 593.50] |
| 3 Cyst volume Show forest plot | 2 | 69 | Mean Difference (IV, Random, 95% CI) | 36.32 [‐6.99, 79.64] |
| 4 Proteinuria Show forest plot | 2 | 69 | Mean Difference (IV, Random, 95% CI) | ‐0.26 [‐0.65, 0.12] |
| 5 Mean arterial pressure Show forest plot | 2 | 69 | Mean Difference (IV, Random, 95% CI) | 0.64 [‐6.21, 7.50] |
| 6 Adverse events Show forest plot | 1 | Risk Ratio (M‐H, Random, 95% CI) | Subtotals only | |
| 6.1 Anaemia | 1 | 53 | Risk Ratio (M‐H, Random, 95% CI) | 0.45 [0.02, 8.82] |
| 6.2 Hyperlipidaemia | 1 | 53 | Risk Ratio (M‐H, Random, 95% CI) | 0.10 [0.01, 1.56] |
| 6.3 Infection | 1 | 53 | Risk Ratio (M‐H, Random, 95% CI) | 0.45 [0.02, 8.82] |
| 6.4 Oral ulcers | 1 | 53 | Risk Ratio (M‐H, Random, 95% CI) | 0.13 [0.01, 2.15] |
| Outcome or subgroup title | No. of studies | No. of participants | Statistical method | Effect size |
| 1 GFR [mL/min/1.73 m²] Show forest plot | 1 | 16 | Mean Difference (IV, Random, 95% CI) | ‐9.60 [‐28.18, 8.98] |
| 2 Doubling of serum creatinine Show forest plot | 1 | Risk Ratio (M‐H, Random, 95% CI) | Totals not selected | |
| 3 Total kidney volume Show forest plot | 1 | 16 | Mean Difference (IV, Random, 95% CI) | 0.37 [0.04, 0.70] |
| 4 Blood pressure descriptive data Show forest plot | Other data | No numeric data | ||
| 5 Infection Show forest plot | 1 | 16 | Risk Ratio (M‐H, Random, 95% CI) | 0.5 [0.13, 2.00] |
| Outcome or subgroup title | No. of studies | No. of participants | Statistical method | Effect size |
| 1 Creatinine Show forest plot | 1 | Mean Difference (IV, Random, 95% CI) | Totals not selected | |
| 2 GFR [mL/min/1.73 m²] Show forest plot | 1 | 31 | Mean Difference (IV, Random, 95% CI) | 6.30 [‐8.49, 21.09] |
| 3 Doubling of serum creatinine Show forest plot | 1 | Risk Ratio (M‐H, Random, 95% CI) | Totals not selected | |
| 4 Proteinuria Show forest plot | 1 | 25 | Mean Difference (IV, Random, 95% CI) | ‐304.0 [‐578.54, ‐29.46] |
| 5 Albuminuria Show forest plot | 1 | 24 | Mean Difference (IV, Random, 95% CI) | ‐238.0 [‐394.61, ‐81.39] |
| Outcome or subgroup title | No. of studies | No. of participants | Statistical method | Effect size |
| 1 Creatinine Show forest plot | 1 | Mean Difference (IV, Random, 95% CI) | Totals not selected | |
| 2 GFR descriptive data Show forest plot | Other data | No numeric data | ||
| 3 Doubling of serum creatinine Show forest plot | 1 | Risk Ratio (M‐H, Random, 95% CI) | Totals not selected | |
| 4 Total kidney volume descriptive data Show forest plot | Other data | No numeric data | ||
| 5 Albuminuria Show forest plot | 1 | 1157 | Mean Difference (IV, Random, 95% CI) | ‐1.60 [‐3.95, 0.75] |
| 6 Kidney pain Show forest plot | 1 | 1444 | Risk Ratio (M‐H, Random, 95% CI) | 0.77 [0.66, 0.90] |
| 7 Adverse events Show forest plot | 2 | Risk Ratio (M‐H, Random, 95% CI) | Subtotals only | |
| 7.1 Headache | 2 | 1455 | Risk Ratio (M‐H, Random, 95% CI) | 1.03 [0.85, 1.25] |
| 7.2 Diarrhoea | 1 | 1444 | Risk Ratio (M‐H, Random, 95% CI) | 1.21 [0.90, 1.64] |
| 7.3 Dizziness | 1 | 1444 | Risk Ratio (M‐H, Random, 95% CI) | 1.30 [0.93, 1.83] |
| 7.4 Dry mouth | 2 | 1455 | Risk Ratio (M‐H, Random, 95% CI) | 1.33 [1.01, 1.76] |
| 7.5 Nausea | 1 | 1444 | Risk Ratio (M‐H, Random, 95% CI) | 0.86 [0.64, 1.18] |
| 7.6 Thirst | 1 | 1444 | Risk Ratio (M‐H, Random, 95% CI) | 2.70 [2.24, 3.24] |
| 7.7 Transaminase elevation | 1 | 1444 | Risk Ratio (M‐H, Random, 95% CI) | 2.26 [0.49, 10.43] |
| Outcome or subgroup title | No. of studies | No. of participants | Statistical method | Effect size |
| 1 Creatinine Show forest plot | 1 | Mean Difference (IV, Random, 95% CI) | Totals not selected | |
| 2 Systolic blood pressure Show forest plot | 1 | 46 | Mean Difference (IV, Random, 95% CI) | ‐9.0 [‐16.98, ‐1.02] |
| 3 Diastolic blood pressure Show forest plot | 1 | 46 | Mean Difference (IV, Random, 95% CI) | ‐6.0 [‐11.21, ‐0.79] |
| Outcome or subgroup title | No. of studies | No. of participants | Statistical method | Effect size |
| 1 GFR [mL/min/1.73 m²] Show forest plot | 2 | 115 | Mean Difference (IV, Random, 95% CI) | 4.45 [‐3.20, 12.11] |
| 2 GFR descriptive data Show forest plot | Other data | No numeric data | ||
| 3 Need for renal replacement therapy Show forest plot | 1 | 431 | Risk Ratio (M‐H, Random, 95% CI) | 3.04 [0.12, 74.26] |
| 4 Need for transplantation Show forest plot | 1 | 431 | Risk Ratio (M‐H, Random, 95% CI) | 1.01 [0.06, 16.11] |
| 5 Total kidney volume Show forest plot | 2 | 115 | Mean Difference (IV, Random, 95% CI) | ‐0.08 [‐0.75, 0.59] |
| 6 Total kidney volume descriptive data Show forest plot | Other data | No numeric data | ||
| 7 Cyst volume Show forest plot | 1 | 15 | Mean Difference (IV, Random, 95% CI) | ‐55.0 [‐862.98, 752.98] |
| 8 Cyst volume descriptive data Show forest plot | Other data | No numeric data | ||
| 9 Parenchymal volume Show forest plot | 1 | 15 | Mean Difference (IV, Random, 95% CI) | 15.0 [‐75.44, 105.44] |
| 10 Parenchymal volume descriptive data Show forest plot | Other data | No numeric data | ||
| 11 Proteinuria Show forest plot | 2 | 446 | Std. Mean Difference (IV, Random, 95% CI) | 0.34 [‐0.29, 0.98] |
| 12 Proteinuria descriptive data Show forest plot | Other data | No numeric data | ||
| 13 Albuminuria Show forest plot | 2 | 115 | Std. Mean Difference (IV, Random, 95% CI) | 0.25 [‐0.27, 0.78] |
| 14 Systolic blood pressure Show forest plot | 2 | 112 | Mean Difference (IV, Random, 95% CI) | 2.48 [‐2.07, 7.03] |
| 15 Diastolic blood pressure Show forest plot | 2 | 112 | Mean Difference (IV, Random, 95% CI) | 0.27 [‐3.30, 3.85] |
| 16 Blood pressure descriptive data Show forest plot | Other data | No numeric data | ||
| 17 All‐cause mortality Show forest plot | 1 | 431 | Risk Ratio (M‐H, Random, 95% CI) | 2.03 [0.19, 22.20] |
| 18 Adverse effects Show forest plot | 3 | Risk Ratio (M‐H, Random, 95% CI) | Subtotals only | |
| 18.1 Anaemia | 1 | 431 | Risk Ratio (M‐H, Random, 95% CI) | 3.41 [1.79, 6.51] |
| 18.2 Angioedema | 3 | 560 | Risk Ratio (M‐H, Random, 95% CI) | 13.39 [2.56, 70.00] |
| 18.3 Diarrhoea | 3 | 560 | Risk Ratio (M‐H, Random, 95% CI) | 1.70 [1.26, 2.29] |
| 18.4 Hyperlipidaemia | 1 | 431 | Risk Ratio (M‐H, Random, 95% CI) | 5.68 [2.23, 14.43] |
| 18.5 Infection | 3 | 560 | Risk Ratio (M‐H, Random, 95% CI) | 1.14 [1.04, 1.25] |
| 18.6 Nausea | 1 | 431 | Risk Ratio (M‐H, Random, 95% CI) | 1.69 [0.85, 3.37] |
| 18.7 Oral ulcers | 3 | 560 | Risk Ratio (M‐H, Random, 95% CI) | 6.77 [4.42, 10.38] |
| Outcome or subgroup title | No. of studies | No. of participants | Statistical method | Effect size |
| 1 Creatinine Show forest plot | 2 | 91 | Mean Difference (IV, Random, 95% CI) | ‐0.43 [‐0.86, ‐0.01] |
| 2 GFR [mL/min/1.73 m²] Show forest plot | 2 | 79 | Mean Difference (IV, Random, 95% CI) | 9.50 [‐4.45, 23.44] |
| 3 Total kidney volume Show forest plot | 3 | 114 | Mean Difference (IV, Random, 95% CI) | ‐0.62 [‐1.22, ‐0.01] |
| 4 Cyst volume Show forest plot | 2 | 82 | Mean Difference (IV, Random, 95% CI) | ‐0.50 [‐1.18, 0.18] |
| 5 Parenchymal volume Show forest plot | 2 | 82 | Mean Difference (IV, Random, 95% CI) | ‐67.67 [‐249.45, 114.12] |
| 6 Proteinuria Show forest plot | 1 | 79 | Mean Difference (IV, Random, 95% CI) | ‐0.05 [‐0.17, 0.07] |
| 7 Albuminuria Show forest plot | 2 | 91 | Std. Mean Difference (IV, Random, 95% CI) | ‐0.10 [‐0.51, 0.31] |
| 8 Systolic blood pressure Show forest plot | 2 | 91 | Mean Difference (IV, Random, 95% CI) | 0.79 [‐3.54, 5.13] |
| 9 Diastolic blood pressure Show forest plot | 2 | 91 | Mean Difference (IV, Random, 95% CI) | ‐0.38 [‐3.68, 2.92] |
| 10 Mean arterial pressure Show forest plot | 1 | 79 | Mean Difference (IV, Random, 95% CI) | ‐0.10 [‐3.66, 3.46] |
| 11 Adverse events Show forest plot | 2 | Risk Ratio (M‐H, Random, 95% CI) | Subtotals only | |
| 11.1 Alopecia | 1 | 79 | Risk Ratio (M‐H, Random, 95% CI) | 4.88 [0.24, 98.47] |
| 11.2 Anaemia | 1 | 79 | Risk Ratio (M‐H, Random, 95% CI) | 1.3 [0.50, 3.40] |
| 11.3 Diarrhoea | 2 | 91 | Risk Ratio (M‐H, Random, 95% CI) | 3.72 [1.43, 9.68] |
| 11.4 Dizziness | 1 | 79 | Risk Ratio (M‐H, Random, 95% CI) | 0.98 [0.06, 15.05] |
| 11.5 Infection | 1 | 79 | Risk Ratio (M‐H, Random, 95% CI) | 1.24 [0.64, 2.39] |
| Outcome or subgroup title | No. of studies | No. of participants | Statistical method | Effect size |
| 1 Total kidney volume descriptive data Show forest plot | Other data | No numeric data | ||
| Outcome or subgroup title | No. of studies | No. of participants | Statistical method | Effect size |
| 1 Creatinine Show forest plot | 2 | 22 | Mean Difference (IV, Random, 95% CI) | ‐0.13 [‐0.52, 0.26] |
| 2 GFR [mL/min/1.73 m²] Show forest plot | 2 | 22 | Mean Difference (IV, Random, 95% CI) | 2.24 [‐8.05, 12.53] |
| 3 Albuminuria Show forest plot | 2 | 22 | Mean Difference (IV, Random, 95% CI) | ‐60.53 [‐129.06, 8.01] |
| 4 Systolic blood pressure Show forest plot | 2 | 22 | Mean Difference (IV, Random, 95% CI) | 5.04 [‐7.34, 17.43] |
| 5 Diastolic blood pressure Show forest plot | 2 | 22 | Mean Difference (IV, Random, 95% CI) | 6.24 [‐3.27, 15.74] |
| Outcome or subgroup title | No. of studies | No. of participants | Statistical method | Effect size |
| 1 Creatinine Show forest plot | 1 | Mean Difference (IV, Random, 95% CI) | Totals not selected | |
| 2 GFR [mL/min/1.73 m²] Show forest plot | 1 | 41 | Mean Difference (IV, Random, 95% CI) | 6.10 [‐11.16, 23.36] |
| 3 Total kidney volume Show forest plot | 1 | 41 | Mean Difference (IV, Random, 95% CI) | ‐209.0 [‐729.06, 311.06] |
| 4 Albuminuria Show forest plot | 1 | 41 | Mean Difference (IV, Random, 95% CI) | 82.40 [‐162.09, 326.89] |
| Outcome or subgroup title | No. of studies | No. of participants | Statistical method | Effect size |
| 1 GFR descriptive data Show forest plot | Other data | No numeric data | ||
| 2 GFR descriptive data from cross‐over studies Show forest plot | Other data | No numeric data | ||
| 3 Proteinuria descriptive data Show forest plot | Other data | No numeric data | ||
| 4 Systolic blood pressure Show forest plot | 1 | 49 | Mean Difference (IV, Random, 95% CI) | 1.70 [‐6.39, 9.79] |
| 5 Diastolic blood pressure Show forest plot | 1 | 49 | Mean Difference (IV, Random, 95% CI) | ‐1.40 [‐5.54, 2.74] |
| Outcome or subgroup title | No. of studies | No. of participants | Statistical method | Effect size |
| 1 Creatinine Show forest plot | 1 | Mean Difference (IV, Random, 95% CI) | Totals not selected | |
| 2 GFR Show forest plot | 1 | 34 | Mean Difference (IV, Random, 95% CI) | 22.60 [0.92, 44.28] |