| 1 Live birth rate per woman by urinary gonadotrophins Show forest plot | 5 | 505 | Risk Ratio (M‐H, Fixed, 95% CI) | 1.21 [0.83, 1.78] |
|
| 1.1 rFSH versus HMG | 3 | 409 | Risk Ratio (M‐H, Fixed, 95% CI) | 1.04 [0.68, 1.57] |
| 1.2 rFSH versus uFSH | 2 | 96 | Risk Ratio (M‐H, Fixed, 95% CI) | 2.66 [0.95, 7.43] |
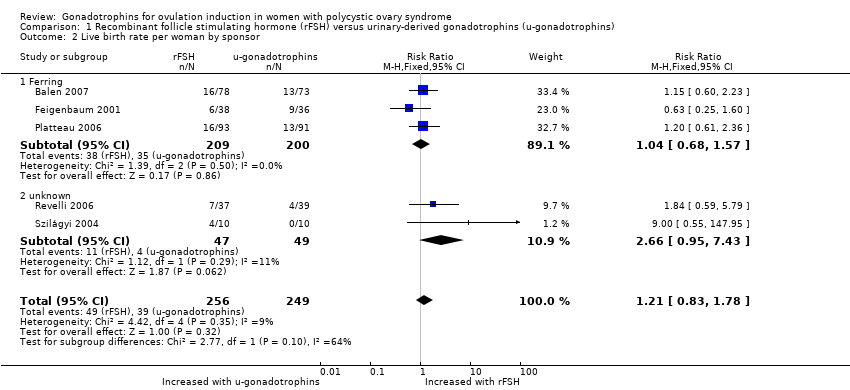
| 2 Live birth rate per woman by sponsor Show forest plot | 5 | 505 | Risk Ratio (M‐H, Fixed, 95% CI) | 1.21 [0.83, 1.78] |
|
| 2.1 Ferring | 3 | 409 | Risk Ratio (M‐H, Fixed, 95% CI) | 1.04 [0.68, 1.57] |
| 2.2 unknown | 2 | 96 | Risk Ratio (M‐H, Fixed, 95% CI) | 2.66 [0.95, 7.43] |
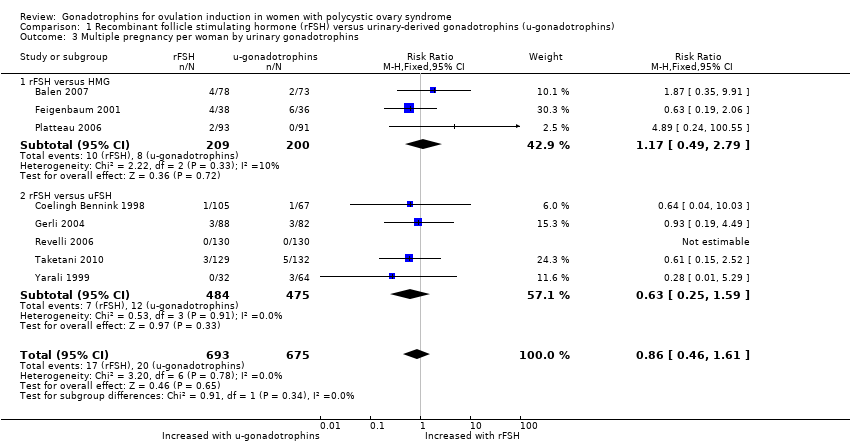
| 3 Multiple pregnancy per woman by urinary gonadotrophins Show forest plot | 8 | 1368 | Risk Ratio (M‐H, Fixed, 95% CI) | 0.86 [0.46, 1.61] |
|
| 3.1 rFSH versus HMG | 3 | 409 | Risk Ratio (M‐H, Fixed, 95% CI) | 1.17 [0.49, 2.79] |
| 3.2 rFSH versus uFSH | 5 | 959 | Risk Ratio (M‐H, Fixed, 95% CI) | 0.63 [0.25, 1.59] |
| 4 Multiple pregnancy per woman by sponsor Show forest plot | 8 | 1368 | Risk Ratio (M‐H, Fixed, 95% CI) | 1.04 [0.67, 1.60] |
|
| 4.1 Ferring | 3 | 409 | Risk Ratio (M‐H, Fixed, 95% CI) | 1.17 [0.49, 2.79] |
| 4.2 MSD ‐ Organon | 1 | 172 | Risk Ratio (M‐H, Fixed, 95% CI) | 1.23 [0.68, 2.23] |
| 4.3 Merck ‐ Serono | 2 | 357 | Risk Ratio (M‐H, Fixed, 95% CI) | 0.51 [0.14, 1.80] |
| 4.4 Unknown | 2 | 430 | Risk Ratio (M‐H, Fixed, 95% CI) | 0.93 [0.19, 4.49] |
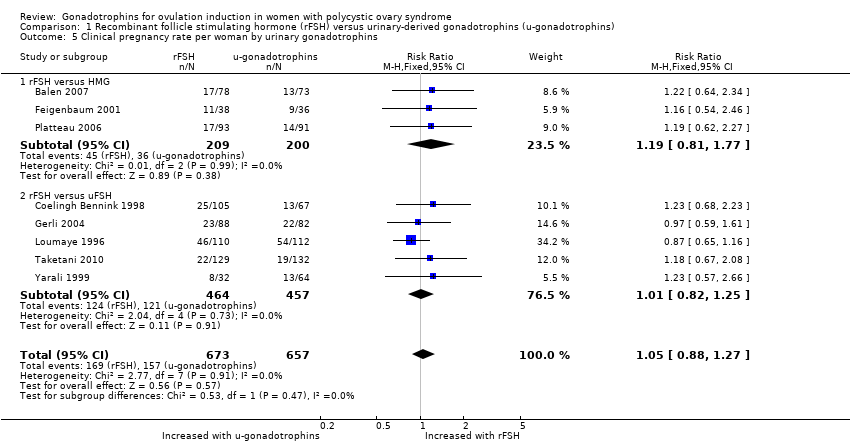
| 5 Clinical pregnancy rate per woman by urinary gonadotrophins Show forest plot | 8 | 1330 | Risk Ratio (M‐H, Fixed, 95% CI) | 1.05 [0.88, 1.27] |
|
| 5.1 rFSH versus HMG | 3 | 409 | Risk Ratio (M‐H, Fixed, 95% CI) | 1.19 [0.81, 1.77] |
| 5.2 rFSH versus uFSH | 5 | 921 | Risk Ratio (M‐H, Fixed, 95% CI) | 1.01 [0.82, 1.25] |
| 6 Incidence of multiple pregnancy per clinical pregnancy by urinary gonadotrophins Show forest plot | 8 | 315 | Risk Ratio (M‐H, Fixed, 95% CI) | 0.75 [0.43, 1.32] |
|
| 6.1 rFSH versus HMG | 3 | 81 | Risk Ratio (M‐H, Fixed, 95% CI) | 0.99 [0.47, 2.09] |
| 6.2 rFSH versus uFSH | 5 | 234 | Risk Ratio (M‐H, Fixed, 95% CI) | 0.57 [0.24, 1.35] |
| 7 Miscarriage rate per woman by urinary gonadotrophins Show forest plot | 7 | 970 | Risk Ratio (M‐H, Fixed, 95% CI) | 1.20 [0.71, 2.04] |
|
| 7.1 rFSH versus HMG | 2 | 335 | Risk Ratio (M‐H, Fixed, 95% CI) | 0.95 [0.24, 3.70] |
| 7.2 rFSH versus uFSH | 5 | 635 | Risk Ratio (M‐H, Fixed, 95% CI) | 1.26 [0.71, 2.23] |
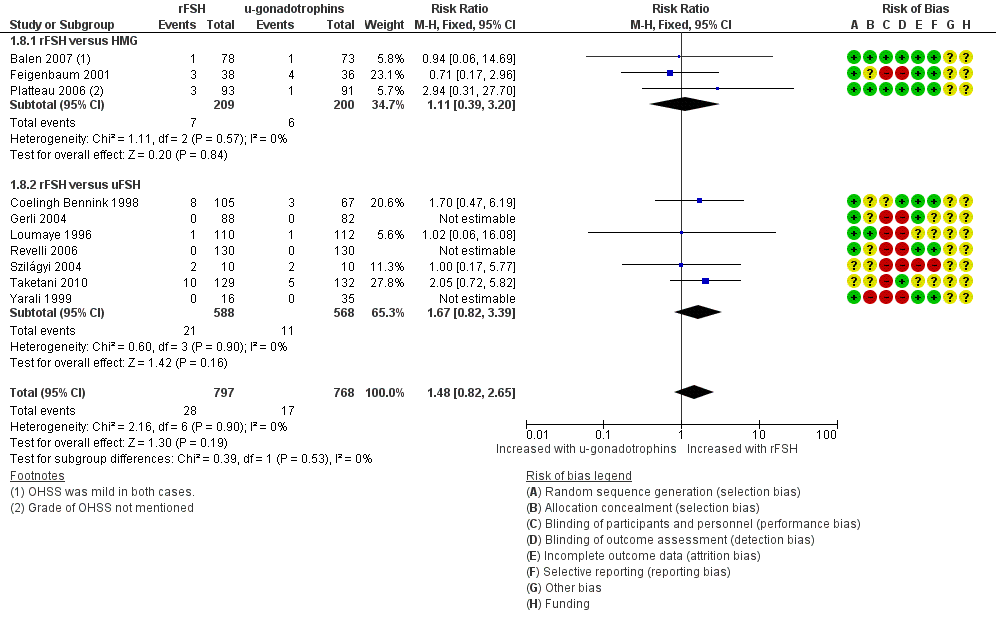
| 8 Incidence of OHSS per woman by urinary gonadotrophins Show forest plot | 10 | 1565 | Risk Ratio (M‐H, Fixed, 95% CI) | 1.48 [0.82, 2.65] |
|
| 8.1 rFSH versus HMG | 3 | 409 | Risk Ratio (M‐H, Fixed, 95% CI) | 1.11 [0.39, 3.20] |
| 8.2 rFSH versus uFSH | 7 | 1156 | Risk Ratio (M‐H, Fixed, 95% CI) | 1.67 [0.82, 3.39] |
| 9 Total gonadotrophin dose per woman (IU) by urinary gonadotrophins Show forest plot | 6 | 1046 | Mean Difference (IV, Fixed, 95% CI) | ‐105.44 [‐154.21, ‐56.68] |
|
| 9.1 rFSH versus HMG | 2 | 335 | Mean Difference (IV, Fixed, 95% CI) | ‐283.94 [‐449.10, ‐118.78] |
| 9.2 rFSH versus uFSH | 4 | 711 | Mean Difference (IV, Fixed, 95% CI) | ‐88.40 [‐139.44, ‐37.36] |
| 10 Total duration of stimulation per woman (days) by urinary gonadotrophins Show forest plot | 6 | 1122 | Mean Difference (IV, Fixed, 95% CI) | ‐0.66 [‐1.04, ‐0.28] |
|
| 10.1 rFSH versus HMG | 2 | 335 | Mean Difference (IV, Fixed, 95% CI) | ‐2.28 [‐3.49, ‐1.07] |
| 10.2 rFSH versus uFSH | 4 | 787 | Mean Difference (IV, Fixed, 95% CI) | ‐0.49 [‐0.88, ‐0.09] |