Les antibiotiques pour le traitement des exacerbations de bronchopneumopathie chronique obstructive
Appendices
Appendix 1. Search methods used in the previous version of this review (published 2012)
Electronic searches
We identified trials using the Cochrane Airways Group Specialised Register of trials, which is derived from systematic searches of bibliographic databases including the Cochrane Central Register of Controlled Trials (CENTRAL), MEDLINE, Embase, CINAHL, AMED, and PsycINFO, and handsearching of respiratory journals and meeting abstracts (see appendix for further details). All records in the Specialised Register coded as 'COPD' were searched using the following terms:
-
antibiotic* or penicillin* or amoxycillin or ampicillin or cefalosporin* or cefaclor or cefalexine or cephalotin or cefazolin or cefixime or cefotaxime or cefpodoxime or cephradine or ceftizoxime or ceftriaxone or cefuroxime or tetracyclin* or demeclocycline or doxycycline or minocycline or oxytetracycline or *cycline or macrolides or azithromycin or clarithromycin or dirithromycin or erythromycin or roxithromycin or telithromycin or troleandomycin or *thromycin or (*mycin) or fluoroquinoln* or ciprofloxacin or gatifloxacin or gemfloxacin or grepafloxacin or levofloxacin or lomefloxacin or moxifloxacin or ofloxacin or sparfloxacin or trovafloxacin or *floxacin or chloramphenicol or clindamycin or trimethoprim or sulfamethxazole or cotrimoxazole or carbapenem* or meropenem or imipenem.
A search of ClinicalTrials.gov was also conducted. Databases were searched from 2005 (their inception) to April 2012. The search from inception to 2006 is described elsewhere (Puhan 2007). There was no restriction on the language of publication.
Searching other resources
Bibliographies of each selected RCT, as well as other systematic reviews, were scrutinised for additional potential RCTs. Authors of identified RCTs and pharmaceutical companies producing antibiotics were contacted for other published, unpublished, or ongoing studies.
Appendix 2. Sources and search methods for the Cochrane Airways Register of Trials
Electronic searches: core databases
| Database | Frequency of search |
| CENTRAL (the Cochrane Library) | Monthly |
| MEDLINE (Ovid) | Weekly |
| Embase (Ovid) | Weekly |
| PsycINFO (Ovid) | Monthly |
| CINAHL (EBSCO) | Monthly |
| AMED (EBSCO) | Monthly |
Handsearches: core respiratory conference abstracts
| Conference | Years searched |
| American Academy of Allergy, Asthma and Immunology (AAAAI) | 2001 onwards |
| American Thoracic Society (ATS) | 2001 onwards |
| Asia Pacific Society of Respirology (APSR) | 2004 onwards |
| British Thoracic Society Winter Meeting (BTS) | 2000 onwards |
| Chest Meeting | 2003 onwards |
| European Respiratory Society (ERS) | 1992, 1994, 2000 onwards |
| International Primary Care Respiratory Group Congress (IPCRG) | 2002 onwards |
| Thoracic Society of Australia and New Zealand (TSANZ) | 1999 onwards |
MEDLINE search strategy used to identify trials for the CAGR
COPD search
1. Lung Diseases, Obstructive/
2. exp Pulmonary Disease, Chronic Obstructive/
3. emphysema$.mp.
4. (chronic$ adj3 bronchiti$).mp.
5. (obstruct$ adj3 (pulmonary or lung$ or airway$ or airflow$ or bronch$ or respirat$)).mp.
6. COPD.mp.
7. COAD.mp.
8. COBD.mp.
9. AECB.mp.
10. or/1‐9
Filter to identify RCTs
1. exp "clinical trial [publication type]"/
2. (randomised or randomised).ab,ti.
3. placebo.ab,ti.
4. dt.fs.
5. randomly.ab,ti.
6. trial.ab,ti.
7. groups.ab,ti.
8. or/1‐7
9. Animals/
10. Humans/
11. 9 not (9 and 10)
12. 8 not 11
The MEDLINE strategy and RCT filter are adapted to identify trials in other electronic databases
Appendix 3. Search strategy to identify relevant trials from the Cochrane Airways Trials Register
Via the Cochrane Register of Studies (CRS)
#1 MeSH DESCRIPTOR Pulmonary Disease, Chronic Obstructive Explode All
#2 MeSH DESCRIPTOR Bronchitis, Chronic
#3 (obstruct*) near3 (pulmonary or lung* or airway* or airflow* or bronch* or respirat*)
#4 COPD:MISC1
#5 (COPD OR COAD OR COBD):TI,AB,KW
#6 #1 OR #2 OR #3 OR #4 OR #5
#7 antibiotic*
#8 penicillin*
#9 amoxycillin
#10 amoxicillin
#11 ampicillin
#12 cefalosporin*
#13 cefaclor
#14 cefazolin
#15 cefixime
#16 cefotaxime
#17 cefpodoxime
#18 cephradine
#19 ceftizoxime
#20 ceftriaxone
#21 cefuroxime
#22 tetracyclin*
#23 demeclocycline
#24 doxycycline
#25 minocycline
#26 oxytetracycline
#27 *cycline
#28 macrolides
#29 azithromycin
#30 clarithromycin
#31 dirithromycin
#32 erythromycin
#33 roxithromycin
#34 telithromycin
#35 troleandomycin
#36 *thromycin
#37 *mycin
#38 ciprofloxacin
#39 gatifloxacin
#40 grepafloxacin
#41 levofloxacin
#42 lomefloxacin
#43 moxifloxacin
#44 ofloxacin
#45 sparfloxacin
#46 trovafloxacin
#47 *floxacin
#48 chloramphenicol
#49 clindamycin
#50 trimethoprim
#51 cotrimoxazole
#52 carbapenem*
#53 meropenem
#54 imipenem
#55 cefalexin*
#56 cephalothin
#57 cefalotin
#58 fluoroquinolone*
#59 gemifloxacin
#60 sulfamethoxazole
#61 cephalosporin
#62 #7 or#8 or #9 or #10 or #11 or #12 or #13 or #14 or #15 or #16 or #17 or #18 or #19 or #20 or #21 or #22 or #23 or #24 or #25 or #26 or #27 or #28 or #29 or #30 or #31 or #32 or #33 or #34 or #35 or #36 or #37 or #38 or #39 or #40 or #41 or #42 or #43 or #44 or #45 or #46 or #47 or #48 or #49 or #50 or #51 or #52 or #53 or #54 or #55 or #56 or #57 or #58 or #59 or #60 or #61
#63 #6 and #62

Study flow diagram.
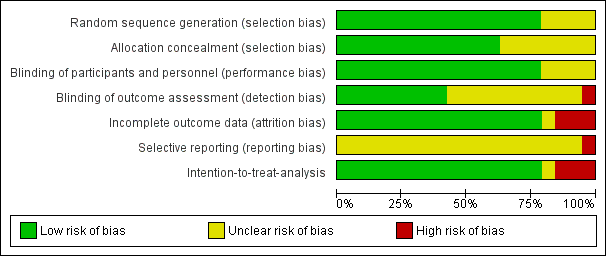
Risk of bias graph: review authors' judgements about each risk of bias item presented as percentages across all included studies.

Risk of bias summary: review authors' judgements about each risk of bias item for each included study.
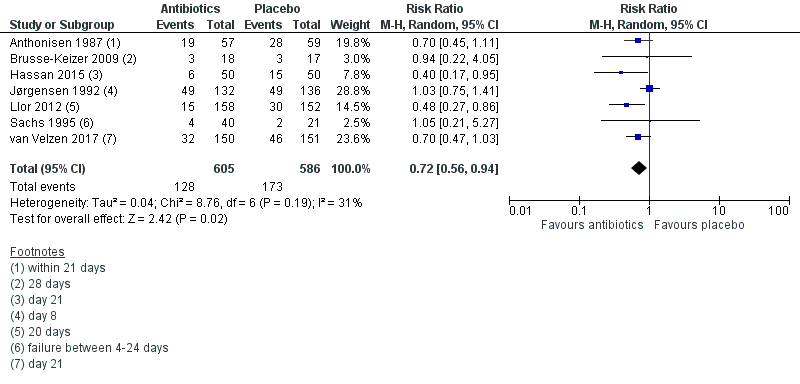
Forest plot of comparison: 1 Antibiotics versus placebo. Outpatients, outcome: 1.2 Treatment failure within 4 weeks ‐ current drugs only.

Forest plot of comparison: 2 Antibiotics versus placebo. Inpatients, outcome: 2.2 Treatment failure within 4 weeks ‐ current drugs only.
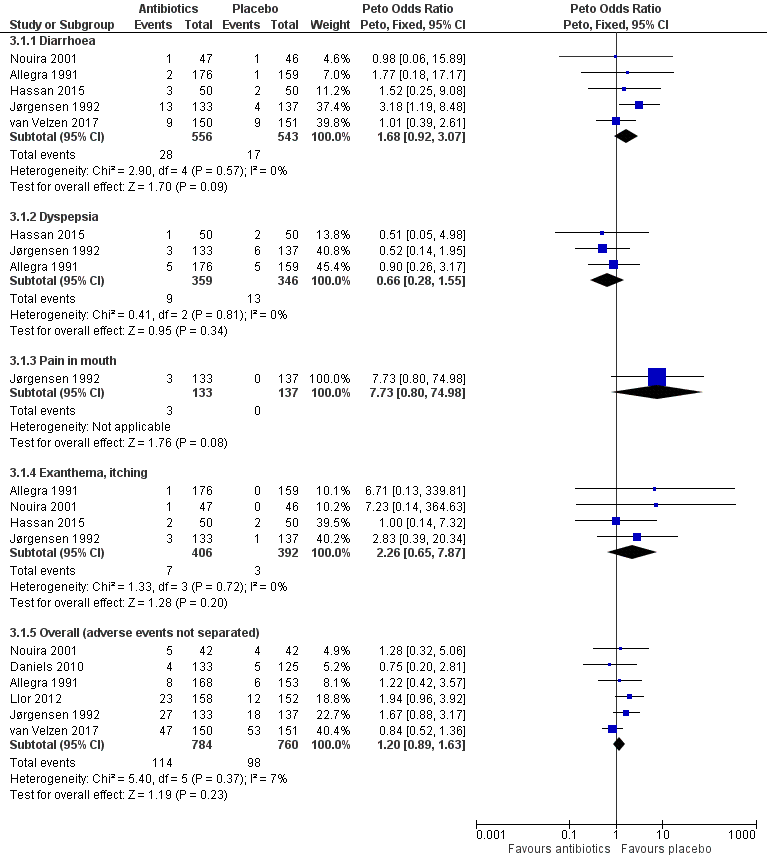
Forest plot of comparison: 3 Antibiotics vs placebo overall, outcome: 3.1 Adverse events.

Forest plot of comparison: 2 Antibiotics versus placebo. Inpatients, outcome: 2.4 Duration of hospital stay (days).

Comparison 1 Antibiotics versus placebo: outpatients, Outcome 1 Treatment failure up to 4 weeks (no resolution or deterioration after trial medication of any duration or death when explicitly stated due to exacerbation or additional course of antibiotics).

Comparison 1 Antibiotics versus placebo: outpatients, Outcome 2 Treatment failure within 4 weeks ‐ current drugs only.

Comparison 1 Antibiotics versus placebo: outpatients, Outcome 3 All‐cause mortality.
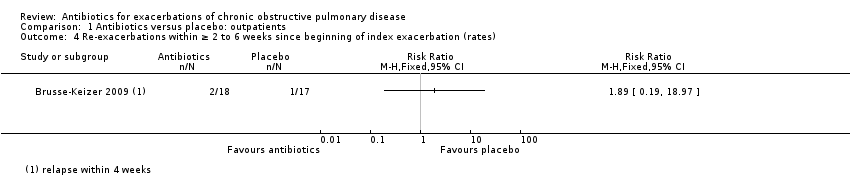
Comparison 1 Antibiotics versus placebo: outpatients, Outcome 4 Re‐exacerbations within ≥ 2 to 6 weeks since beginning of index exacerbation (rates).
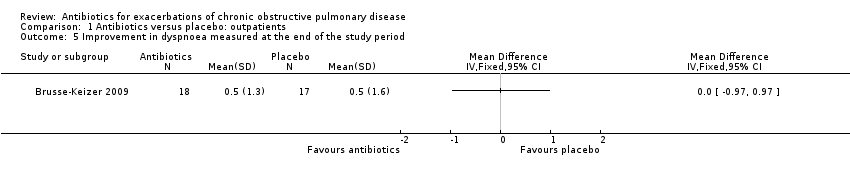
Comparison 1 Antibiotics versus placebo: outpatients, Outcome 5 Improvement in dyspnoea measured at the end of the study period.
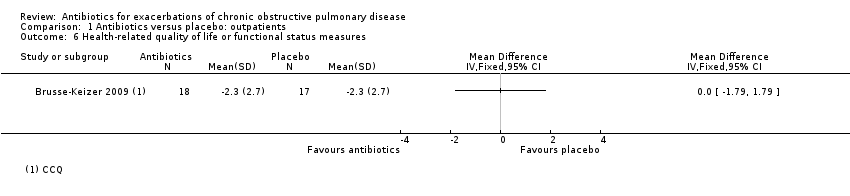
Comparison 1 Antibiotics versus placebo: outpatients, Outcome 6 Health‐related quality of life or functional status measures.

Comparison 1 Antibiotics versus placebo: outpatients, Outcome 7 Days off work.

Comparison 2 Antibiotics versus placebo: inpatients, Outcome 1 Treatment failure up to 4 weeks (no resolution or deterioration after trial medication of any duration or death when explicitly stated due to exacerbation or additional course of antibiotics).

Comparison 2 Antibiotics versus placebo: inpatients, Outcome 2 Treatment failure within 4 weeks ‐ current drugs only.

Comparison 2 Antibiotics versus placebo: inpatients, Outcome 3 All‐cause mortality.

Comparison 2 Antibiotics versus placebo: inpatients, Outcome 4 Duration of hospital stay (days).

Comparison 2 Antibiotics versus placebo: inpatients, Outcome 5 Re‐exacerbations within ≥ 2 to 6 weeks since beginning of index exacerbation (rates).
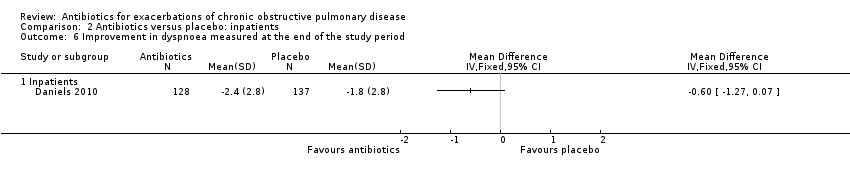
Comparison 2 Antibiotics versus placebo: inpatients, Outcome 6 Improvement in dyspnoea measured at the end of the study period.

Comparison 2 Antibiotics versus placebo: inpatients, Outcome 7 Health‐related quality of life or functional status measures.

Comparison 2 Antibiotics versus placebo: inpatients, Outcome 8 Days off work.

Comparison 3 Antibiotics versus placebo: adverse events, Outcome 1 Adverse events.
| Outpatients: antibiotics compared to placebo for exacerbations of chronic obstructive pulmonary disease | ||||||
| Patient or population: exacerbations of COPD | ||||||
| Outcomes | Anticipated absolute effects* (95% CI) | Relative effect | No. of participants | Certainty of the evidence | Comments | |
| Risk with placebo | Risk with antibiotics | |||||
| Treatment failure within 4 weeks ‐ current drugs only | Study population | RR 0.72 | 1191 | ⊕⊕⊝⊝ | Antibiotics: amoxicillin‐clavulanic acid, trimethoprim‐sulphamethoxazole, oxytetracycline, amoxicillin‐cotrimoxazole, doxycycline, ciprofloxacin, or amoxicillin | |
| 295 per 1000 | 212 per 1000 | |||||
| All‐cause mortality | Study population | OR 1.27 | 301 | ⊕⊕⊝⊝ | Antibiotics: doxycycline | |
| 53 per 1000 | 66 per 1000 | |||||
| *The risk in the intervention group (and its 95% confidence interval) is based on the assumed risk in the comparison group and the relative effect of the intervention (and its 95% CI). | ||||||
| GRADE Working Group grades of evidence. | ||||||
| aDowngrading for inconsistency: I² of 31% is not that high, but results of trials differ and are imprecise. bFor one trial (Allegra), not all results are available. cOnly one study existing; additional trials likely to change the estimates. dThe 95% CIs of the RR 1.27 are very wide (95% CI 0.49 to 3.30). | ||||||
| Inpatients: antibiotics compared to placebo for exacerbations of chronic obstructive pulmonary disease | ||||||
| Patient or population: exacerbations of COPD | ||||||
| Outcomes | Anticipated absolute effects* (95% CI) | Relative effect | No. of participants | Certainty of the evidence | Comments | |
| Risk with placebo | Risk with antibiotics | |||||
| Treatment failure within 4 weeks ‐ current drugs only ‐ inpatient | Study population | RR 0.65 | 576 | ⊕⊕⊕⊝ | Antibiotics: amoxicillin‐clavulanic acid, trimethoprim/sulphamethoxazole, doxycycline, tetracycline hydrochloride, chloramphenicol, penicillin, streptomycin, piperacillin‐sulbactam, ceftazidime, or levofloxacin | |
| 314 per 1000 | 204 per 1000 | |||||
| Treatment failure within 4 weeks ‐ drugs not currently used ‐ ICU | Study population | RR 0.19 | 93 | ⊕⊕⊕⊝ | Antibiotics: ofloxacin | |
| 565 per 1000 | 107 per 1000 | |||||
| Duration of hospital stay (days) ‐ inpatients | Range of duration of hospital stay (days) was from 8.1 to 12.3 days | MD 0.09 (‐0.79 lower to 0.96 higher) | ‐ | 300 (3 RCTs) | ⊕⊕⊕⊕ HIGH | Antibiotics: piperacillin‐sulbactam, ceftazidime, levofloxacin, amoxicillin‐clavulanic acid, trimethoprim/sulphamethoxazole, or cefaclor |
| Duration of hospital stay (days) ‐ ICU patients | Mean duration of hospital stay (days) was 24.5 days | MD ‐9.60 (‐12.84 lower to ‐6.36 lower) | ‐ | 94 | ⊕⊕⊕⊝ | Antibiotics: ofloxacin |
| All‐cause mortality ‐ inpatients | Study population | OR 2.48 | 214 (2 RCTs) | ⊕⊕⊝⊝ | Antibiotics: tetracycline hydrochloride, chloramphenicol, penicillin, streptomycin, chloramphenicol, doxycycline, piperacillin‐sulbactam, ceftazidime, or levofloxacin | |
| 31 per 1000 | 41 per 1000 | |||||
| All‐cause mortality ‐ ICU patients | Study population | OR 0.21 | 93 | ⊕⊕⊕⊝ | Antibiotics: ofloxacin | |
| 217 per 1000 | 45 per 1000 | |||||
| *The risk in the intervention group (and its 95% confidence interval) is based on the assumed risk in the comparison group and the relative effect of the intervention (and its 95% CI). | ||||||
| GRADE Working Group grades of evidence. | ||||||
| aDowngrading for imprecision: the upper limit of the 95% CI overlaps 1.0. bOnly one study existing; the effect estimate may be substantially different with additional trials. cDowngrading for imprecision: wide 95% CI of the pooled estimate that precludes any conclusion about the effects of antibiotics on mortality in inpatients. | ||||||
| Antibiotics compared to placebo overall for exacerbations of chronic obstructive pulmonary disease | ||||||
| Patient or population: exacerbations of COPD | ||||||
| Outcomes | Anticipated absolute effects* (95% CI) | Relative effect | No. of participants | Certainty of the evidence | Comments | |
| Risk with placebo | Risk with antibiotics | |||||
| Adverse events ‐ diarrhoea | Study population | OR 1.68 | 1099 | ⊕⊕⊕⊝ | Antibiotics: amoxicillin‐clavulanic acid, amoxicillin, ofloxacin, piperacillin‐sulbactam, ceftazidime, or levofloxacin‐doxycycline | |
| 31 per 1000 | 52 per 1000 | |||||
| Adverse events ‐ overall (any adverse events not specified) | Study population | OR 1.20 | 1544 | ⊕⊕⊕⊝ | Antibiotics: amoxicillin‐clavulanic acid, doxycycline, amoxicillin, or ofloxacin | |
| 129 per 1000 | 151 per 1000 | |||||
| *The risk in the intervention group (and its 95% confidence interval) is based on the assumed risk in the comparison group and the relative effect of the intervention (and its 95% CI). | ||||||
| GRADE Working Group grades of evidence. | ||||||
| aDowngrading for imprecision: the lower limit of the 95% CI overlaps 1.0. | ||||||
| Study | Antibiotic | Dose (g/d) | Duration (days) | Currently available and used? | Co‐interventions | Control | Setting |
| Amoxicillin‐clavulanic acid (oral) | 2 | 5 | Yes |
| Placebo | Outpatient | |
| Trimethoprim‐sulphamethoxazole or amoxicillin‐clavulanic acid
| 1.9 | 8 | Yes | Prednisone | Placebo and prednisone | Hospital | |
| Trimethoprim/sulphamethoxazole (oral) | 1.9 | 10 | Yes |
| Placebo | Outpatient | |
| Amoxicillin (oral) | 1 | ||||||
| Doxycycline (oral) | 0.1‐0.2 | ||||||
| Oxytetracycline (oral) | 1 g/d | 5 | No |
| Placebo | Outpatient | |
| Amoxicillin‐clavulanic acid (oral) | 1.5 | 7 | Yes | Oral prednisolone 30 mg for 7 days | Placebo for 7 days and oral prednisolone 30 mg for 7 days | Outpatient | |
| Doxycycline (oral) | Not stated | 7 | Yes | IV prednisolone taper | Placebo plus IV prednisolone taper | Hospital | |
| Oxytetracycline (oral) | 1 | 5‐7 | No |
| Placebo | Outpatient | |
| Oxytetracycline (oral) | 1 | 7 | No |
| Placebo | Outpatient | |
| Ciprofloxacin (oral) | 1 | 10 | Yes | Oral prednisolone 40 mg/d for 3 | Placebo | Outpatient | |
| Amoxicillin (oral) | 1.5 | ||||||
| Amoxicillin (oral) | 1.5 | 7 | Yes |
| Placebo | Outpatient | |
| Amoxicillin‐clavulanate (oral) | 1.5 | 8 | Yes | Placebo | Outpatient | ||
| Cefaclor (oral) | 1.5 | 8 | Yes |
| Placebo | Hospital | |
| Ofloxacin (oral) | 0.4 | 10 | Yes |
| Placebo | Medical ICU | |
| Chloramphenicol (oral) | 2 | 10 | No |
| Placebo | Hospital | |
| Penicillin (parenteral) | 1 | 14 | Yes |
| Placebo | Hospital | |
| Tetracycline hydrochloride (oral) or chloramphenicol | 2 | 12 | No |
| Placebo | Hospital | |
| Amoxicillin (oral) | 1.5 or 1.9 | 7 | yes |
| Placebo | Outpatient | |
| Co‐trimoxazole | 1.9 | ||||||
| Doxycycline (oral) | 0.1 | 7 | Yes | 30 mg oral prednisolone daily for 10 days | Placebo and 30 mg oral prednisolone daily for 10 days | Outpatient | |
| Piperacillin‐sulbactam, ceftazidine, or levofloxacin | Not stated | As needed | Yes | No | Placebo | Hospital | |
| IV: intravenous. | |||||||
| Outcome or subgroup title | No. of studies | No. of participants | Statistical method | Effect size |
| 1 Treatment failure up to 4 weeks (no resolution or deterioration after trial medication of any duration or death when explicitly stated due to exacerbation or additional course of antibiotics) Show forest plot | 9 | 1332 | Risk Ratio (M‐H, Random, 95% CI) | 0.69 [0.53, 0.90] |
| 2 Treatment failure within 4 weeks ‐ current drugs only Show forest plot | 7 | 1191 | Risk Ratio (M‐H, Random, 95% CI) | 0.72 [0.56, 0.94] |
| 3 All‐cause mortality Show forest plot | 1 | Peto Odds Ratio (Peto, Fixed, 95% CI) | Totals not selected | |
| 4 Re‐exacerbations within ≥ 2 to 6 weeks since beginning of index exacerbation (rates) Show forest plot | 1 | Risk Ratio (M‐H, Fixed, 95% CI) | Totals not selected | |
| 5 Improvement in dyspnoea measured at the end of the study period Show forest plot | 1 | Mean Difference (IV, Fixed, 95% CI) | Totals not selected | |
| 6 Health‐related quality of life or functional status measures Show forest plot | 1 | Mean Difference (IV, Fixed, 95% CI) | Totals not selected | |
| 7 Days off work Show forest plot | 1 | Mean Difference (IV, Fixed, 95% CI) | Totals not selected | |
| Outcome or subgroup title | No. of studies | No. of participants | Statistical method | Effect size |
| 1 Treatment failure up to 4 weeks (no resolution or deterioration after trial medication of any duration or death when explicitly stated due to exacerbation or additional course of antibiotics) Show forest plot | 6 | 896 | Risk Ratio (M‐H, Random, 95% CI) | 0.60 [0.39, 0.91] |
| 1.1 Inpatient | 5 | 803 | Risk Ratio (M‐H, Random, 95% CI) | 0.76 [0.58, 1.00] |
| 1.2 ICU | 1 | 93 | Risk Ratio (M‐H, Random, 95% CI) | 0.19 [0.08, 0.45] |
| 2 Treatment failure within 4 weeks ‐ current drugs only Show forest plot | 4 | 576 | Risk Ratio (M‐H, Random, 95% CI) | 0.65 [0.38, 1.12] |
| 2.1 Inpatient | 4 | 576 | Risk Ratio (M‐H, Random, 95% CI) | 0.65 [0.38, 1.12] |
| 3 All‐cause mortality Show forest plot | 3 | 507 | Peto Odds Ratio (Peto, Fixed, 95% CI) | 0.95 [0.45, 2.02] |
| 3.1 Inpatients | 2 | 414 | Peto Odds Ratio (Peto, Fixed, 95% CI) | 2.48 [0.94, 6.55] |
| 3.2 ICU patients | 1 | 93 | Peto Odds Ratio (Peto, Fixed, 95% CI) | 0.21 [0.06, 0.72] |
| 4 Duration of hospital stay (days) Show forest plot | 4 | Mean Difference (IV, Random, 95% CI) | Subtotals only | |
| 4.1 Inpatients | 3 | 300 | Mean Difference (IV, Random, 95% CI) | 0.09 [‐0.79, 0.96] |
| 4.2 ICU | 1 | 93 | Mean Difference (IV, Random, 95% CI) | ‐9.6 [‐12.84, ‐6.36] |
| 5 Re‐exacerbations within ≥ 2 to 6 weeks since beginning of index exacerbation (rates) Show forest plot | 2 | Risk Ratio (M‐H, Random, 95% CI) | Totals not selected | |
| 6 Improvement in dyspnoea measured at the end of the study period Show forest plot | 1 | Mean Difference (IV, Fixed, 95% CI) | Totals not selected | |
| 6.1 Inpatients | 1 | Mean Difference (IV, Fixed, 95% CI) | 0.0 [0.0, 0.0] | |
| 7 Health‐related quality of life or functional status measures Show forest plot | 1 | Mean Difference (IV, Fixed, 95% CI) | Totals not selected | |
| 8 Days off work Show forest plot | 1 | Mean Difference (IV, Fixed, 95% CI) | Totals not selected | |
| Outcome or subgroup title | No. of studies | No. of participants | Statistical method | Effect size |
| 1 Adverse events Show forest plot | 7 | Peto Odds Ratio (Peto, Fixed, 95% CI) | Subtotals only | |
| 1.1 Diarrhoea | 5 | 1099 | Peto Odds Ratio (Peto, Fixed, 95% CI) | 1.68 [0.92, 3.07] |
| 1.2 Dyspepsia | 3 | 705 | Peto Odds Ratio (Peto, Fixed, 95% CI) | 0.66 [0.28, 1.55] |
| 1.3 Pain in mouth | 1 | 270 | Peto Odds Ratio (Peto, Fixed, 95% CI) | 7.73 [0.80, 74.98] |
| 1.4 Exanthema, itching | 4 | 798 | Peto Odds Ratio (Peto, Fixed, 95% CI) | 2.26 [0.65, 7.87] |
| 1.5 Overall (adverse events not separated) | 6 | 1544 | Peto Odds Ratio (Peto, Fixed, 95% CI) | 1.20 [0.89, 1.63] |