Concentración de oxígeno baja versus alta ajustada según objetivos de saturación de oxígeno durante la reanimación de neonatos prematuros en el momento del parto
Información
- DOI:
- https://doi.org/10.1002/14651858.CD010239.pub2Copiar DOI

- Base de datos:
-
- Cochrane Database of Systematic Reviews
- Versión publicada:
-
- 04 mayo 2018see what's new
- Tipo:
-
- Intervention
- Etapa:
-
- Review
- Grupo Editorial Cochrane:
-
Grupo Cochrane de Neonatología
- Copyright:
-
- Copyright © 2018 The Cochrane Collaboration. Published by John Wiley & Sons, Ltd.
Cifras del artículo
Altmetric:
Citado por:
Autores
Contributions of authors
Kei Lui conceived and wrote the protocol. Jann Foster wrote the protocol and provided general advice.
Julee Oei, Peter Davis, See Kwee Ching and David Osborn provided general advice on the protocol. Lisa Jones and Jann Foster performed the initial and updated searches and extracted the data. Kei Lui, David Osborn, Jann Foster and Lisa Jones performed the eligibility assessments. Lisa Jones performed the data analyses and wrote up the results sections. David Osborn and Jann Foster cross‐checked the data analyses. Lisa Jones and David Osborn wrote the text of the review. Kei Lui, Jann Foster, Lisa Jones, Peter Davis and David Osborn had input into the final version of the review.
Sources of support
Internal sources
-
No sources of support supplied
External sources
-
Australian Satellite of the Cochrane Neonatal Review Group, Australia.
Declarations of interest
Kei Lui and Ju lee Oei were the investigators of a randomised controlled trial titled Targeted oxygenation in the development of premature infants and their developmental outcome (the TO2RPIDO study).
Acknowledgements
None.
Version history
| Published | Title | Stage | Authors | Version |
| 2018 May 04 | Lower versus higher oxygen concentrations titrated to target oxygen saturations during resuscitation of preterm infants at birth | Review | Kei Lui, Lisa J Jones, Jann P Foster, Peter G Davis, See Kwee Ching, Ju Lee Oei, David A Osborn | |
| 2012 Nov 14 | Higher versus lower oxygen concentrations titrated to target oxygen saturations during resuscitation of preterm infants at birth | Protocol | Kei Lui, Jann P Foster, Peter G Davis, See Kwee Ching, Ju Lee Oei, David A Osborn | |
Differences between protocol and review
Grading of degree of heterogeneity changed to reflect that used by the Neonatal Review Group.
Methods for converting non‐parametric data to parametric data documented and used.
We added the methodology and plan for 'Summary of findings' tables and GRADE recommendations, which were not included in the original protocol.
We included additional outcomes post hoc, including duration of respiratory support (mechanical ventilation), duration of respiratory support (CPAP) and patent ductus arteriosus.
The following statement was added to the inclusion criteria post hoc: 'trials were eligible for inclusion if groups had similar oxygenation saturation targeting at any time during resuscitation and NICU admission periods up to 20 (or 30) minutes'.
We performed updated searches of CENTRAL, MEDLINE, Embase and CINAHL on 13 October 2017 to obtain further reports of published literature.
Keywords
MeSH
Medical Subject Headings (MeSH) Keywords
- *Resuscitation [adverse effects, methods];
- Cerebral Hemorrhage [epidemiology];
- Enterocolitis, Necrotizing [epidemiology];
- Infant Mortality;
- Infant, Premature [*blood];
- Intubation, Intratracheal [statistics & numerical data];
- Lung Diseases [epidemiology];
- Neurodevelopmental Disorders [epidemiology, etiology];
- Oxygen [*administration & dosage, *analysis];
- Randomized Controlled Trials as Topic;
- Retinopathy of Prematurity [epidemiology];
Medical Subject Headings Check Words
Child, Preschool; Humans; Infant; Infant, Newborn;
PICO

Study flow diagram.

'Risk of bias' summary: review authors' judgements about each risk of bias item for each included study.
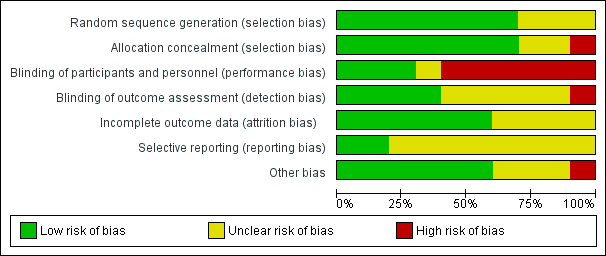
'Risk of bias' graph: review authors' judgements about each risk of bias item presented as percentages across all included studies.

Comparison 1 Lower (FiO2 < 0.4) versus higher (FiO2 ≥ 0.4) oxygen concentration, Outcome 1 Mortality near term corrected age or discharge (latest reported) subgrouped by inspired oxygen concentration.

Comparison 1 Lower (FiO2 < 0.4) versus higher (FiO2 ≥ 0.4) oxygen concentration, Outcome 2 Neurodevelopmental disability.

Comparison 1 Lower (FiO2 < 0.4) versus higher (FiO2 ≥ 0.4) oxygen concentration, Outcome 3 IPPV in the delivery room.

Comparison 1 Lower (FiO2 < 0.4) versus higher (FiO2 ≥ 0.4) oxygen concentration, Outcome 4 Intubation in the delivery room.

Comparison 1 Lower (FiO2 < 0.4) versus higher (FiO2 ≥ 0.4) oxygen concentration, Outcome 5 Time to reach desired oxygen saturation target.

Comparison 1 Lower (FiO2 < 0.4) versus higher (FiO2 ≥ 0.4) oxygen concentration, Outcome 6 Time to reach heart rate > 100 bpm (not prespecified).

Comparison 1 Lower (FiO2 < 0.4) versus higher (FiO2 ≥ 0.4) oxygen concentration, Outcome 7 Retinopathy of prematurity.

Comparison 1 Lower (FiO2 < 0.4) versus higher (FiO2 ≥ 0.4) oxygen concentration, Outcome 8 Severe retinopathy of prematurity (≥ stage 3).
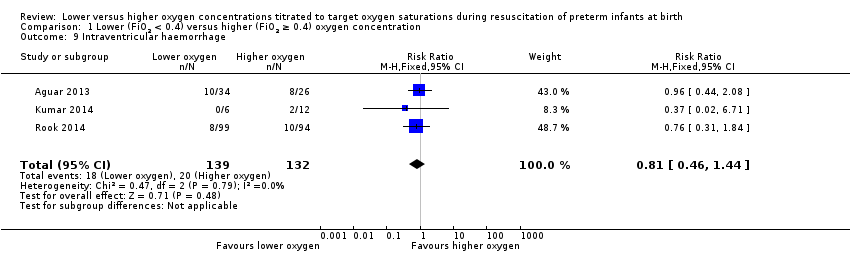
Comparison 1 Lower (FiO2 < 0.4) versus higher (FiO2 ≥ 0.4) oxygen concentration, Outcome 9 Intraventricular haemorrhage.
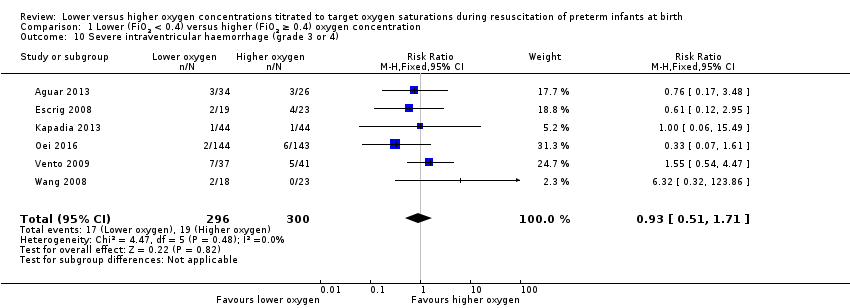
Comparison 1 Lower (FiO2 < 0.4) versus higher (FiO2 ≥ 0.4) oxygen concentration, Outcome 10 Severe intraventricular haemorrhage (grade 3 or 4).

Comparison 1 Lower (FiO2 < 0.4) versus higher (FiO2 ≥ 0.4) oxygen concentration, Outcome 11 Periventricular leukomalacia.
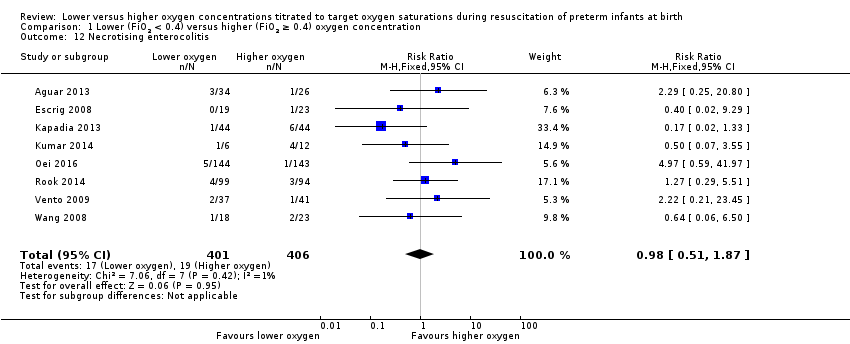
Comparison 1 Lower (FiO2 < 0.4) versus higher (FiO2 ≥ 0.4) oxygen concentration, Outcome 12 Necrotising enterocolitis.

Comparison 1 Lower (FiO2 < 0.4) versus higher (FiO2 ≥ 0.4) oxygen concentration, Outcome 13 Chronic lung disease (28 days' age).
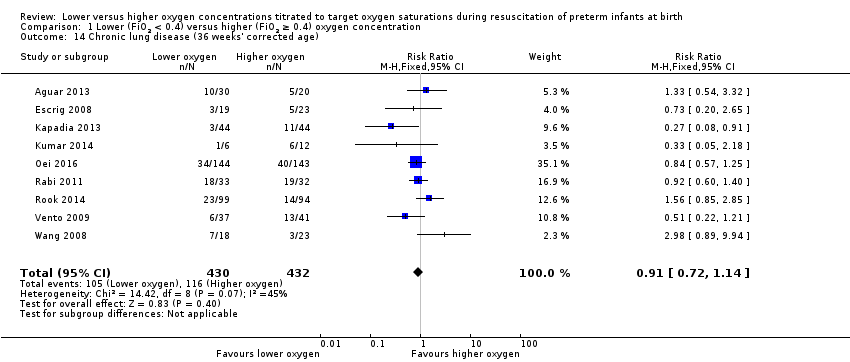
Comparison 1 Lower (FiO2 < 0.4) versus higher (FiO2 ≥ 0.4) oxygen concentration, Outcome 14 Chronic lung disease (36 weeks' corrected age).

Comparison 1 Lower (FiO2 < 0.4) versus higher (FiO2 ≥ 0.4) oxygen concentration, Outcome 15 Duration of respiratory support (mechanical ventilation or CPAP) (days from birth).

Comparison 1 Lower (FiO2 < 0.4) versus higher (FiO2 ≥ 0.4) oxygen concentration, Outcome 16 Duration of respiratory support (mechanical ventilation) (days from birth).

Comparison 1 Lower (FiO2 < 0.4) versus higher (FiO2 ≥ 0.4) oxygen concentration, Outcome 17 Duration of respiratory support (CPAP) (days from birth).

Comparison 1 Lower (FiO2 < 0.4) versus higher (FiO2 ≥ 0.4) oxygen concentration, Outcome 18 Duration of supplemental oxygen administration.
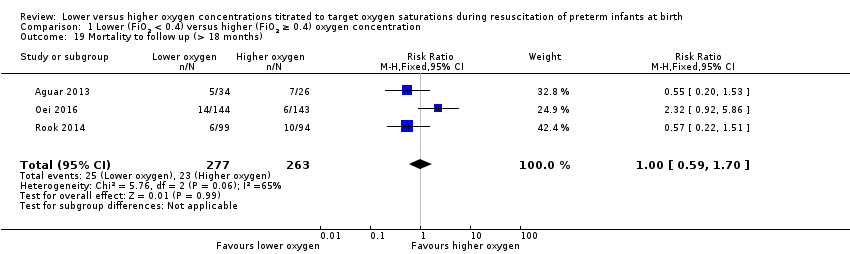
Comparison 1 Lower (FiO2 < 0.4) versus higher (FiO2 ≥ 0.4) oxygen concentration, Outcome 19 Mortality to follow up (> 18 months).

Comparison 1 Lower (FiO2 < 0.4) versus higher (FiO2 ≥ 0.4) oxygen concentration, Outcome 20 Postnatal growth failure (weight < 10th percentile at discharge).

Comparison 1 Lower (FiO2 < 0.4) versus higher (FiO2 ≥ 0.4) oxygen concentration, Outcome 21 Duration of hospitalisation (days).

Comparison 1 Lower (FiO2 < 0.4) versus higher (FiO2 ≥ 0.4) oxygen concentration, Outcome 22 Patent ductus arteriosus (not prespecified).

Comparison 2 Lower versus higher oxygen concentration subgrouped by FiO2, Outcome 1 Mortality near term corrected age or discharge (latest reported) subgrouped by inspired oxygen concentration.

Comparison 2 Lower versus higher oxygen concentration subgrouped by FiO2, Outcome 2 Neurodevelopmental disability.
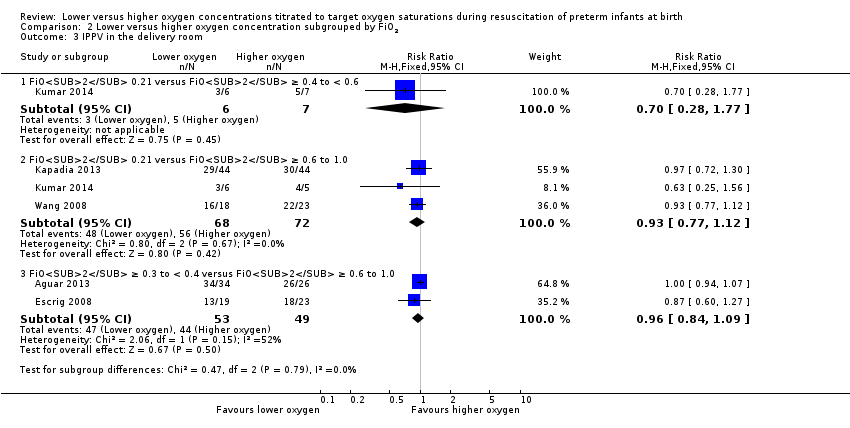
Comparison 2 Lower versus higher oxygen concentration subgrouped by FiO2, Outcome 3 IPPV in the delivery room.
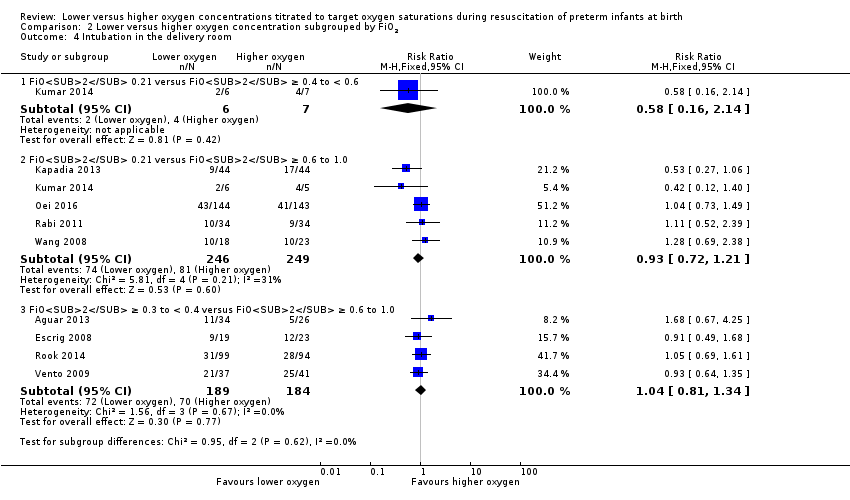
Comparison 2 Lower versus higher oxygen concentration subgrouped by FiO2, Outcome 4 Intubation in the delivery room.

Comparison 2 Lower versus higher oxygen concentration subgrouped by FiO2, Outcome 5 Time to reach desired oxygen saturation target.
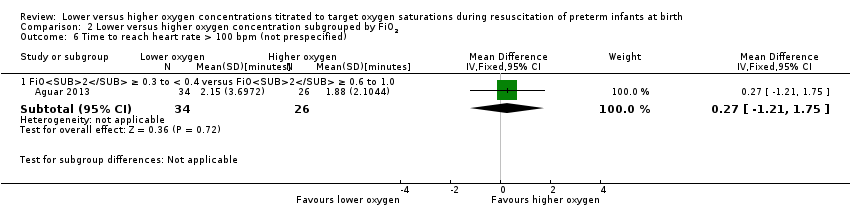
Comparison 2 Lower versus higher oxygen concentration subgrouped by FiO2, Outcome 6 Time to reach heart rate > 100 bpm (not prespecified).

Comparison 2 Lower versus higher oxygen concentration subgrouped by FiO2, Outcome 7 Retinopathy of prematurity.

Comparison 2 Lower versus higher oxygen concentration subgrouped by FiO2, Outcome 8 Severe retinopathy of prematurity (≥ stage 3).

Comparison 2 Lower versus higher oxygen concentration subgrouped by FiO2, Outcome 9 Intraventricular haemorrhage.

Comparison 2 Lower versus higher oxygen concentration subgrouped by FiO2, Outcome 10 Severe intraventricular haemorrhage (grade 3 or 4).

Comparison 2 Lower versus higher oxygen concentration subgrouped by FiO2, Outcome 11 Periventricular leukomalacia.

Comparison 2 Lower versus higher oxygen concentration subgrouped by FiO2, Outcome 12 Necrotising enterocolitis.
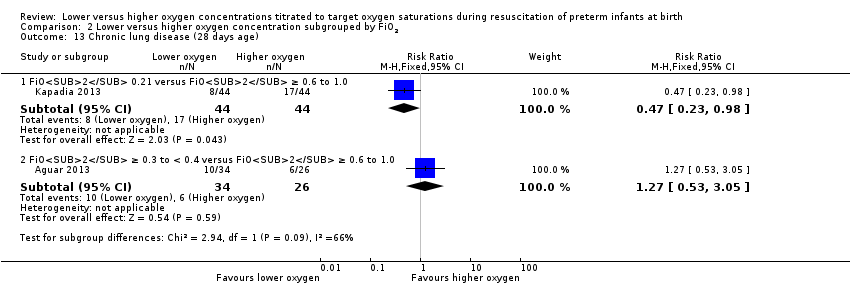
Comparison 2 Lower versus higher oxygen concentration subgrouped by FiO2, Outcome 13 Chronic lung disease (28 days age).
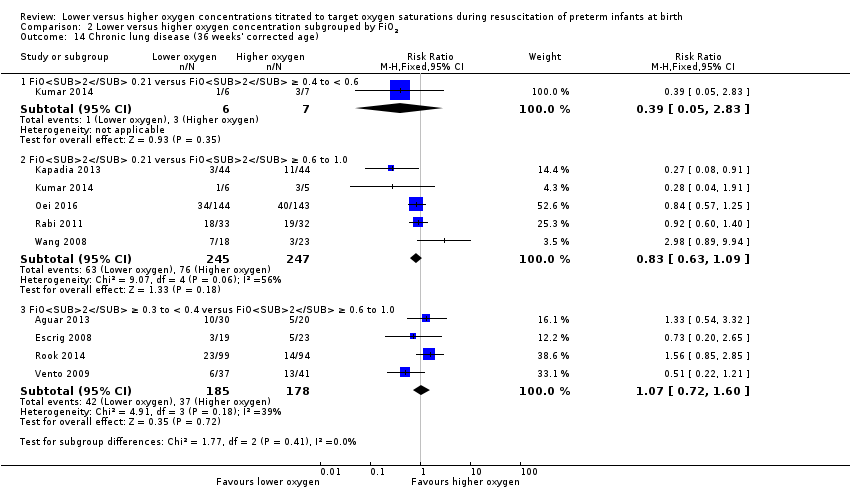
Comparison 2 Lower versus higher oxygen concentration subgrouped by FiO2, Outcome 14 Chronic lung disease (36 weeks' corrected age).
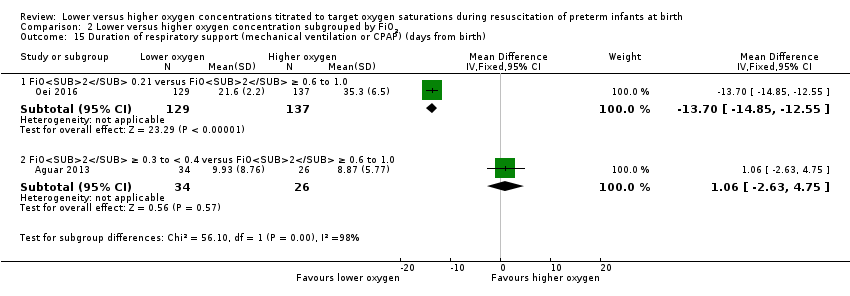
Comparison 2 Lower versus higher oxygen concentration subgrouped by FiO2, Outcome 15 Duration of respiratory support (mechanical ventilation or CPAP) (days from birth).
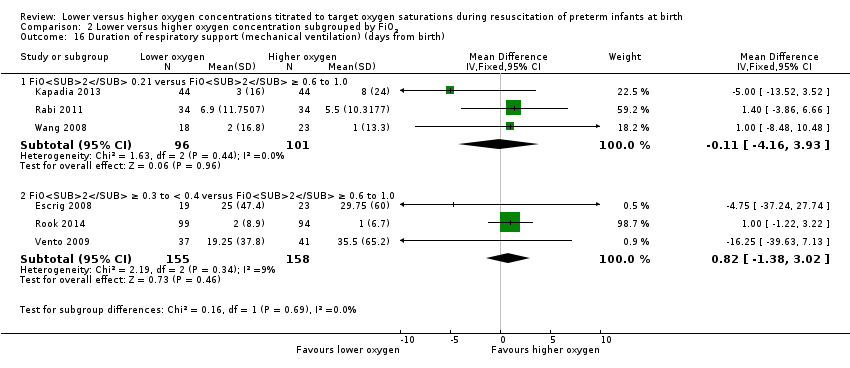
Comparison 2 Lower versus higher oxygen concentration subgrouped by FiO2, Outcome 16 Duration of respiratory support (mechanical ventilation) (days from birth).
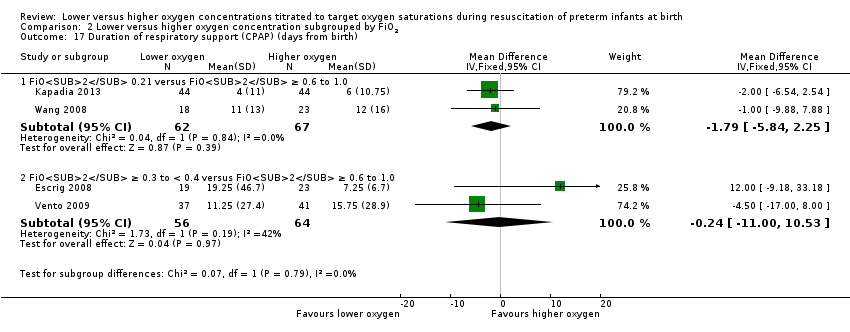
Comparison 2 Lower versus higher oxygen concentration subgrouped by FiO2, Outcome 17 Duration of respiratory support (CPAP) (days from birth).

Comparison 2 Lower versus higher oxygen concentration subgrouped by FiO2, Outcome 18 Duration of supplemental oxygen administration.

Comparison 2 Lower versus higher oxygen concentration subgrouped by FiO2, Outcome 19 Mortality to follow up (> 18 months).

Comparison 2 Lower versus higher oxygen concentration subgrouped by FiO2, Outcome 20 Postnatal growth failure (weight < 10th percentile at discharge).

Comparison 2 Lower versus higher oxygen concentration subgrouped by FiO2, Outcome 21 Duration of hospitalisation (days).
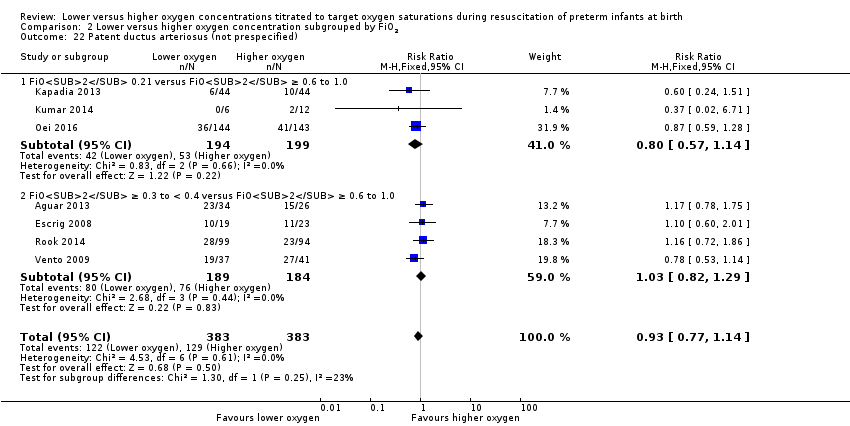
Comparison 2 Lower versus higher oxygen concentration subgrouped by FiO2, Outcome 22 Patent ductus arteriosus (not prespecified).

Comparison 3 Lower (FiO2 < 0.4) versus higher (FiO2 ≥ 0.4) oxygen concentration subgrouped by lower limit of oxygen saturation range at 5 to 10 mintues, Outcome 1 Mortality near term corrected age or discharge (latest reported).

Comparison 3 Lower (FiO2 < 0.4) versus higher (FiO2 ≥ 0.4) oxygen concentration subgrouped by lower limit of oxygen saturation range at 5 to 10 mintues, Outcome 2 Neurodevelopmental disability.
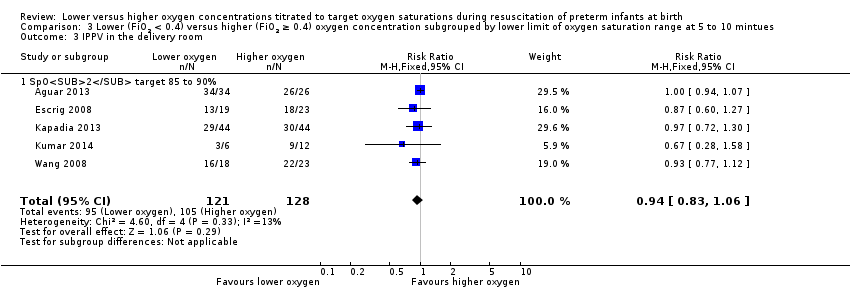
Comparison 3 Lower (FiO2 < 0.4) versus higher (FiO2 ≥ 0.4) oxygen concentration subgrouped by lower limit of oxygen saturation range at 5 to 10 mintues, Outcome 3 IPPV in the delivery room.
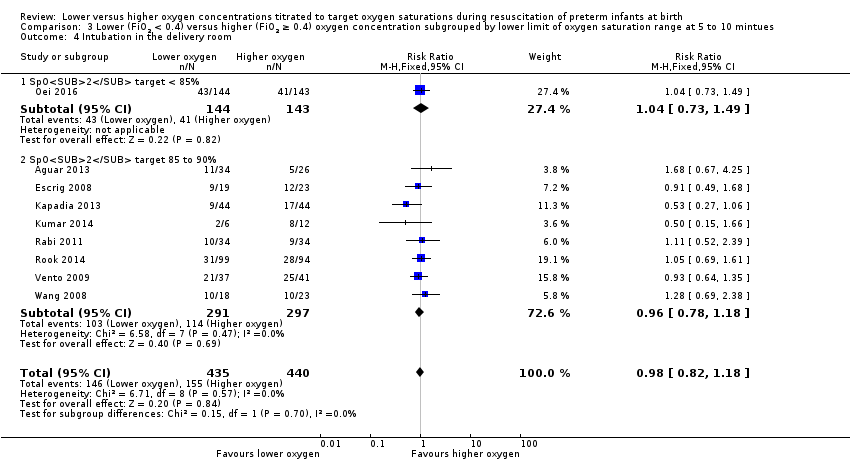
Comparison 3 Lower (FiO2 < 0.4) versus higher (FiO2 ≥ 0.4) oxygen concentration subgrouped by lower limit of oxygen saturation range at 5 to 10 mintues, Outcome 4 Intubation in the delivery room.
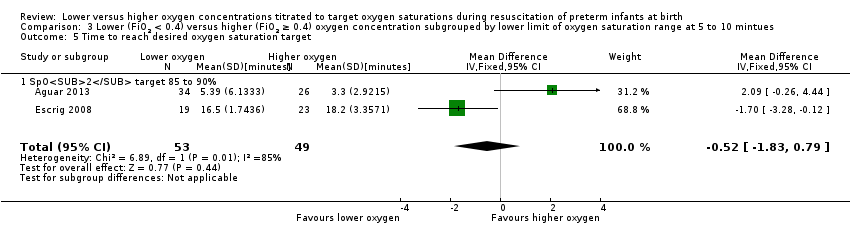
Comparison 3 Lower (FiO2 < 0.4) versus higher (FiO2 ≥ 0.4) oxygen concentration subgrouped by lower limit of oxygen saturation range at 5 to 10 mintues, Outcome 5 Time to reach desired oxygen saturation target.
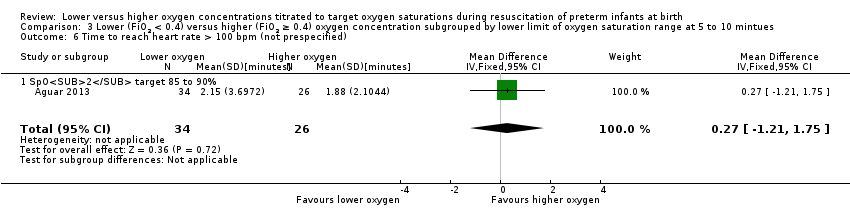
Comparison 3 Lower (FiO2 < 0.4) versus higher (FiO2 ≥ 0.4) oxygen concentration subgrouped by lower limit of oxygen saturation range at 5 to 10 mintues, Outcome 6 Time to reach heart rate > 100 bpm (not prespecified).

Comparison 3 Lower (FiO2 < 0.4) versus higher (FiO2 ≥ 0.4) oxygen concentration subgrouped by lower limit of oxygen saturation range at 5 to 10 mintues, Outcome 7 Retinopathy of prematurity.

Comparison 3 Lower (FiO2 < 0.4) versus higher (FiO2 ≥ 0.4) oxygen concentration subgrouped by lower limit of oxygen saturation range at 5 to 10 mintues, Outcome 8 Severe retinopathy of prematurity (≥ stage 3).

Comparison 3 Lower (FiO2 < 0.4) versus higher (FiO2 ≥ 0.4) oxygen concentration subgrouped by lower limit of oxygen saturation range at 5 to 10 mintues, Outcome 9 Intraventricular haemorrhage.
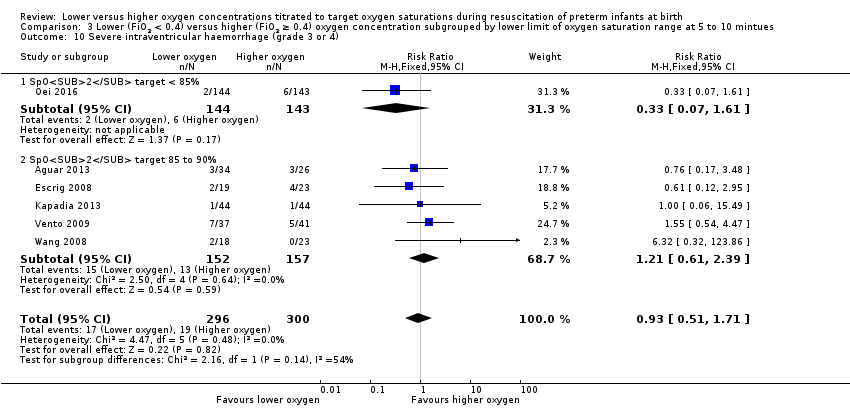
Comparison 3 Lower (FiO2 < 0.4) versus higher (FiO2 ≥ 0.4) oxygen concentration subgrouped by lower limit of oxygen saturation range at 5 to 10 mintues, Outcome 10 Severe intraventricular haemorrhage (grade 3 or 4).
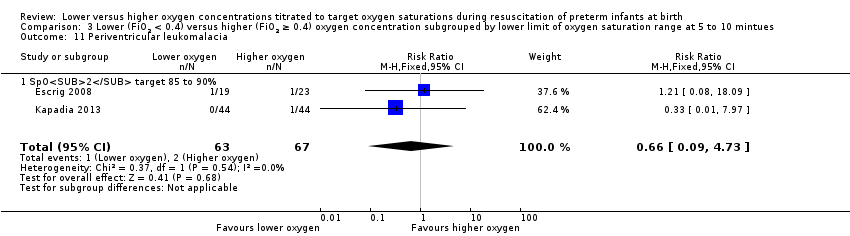
Comparison 3 Lower (FiO2 < 0.4) versus higher (FiO2 ≥ 0.4) oxygen concentration subgrouped by lower limit of oxygen saturation range at 5 to 10 mintues, Outcome 11 Periventricular leukomalacia.

Comparison 3 Lower (FiO2 < 0.4) versus higher (FiO2 ≥ 0.4) oxygen concentration subgrouped by lower limit of oxygen saturation range at 5 to 10 mintues, Outcome 12 Necrotising enterocolitis.

Comparison 3 Lower (FiO2 < 0.4) versus higher (FiO2 ≥ 0.4) oxygen concentration subgrouped by lower limit of oxygen saturation range at 5 to 10 mintues, Outcome 13 Chronic lung disease (28 days' age).

Comparison 3 Lower (FiO2 < 0.4) versus higher (FiO2 ≥ 0.4) oxygen concentration subgrouped by lower limit of oxygen saturation range at 5 to 10 mintues, Outcome 14 Chronic lung disease (36 weeks' corrected age).

Comparison 3 Lower (FiO2 < 0.4) versus higher (FiO2 ≥ 0.4) oxygen concentration subgrouped by lower limit of oxygen saturation range at 5 to 10 mintues, Outcome 15 Duration of respiratory support (mechanical ventilation or CPAP) (days from birth).

Comparison 3 Lower (FiO2 < 0.4) versus higher (FiO2 ≥ 0.4) oxygen concentration subgrouped by lower limit of oxygen saturation range at 5 to 10 mintues, Outcome 16 Duration of respiratory support (mechanical ventilation) (days from birth).
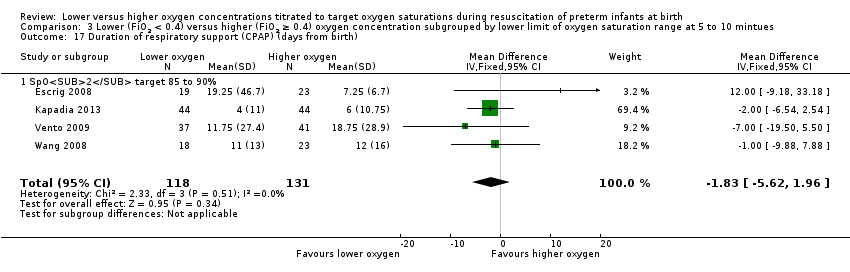
Comparison 3 Lower (FiO2 < 0.4) versus higher (FiO2 ≥ 0.4) oxygen concentration subgrouped by lower limit of oxygen saturation range at 5 to 10 mintues, Outcome 17 Duration of respiratory support (CPAP) (days from birth).

Comparison 3 Lower (FiO2 < 0.4) versus higher (FiO2 ≥ 0.4) oxygen concentration subgrouped by lower limit of oxygen saturation range at 5 to 10 mintues, Outcome 18 Duration of supplemental oxygen administration.

Comparison 3 Lower (FiO2 < 0.4) versus higher (FiO2 ≥ 0.4) oxygen concentration subgrouped by lower limit of oxygen saturation range at 5 to 10 mintues, Outcome 19 Mortality to follow up (> 18 months).

Comparison 3 Lower (FiO2 < 0.4) versus higher (FiO2 ≥ 0.4) oxygen concentration subgrouped by lower limit of oxygen saturation range at 5 to 10 mintues, Outcome 20 Postnatal growth failure (weight < 10th percentile at discharge).

Comparison 3 Lower (FiO2 < 0.4) versus higher (FiO2 ≥ 0.4) oxygen concentration subgrouped by lower limit of oxygen saturation range at 5 to 10 mintues, Outcome 21 Duration of hospitalisation (days).
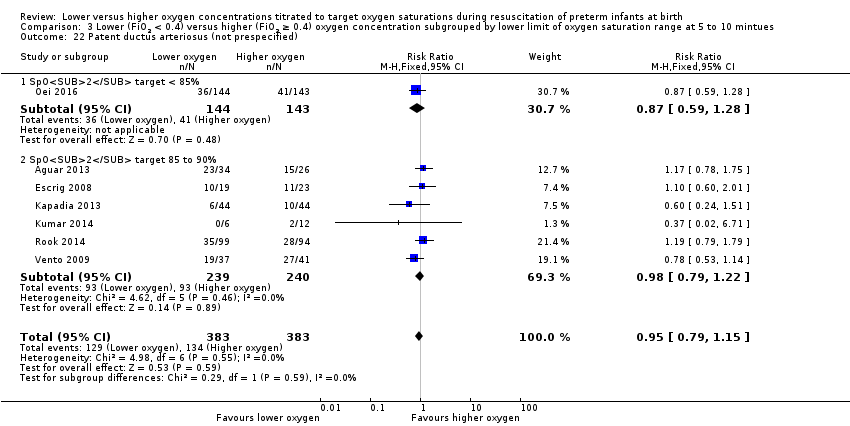
Comparison 3 Lower (FiO2 < 0.4) versus higher (FiO2 ≥ 0.4) oxygen concentration subgrouped by lower limit of oxygen saturation range at 5 to 10 mintues, Outcome 22 Patent ductus arteriosus (not prespecified).

Comparison 4 Lower (FiO2 < 0.4) versus higher (FiO2 ≥ 0.4) oxygen concentration subgrouped by highest SpO2 limit at 10 minutes, Outcome 1 Mortality near term corrected age or discharge (latest reported).

Comparison 4 Lower (FiO2 < 0.4) versus higher (FiO2 ≥ 0.4) oxygen concentration subgrouped by highest SpO2 limit at 10 minutes, Outcome 2 Neurodevelopmental disability.

Comparison 4 Lower (FiO2 < 0.4) versus higher (FiO2 ≥ 0.4) oxygen concentration subgrouped by highest SpO2 limit at 10 minutes, Outcome 3 IPPV in the delivery room.
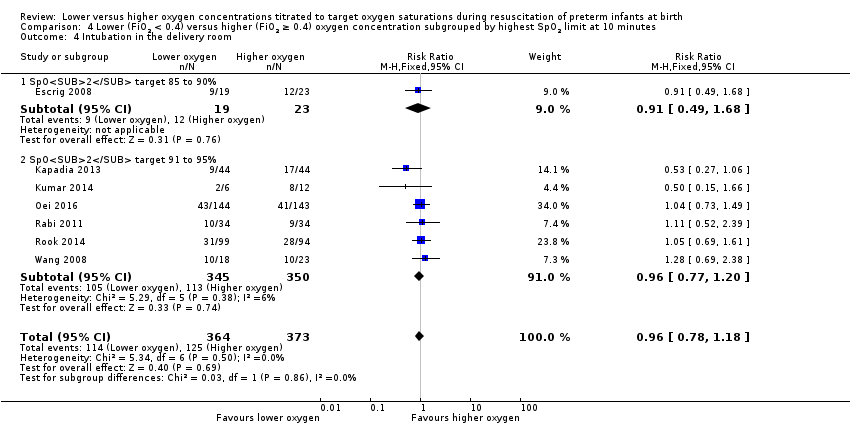
Comparison 4 Lower (FiO2 < 0.4) versus higher (FiO2 ≥ 0.4) oxygen concentration subgrouped by highest SpO2 limit at 10 minutes, Outcome 4 Intubation in the delivery room.
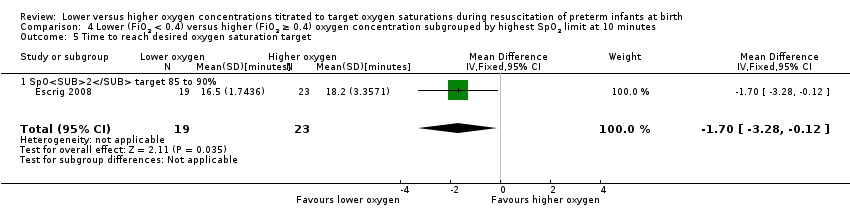
Comparison 4 Lower (FiO2 < 0.4) versus higher (FiO2 ≥ 0.4) oxygen concentration subgrouped by highest SpO2 limit at 10 minutes, Outcome 5 Time to reach desired oxygen saturation target.

Comparison 4 Lower (FiO2 < 0.4) versus higher (FiO2 ≥ 0.4) oxygen concentration subgrouped by highest SpO2 limit at 10 minutes, Outcome 6 Retinopathy of prematurity.

Comparison 4 Lower (FiO2 < 0.4) versus higher (FiO2 ≥ 0.4) oxygen concentration subgrouped by highest SpO2 limit at 10 minutes, Outcome 7 Severe retinopathy of prematurity (≥ stage 3).

Comparison 4 Lower (FiO2 < 0.4) versus higher (FiO2 ≥ 0.4) oxygen concentration subgrouped by highest SpO2 limit at 10 minutes, Outcome 8 Intraventricular haemorrhage.
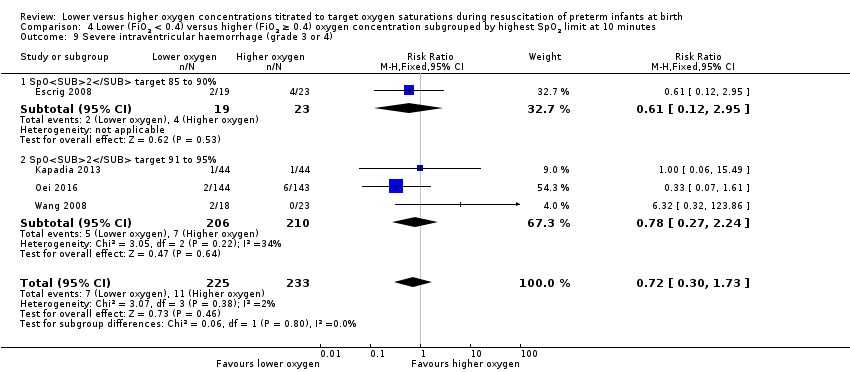
Comparison 4 Lower (FiO2 < 0.4) versus higher (FiO2 ≥ 0.4) oxygen concentration subgrouped by highest SpO2 limit at 10 minutes, Outcome 9 Severe intraventricular haemorrhage (grade 3 or 4).

Comparison 4 Lower (FiO2 < 0.4) versus higher (FiO2 ≥ 0.4) oxygen concentration subgrouped by highest SpO2 limit at 10 minutes, Outcome 10 Periventricular leukomalacia.

Comparison 4 Lower (FiO2 < 0.4) versus higher (FiO2 ≥ 0.4) oxygen concentration subgrouped by highest SpO2 limit at 10 minutes, Outcome 11 Necrotising enterocolitis.

Comparison 4 Lower (FiO2 < 0.4) versus higher (FiO2 ≥ 0.4) oxygen concentration subgrouped by highest SpO2 limit at 10 minutes, Outcome 12 Chronic lung disease (28 days age).

Comparison 4 Lower (FiO2 < 0.4) versus higher (FiO2 ≥ 0.4) oxygen concentration subgrouped by highest SpO2 limit at 10 minutes, Outcome 13 Chronic lung disease (36 weeks' corrected age).

Comparison 4 Lower (FiO2 < 0.4) versus higher (FiO2 ≥ 0.4) oxygen concentration subgrouped by highest SpO2 limit at 10 minutes, Outcome 14 Duration of respiratory support (mechanical ventilation or CPAP) (days from birth).
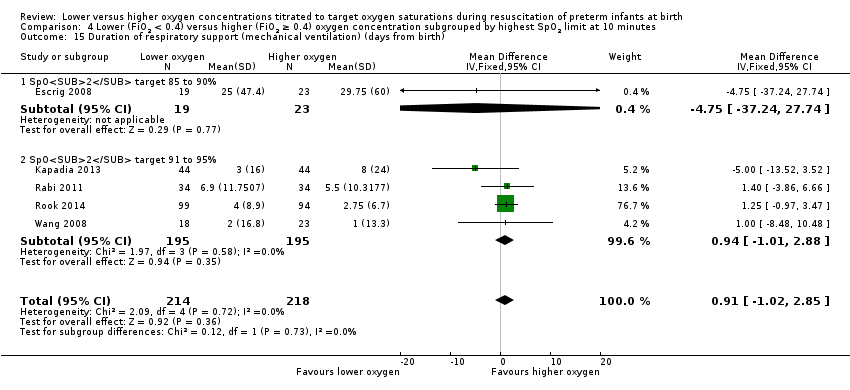
Comparison 4 Lower (FiO2 < 0.4) versus higher (FiO2 ≥ 0.4) oxygen concentration subgrouped by highest SpO2 limit at 10 minutes, Outcome 15 Duration of respiratory support (mechanical ventilation) (days from birth).
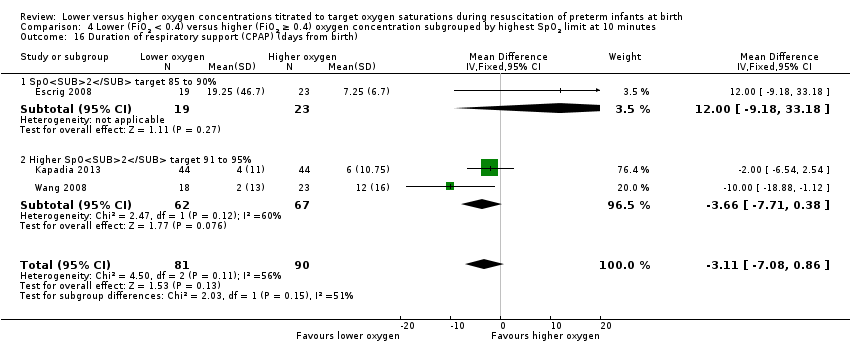
Comparison 4 Lower (FiO2 < 0.4) versus higher (FiO2 ≥ 0.4) oxygen concentration subgrouped by highest SpO2 limit at 10 minutes, Outcome 16 Duration of respiratory support (CPAP) (days from birth).
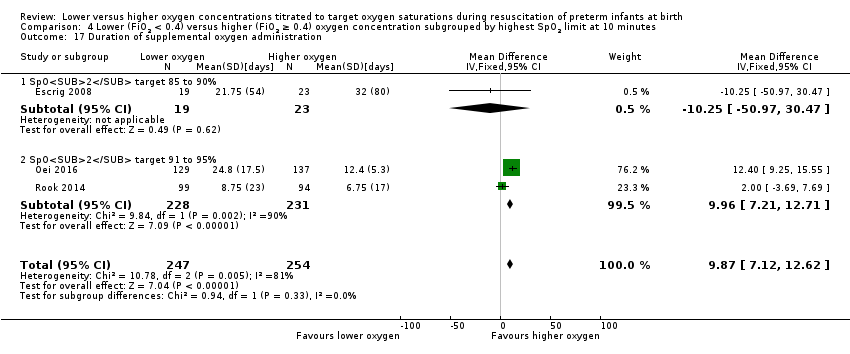
Comparison 4 Lower (FiO2 < 0.4) versus higher (FiO2 ≥ 0.4) oxygen concentration subgrouped by highest SpO2 limit at 10 minutes, Outcome 17 Duration of supplemental oxygen administration.
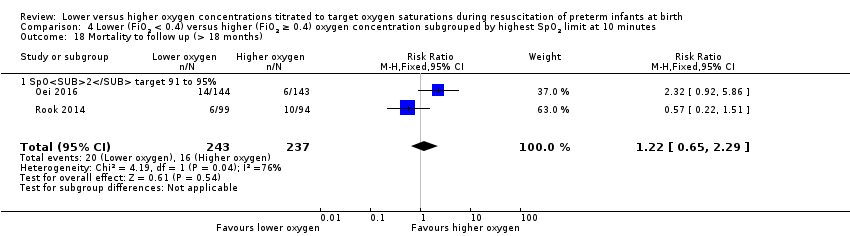
Comparison 4 Lower (FiO2 < 0.4) versus higher (FiO2 ≥ 0.4) oxygen concentration subgrouped by highest SpO2 limit at 10 minutes, Outcome 18 Mortality to follow up (> 18 months).
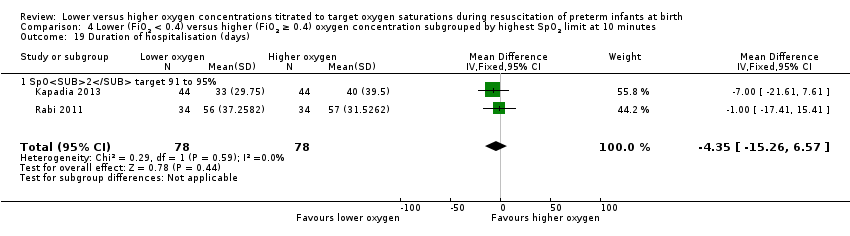
Comparison 4 Lower (FiO2 < 0.4) versus higher (FiO2 ≥ 0.4) oxygen concentration subgrouped by highest SpO2 limit at 10 minutes, Outcome 19 Duration of hospitalisation (days).

Comparison 4 Lower (FiO2 < 0.4) versus higher (FiO2 ≥ 0.4) oxygen concentration subgrouped by highest SpO2 limit at 10 minutes, Outcome 20 Patent ductus arteriosus (not prespecified).

Comparison 5 Lower (FiO2 < 0.4) versus higher (FiO2 ≥ 0.4) oxygen concentration subgrouped by gestational age, Outcome 1 Mortality near term corrected age or discharge (latest reported).

Comparison 5 Lower (FiO2 < 0.4) versus higher (FiO2 ≥ 0.4) oxygen concentration subgrouped by gestational age, Outcome 2 Neurodevelopmental disability.

Comparison 5 Lower (FiO2 < 0.4) versus higher (FiO2 ≥ 0.4) oxygen concentration subgrouped by gestational age, Outcome 3 IPPV in the delivery room.
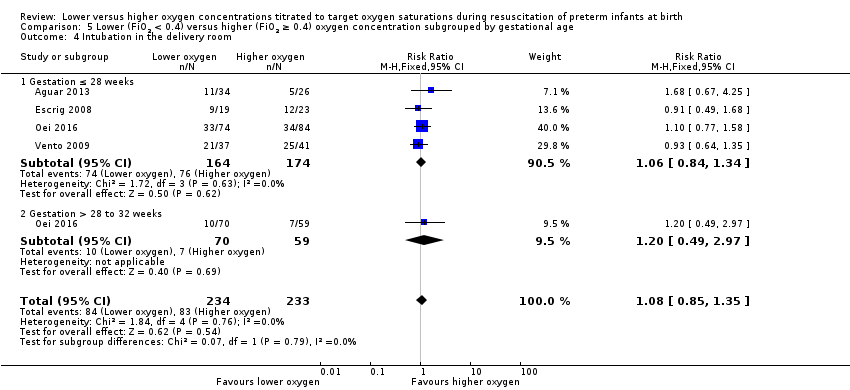
Comparison 5 Lower (FiO2 < 0.4) versus higher (FiO2 ≥ 0.4) oxygen concentration subgrouped by gestational age, Outcome 4 Intubation in the delivery room.

Comparison 5 Lower (FiO2 < 0.4) versus higher (FiO2 ≥ 0.4) oxygen concentration subgrouped by gestational age, Outcome 5 Time to reach desired oxygen saturation target.

Comparison 5 Lower (FiO2 < 0.4) versus higher (FiO2 ≥ 0.4) oxygen concentration subgrouped by gestational age, Outcome 6 Time to reach heart rate > 100 bpm.

Comparison 5 Lower (FiO2 < 0.4) versus higher (FiO2 ≥ 0.4) oxygen concentration subgrouped by gestational age, Outcome 7 Retinopathy of prematurity.
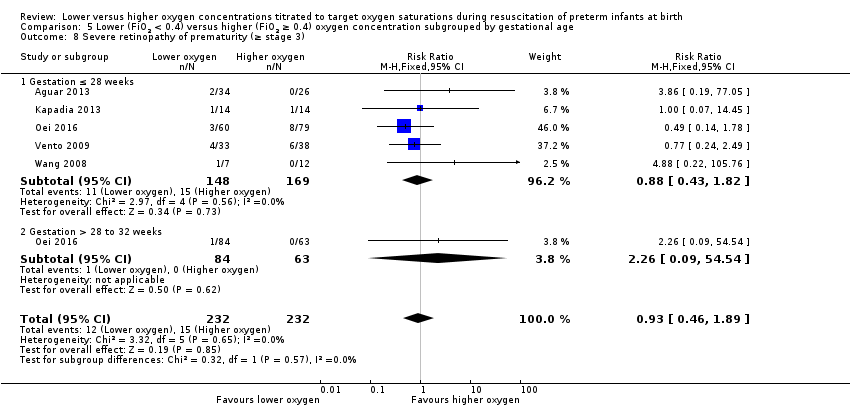
Comparison 5 Lower (FiO2 < 0.4) versus higher (FiO2 ≥ 0.4) oxygen concentration subgrouped by gestational age, Outcome 8 Severe retinopathy of prematurity (≥ stage 3).

Comparison 5 Lower (FiO2 < 0.4) versus higher (FiO2 ≥ 0.4) oxygen concentration subgrouped by gestational age, Outcome 9 Intraventricular haemorrhage.
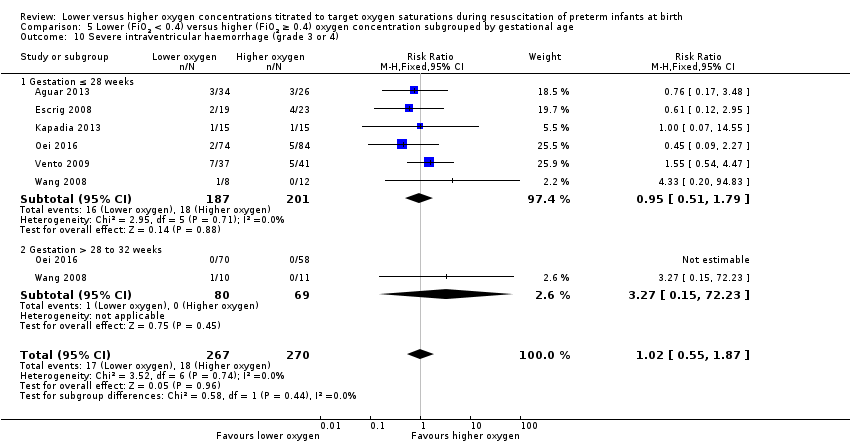
Comparison 5 Lower (FiO2 < 0.4) versus higher (FiO2 ≥ 0.4) oxygen concentration subgrouped by gestational age, Outcome 10 Severe intraventricular haemorrhage (grade 3 or 4).
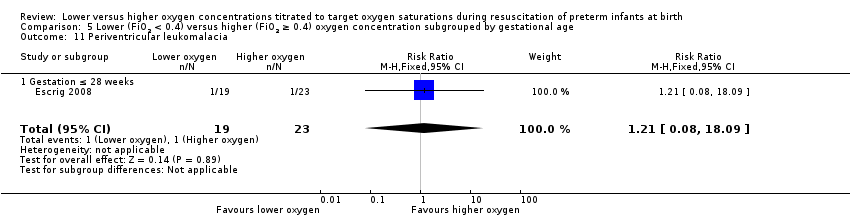
Comparison 5 Lower (FiO2 < 0.4) versus higher (FiO2 ≥ 0.4) oxygen concentration subgrouped by gestational age, Outcome 11 Periventricular leukomalacia.

Comparison 5 Lower (FiO2 < 0.4) versus higher (FiO2 ≥ 0.4) oxygen concentration subgrouped by gestational age, Outcome 12 Necrotising enterocolitis.

Comparison 5 Lower (FiO2 < 0.4) versus higher (FiO2 ≥ 0.4) oxygen concentration subgrouped by gestational age, Outcome 13 Chronic lung disease (28 days age).

Comparison 5 Lower (FiO2 < 0.4) versus higher (FiO2 ≥ 0.4) oxygen concentration subgrouped by gestational age, Outcome 14 Chronic lung disease (36 weeks' corrected age).

Comparison 5 Lower (FiO2 < 0.4) versus higher (FiO2 ≥ 0.4) oxygen concentration subgrouped by gestational age, Outcome 15 Duration of respiratory support (mechanical ventilation or CPAP) (days from birth).

Comparison 5 Lower (FiO2 < 0.4) versus higher (FiO2 ≥ 0.4) oxygen concentration subgrouped by gestational age, Outcome 16 Duration of respiratory support (mechanical ventilation) (days from birth).
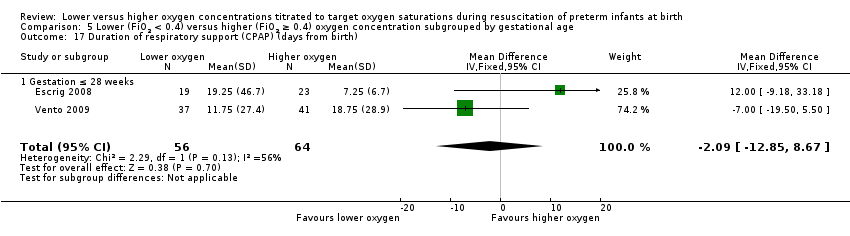
Comparison 5 Lower (FiO2 < 0.4) versus higher (FiO2 ≥ 0.4) oxygen concentration subgrouped by gestational age, Outcome 17 Duration of respiratory support (CPAP) (days from birth).

Comparison 5 Lower (FiO2 < 0.4) versus higher (FiO2 ≥ 0.4) oxygen concentration subgrouped by gestational age, Outcome 18 Duration of supplemental oxygen administration.
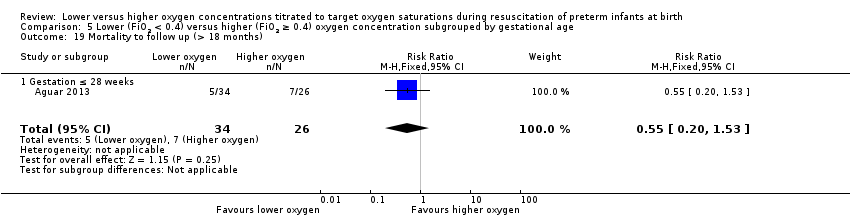
Comparison 5 Lower (FiO2 < 0.4) versus higher (FiO2 ≥ 0.4) oxygen concentration subgrouped by gestational age, Outcome 19 Mortality to follow up (> 18 months).
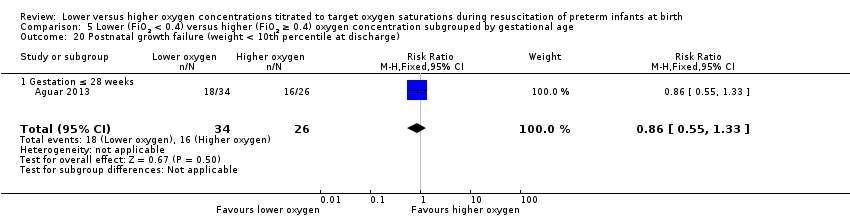
Comparison 5 Lower (FiO2 < 0.4) versus higher (FiO2 ≥ 0.4) oxygen concentration subgrouped by gestational age, Outcome 20 Postnatal growth failure (weight < 10th percentile at discharge).

Comparison 5 Lower (FiO2 < 0.4) versus higher (FiO2 ≥ 0.4) oxygen concentration subgrouped by gestational age, Outcome 21 Duration of hospitalisation (days).

Comparison 5 Lower (FiO2 < 0.4) versus higher (FiO2 ≥ 0.4) oxygen concentration subgrouped by gestational age, Outcome 22 Patent ductus arteriosus (not prespecified).

Comparison 6 Lower (FiO2 < 0.4) versus higher (FiO2 ≥ 0.4) oxygen concentration ‐ sensitivity analysis, Outcome 1 Mortality near term corrected age or discharge (latest reported).
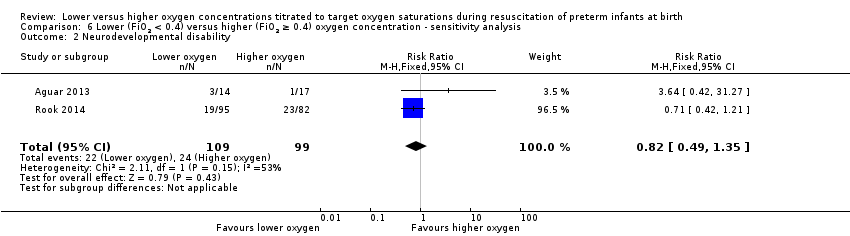
Comparison 6 Lower (FiO2 < 0.4) versus higher (FiO2 ≥ 0.4) oxygen concentration ‐ sensitivity analysis, Outcome 2 Neurodevelopmental disability.

Comparison 6 Lower (FiO2 < 0.4) versus higher (FiO2 ≥ 0.4) oxygen concentration ‐ sensitivity analysis, Outcome 3 IPPV in the delivery room.

Comparison 6 Lower (FiO2 < 0.4) versus higher (FiO2 ≥ 0.4) oxygen concentration ‐ sensitivity analysis, Outcome 4 Intubation in the delivery room.

Comparison 6 Lower (FiO2 < 0.4) versus higher (FiO2 ≥ 0.4) oxygen concentration ‐ sensitivity analysis, Outcome 5 Time to reach desired oxygen saturation target.

Comparison 6 Lower (FiO2 < 0.4) versus higher (FiO2 ≥ 0.4) oxygen concentration ‐ sensitivity analysis, Outcome 6 Time to reach heart rate > 100 bpm (not prespecified).
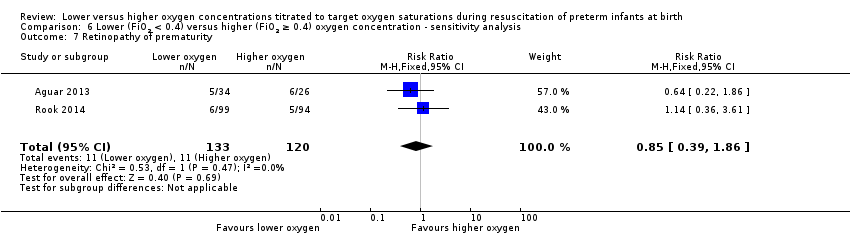
Comparison 6 Lower (FiO2 < 0.4) versus higher (FiO2 ≥ 0.4) oxygen concentration ‐ sensitivity analysis, Outcome 7 Retinopathy of prematurity.
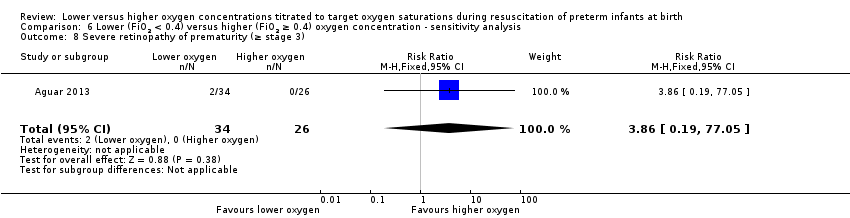
Comparison 6 Lower (FiO2 < 0.4) versus higher (FiO2 ≥ 0.4) oxygen concentration ‐ sensitivity analysis, Outcome 8 Severe retinopathy of prematurity (≥ stage 3).

Comparison 6 Lower (FiO2 < 0.4) versus higher (FiO2 ≥ 0.4) oxygen concentration ‐ sensitivity analysis, Outcome 9 Intraventricular haemorrhage.
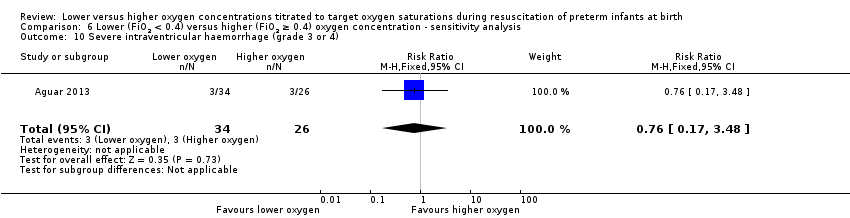
Comparison 6 Lower (FiO2 < 0.4) versus higher (FiO2 ≥ 0.4) oxygen concentration ‐ sensitivity analysis, Outcome 10 Severe intraventricular haemorrhage (grade 3 or 4).

Comparison 6 Lower (FiO2 < 0.4) versus higher (FiO2 ≥ 0.4) oxygen concentration ‐ sensitivity analysis, Outcome 11 Necrotising enterocolitis.

Comparison 6 Lower (FiO2 < 0.4) versus higher (FiO2 ≥ 0.4) oxygen concentration ‐ sensitivity analysis, Outcome 12 Chronic lung disease (28 days age).

Comparison 6 Lower (FiO2 < 0.4) versus higher (FiO2 ≥ 0.4) oxygen concentration ‐ sensitivity analysis, Outcome 13 Chronic lung disease (36 weeks' corrected age).

Comparison 6 Lower (FiO2 < 0.4) versus higher (FiO2 ≥ 0.4) oxygen concentration ‐ sensitivity analysis, Outcome 14 Duration of respiratory support (mechanical ventilation or CPAP) (days from birth).

Comparison 6 Lower (FiO2 < 0.4) versus higher (FiO2 ≥ 0.4) oxygen concentration ‐ sensitivity analysis, Outcome 15 Duration of respiratory support (mechanical ventilation) (days from birth).

Comparison 6 Lower (FiO2 < 0.4) versus higher (FiO2 ≥ 0.4) oxygen concentration ‐ sensitivity analysis, Outcome 16 Duration of supplemental oxygen administration.

Comparison 6 Lower (FiO2 < 0.4) versus higher (FiO2 ≥ 0.4) oxygen concentration ‐ sensitivity analysis, Outcome 17 Mortality to follow up (> 18 months).

Comparison 6 Lower (FiO2 < 0.4) versus higher (FiO2 ≥ 0.4) oxygen concentration ‐ sensitivity analysis, Outcome 18 Postnatal growth failure (weight < 10th percentile at discharge).

Comparison 6 Lower (FiO2 < 0.4) versus higher (FiO2 ≥ 0.4) oxygen concentration ‐ sensitivity analysis, Outcome 19 Duration of hospitalisation (days).

Comparison 6 Lower (FiO2 < 0.4) versus higher (FiO2 ≥ 0.4) oxygen concentration ‐ sensitivity analysis, Outcome 20 Patent ductus arteriosus (not prespecified).
| Lower (FiO2 < 0.4) versus higher (FiO2 ≥ 0.4) oxygen concentrations titrated to oxygen saturations during resuscitation of preterm infants at birth | ||||||
| Patient or population: preterm infants | ||||||
| Outcomes | Illustrative comparative risks* (95% CI) | Relative effect | No of Participants | Quality of the evidence | Comments | |
| Assumed risk | Corresponding risk | |||||
| Control | Lower (FiO2 < 0.4) versus higher (FiO2 ≥ 0.4) oxygen concentration | |||||
| Mortality, near term corrected age or discharge | Study population | RR 1.05 | 914 | ⊕⊕⊝⊝ | Subgroup analyses: single study targeting lowest SpO2 < 85% reported increased mortality for infants resuscitated with air compared to 100% oxygen (Oei 2016). Meta‐analysis of 9 studies (627 infants) targeting lowest SpO2 85% to 90% found no difference in mortality. No subgroup differences according to inspired oxygen concentration strata, highest SpO2 limit, or gestational age. Quality of evidence downgraded due to risk of bias and imprecision. | |
| 76 per 1000 | 80 per 1000 | |||||
| Moderate | ||||||
| 68 per 1000 | 71 per 1000 | |||||
| Neurodevelopmental disability | Study population | RR 0.82 | 208 | ⊕⊕⊝⊝ | Subgroup analyses: both studies compared FiO2 ≥ 0.3 to < 0.4 versus FiO2 ≥ 0.6 to 1.0 and had a lowest SpO2 target 85 to 90%. Quality of evidence downgraded due to inconsistency and imprecision. | |
| 242 per 1000 | 199 per 1000 | |||||
| Moderate | ||||||
| 170 per 1000 | 139 per 1000 | |||||
| Intubation in the delivery room | Study population | RR 0.98 | 875 | ⊕⊕⊝⊝ | Subgroup analyses: no subgroup differences according to inspired oxygen concentration strata, lowest or highest SpO2 target, or gestational age. Quality of evidence downgraded due to risk of bias and imprecision. | |
| 352 per 1000 | 345 per 1000 | |||||
| Moderate | ||||||
| 386 per 1000 | 378 per 1000 | |||||
| Severe retinopathy of prematurity (≥ stage 3) | Study population | RR 0.57 | 453 | ⊕⊕⊝⊝ | Subgroup analyses: no subgroup differences according to inspired oxygen concentration strata, lowest SpO2 target, or gestational age. Quality of evidence downgraded due to risk of bias and imprecision. | |
| 58 per 1000 | 33 per 1000 | |||||
| Moderate | ||||||
| 70 per 1000 | 40 per 1000 | |||||
| Severe intraventricular haemorrhage (grade 3 or 4) | Study population | RR 0.93 | 596 | ⊕⊕⊝⊝ | Subgroup analyses: no subgroup differences according to inspired oxygen concentration strata, lowest or highest SpO2 target, or gestational age. Quality of evidence downgraded due to risk of bias and imprecision. | |
| 63 per 1000 | 59 per 1000 | |||||
| Moderate | ||||||
| 79 per 1000 | 73 per 1000 | |||||
| Necrotising enterocolitis | Study population | RR 0.98 | 807 | ⊕⊕⊝⊝ | Subgroup analyses: no subgroup differences according to inspired oxygen concentration strata, lowest or highest SpO2 target, or gestational age. Quality of evidence downgraded due to risk of bias and imprecision. | |
| 47 per 1000 | 46 per 1000 | |||||
| Moderate | ||||||
| 41 per 1000 | 40 per 1000 | |||||
| Chronic lung disease (36 weeks' corrected age) | Study population | RR 0.91 | 862 | ⊕⊝⊝⊝ | Subgroup analyses: no subgroup differences according to inspired oxygen concentration strata, lowest or highest SpO2 target, or gestational age. Quality of evidence downgraded due to risk of bias, inconsistency and imprecision. | |
| 269 per 1000 | 244 per 1000 | |||||
| Moderate | ||||||
| 250 per 1000 | 228 per 1000 | |||||
| *The basis for the assumed risk (e.g. the median control group risk across studies) is provided in footnotes. The corresponding risk (and its 95% confidence interval) is based on the assumed risk in the comparison group and the relative effect of the intervention (and its 95% CI). | ||||||
| GRADE Working Group grades of evidence | ||||||
| 1 Two studies at low risk of bias. | ||||||
| Outcome or subgroup title | No. of studies | No. of participants | Statistical method | Effect size |
| 1 Mortality near term corrected age or discharge (latest reported) subgrouped by inspired oxygen concentration Show forest plot | 10 | 914 | Risk Ratio (M‐H, Fixed, 95% CI) | 1.05 [0.68, 1.63] |
| 2 Neurodevelopmental disability Show forest plot | 2 | 208 | Risk Ratio (M‐H, Fixed, 95% CI) | 0.82 [0.49, 1.35] |
| 3 IPPV in the delivery room Show forest plot | 5 | 249 | Risk Ratio (M‐H, Fixed, 95% CI) | 0.94 [0.83, 1.06] |
| 4 Intubation in the delivery room Show forest plot | 9 | 875 | Risk Ratio (M‐H, Fixed, 95% CI) | 0.98 [0.82, 1.18] |
| 5 Time to reach desired oxygen saturation target Show forest plot | 2 | 102 | Mean Difference (IV, Fixed, 95% CI) | ‐0.52 [‐1.83, 0.79] |
| 6 Time to reach heart rate > 100 bpm (not prespecified) Show forest plot | 1 | 60 | Mean Difference (IV, Fixed, 95% CI) | 0.27 [‐1.21, 1.75] |
| 7 Retinopathy of prematurity Show forest plot | 4 | 373 | Risk Ratio (M‐H, Fixed, 95% CI) | 0.80 [0.43, 1.49] |
| 8 Severe retinopathy of prematurity (≥ stage 3) Show forest plot | 4 | 453 | Risk Ratio (M‐H, Fixed, 95% CI) | 0.57 [0.24, 1.36] |
| 9 Intraventricular haemorrhage Show forest plot | 3 | 271 | Risk Ratio (M‐H, Fixed, 95% CI) | 0.81 [0.46, 1.44] |
| 10 Severe intraventricular haemorrhage (grade 3 or 4) Show forest plot | 6 | 596 | Risk Ratio (M‐H, Fixed, 95% CI) | 0.93 [0.51, 1.71] |
| 11 Periventricular leukomalacia Show forest plot | 2 | 130 | Risk Ratio (M‐H, Fixed, 95% CI) | 0.66 [0.09, 4.73] |
| 12 Necrotising enterocolitis Show forest plot | 8 | 807 | Risk Ratio (M‐H, Fixed, 95% CI) | 0.98 [0.51, 1.87] |
| 13 Chronic lung disease (28 days' age) Show forest plot | 2 | 148 | Risk Ratio (M‐H, Fixed, 95% CI) | 0.70 [0.41, 1.21] |
| 14 Chronic lung disease (36 weeks' corrected age) Show forest plot | 9 | 862 | Risk Ratio (M‐H, Fixed, 95% CI) | 0.91 [0.72, 1.14] |
| 15 Duration of respiratory support (mechanical ventilation or CPAP) (days from birth) Show forest plot | 2 | 326 | Mean Difference (IV, Fixed, 95% CI) | ‐12.39 [‐13.49, ‐11.29] |
| 16 Duration of respiratory support (mechanical ventilation) (days from birth) Show forest plot | 6 | 510 | Mean Difference (IV, Fixed, 95% CI) | 0.61 [‐1.33, 2.54] |
| 17 Duration of respiratory support (CPAP) (days from birth) Show forest plot | 4 | 249 | Mean Difference (IV, Fixed, 95% CI) | ‐1.60 [‐5.39, 2.19] |
| 18 Duration of supplemental oxygen administration Show forest plot | 5 | 639 | Mean Difference (IV, Fixed, 95% CI) | 9.23 [6.52, 11.95] |
| 19 Mortality to follow up (> 18 months) Show forest plot | 3 | 540 | Risk Ratio (M‐H, Fixed, 95% CI) | 1.00 [0.59, 1.70] |
| 20 Postnatal growth failure (weight < 10th percentile at discharge) Show forest plot | 1 | 60 | Risk Ratio (M‐H, Fixed, 95% CI) | 0.86 [0.55, 1.33] |
| 21 Duration of hospitalisation (days) Show forest plot | 3 | 216 | Mean Difference (IV, Fixed, 95% CI) | ‐1.75 [‐12.22, 8.71] |
| 22 Patent ductus arteriosus (not prespecified) Show forest plot | 7 | 766 | Risk Ratio (M‐H, Fixed, 95% CI) | 0.93 [0.77, 1.14] |
| Outcome or subgroup title | No. of studies | No. of participants | Statistical method | Effect size |
| 1 Mortality near term corrected age or discharge (latest reported) subgrouped by inspired oxygen concentration Show forest plot | 10 | Risk Ratio (M‐H, Fixed, 95% CI) | Subtotals only | |
| 1.1 FiO2 0.21 versus FiO2 ≥ 0.4 to < 0.6 | 1 | 13 | Risk Ratio (M‐H, Fixed, 95% CI) | 1.17 [0.09, 14.92] |
| 1.2 FiO2 0.21 versus FiO2 ≥ 0.6 to 1.0 | 5 | 495 | Risk Ratio (M‐H, Fixed, 95% CI) | 1.70 [0.84, 3.46] |
| 1.3 FiO2 ≥ 0.3 to < 0.4 versus FiO2 ≥ 0.6 to 1.0 | 5 | 412 | Risk Ratio (M‐H, Fixed, 95% CI) | 0.75 [0.42, 1.32] |
| 2 Neurodevelopmental disability Show forest plot | 2 | Risk Ratio (M‐H, Fixed, 95% CI) | Subtotals only | |
| 2.2 FiO2 ≥ 0.3 to < 0.4 versus FiO2 ≥ 0.6 to 1.0 | 2 | 208 | Risk Ratio (M‐H, Fixed, 95% CI) | 0.82 [0.49, 1.35] |
| 3 IPPV in the delivery room Show forest plot | 5 | Risk Ratio (M‐H, Fixed, 95% CI) | Subtotals only | |
| 3.1 FiO2 0.21 versus FiO2 ≥ 0.4 to < 0.6 | 1 | 13 | Risk Ratio (M‐H, Fixed, 95% CI) | 0.7 [0.28, 1.77] |
| 3.2 FiO2 0.21 versus FiO2 ≥ 0.6 to 1.0 | 3 | 140 | Risk Ratio (M‐H, Fixed, 95% CI) | 0.93 [0.77, 1.12] |
| 3.3 FiO2 ≥ 0.3 to < 0.4 versus FiO2 ≥ 0.6 to 1.0 | 2 | 102 | Risk Ratio (M‐H, Fixed, 95% CI) | 0.96 [0.84, 1.09] |
| 4 Intubation in the delivery room Show forest plot | 9 | Risk Ratio (M‐H, Fixed, 95% CI) | Subtotals only | |
| 4.1 FiO2 0.21 versus FiO2 ≥ 0.4 to < 0.6 | 1 | 13 | Risk Ratio (M‐H, Fixed, 95% CI) | 0.58 [0.16, 2.14] |
| 4.2 FiO2 0.21 versus FiO2 ≥ 0.6 to 1.0 | 5 | 495 | Risk Ratio (M‐H, Fixed, 95% CI) | 0.93 [0.72, 1.21] |
| 4.3 FiO2 ≥ 0.3 to < 0.4 versus FiO2 ≥ 0.6 to 1.0 | 4 | 373 | Risk Ratio (M‐H, Fixed, 95% CI) | 1.04 [0.81, 1.34] |
| 5 Time to reach desired oxygen saturation target Show forest plot | 2 | Mean Difference (IV, Fixed, 95% CI) | Subtotals only | |
| 5.1 FiO2 ≥ 0.3 to < 0.4 versus FiO2 ≥ 0.6 to 1.0 | 2 | 102 | Mean Difference (IV, Fixed, 95% CI) | ‐0.52 [‐1.83, 0.79] |
| 6 Time to reach heart rate > 100 bpm (not prespecified) Show forest plot | 1 | Mean Difference (IV, Fixed, 95% CI) | Subtotals only | |
| 6.1 FiO2 ≥ 0.3 to < 0.4 versus FiO2 ≥ 0.6 to 1.0 | 1 | 60 | Mean Difference (IV, Fixed, 95% CI) | 0.27 [‐1.21, 1.75] |
| 7 Retinopathy of prematurity Show forest plot | 4 | Risk Ratio (M‐H, Fixed, 95% CI) | Subtotals only | |
| 7.1 FiO2 ≥ 0.3 to < 0.4 versus FiO2 ≥ 0.6 to 1.0 | 4 | 373 | Risk Ratio (M‐H, Fixed, 95% CI) | 0.80 [0.43, 1.49] |
| 8 Severe retinopathy of prematurity (≥ stage 3) Show forest plot | 4 | Risk Ratio (M‐H, Fixed, 95% CI) | Subtotals only | |
| 8.1 FiO2 0.21 versus FiO2 ≥ 0.4 to < 0.6 | 1 | 13 | Risk Ratio (M‐H, Fixed, 95% CI) | 0.0 [0.0, 0.0] |
| 8.2 FiO2 0.21 versus FiO2 ≥ 0.6 to 1.0 | 3 | 386 | Risk Ratio (M‐H, Fixed, 95% CI) | 0.40 [0.15, 1.05] |
| 8.3 FiO2 ≥ 0.3 to < 0.4 versus FiO2 ≥ 0.6 to 1.0 | 1 | 60 | Risk Ratio (M‐H, Fixed, 95% CI) | 3.86 [0.19, 77.05] |
| 9 Intraventricular haemorrhage Show forest plot | 3 | Risk Ratio (M‐H, Fixed, 95% CI) | Subtotals only | |
| 9.1 FiO2 0.21 versus FiO2 ≥ 0.4 to < 0.6 | 1 | 13 | Risk Ratio (M‐H, Fixed, 95% CI) | 0.0 [0.0, 0.0] |
| 9.2 FiO2 0.21 versus FiO2 ≥ 0.6 to 1.0 | 1 | 11 | Risk Ratio (M‐H, Fixed, 95% CI) | 0.17 [0.01, 2.92] |
| 9.3 FiO2 ≥ 0.3 to < 0.4 versus FiO2 ≥ 0.6 to 1.0 | 2 | 253 | Risk Ratio (M‐H, Fixed, 95% CI) | 0.85 [0.47, 1.53] |
| 10 Severe intraventricular haemorrhage (grade 3 or 4) Show forest plot | 6 | Risk Ratio (M‐H, Fixed, 95% CI) | Subtotals only | |
| 10.1 FiO2 0.21 versus FiO2 ≥ 0.6 to 1.0 | 3 | 416 | Risk Ratio (M‐H, Fixed, 95% CI) | 0.78 [0.27, 2.24] |
| 10.2 FiO2 ≥ 0.3 to < 0.4 versus FiO2 ≥ 0.6 to 1.0 | 3 | 180 | Risk Ratio (M‐H, Fixed, 95% CI) | 1.03 [0.49, 2.18] |
| 11 Periventricular leukomalacia Show forest plot | 2 | Risk Ratio (M‐H, Fixed, 95% CI) | Subtotals only | |
| 11.1 FiO2 0.21 versus FiO2 ≥ 0.6 to 1.0 | 1 | 88 | Risk Ratio (M‐H, Fixed, 95% CI) | 0.33 [0.01, 7.97] |
| 11.2 FiO2 ≥ 0.3 to < 0.4 versus FiO2 ≥ 0.6 to 1.0 | 1 | 42 | Risk Ratio (M‐H, Fixed, 95% CI) | 1.21 [0.08, 18.09] |
| 12 Necrotising enterocolitis Show forest plot | 8 | Risk Ratio (M‐H, Fixed, 95% CI) | Subtotals only | |
| 12.1 FiO2 0.21 versus FiO2 ≥ 0.4 to < 0.6 | 1 | 13 | Risk Ratio (M‐H, Fixed, 95% CI) | 0.58 [0.07, 4.95] |
| 12.2 FiO2 0.21 versus FiO2 ≥ 0.6 to 1.0 | 4 | 434 | Risk Ratio (M‐H, Fixed, 95% CI) | 0.74 [0.31, 1.76] |
| 12.3 FiO2 ≥ 0.3 to < 0.4 versus FiO2 ≥ 0.6 to 1.0 | 4 | 373 | Risk Ratio (M‐H, Fixed, 95% CI) | 1.40 [0.52, 3.78] |
| 13 Chronic lung disease (28 days age) Show forest plot | 2 | Risk Ratio (M‐H, Fixed, 95% CI) | Subtotals only | |
| 13.1 FiO2 0.21 versus FiO2 ≥ 0.6 to 1.0 | 1 | 88 | Risk Ratio (M‐H, Fixed, 95% CI) | 0.47 [0.23, 0.98] |
| 13.2 FiO2 ≥ 0.3 to < 0.4 versus FiO2 ≥ 0.6 to 1.0 | 1 | 60 | Risk Ratio (M‐H, Fixed, 95% CI) | 1.27 [0.53, 3.05] |
| 14 Chronic lung disease (36 weeks' corrected age) Show forest plot | 9 | Risk Ratio (M‐H, Fixed, 95% CI) | Subtotals only | |
| 14.1 FiO2 0.21 versus FiO2 ≥ 0.4 to < 0.6 | 1 | 13 | Risk Ratio (M‐H, Fixed, 95% CI) | 0.39 [0.05, 2.83] |
| 14.2 FiO2 0.21 versus FiO2 ≥ 0.6 to 1.0 | 5 | 492 | Risk Ratio (M‐H, Fixed, 95% CI) | 0.83 [0.63, 1.09] |
| 14.3 FiO2 ≥ 0.3 to < 0.4 versus FiO2 ≥ 0.6 to 1.0 | 4 | 363 | Risk Ratio (M‐H, Fixed, 95% CI) | 1.07 [0.72, 1.60] |
| 15 Duration of respiratory support (mechanical ventilation or CPAP) (days from birth) Show forest plot | 2 | Mean Difference (IV, Fixed, 95% CI) | Subtotals only | |
| 15.1 FiO2 0.21 versus FiO2 ≥ 0.6 to 1.0 | 1 | 266 | Mean Difference (IV, Fixed, 95% CI) | ‐13.70 [‐14.85, ‐12.55] |
| 15.2 FiO2 ≥ 0.3 to < 0.4 versus FiO2 ≥ 0.6 to 1.0 | 1 | 60 | Mean Difference (IV, Fixed, 95% CI) | 1.06 [‐2.63, 4.75] |
| 16 Duration of respiratory support (mechanical ventilation) (days from birth) Show forest plot | 6 | Mean Difference (IV, Fixed, 95% CI) | Subtotals only | |
| 16.1 FiO2 0.21 versus FiO2 ≥ 0.6 to 1.0 | 3 | 197 | Mean Difference (IV, Fixed, 95% CI) | ‐0.11 [‐4.16, 3.93] |
| 16.2 FiO2 ≥ 0.3 to < 0.4 versus FiO2 ≥ 0.6 to 1.0 | 3 | 313 | Mean Difference (IV, Fixed, 95% CI) | 0.82 [‐1.38, 3.02] |
| 17 Duration of respiratory support (CPAP) (days from birth) Show forest plot | 4 | Mean Difference (IV, Fixed, 95% CI) | Subtotals only | |
| 17.1 FiO2 0.21 versus FiO2 ≥ 0.6 to 1.0 | 2 | 129 | Mean Difference (IV, Fixed, 95% CI) | ‐1.79 [‐5.84, 2.25] |
| 17.2 FiO2 ≥ 0.3 to < 0.4 versus FiO2 ≥ 0.6 to 1.0 | 2 | 120 | Mean Difference (IV, Fixed, 95% CI) | ‐0.24 [‐11.00, 10.53] |
| 18 Duration of supplemental oxygen administration Show forest plot | 5 | Mean Difference (IV, Fixed, 95% CI) | Subtotals only | |
| 18.1 FiO2 0.21 versus FiO2 ≥ 0.6 to 1.0 | 1 | 266 | Mean Difference (IV, Fixed, 95% CI) | 12.4 [9.25, 15.55] |
| 18.2 FiO2 ≥ 0.3 to < 0.4 versus FiO2 ≥ 0.6 to 1.0 | 4 | 373 | Mean Difference (IV, Fixed, 95% CI) | 0.01 [‐5.37, 5.38] |
| 19 Mortality to follow up (> 18 months) Show forest plot | 3 | Risk Ratio (M‐H, Fixed, 95% CI) | Subtotals only | |
| 19.1 FiO2 0.21 versus FiO2 ≥ 0.6 to 1.0 | 1 | 287 | Risk Ratio (M‐H, Fixed, 95% CI) | 2.32 [0.92, 5.86] |
| 19.2 FiO2 ≥ 0.3 to < 0.4 versus FiO2 ≥ 0.6 to 1.0 | 2 | 253 | Risk Ratio (M‐H, Fixed, 95% CI) | 0.56 [0.28, 1.14] |
| 20 Postnatal growth failure (weight < 10th percentile at discharge) Show forest plot | 1 | Risk Ratio (M‐H, Fixed, 95% CI) | Subtotals only | |
| 20.1 FiO2 ≥ 0.3 to < 0.4 versus FiO2 ≥ 0.6 to 1.0 | 1 | 60 | Risk Ratio (M‐H, Fixed, 95% CI) | 0.86 [0.55, 1.33] |
| 21 Duration of hospitalisation (days) Show forest plot | 3 | Mean Difference (IV, Fixed, 95% CI) | Subtotals only | |
| 21.1 FiO2 0.21 versus FiO2 ≥ 0.6 to 1.0 | 2 | 156 | Mean Difference (IV, Fixed, 95% CI) | ‐4.35 [‐15.26, 6.57] |
| 21.2 FiO2 ≥ 0.3 to < 0.4 versus FiO2 ≥ 0.6 to 1.0 | 1 | 60 | Mean Difference (IV, Fixed, 95% CI) | 28.0 [‐8.96, 64.96] |
| 22 Patent ductus arteriosus (not prespecified) Show forest plot | 7 | 766 | Risk Ratio (M‐H, Fixed, 95% CI) | 0.93 [0.77, 1.14] |
| 22.1 FiO2 0.21 versus FiO2 ≥ 0.6 to 1.0 | 3 | 393 | Risk Ratio (M‐H, Fixed, 95% CI) | 0.80 [0.57, 1.14] |
| 22.2 FiO2 ≥ 0.3 to < 0.4 versus FiO2 ≥ 0.6 to 1.0 | 4 | 373 | Risk Ratio (M‐H, Fixed, 95% CI) | 1.03 [0.82, 1.29] |
| Outcome or subgroup title | No. of studies | No. of participants | Statistical method | Effect size |
| 1 Mortality near term corrected age or discharge (latest reported) Show forest plot | 10 | 914 | Risk Ratio (M‐H, Fixed, 95% CI) | 1.05 [0.68, 1.63] |
| 1.1 SpO2 target < 85% | 1 | 287 | Risk Ratio (M‐H, Fixed, 95% CI) | 2.78 [1.03, 7.52] |
| 1.2 SpO2 target 85 to 90% | 9 | 627 | Risk Ratio (M‐H, Fixed, 95% CI) | 0.77 [0.46, 1.27] |
| 2 Neurodevelopmental disability Show forest plot | 2 | 208 | Risk Ratio (M‐H, Fixed, 95% CI) | 0.82 [0.49, 1.35] |
| 2.1 SpO2 target 85 to 90% | 2 | 208 | Risk Ratio (M‐H, Fixed, 95% CI) | 0.82 [0.49, 1.35] |
| 3 IPPV in the delivery room Show forest plot | 5 | 249 | Risk Ratio (M‐H, Fixed, 95% CI) | 0.94 [0.83, 1.06] |
| 3.1 SpO2 target 85 to 90% | 5 | 249 | Risk Ratio (M‐H, Fixed, 95% CI) | 0.94 [0.83, 1.06] |
| 4 Intubation in the delivery room Show forest plot | 9 | 875 | Risk Ratio (M‐H, Fixed, 95% CI) | 0.98 [0.82, 1.18] |
| 4.1 SpO2 target < 85% | 1 | 287 | Risk Ratio (M‐H, Fixed, 95% CI) | 1.04 [0.73, 1.49] |
| 4.2 SpO2 target 85 to 90% | 8 | 588 | Risk Ratio (M‐H, Fixed, 95% CI) | 0.96 [0.78, 1.18] |
| 5 Time to reach desired oxygen saturation target Show forest plot | 2 | 102 | Mean Difference (IV, Fixed, 95% CI) | ‐0.52 [‐1.83, 0.79] |
| 5.1 SpO2 target 85 to 90% | 2 | 102 | Mean Difference (IV, Fixed, 95% CI) | ‐0.52 [‐1.83, 0.79] |
| 6 Time to reach heart rate > 100 bpm (not prespecified) Show forest plot | 1 | 60 | Mean Difference (IV, Fixed, 95% CI) | 0.27 [‐1.21, 1.75] |
| 6.1 SpO2 target 85 to 90% | 1 | 60 | Mean Difference (IV, Fixed, 95% CI) | 0.27 [‐1.21, 1.75] |
| 7 Retinopathy of prematurity Show forest plot | 4 | 373 | Risk Ratio (M‐H, Fixed, 95% CI) | 0.80 [0.43, 1.49] |
| 7.1 SpO2 target 85 to 90% | 4 | 373 | Risk Ratio (M‐H, Fixed, 95% CI) | 0.80 [0.43, 1.49] |
| 8 Severe retinopathy of prematurity (≥ stage 3) Show forest plot | 4 | 453 | Risk Ratio (M‐H, Fixed, 95% CI) | 0.57 [0.24, 1.36] |
| 8.1 SpO2 target < 85% | 1 | 287 | Risk Ratio (M‐H, Fixed, 95% CI) | 0.50 [0.15, 1.61] |
| 8.2 SpO2 target 85 to 90% | 3 | 166 | Risk Ratio (M‐H, Fixed, 95% CI) | 0.68 [0.19, 2.48] |
| 9 Intraventricular haemorrhage Show forest plot | 3 | 271 | Risk Ratio (M‐H, Fixed, 95% CI) | 0.81 [0.46, 1.44] |
| 9.1 SpO2 target 85 to 90% | 3 | 271 | Risk Ratio (M‐H, Fixed, 95% CI) | 0.81 [0.46, 1.44] |
| 10 Severe intraventricular haemorrhage (grade 3 or 4) Show forest plot | 6 | 596 | Risk Ratio (M‐H, Fixed, 95% CI) | 0.93 [0.51, 1.71] |
| 10.1 SpO2 target < 85% | 1 | 287 | Risk Ratio (M‐H, Fixed, 95% CI) | 0.33 [0.07, 1.61] |
| 10.2 SpO2 target 85 to 90% | 5 | 309 | Risk Ratio (M‐H, Fixed, 95% CI) | 1.21 [0.61, 2.39] |
| 11 Periventricular leukomalacia Show forest plot | 2 | 130 | Risk Ratio (M‐H, Fixed, 95% CI) | 0.66 [0.09, 4.73] |
| 11.1 SpO2 target 85 to 90% | 2 | 130 | Risk Ratio (M‐H, Fixed, 95% CI) | 0.66 [0.09, 4.73] |
| 12 Necrotising enterocolitis Show forest plot | 8 | 807 | Risk Ratio (M‐H, Fixed, 95% CI) | 0.98 [0.51, 1.87] |
| 12.1 SpO2 target < 85% | 1 | 287 | Risk Ratio (M‐H, Fixed, 95% CI) | 4.97 [0.59, 41.97] |
| 12.2 SpO2 target 85 to 90% | 7 | 520 | Risk Ratio (M‐H, Fixed, 95% CI) | 0.74 [0.36, 1.52] |
| 13 Chronic lung disease (28 days' age) Show forest plot | 2 | 148 | Risk Ratio (M‐H, Fixed, 95% CI) | 0.70 [0.41, 1.21] |
| 13.1 SpO2 target 85 to 90% | 2 | 148 | Risk Ratio (M‐H, Fixed, 95% CI) | 0.70 [0.41, 1.21] |
| 14 Chronic lung disease (36 weeks' corrected age) Show forest plot | 9 | 862 | Risk Ratio (M‐H, Random, 95% CI) | 0.91 [0.64, 1.29] |
| 14.1 SpO2 target < 85% | 1 | 287 | Risk Ratio (M‐H, Random, 95% CI) | 0.84 [0.57, 1.25] |
| 14.2 SpO2 target 85 to 90% | 8 | 575 | Risk Ratio (M‐H, Random, 95% CI) | 0.91 [0.58, 1.43] |
| 15 Duration of respiratory support (mechanical ventilation or CPAP) (days from birth) Show forest plot | 2 | 326 | Mean Difference (IV, Fixed, 95% CI) | ‐12.39 [‐13.49, ‐11.29] |
| 15.1 SpO2 target < 85% | 1 | 266 | Mean Difference (IV, Fixed, 95% CI) | ‐13.70 [‐14.85, ‐12.55] |
| 15.2 SpO2 target 85 to 90% | 1 | 60 | Mean Difference (IV, Fixed, 95% CI) | 1.06 [‐2.63, 4.75] |
| 16 Duration of respiratory support (mechanical ventilation) (days from birth) Show forest plot | 6 | 510 | Mean Difference (IV, Fixed, 95% CI) | 0.78 [‐1.15, 2.72] |
| 16.1 SpO2 target 85 to 90% | 6 | 510 | Mean Difference (IV, Fixed, 95% CI) | 0.78 [‐1.15, 2.72] |
| 17 Duration of respiratory support (CPAP) (days from birth) Show forest plot | 4 | 249 | Mean Difference (IV, Fixed, 95% CI) | ‐1.83 [‐5.62, 1.96] |
| 17.1 SpO2 target 85 to 90% | 4 | 249 | Mean Difference (IV, Fixed, 95% CI) | ‐1.83 [‐5.62, 1.96] |
| 18 Duration of supplemental oxygen administration Show forest plot | 5 | 639 | Mean Difference (IV, Fixed, 95% CI) | 9.67 [6.96, 12.39] |
| 18.1 SpO2 target < 85% | 1 | 266 | Mean Difference (IV, Fixed, 95% CI) | 12.4 [9.25, 15.55] |
| 18.2 SpO2 target 85 to 90% | 4 | 373 | Mean Difference (IV, Fixed, 95% CI) | 1.73 [‐3.64, 7.11] |
| 19 Mortality to follow up (> 18 months) Show forest plot | 3 | 540 | Risk Ratio (M‐H, Fixed, 95% CI) | 1.00 [0.59, 1.70] |
| 19.1 SpO2 target < 85% | 1 | 287 | Risk Ratio (M‐H, Fixed, 95% CI) | 2.32 [0.92, 5.86] |
| 19.2 SpO2 target 85 to 90% | 2 | 253 | Risk Ratio (M‐H, Fixed, 95% CI) | 0.56 [0.28, 1.14] |
| 20 Postnatal growth failure (weight < 10th percentile at discharge) Show forest plot | 1 | 60 | Risk Ratio (M‐H, Fixed, 95% CI) | 0.86 [0.55, 1.33] |
| 20.1 SpO2 target 85 to 90% | 1 | 60 | Risk Ratio (M‐H, Fixed, 95% CI) | 0.86 [0.55, 1.33] |
| 21 Duration of hospitalisation (days) Show forest plot | 3 | 216 | Mean Difference (IV, Fixed, 95% CI) | ‐1.75 [‐12.22, 8.71] |
| 21.1 SpO2 target 85 to 90% | 3 | 216 | Mean Difference (IV, Fixed, 95% CI) | ‐1.75 [‐12.22, 8.71] |
| 22 Patent ductus arteriosus (not prespecified) Show forest plot | 7 | 766 | Risk Ratio (M‐H, Fixed, 95% CI) | 0.95 [0.79, 1.15] |
| 22.1 SpO2 target < 85% | 1 | 287 | Risk Ratio (M‐H, Fixed, 95% CI) | 0.87 [0.59, 1.28] |
| 22.2 SpO2 target 85 to 90% | 6 | 479 | Risk Ratio (M‐H, Fixed, 95% CI) | 0.98 [0.79, 1.22] |
| Outcome or subgroup title | No. of studies | No. of participants | Statistical method | Effect size |
| 1 Mortality near term corrected age or discharge (latest reported) Show forest plot | 7 | 737 | Risk Ratio (M‐H, Fixed, 95% CI) | 1.21 [0.72, 2.02] |
| 1.1 SpO2 target 85 to 90% | 1 | 42 | Risk Ratio (M‐H, Fixed, 95% CI) | 1.61 [0.41, 6.34] |
| 1.2 SpO2 target 91 to 95% | 6 | 695 | Risk Ratio (M‐H, Fixed, 95% CI) | 1.16 [0.67, 2.01] |
| 2 Neurodevelopmental disability Show forest plot | 1 | 177 | Risk Ratio (M‐H, Fixed, 95% CI) | 0.71 [0.42, 1.21] |
| 2.1 SpO2 target 91 to 95% | 1 | 177 | Risk Ratio (M‐H, Fixed, 95% CI) | 0.71 [0.42, 1.21] |
| 3 IPPV in the delivery room Show forest plot | 4 | 189 | Risk Ratio (M‐H, Fixed, 95% CI) | 0.91 [0.77, 1.08] |
| 3.1 SpO2 target 85 to 90% | 1 | 42 | Risk Ratio (M‐H, Fixed, 95% CI) | 0.87 [0.60, 1.27] |
| 3.2 SpO2 target 91 to 95% | 3 | 147 | Risk Ratio (M‐H, Fixed, 95% CI) | 0.92 [0.76, 1.12] |
| 4 Intubation in the delivery room Show forest plot | 7 | 737 | Risk Ratio (M‐H, Fixed, 95% CI) | 0.96 [0.78, 1.18] |
| 4.1 SpO2 target 85 to 90% | 1 | 42 | Risk Ratio (M‐H, Fixed, 95% CI) | 0.91 [0.49, 1.68] |
| 4.2 SpO2 target 91 to 95% | 6 | 695 | Risk Ratio (M‐H, Fixed, 95% CI) | 0.96 [0.77, 1.20] |
| 5 Time to reach desired oxygen saturation target Show forest plot | 1 | 42 | Mean Difference (IV, Fixed, 95% CI) | ‐1.70 [‐3.28, ‐0.12] |
| 5.1 SpO2 target 85 to 90% | 1 | 42 | Mean Difference (IV, Fixed, 95% CI) | ‐1.70 [‐3.28, ‐0.12] |
| 6 Retinopathy of prematurity Show forest plot | 2 | 235 | Risk Ratio (M‐H, Fixed, 95% CI) | 1.00 [0.36, 2.79] |
| 6.1 SpO2 target 85 to 90% | 1 | 42 | Risk Ratio (M‐H, Fixed, 95% CI) | 0.61 [0.06, 6.17] |
| 6.2 SpO2 target 91 to 95% | 1 | 193 | Risk Ratio (M‐H, Fixed, 95% CI) | 1.14 [0.36, 3.61] |
| 7 Severe retinopathy of prematurity (≥ stage 3) Show forest plot | 3 | 393 | Risk Ratio (M‐H, Fixed, 95% CI) | 0.43 [0.16, 1.14] |
| 7.1 SpO2 target 91 to 95% | 3 | 393 | Risk Ratio (M‐H, Fixed, 95% CI) | 0.43 [0.16, 1.14] |
| 8 Intraventricular haemorrhage Show forest plot | 2 | 211 | Risk Ratio (M‐H, Fixed, 95% CI) | 0.70 [0.30, 1.64] |
| 8.1 SpO2 target 91 to 95% | 2 | 211 | Risk Ratio (M‐H, Fixed, 95% CI) | 0.70 [0.30, 1.64] |
| 9 Severe intraventricular haemorrhage (grade 3 or 4) Show forest plot | 4 | 458 | Risk Ratio (M‐H, Fixed, 95% CI) | 0.72 [0.30, 1.73] |
| 9.1 SpO2 target 85 to 90% | 1 | 42 | Risk Ratio (M‐H, Fixed, 95% CI) | 0.61 [0.12, 2.95] |
| 9.2 SpO2 target 91 to 95% | 3 | 416 | Risk Ratio (M‐H, Fixed, 95% CI) | 0.78 [0.27, 2.24] |
| 10 Periventricular leukomalacia Show forest plot | 2 | 130 | Risk Ratio (M‐H, Fixed, 95% CI) | 0.66 [0.09, 4.73] |
| 10.1 SpO2 target 85 to 90% | 1 | 42 | Risk Ratio (M‐H, Fixed, 95% CI) | 1.21 [0.08, 18.09] |
| 10.2 SpO2 target 91 to 95% | 1 | 88 | Risk Ratio (M‐H, Fixed, 95% CI) | 0.33 [0.01, 7.97] |
| 11 Necrotising enterocolitis Show forest plot | 6 | 669 | Risk Ratio (M‐H, Fixed, 95% CI) | 0.81 [0.39, 1.67] |
| 11.1 SpO2 target 85 to 90% | 1 | 42 | Risk Ratio (M‐H, Fixed, 95% CI) | 0.4 [0.02, 9.29] |
| 11.2 SpO2 target 91 to 95% | 5 | 627 | Risk Ratio (M‐H, Fixed, 95% CI) | 0.85 [0.40, 1.79] |
| 12 Chronic lung disease (28 days age) Show forest plot | 1 | 88 | Risk Ratio (M‐H, Fixed, 95% CI) | 0.47 [0.23, 0.98] |
| 12.1 SpO2 target 91 to 95% | 1 | 88 | Risk Ratio (M‐H, Fixed, 95% CI) | 0.47 [0.23, 0.98] |
| 13 Chronic lung disease (36 weeks' corrected age) Show forest plot | 7 | 734 | Risk Ratio (M‐H, Fixed, 95% CI) | 0.93 [0.73, 1.19] |
| 13.1 SpO2 target 85 to 90% | 1 | 42 | Risk Ratio (M‐H, Fixed, 95% CI) | 0.73 [0.20, 2.65] |
| 13.2 SpO2 target 91 to 95% | 6 | 692 | Risk Ratio (M‐H, Fixed, 95% CI) | 0.94 [0.74, 1.21] |
| 14 Duration of respiratory support (mechanical ventilation or CPAP) (days from birth) Show forest plot | 1 | 266 | Mean Difference (IV, Fixed, 95% CI) | ‐13.70 [‐14.85, ‐12.55] |
| 14.1 SpO2 target 91 to 95% | 1 | 266 | Mean Difference (IV, Fixed, 95% CI) | ‐13.70 [‐14.85, ‐12.55] |
| 15 Duration of respiratory support (mechanical ventilation) (days from birth) Show forest plot | 5 | 432 | Mean Difference (IV, Fixed, 95% CI) | 0.91 [‐1.02, 2.85] |
| 15.1 SpO2 target 85 to 90% | 1 | 42 | Mean Difference (IV, Fixed, 95% CI) | ‐4.75 [‐37.24, 27.74] |
| 15.2 SpO2 target 91 to 95% | 4 | 390 | Mean Difference (IV, Fixed, 95% CI) | 0.94 [‐1.01, 2.88] |
| 16 Duration of respiratory support (CPAP) (days from birth) Show forest plot | 3 | 171 | Mean Difference (IV, Fixed, 95% CI) | ‐3.11 [‐7.08, 0.86] |
| 16.1 SpO2 target 85 to 90% | 1 | 42 | Mean Difference (IV, Fixed, 95% CI) | 12.0 [‐9.18, 33.18] |
| 16.2 Higher SpO2 target 91 to 95% | 2 | 129 | Mean Difference (IV, Fixed, 95% CI) | ‐3.66 [‐7.71, 0.38] |
| 17 Duration of supplemental oxygen administration Show forest plot | 3 | 501 | Mean Difference (IV, Fixed, 95% CI) | 9.87 [7.12, 12.62] |
| 17.1 SpO2 target 85 to 90% | 1 | 42 | Mean Difference (IV, Fixed, 95% CI) | ‐10.25 [‐50.97, 30.47] |
| 17.2 SpO2 target 91 to 95% | 2 | 459 | Mean Difference (IV, Fixed, 95% CI) | 9.96 [7.21, 12.71] |
| 18 Mortality to follow up (> 18 months) Show forest plot | 2 | 480 | Risk Ratio (M‐H, Fixed, 95% CI) | 1.22 [0.65, 2.29] |
| 18.1 SpO2 target 91 to 95% | 2 | 480 | Risk Ratio (M‐H, Fixed, 95% CI) | 1.22 [0.65, 2.29] |
| 19 Duration of hospitalisation (days) Show forest plot | 2 | 156 | Mean Difference (IV, Fixed, 95% CI) | ‐4.35 [‐15.26, 6.57] |
| 19.1 SpO2 target 91 to 95% | 2 | 156 | Mean Difference (IV, Fixed, 95% CI) | ‐4.35 [‐15.26, 6.57] |
| 20 Patent ductus arteriosus (not prespecified) Show forest plot | 5 | 628 | Risk Ratio (M‐H, Fixed, 95% CI) | 0.96 [0.75, 1.22] |
| 20.1 SpO2 target 85 to 90% | 1 | 42 | Risk Ratio (M‐H, Fixed, 95% CI) | 1.10 [0.60, 2.01] |
| 20.2 SpO2 target 91 to 95% | 4 | 586 | Risk Ratio (M‐H, Fixed, 95% CI) | 0.94 [0.72, 1.22] |
| Outcome or subgroup title | No. of studies | No. of participants | Statistical method | Effect size |
| 1 Mortality near term corrected age or discharge (latest reported) Show forest plot | 8 | 832 | Risk Ratio (M‐H, Fixed, 95% CI) | 1.01 [0.66, 1.55] |
| 1.1 Gestation ≤ 28 weeks | 8 | 516 | Risk Ratio (M‐H, Fixed, 95% CI) | 1.04 [0.68, 1.61] |
| 1.2 Gestation > 28 to 32 weeks | 4 | 316 | Risk Ratio (M‐H, Fixed, 95% CI) | 0.5 [0.05, 5.26] |
| 2 Neurodevelopmental disability Show forest plot | 1 | 31 | Risk Ratio (M‐H, Fixed, 95% CI) | 3.64 [0.42, 31.27] |
| 2.1 Gestation ≤ 28 weeks | 1 | 31 | Risk Ratio (M‐H, Fixed, 95% CI) | 3.64 [0.42, 31.27] |
| 3 IPPV in the delivery room Show forest plot | 2 | 102 | Risk Ratio (M‐H, Fixed, 95% CI) | 0.96 [0.84, 1.09] |
| 3.1 Gestation ≤ 28 weeks | 2 | 102 | Risk Ratio (M‐H, Fixed, 95% CI) | 0.96 [0.84, 1.09] |
| 4 Intubation in the delivery room Show forest plot | 4 | 467 | Risk Ratio (M‐H, Fixed, 95% CI) | 1.08 [0.85, 1.35] |
| 4.1 Gestation ≤ 28 weeks | 4 | 338 | Risk Ratio (M‐H, Fixed, 95% CI) | 1.06 [0.84, 1.34] |
| 4.2 Gestation > 28 to 32 weeks | 1 | 129 | Risk Ratio (M‐H, Fixed, 95% CI) | 1.20 [0.49, 2.97] |
| 5 Time to reach desired oxygen saturation target Show forest plot | 2 | 102 | Mean Difference (IV, Fixed, 95% CI) | ‐0.52 [‐1.83, 0.79] |
| 5.1 Gestation ≤ 28 weeks | 2 | 102 | Mean Difference (IV, Fixed, 95% CI) | ‐0.52 [‐1.83, 0.79] |
| 6 Time to reach heart rate > 100 bpm Show forest plot | 1 | 60 | Mean Difference (IV, Fixed, 95% CI) | 0.27 [‐1.21, 1.75] |
| 6.1 Gestation ≤ 28 weeks | 1 | 60 | Mean Difference (IV, Fixed, 95% CI) | 0.27 [‐1.21, 1.75] |
| 7 Retinopathy of prematurity Show forest plot | 4 | 259 | Risk Ratio (M‐H, Fixed, 95% CI) | 0.72 [0.38, 1.33] |
| 7.1 Gestation ≤ 28 weeks | 4 | 259 | Risk Ratio (M‐H, Fixed, 95% CI) | 0.72 [0.38, 1.33] |
| 8 Severe retinopathy of prematurity (≥ stage 3) Show forest plot | 5 | 464 | Risk Ratio (M‐H, Fixed, 95% CI) | 0.93 [0.46, 1.89] |
| 8.1 Gestation ≤ 28 weeks | 5 | 317 | Risk Ratio (M‐H, Fixed, 95% CI) | 0.88 [0.43, 1.82] |
| 8.2 Gestation > 28 to 32 weeks | 1 | 147 | Risk Ratio (M‐H, Fixed, 95% CI) | 2.26 [0.09, 54.54] |
| 9 Intraventricular haemorrhage Show forest plot | 2 | 217 | Risk Ratio (M‐H, Fixed, 95% CI) | 0.87 [0.52, 1.48] |
| 9.1 Gestation ≤ 28 weeks | 2 | 217 | Risk Ratio (M‐H, Fixed, 95% CI) | 0.87 [0.52, 1.48] |
| 10 Severe intraventricular haemorrhage (grade 3 or 4) Show forest plot | 6 | 537 | Risk Ratio (M‐H, Fixed, 95% CI) | 1.02 [0.55, 1.87] |
| 10.1 Gestation ≤ 28 weeks | 6 | 388 | Risk Ratio (M‐H, Fixed, 95% CI) | 0.95 [0.51, 1.79] |
| 10.2 Gestation > 28 to 32 weeks | 2 | 149 | Risk Ratio (M‐H, Fixed, 95% CI) | 3.27 [0.15, 72.23] |
| 11 Periventricular leukomalacia Show forest plot | 1 | 42 | Risk Ratio (M‐H, Fixed, 95% CI) | 1.21 [0.08, 18.09] |
| 11.1 Gestation ≤ 28 weeks | 1 | 42 | Risk Ratio (M‐H, Fixed, 95% CI) | 1.21 [0.08, 18.09] |
| 12 Necrotising enterocolitis Show forest plot | 7 | 731 | Risk Ratio (M‐H, Fixed, 95% CI) | 1.57 [0.78, 3.17] |
| 12.1 Gestation ≤ 28 weeks | 7 | 483 | Risk Ratio (M‐H, Fixed, 95% CI) | 1.79 [0.80, 4.01] |
| 12.2 Gestation > 28 to 32 weeks | 3 | 248 | Risk Ratio (M‐H, Fixed, 95% CI) | 1.02 [0.23, 4.47] |
| 13 Chronic lung disease (28 days age) Show forest plot | 1 | 60 | Risk Ratio (M‐H, Fixed, 95% CI) | 1.27 [0.53, 3.05] |
| 13.1 Gestation ≤ 28 weeks | 1 | 60 | Risk Ratio (M‐H, Fixed, 95% CI) | 1.27 [0.53, 3.05] |
| 14 Chronic lung disease (36 weeks' corrected age) Show forest plot | 8 | 694 | Risk Ratio (M‐H, Fixed, 95% CI) | 0.90 [0.72, 1.13] |
| 14.1 Gestation ≤ 28 weeks | 8 | 411 | Risk Ratio (M‐H, Fixed, 95% CI) | 0.90 [0.72, 1.13] |
| 14.2 Gestation > 28 to 32 weeks | 3 | 283 | Risk Ratio (M‐H, Fixed, 95% CI) | 0.92 [0.36, 2.33] |
| 15 Duration of respiratory support (mechanical ventilation or CPAP) (days from birth) Show forest plot | 1 | 60 | Mean Difference (IV, Fixed, 95% CI) | 1.06 [‐2.63, 4.75] |
| 15.1 Gestation ≤ 28 weeks | 1 | 60 | Mean Difference (IV, Fixed, 95% CI) | 1.06 [‐2.63, 4.75] |
| 16 Duration of respiratory support (mechanical ventilation) (days from birth) Show forest plot | 2 | 120 | Mean Difference (IV, Fixed, 95% CI) | ‐13.64 [‐32.62, 5.33] |
| 16.1 Gestation ≤ 28 weeks | 2 | 120 | Mean Difference (IV, Fixed, 95% CI) | ‐13.64 [‐32.62, 5.33] |
| 17 Duration of respiratory support (CPAP) (days from birth) Show forest plot | 2 | 120 | Mean Difference (IV, Fixed, 95% CI) | ‐2.09 [‐12.85, 8.67] |
| 17.1 Gestation ≤ 28 weeks | 2 | 120 | Mean Difference (IV, Fixed, 95% CI) | ‐2.09 [‐12.85, 8.67] |
| 18 Duration of supplemental oxygen administration Show forest plot | 3 | 180 | Mean Difference (IV, Fixed, 95% CI) | ‐0.50 [‐16.90, 15.91] |
| 18.1 Gestation ≤ 28 weeks | 3 | 180 | Mean Difference (IV, Fixed, 95% CI) | ‐0.50 [‐16.90, 15.91] |
| 19 Mortality to follow up (> 18 months) Show forest plot | 1 | 60 | Risk Ratio (M‐H, Fixed, 95% CI) | 0.55 [0.20, 1.53] |
| 19.1 Gestation ≤ 28 weeks | 1 | 60 | Risk Ratio (M‐H, Fixed, 95% CI) | 0.55 [0.20, 1.53] |
| 20 Postnatal growth failure (weight < 10th percentile at discharge) Show forest plot | 1 | 60 | Risk Ratio (M‐H, Fixed, 95% CI) | 0.86 [0.55, 1.33] |
| 20.1 Gestation ≤ 28 weeks | 1 | 60 | Risk Ratio (M‐H, Fixed, 95% CI) | 0.86 [0.55, 1.33] |
| 21 Duration of hospitalisation (days) Show forest plot | 1 | 60 | Mean Difference (IV, Fixed, 95% CI) | 28.0 [‐8.96, 64.96] |
| 21.1 Gestation ≤ 28 weeks | 1 | 60 | Mean Difference (IV, Fixed, 95% CI) | 28.0 [‐8.96, 64.96] |
| 22 Patent ductus arteriosus (not prespecified) Show forest plot | 7 | 710 | Risk Ratio (M‐H, Fixed, 95% CI) | 0.96 [0.81, 1.14] |
| 22.1 Gestation ≤ 28 weeks | 7 | 483 | Risk Ratio (M‐H, Fixed, 95% CI) | 0.95 [0.80, 1.14] |
| 22.2 Gestation > 28 to 32 weeks | 2 | 227 | Risk Ratio (M‐H, Fixed, 95% CI) | 1.05 [0.54, 2.05] |
| Outcome or subgroup title | No. of studies | No. of participants | Statistical method | Effect size |
| 1 Mortality near term corrected age or discharge (latest reported) Show forest plot | 2 | 253 | Risk Ratio (M‐H, Fixed, 95% CI) | 0.51 [0.25, 1.07] |
| 2 Neurodevelopmental disability Show forest plot | 2 | 208 | Risk Ratio (M‐H, Fixed, 95% CI) | 0.82 [0.49, 1.35] |
| 3 IPPV in the delivery room Show forest plot | 1 | 60 | Risk Ratio (M‐H, Fixed, 95% CI) | 1.0 [0.94, 1.07] |
| 4 Intubation in the delivery room Show forest plot | 2 | 253 | Risk Ratio (M‐H, Fixed, 95% CI) | 1.16 [0.79, 1.70] |
| 5 Time to reach desired oxygen saturation target Show forest plot | 1 | 60 | Mean Difference (IV, Fixed, 95% CI) | 2.09 [‐0.26, 4.44] |
| 6 Time to reach heart rate > 100 bpm (not prespecified) Show forest plot | 1 | 60 | Mean Difference (IV, Fixed, 95% CI) | 0.27 [‐1.21, 1.75] |
| 7 Retinopathy of prematurity Show forest plot | 2 | 253 | Risk Ratio (M‐H, Fixed, 95% CI) | 0.85 [0.39, 1.86] |
| 8 Severe retinopathy of prematurity (≥ stage 3) Show forest plot | 1 | 60 | Risk Ratio (M‐H, Fixed, 95% CI) | 3.86 [0.19, 77.05] |
| 9 Intraventricular haemorrhage Show forest plot | 2 | 253 | Risk Ratio (M‐H, Fixed, 95% CI) | 0.85 [0.47, 1.53] |
| 10 Severe intraventricular haemorrhage (grade 3 or 4) Show forest plot | 1 | 60 | Risk Ratio (M‐H, Fixed, 95% CI) | 0.76 [0.17, 3.48] |
| 11 Necrotising enterocolitis Show forest plot | 2 | 253 | Risk Ratio (M‐H, Fixed, 95% CI) | 1.54 [0.46, 5.19] |
| 12 Chronic lung disease (28 days age) Show forest plot | 1 | 60 | Risk Ratio (M‐H, Fixed, 95% CI) | 1.27 [0.53, 3.05] |
| 13 Chronic lung disease (36 weeks' corrected age) Show forest plot | 2 | 243 | Risk Ratio (M‐H, Fixed, 95% CI) | 1.49 [0.90, 2.47] |
| 14 Duration of respiratory support (mechanical ventilation or CPAP) (days from birth) Show forest plot | 1 | 60 | Mean Difference (IV, Fixed, 95% CI) | 1.06 [‐2.63, 4.75] |
| 15 Duration of respiratory support (mechanical ventilation) (days from birth) Show forest plot | 1 | 193 | Mean Difference (IV, Fixed, 95% CI) | 1.25 [‐0.97, 3.47] |
| 16 Duration of supplemental oxygen administration Show forest plot | 2 | 253 | Mean Difference (IV, Fixed, 95% CI) | 2.72 [‐2.78, 8.22] |
| 17 Mortality to follow up (> 18 months) Show forest plot | 2 | 253 | Risk Ratio (M‐H, Fixed, 95% CI) | 0.56 [0.28, 1.14] |
| 18 Postnatal growth failure (weight < 10th percentile at discharge) Show forest plot | 1 | 60 | Risk Ratio (M‐H, Fixed, 95% CI) | 0.86 [0.55, 1.33] |
| 19 Duration of hospitalisation (days) Show forest plot | 1 | 60 | Mean Difference (IV, Fixed, 95% CI) | 28.0 [‐8.96, 64.96] |
| 20 Patent ductus arteriosus (not prespecified) Show forest plot | 2 | 253 | Risk Ratio (M‐H, Fixed, 95% CI) | 1.18 [0.88, 1.59] |