Concentración de oxígeno baja versus alta ajustada según objetivos de saturación de oxígeno durante la reanimación de neonatos prematuros en el momento del parto
Appendices
Appendix 1. Search strategies
MEDLINE
Ovid MEDLINE 1946 to January 2017
1 oxygen.mp or exp oxygen/ n=480581
2 exp resuscitation/ or resuscitation.mp n=97831
3 1 and 2 n=11743
4 exp infant, premature/ or preterm.mp n=77564
5 premature.mp n=152266
6 4 or 5 n=166276
7 3 and 6 n=1048
8 limit 7 to (humans and clinical trial/all) n=262
EMBASE
Embase 1974 to January 2017
1 oxygen.mp. or exp oxygen/ or exp oxygen therapy/ n=651861
2 exp resuscitation/ or resuscitation.mp n=115208
3 1 and 2 n=10938
4 exp prematurity/ or preterm.mp n=122817
5 premature.mp n=163835
6 4 or 5 n=229047
7 3 and 6 n=562
8 limit 7 to (human and (clinical trial or randomized controlled trial or controlled clinical trial or phase 1 clinical trial or phase 2 clinical trial or phase 3 clinical trial or phase 4 clinical trial)) n=66
COCHRANE CENTRAL
Cochrane Central Register of Controlled Trials January 2017
1 exp Oxygen/ or oxygen.mp n=2595
2 exp Resuscitation/ or resuscitation.mp n=6001
3 1 and 2 n=1143
4 preterm.mp. or exp Infant, Premature/ n=7342
5 premature.mp n=9643
6 4 or 5 n=12485
7 3 and 6 n=203
CINAHL
1 (MH "Oxygen+") OR "oxygen" OR (MH "Oxygen Therapy+") n=30969
2 (MH "Resuscitation+") OR "resuscitation" n=27428
3 1 and 2 n=2109
4 "preterm" OR (MH "Infant, Premature") n=19360
5 "premature" n=25412
6 4 or 5 n=28658
7 3 and 6 n=243
8 7 limited to "clinical trial" or "randomized controlled trial" n=47
Appendix 2. Risk of bias tool
The following issues were evaluated and entered into the risk of bias table:
1. Sequence generation (checking for possible selection bias). Was the allocation sequence adequately generated?
For each included study, we categorized the method used to generate the allocation sequence as:
-
low risk (any truly random process e.g. random number table; computer random number generator);
-
high risk (any non‐random process e.g. odd or even date of birth; hospital or clinic record number); or
-
unclear risk.
2. Allocation concealment (checking for possible selection bias). Was allocation adequately concealed?
For each included study, we categorized the method used to conceal the allocation sequence as:
-
low risk (e.g. telephone or central randomisation; consecutively numbered sealed opaque envelopes);
-
high risk (open random allocation; unsealed or non‐opaque envelopes, alternation; date of birth); or
-
unclear risk
3. Blinding of participants and personnel (checking for possible performance bias). Was knowledge of the allocated intervention adequately prevented during the study?
For each included study, we categorized the methods used to blind study participants and personnel from knowledge of which intervention a participant received. Blinding was assessed separately for different outcomes or class of outcomes. We categorized the methods as:
-
low risk, high risk or unclear risk for participants; and
-
low risk, high risk or unclear risk for personnel.
4. Blinding of outcome assessment (checking for possible detection bias). Was knowledge of the allocated intervention adequately prevented at the time of outcome assessment?
For each included study, we categorized the methods used to blind outcome assessment. Blinding was assessed separately for different outcomes or class of outcomes. We categorized the methods as:
-
low risk for outcome assessors;
-
high risk for outcome assessors; or
-
unclear risk for outcome assessors.
5. Incomplete outcome data (checking for possible attrition bias through withdrawals, dropouts, protocol deviations). Were incomplete outcome data adequately addressed?
For each included study and for each outcome, we described the completeness of data including attrition and exclusions from the analysis. We noted whether attrition and exclusions were reported, the numbers included in the analysis at each stage (compared with the total randomised participants), reasons for attrition or exclusion where reported, and whether missing data were balanced across groups or were related to outcomes. Where sufficient information was reported or supplied by the trial authors, we re‐included missing data in the analyses. We categorized the methods as:
-
low risk (< 20% missing data);
-
high risk (≥ 20% missing data); or
-
unclear risk.
6. Selective reporting bias. Are reports of the study free of suggestion of selective outcome reporting?
For each included study, we described how we investigated the possibility of selective outcome reporting bias and what we found. For studies in which study protocols were published in advance, we compared prespecified outcomes versus outcomes eventually reported in the published results. If the study protocol was not published in advance, we contacted study authors to gain access to the study protocol. We assessed the methods as:
-
low risk (where it is clear that all of the study's prespecified outcomes and all expected outcomes of interest to the review have been reported);
-
high risk (where not all the study's prespecified outcomes have been reported; one or more reported primary outcomes were not prespecified outcomes of interest and are reported incompletely and so cannot be used; study fails to include results of a key outcome that would have been expected to have been reported); or
-
unclear risk.
7. Other sources of bias. Was the study apparently free of other problems that could put it at a high risk of bias?
For each included study, we described any important concerns we had about other possible sources of bias (for example, whether there was a potential source of bias related to the specific study design or whether the trial was stopped early due to some data‐dependent process). We assessed whether each study was free of other problems that could put it at risk of bias as:
-
low risk;
-
high risk;
-
unclear risk
If needed, we explored the impact of the level of bias through undertaking sensitivity analyses.
Appendix 3. Subgroup Analyses
Subgroup analyses
Comparison 2. Lower (FiO2 < 0.4) versus higher (FiO2 ≥ 0.4) oxygen concentrations subgrouped by FiO2
One study was eligible for the subgroup analysis of FiO2 0.21 versus FiO2 ≥ 0.4 to < 0.6: it compared air (21%) with 40% oxygen (Kumar 2014).
Five studies were eligible for the subgroup analysis of FiO2 0.21 versus FiO2 ≥ 0.6 to 1.0: they compared air with 100% oxygen for resuscitation (Kapadia 2013; Kumar 2014; Oei 2016; Rabi 2011; Wang 2008).
Five studies were eligible for the subgroup analysis of FiO2 ≥ 0.3 to < 0.4 versus FiO2 ≥ 0.6 to 1.0: one study compared 30% oxygen versus 60% oxygen (Aguar 2013); one study compared 30% oxygen versus 100% oxygen (Armanian 2012); two studies compared 30% oxygen versus 90% oxygen (Escrig 2008; Vento 2009); and one study compared 30% oxygen versus 65% oxygen (Rook 2014).
Primary Outcomes
Mortality, near term corrected or discharge (latest reported) (Analysis 2.1)
FiO2 0.21 versus FiO2 ≥ 0.4 to < 0.6: one study reported no significant difference between groups (RR 1.17, 95% CI 0.09 to 14.92; participants = 13) (Kumar 2014).
FiO2 0.21 versus FiO2 ≥ 0.6 to 1.0: our meta‐analysis showed no significant difference between groups (RR 1.70, 95% CI 0.84 to 3.46; participants = 495; studies = 5).
FiO2 ≥ 0.3 to < 0.4 versus FiO2 ≥ 0.6 to 1.0: our meta‐analysis showed no significant difference between groups (RR 0.75, 95% CI 0.42 to 1.32; participants = 412; studies = 5).
The test for subgroup differences found no significant difference between groups (P = 0.21, I² = 35.9%).
Neurodevelopmental disability (Analysis 2.2)
FiO2 0.21 versus FiO2 ≥ 0.4 to < 0.6: our meta‐analysis showed no significant difference between groups (RR 0.82, 95% CI 0.49 to 1.35; participants = 208; studies = 2). Test for subgroup differences not applicable.
Secondary Outcomes
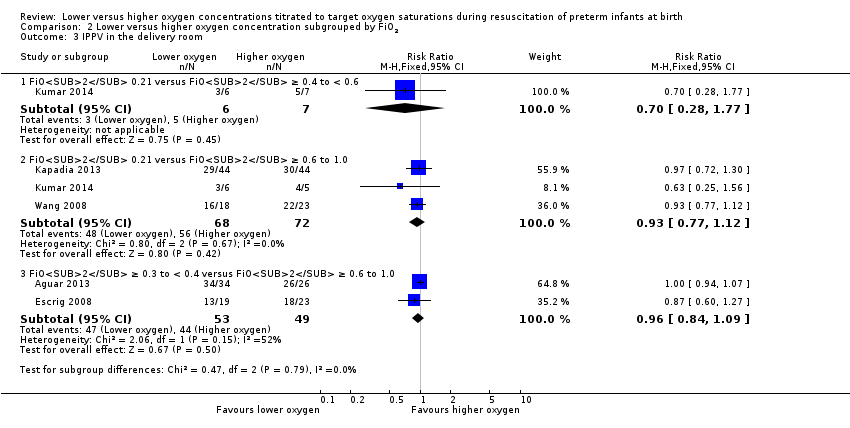
Intermittent positive pressure ventilation (IPPV) in the delivery room (Analysis 2.3)
FiO2 0.21 versus FiO2 0.4 to < 0.6: one study reported no significant difference between groups (RR 0.70, 95% CI 0.28 to 1.77; participants = 13) (Kumar 2014).
FiO2 0.21 versus FiO2 ≥ 0.6 to 1.0: our meta‐analysis showed no significant difference between groups (RR 0.93, 95% CI 0.77 to 1.12; participants = 140; studies = 3).
FiO2 ≥ 0.3 to < 0.4 versus FiO2 ≥ 0.6 to 1.0: our meta‐analysis showed no significant difference between groups (RR 0.96, 95% CI 0.84 to 1.09; participants = 102; studies = 2).
The test for subgroup differences found no significant difference between groups (P = 0.79, I² = 0%).
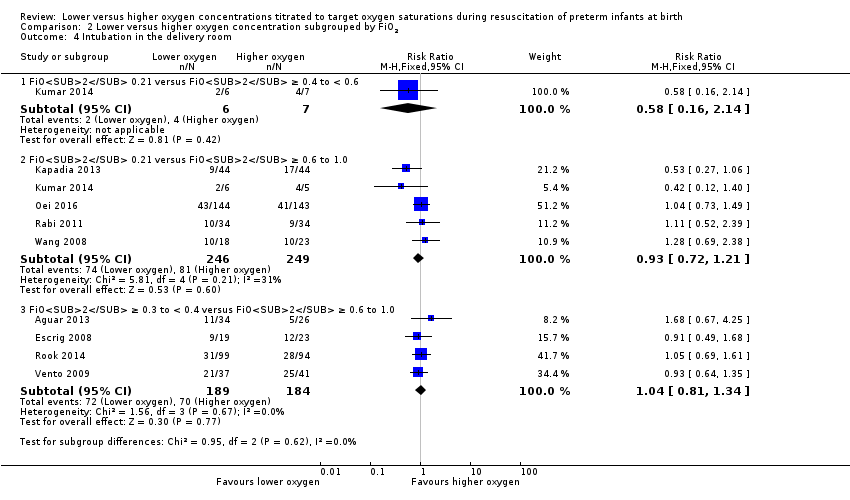
Intubation in the delivery room (Analysis 2.4)
FiO2 0.21 versus FiO2 ≥ 0.4 to < 0.6: one study reported no significant difference between groups (RR 0.58, 95% CI 0.16 to 2.14; participants = 13) (Kumar 2014).
FiO2 0.21 versus FiO2 ≥ 0.6 to 1.0: our meta‐analysis showed no significant difference between groups (RR 0.93, 95% CI 0.72 to 1.21; participants = 495; studies = 5).
FiO2 ≥ 0.3 to < 0.4 versus FiO2 ≥ 0.6 to 1.0: our meta‐analysis showed no significant difference between groups (RR 1.04, 95% CI 0.81 to 1.34; participants = 373; studies = 4).
The test for subgroup differences found no significant difference between groups (P = 0.62, I² = 0%).
Time to reach desired oxygen saturation target (Analysis 2.5)
FiO2 ≥ 0.3 to < 0.4 versus FiO2 ≥ 0.6 to 1.0: our meta‐analysis showed no significant difference between groups (MD ‐0.52 minutes, 95% CI ‐1.83 to 0.79; participants = 102; studies = 2). Test for subgroup differences not applicable.
Time to reach heart rate > 100 beats per minute (not prespecified) (Analysis 2.6)
FiO2 0.21 versus FiO2 ≥ 0.4 to < 0.6: one study reported no significant difference between groups (MD 0.27 minutes, 95% CI ‐1.21 to 1.75; participants = 60) (Aguar 2013). One of the studies, Escrig 2008, reported data as median/IQR and included additional criteria for time to response (SaO2 > 85% and good response to stimuli) so data from this study were not included in meta‐analysis. The test for subgroup differences was not applicable.
Retinopathy of prematurity (any) (Analysis 2.7)
FiO2 ≥ 0.3 to < 0.4 versus FiO2 ≥ 0.6 to 1.0: our meta‐analysis showed no significant difference between groups (RR 0.80, 95% CI 0.43 to 1.49; participants = 373; studies = 4). The test for subgroup differences was not applicable.
Severe retinopathy of prematurity (≥ stage 3) (Analysis 2.8)
FiO2 0.21 versus FiO2 ≥ 0.4 to < 0.6: one study reported no events in either group (Kumar 2014).
FiO2 0.21 versus FiO2 ≥ 0.6 to 1.0: our meta‐analysis showed no significant difference between groups (RR 0.40, 95% CI 0.15 to 1.05; participants = 386; studies = 3).
FiO2 ≥ 0.3 to < 0.4 versus FiO2 ≥ 0.6 to 1.0: one study reported no significant difference between groups (RR 3.86, 95% CI 0.19 to 77.05; participants = 60) (Aguar 2013).
The test for subgroup differences found no significant difference between groups (P = 0.16, I² = 49.9%).
Intraventricular haemorrhage (IVH) (any) (Analysis 2.9)
FiO2 0.21 versus FiO2 ≥ 0.4 to < 0.6: one study reported no events in either group (Kumar 2014).
FiO2 0.21 versus FiO2 ≥ 0.6 to 1.0: one study reported no significant difference between groups (RR 0.17, 95% CI 0.01 to 2.92; participants = 11) (Kumar 2014).
FiO2 0.3 to < 0.4 versus FiO2 ≥ 0.6 to 1.0: our meta‐analysis showed no significant difference between groups (RR 0.85, 95% CI 0.47 to 1.53; participants = 253; studies = 2).
The test for subgroup differences found no significant difference between groups (P = 0.28, I² = 15.1%).
Severe intraventricular haemorrhage (IVH) (grade 3 or 4) (Analysis 2.10)
FiO2 0.21 versus FiO2 ≥ 0.6 to 1.0: our meta‐analysis showed no significant difference between groups (RR 0.78, 95% CI 0.27 to 2.24; participants = 416; studies = 3).
FiO2 0.3 to < 0.4 versus FiO2 ≥ 0.6 to 1.0: our meta‐analysis showed no significant difference between groups (RR 1.03, 95% CI 0.49 to 2.18; participants = 180; studies = 3).
The test for subgroup differences found no significant difference between groups (P = 0.66, I² = 0%).
Periventricular leukomalacia (PVL) (Analysis 2.11)
FiO2 0.21 versus FiO2 ≥ 0.6 to 1.0: one study reported no significant difference between groups (RR 0.33, 95% CI 0.01 to 7.97; participants = 88) (Kapadia 2013).
FiO2 0.3 to < 0.4 versus FiO2 ≥ 0.6 to 1.0: one study reported no significant difference between groups (RR 1.21, 95% CI 0.08 to 18.09; participants = 42) (Escrig 2008).
The test for subgroup differences found no significant difference between groups (P = 0.54, I² = 0%).
Necrotising enterocolitis (proven) (Analysis 2.12)
FiO2 0.21 versus FiO2 ≥ 0.4 to < 0.6: one study reported no significant difference between groups (RR 0.58, 95% CI 0.07 to 4.95; participants = 13) (Kumar 2014).
FiO2 0.21 versus FiO2 ≥ 0.6 to 1.0: our meta‐analysis showed no significant difference between groups (RR 0.74, 95% CI 0.31 to 1.76; participants = 434; studies = 4).
FiO2 0.3 to < 0.4 versus FiO2 ≥ 0.6 to 1.0: our meta‐analysis showed no significant difference between groups (RR 1.40, 95% CI 0.52 to 3.78; participants = 373; studies = 4).
The test for subgroup differences found no significant difference between groups (P = 0.57, I² = 0%).
Chronic lung disease (28 days) (Analysis 2.13)
FiO2 0.21 versus FiO2 ≥ 0.6 to 1.0: one study reported a lower risk of chronic lung disease at 28 days of life in infants allocated to the lower oxygen group (RR 0.47, 95% CI 0.23 to 0.98; participants = 88) (Kapadia 2013).
FiO2 0.3 to < 0.4 versus FiO2 ≥ 0.6 to 1.0: one study reported no significant difference between groups (RR 1.27, 95% CI 0.53 to 3.05; participants = 60) (Aguar 2013).
The test for subgroup differences found no significant difference between groups (P = 0.09, I² = 66%).
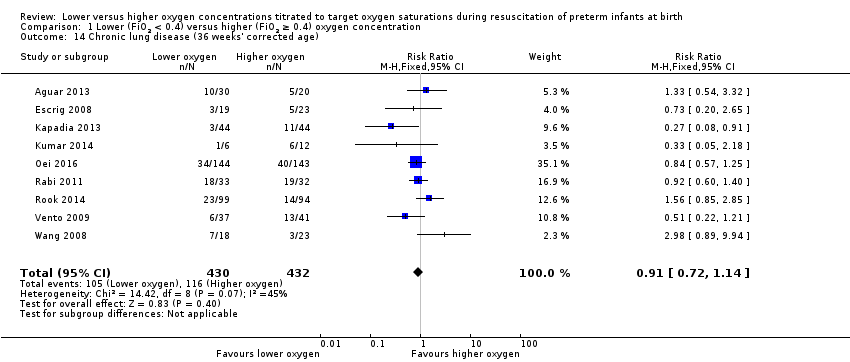
Chronic lung disease (36 weeks) (Analysis 2.14)
FiO2 0.21 versus FiO2 ≥ 0.4 to < 0.6: one study reported no significant difference between groups (RR 0.39, 95% CI 0.05 to 2.83; participants = 13) (Kumar 2014).
FiO2 0.21 versus FiO2 ≥ 0.6 to 1.0: our meta‐analysis showed no significant difference between groups (RR 0.83, 95% CI 0.63 to 1.09; participants = 492; studies = 5).
FiO2 0.3 to < 0.4 versus FiO2 ≥ 0.6 to 1.0: our meta‐analysis showed no significant difference between groups (RR 1.07, 95% CI 0.72 to 1.60; participants = 363; studies = 4).
The test for subgroup differences found no significant difference between groups (P = 0.41, I² = 0%).
Duration of respiratory support (mechanical ventilation or CPAP ) (days from birth) (Analysis 2.15)
FiO2 0.21 versus FiO2 ≥ 0.6 to 1.0: one study reported infants receiving lower (FiO2 0.21) oxygen had a shorter duration of respiratory support (mechanical ventilation or CPAP) compared to infants on higher oxygen (FiO2 1.0) (MD ‐13.70, 95% CI ‐14.85 to ‐12.55; participants = 266) (Oei 2016).
FiO2 ≥ 0.3 to < 0.4 versus FiO2 ≥ 0.6 to 1.0: one study reported no significant difference between groups (MD 1.06, 95% CI ‐2.63 to 4.75; participants = 60) (Aguar 2013).
Test for subgroup differences found a significant difference (P < 0.00001, I² = 98.2%).
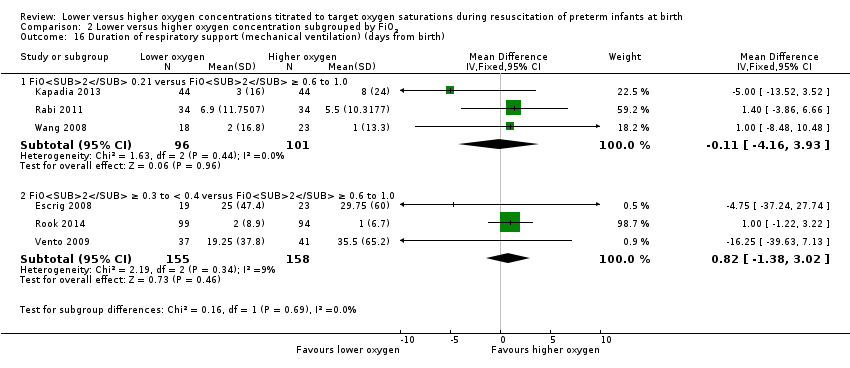
Duration of respiratory support (mechanical ventilation) (days from birth) (Analysis 2.16)
FiO2 0.21 versus FiO2 ≥ 0.6 to 1.0: our meta‐analysis showed no significant difference between groups (MD ‐0.11, 95% CI ‐4.16 to 3.93; participants = 197; studies = 3).
FiO2 0.3 to < 0.4 versus FiO2 ≥ 0.6 to 1.0: our meta‐analysis showed no significant difference between groups (MD 0.82, 95% CI ‐1.38 to 3.02; participants = 313; studies = 3).
The test for subgroup differences found no significant difference between groups (P = 0.69, I² = 0%).
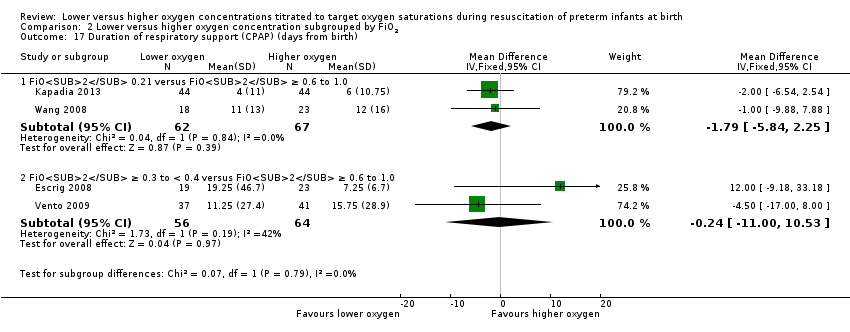
Duration of respiratory support (continuous positive airway pressure (CPAP)) (days from birth) (Analysis 2.17)
FiO2 0.21 versus FiO2 ≥ 0.6 to 1.0: our meta‐analysis showed no significant difference between groups (MD ‐1.79, 95% CI ‐5.84 to 2.25; participants = 129; studies = 2).
FiO2 0.3 to < 0.4 versus FiO2 ≥ 0.6 to 1.0: our meta‐analysis showed no significant difference between groups (MD ‐0.24, 95% CI ‐11.00 to 10.53; participants = 120; studies = 2).
The test for subgroup differences found no significant difference between groups (P = 0.79, I² = 0%).
Duration of supplemental oxygen administration (days) (Analysis 2.18)
FiO2 0.21 versus FiO2 ≥ 0.6 to 1.0: one study reported infants who received lower (FiO2 0.21) oxygen had a shorter duration of supplemental oxygen administration compared to infants on higher oxygen (FiO2 1.0) (MD 12.40 days, 95% CI 9.25 to 15.55; participants = 266) (Oei 2016).
FiO2 0.3 to < 0.4 versus FiO2 ≥ 0.6 to 1.0: our meta‐analysis showed no significant difference between groups (MD 0.01 days, 95% CI ‐5.37 to 5.38; participants = 373; studies = 4).
Test for subgroup differences found a significant difference (P < 0.00001, I² = 93.4%).
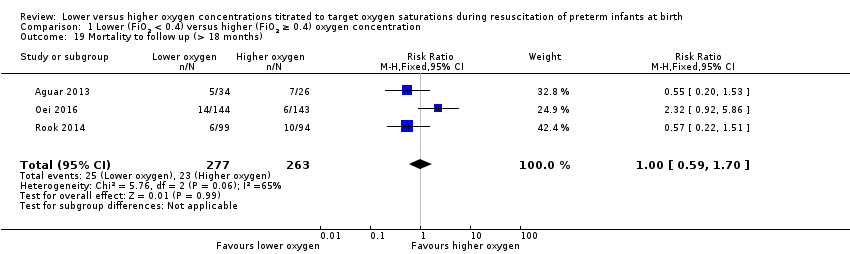
Mortality to follow‐up (> 18 months) (Analysis 2.19)
FiO2 0.21 versus FiO2 ≥ 0.6 to 1.0: one study reported no significant difference between groups (RR 2.32, 95% CI 0.92 to 5.86; participants = 287) (Oei 2016).
FiO2 0.3 to < 0.4 versus FiO2 ≥ 0.6 to 1.0: our meta‐analysis showed no significant difference between groups (RR 0.56, 95% CI 0.28 to 1.14; participants = 253; studies = 2).
The test for subgroup differences found a significant difference (P = 0.02, I² = 82.4%).
Postnatal growth failure (weight < 10th percentile at discharge) (Analysis 2.20)
FiO2 0.21 versus FiO2 ≥ 0.4 to < 0.6: one study reported no significant difference between groups (RR 0.86, 95% CI 0.55 to 1.33; participants = 60) (Aguar 2013). The test for subgroup differences was not applicable.
Duration of hospitalisation (days) (Analysis 2.21)
FiO2 0.21 versus FiO2 ≥ 0.6 to 1.0: our meta‐analysis showed no significant difference between groups (MD ‐4.35, 95% CI ‐15.26 to 6.57; participants = 156; studies = 2).
FiO2 0.3 to < 0.4 versus FiO2 ≥ 0.6 to 1.0: one study reported no significant difference between groups (MD 28.00, 95% CI ‐8.96 to 64.96; participants = 60) (Aguar 2013).
The test for subgroup differences found no significant difference between groups (P = 0.10, I² = 63.1%).
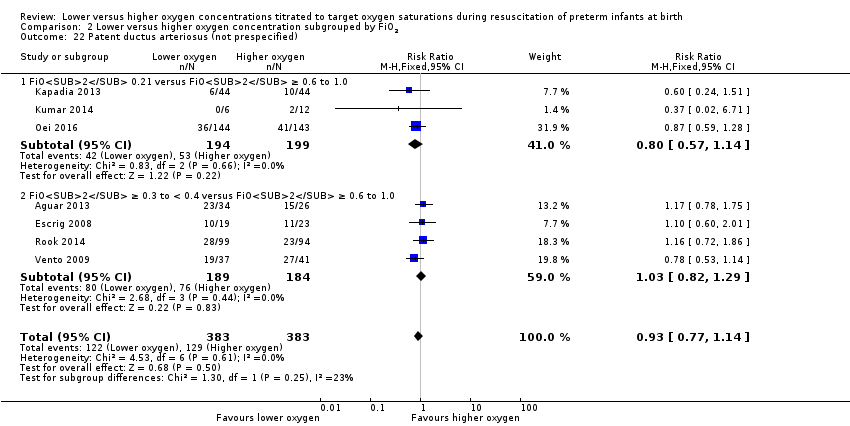
Patent ductus arteriosus (not prespecified) (Analysis 2.22)
FiO2 0.21 versus FiO2 ≥ 0.6 to 1.0: our meta‐analysis showed no significant difference between groups (RR 0.80, 95% CI 0.57 to 1.14; participants = 393; studies = 3).
FiO2 0.3 to < 0.4 versus FiO2 ≥ 0.6 to 1.0: our meta‐analysis showed no significant difference between groups (RR 1.03, 95% CI 0.82 to 1.29; participants = 373; studies = 4).
Test for subgroup differences found no significant difference between groups (P = 0.25, I² = 22.8%).
Comparison 3. Lower (FiO2 < 0.4) versus higher (FiO2 ≥ 0.4) oxygen concentration subgrouped by lower limit of oxygen saturation target range at 5 to 10 minutes
One study, Oei 2016, reported outcomes in infants receiving lower or higher oxygen concentrations and targeted to a lower limit of oxygen saturation target range of < 85%.
Nine studies reported outcomes for infants receiving lower or higher oxygen concentrations targeted to SpO2 85% to 90% for postbirth resuscitation (Aguar 2013; Armanian 2012; Escrig 2008; Kapadia 2013; Kumar 2014; Rabi 2011; Rook 2014; Vento 2009; Wang 2008).
No studies reported outcomes for infants receiving lower or higher oxygen concentrations targeted to SpO2 91% to 95% or SpO2 > 95% for postbirth resuscitation.
Primary Outcomes
Mortality, near term corrected age or discharge (latest reported) (Analysis 3.1)
Lower oxygen group, SpO2 target < 85%: one study reported significantly increased mortality in infants allocated to air (FiO2 0.21) compared to infants receiving 100% oxygen (RR 2.78, 95% CI 1.03 to 7.52; participants = 287) (Oei 2016).
Subgroup: lower oxygen group, SpO2 target 85% to 90%: our meta‐analysis showed no significant difference between groups (RR 0.77, 95% CI 0.46 to 1.27; participants = 627; studies = 9).
The test for subgroup differences found a significant difference (P = 0.02; I² = 80.5%).
Neurodevelopmental disability (Analysis 3.2)
Lower oxygen group, SpO2 target < 85%: no study has reported data to date.
Subgroup: lower oxygen group, SpO2 target 85 to 90%: our meta‐analysis showed no significant difference between groups (RR 0.82, 95% CI 0.49 to 1.35; participants = 208; studies = 2).
Test for subgroup differences not indicated.
Secondary Outcomes
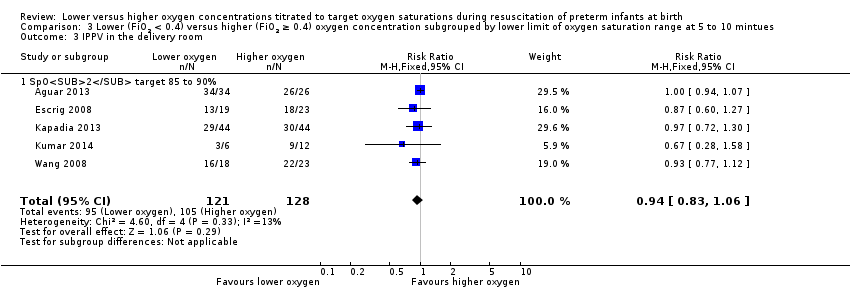
Intermittent positive pressure ventilation (IPPV) in the delivery room (Analysis 3.3)
Subgroup: lower oxygen group SpO2 target < 85%: no study has reported data to date.
Subgroup: lower oxygen group SpO2 target 85% to 90%: our meta‐analysis showed no significant difference between groups (RR 0.94, 95% CI 0.83 to 1.06; participants = 249; studies = 5). Test for subgroup differences not indicated.
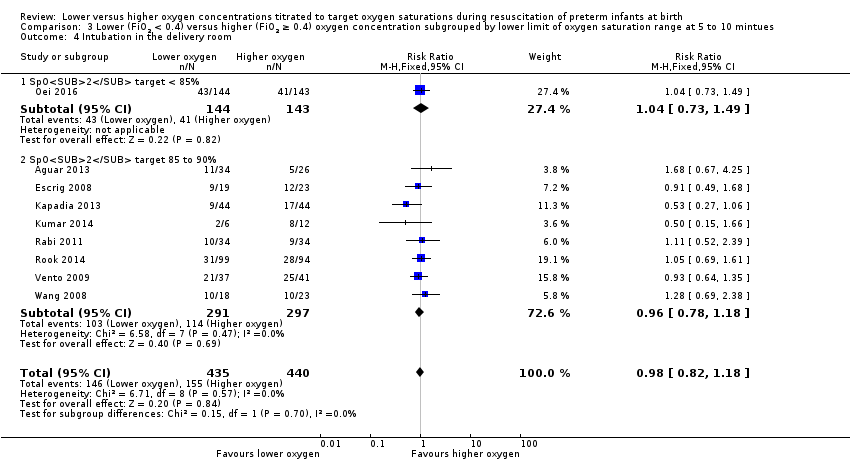
Intubation in the delivery room (Analysis 3.4)
Lower oxygen group, SpO2 target < 85%: one study reported no significant difference between groups (RR 1.04, 95% CI 0.73 to 1.49; participants = 287) (Oei 2016).
Subgroup: lower oxygen group, SpO2 target 85% to 90%: our meta‐analysis showed no significant difference between groups (RR 0.96, 95% CI 0.78 to 1.18; participants = 588; studies = 8). The test for subgroup differences found no significant difference between groups (P = 0.70; I² = 0%).
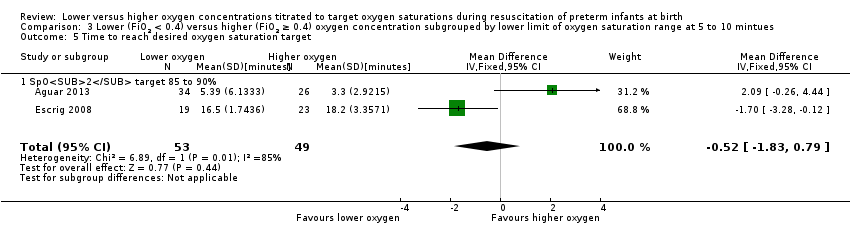
Time to reach desired oxygen saturation target (Analysis 3.5)
Subgroup: lower oxygen group SpO2 target 85% to 90%: our meta‐analysis showed no significant difference between groups (MD ‐0.52 minutes, 95% CI ‐1.83 to 0.79; participants = 102; studies = 2). Test for subgroup differences not indicated.
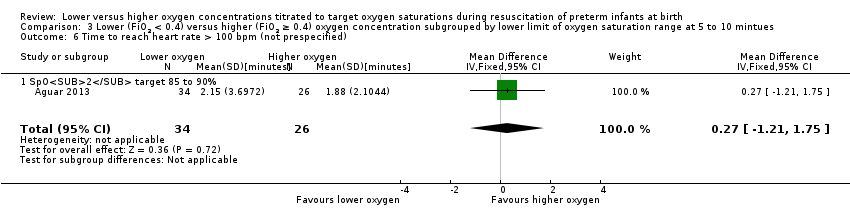
Time to reach heart rate > 100 beats per minute (Analysis 3.6)
Subgroup: lower oxygen group SpO2 target 85% to 90%: reported no significant difference between groups (MD 0.27 minutes, 95% CI ‐1.21 to 1.75; participants = 60) (Aguar 2013). Test for subgroup differences not indicated.
Retinopathy of prematurity (any) (Analysis 3.7)
Subgroup: lower oxygen group SpO2 target 85% to 90%: our meta‐analysis showed no significant difference between groups (RR 0.80, 95% CI 0.43 to 1.49; participants = 373; studies = 4). Test for subgroup differences not indicated.
Severe retinopathy of prematurity (≥ stage 3) (Analysis 3.8)
Lower oxygen group, SpO2 target < 85%: one study reported no significant difference between groups (RR 0.50, 95% CI 0.15 to 1.61; participants = 287) (Oei 2016).
Subgroup: lower oxygen group, SpO2 target 85% to 90%: our meta‐analysis showed no significant difference between groups (RR 0.68, 95% CI 0.19 to 2.48; participants = 166; studies = 3).
The test for subgroup differences found no significant difference between groups (P = 0.72; I² = 0%).
Intraventricular haemorrhage (IVH) (any) (Analysis 3.9)
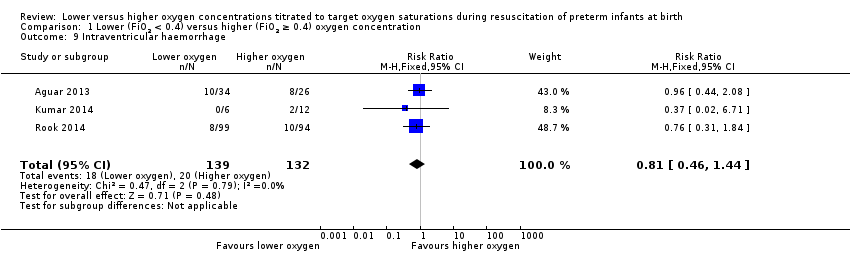
Subgroup: lower oxygen group, SpO2 target 85% to 90%: our meta‐analysis showed no significant difference between groups (RR 0.81, 95% CI 0.46 to 1.44; participants = 271; studies = 3). Test for subgroup differences not indicated.
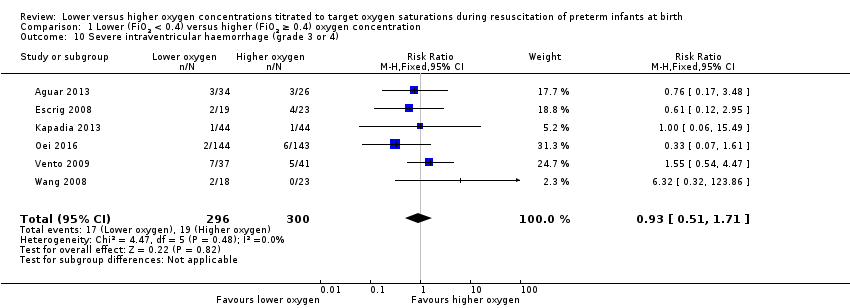
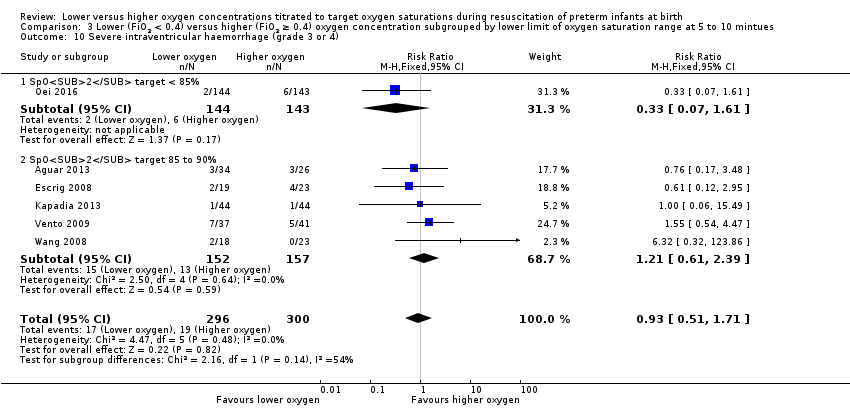
Severe intraventricular haemorrhage (IVH) (grade 3 or 4) (Analysis 3.10)
Lower oxygen group, SpO2 target < 85%: one study reported no significant difference between groups (RR 0.33, 95% CI 0.07 to 1.61; participants = 287) (Oei 2016).
Subgroup: lower oxygen group, SpO2 target 85% to 90%: our meta‐analysis showed no significant difference between groups (RR 1.21, 95% CI 0.61 to 2.39; participants = 309; studies = 5).
The test for subgroup differences found no significant difference (P = 0.14; I² = 53.8%).
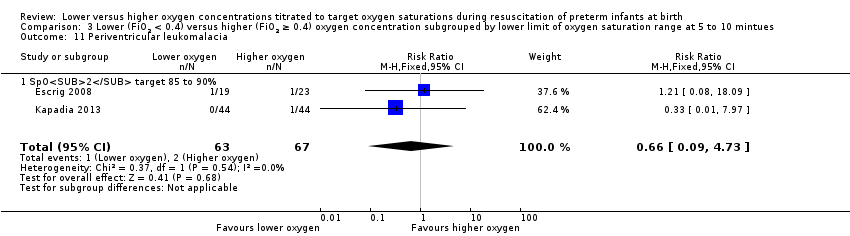
Periventricular leukomalacia (PVL) (Analysis 3.11)
Subgroup: lower oxygen group, SpO2 target 85% to 90%: our meta‐analysis showed no significant difference between groups (RR 0.66, 95% CI 0.09 to 4.73; participants = 130; studies = 2; I2 = 0%). Test for subgroup differences not indicated.
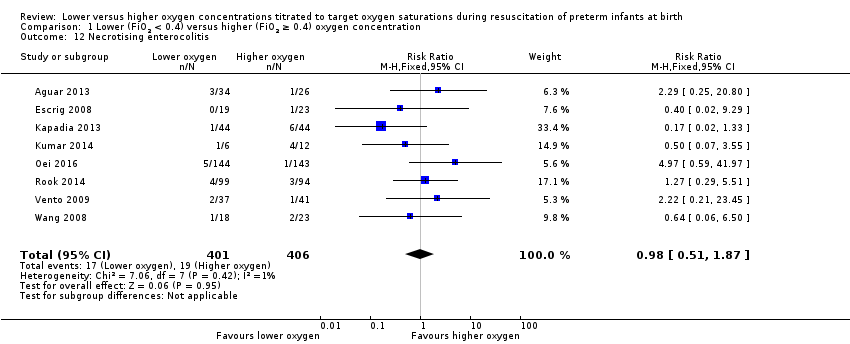
Necrotising enterocolitis (proven) (Analysis 3.12)
Lower oxygen group, SpO2 target < 85%: one study reported no significant difference between groups (RR 4.97, 95% CI 0.59 to 41.97; participants = 287) (Oei 2016).
Subgroup: lower oxygen group, SpO2 target 85% to 90%: our meta‐analysis showed no significant difference between groups (RR 0.74, 95% CI 0.36 to 1.52; participants = 520; studies = 7).
The test for subgroup differences found no significant difference (P = 0.10; I² = 63.4%).
Chronic lung disease (28 days) (Analysis 3.13)
Subgroup: lower oxygen group, SpO2 target 85%‐90%: our meta‐analysis showed no significant difference between groups (RR 0.70, 95% CI 0.41 to 1.21; participants = 148; studies = 2; I2 = 66%). We identified moderate heterogeneity in this analysis. Test for subgroup differences not indicated.
Chronic lung disease (36 weeks) (Analysis 3.14)
Lower oxygen group, SpO2 target < 85%: Oei 2016 reported no significant difference between groups (RR 0.84, 95% CI 0.57 to 1.25; participants = 287).
Subgroup: lower oxygen group, SpO2 target 85% to 90%: our meta‐analysis showed no significant difference between groups (RR 0.91, 95% CI 0.58 to 1.43; participants = 575; studies = 8).
The test for subgroup differences found no significant difference (P = 0.79; I² = 0%).
Duration of respiratory support (mechanical ventilation or CPAP) (days from birth) (Analysis 3.15)
Lower oxygen group, SpO2 target < 85%: one study reported a shorter duration of respiratory support (mechanical ventilation or CPAP) (days from birth) in infants allocated to lower (FiO2 0.21) compared higher oxygen (FiO2 1.0) (MD ‐13.70, 95% CI ‐14.85 to ‐12.55; participants = 266) (Oei 2016).
Subgroup: lower oxygen group, SpO2 target 85% to 90%: reported no significant difference between groups (MD 1.06, 95% CI ‐2.63 to 4.75; participants = 60) (Aguar 2013).
The test for subgroup differences found a significant difference (P < 0.00001; I² = 98.2%).
Duration of respiratory support (mechanical ventilation) (days from birth) (Analysis 3.16)
Subgroup: lower oxygen group, SpO2 target 85% to 90%: our meta‐analysis showed no significant difference between groups (MD 0.78, 95% CI ‐1.15 to 2.72; participants = 510; studies = 6). Test for subgroup differences not indicated.
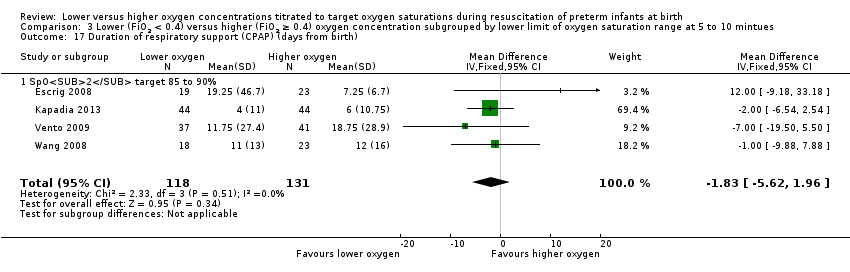
Duration of respiratory support (continuous positive airway pressure (CPAP) (days from birth) (Analysis 3.17)
Subgroup: lower oxygen group, SpO2 target 85% to 90%: our meta‐analysis showed no significant difference between groups (MD ‐1.83, 95% CI ‐5.62 to 1.96; participants = 249; studies = 4). Test for subgroup differences not indicated.
Duration of supplemental oxygen administration (days) (Analysis 3.18)
Lower oxygen group, SpO2 target < 85%: one study reported a longer duration of supplemental oxygen in infants allocated to lower (FiO2 0.21) compared higher oxygen (FiO2 1.0) (MD 12.40 days, 95% CI 9.25 to 15.55; participants = 266) (Oei 2016).
Subgroup: lower oxygen group SpO2 target 85% to 90%: our meta‐analysis showed no significant difference between groups (MD 1.73 days, 95% CI ‐3.64 to 7.11; participants = 373; studies = 4).
The test for subgroup differences found a significant difference (P < 0.0008; I² = 91.1%).
Mortality to follow‐up (> 18 months) (Analysis 3.19)
Lower oxygen group, SpO2 target < 85%: one study reported no significant difference between groups (RR 2.32, 95% CI 0.92 to 5.86; participants = 287) (Oei 2016).
Subgroup: lower oxygen group, SpO2 target 85% to 90%: our meta‐analysis showed no significant difference between groups (RR 0.56, 95% CI 0.28 to 1.14; participants = 253; studies = 2).
The test for subgroup differences found a significant difference (P = 0.02; I² = 82.4%).
Postnatal growth failure (weight < 10th percentile at discharge) (Analysis 3.20)
Subgroup: lower oxygen group, SpO2 target 85% to 90%: one study reported no significant difference between groups (RR 0.86, 95% CI 0.55 to 1.33; participants = 60) (Aguar 2013). Test for subgroup differences not indicated.
Duration of hospitalisation (days) (Analysis 3.21)
Subgroup: lower oxygen group, SpO2 target 85% to 90%: our meta‐analysis showed no significant difference between groups (MD ‐1.75, 95% CI ‐12.22 to 8.71; participants = 216; studies = 3). Test for subgroup differences not indicated.
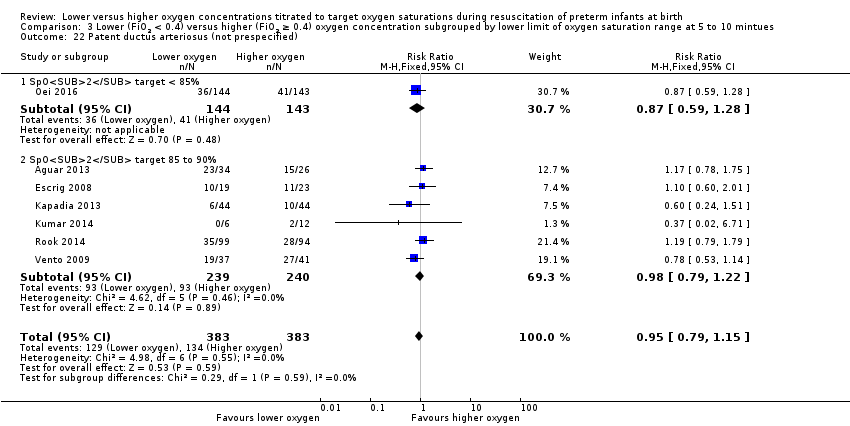
Patent ductus arteriosus (not prespecified) (Analysis 3.22)
Lower oxygen group, SpO2 target < 85%: one study reported no significant difference between groups (RR 0.87, 95% CI 0.59 to 1.28; participants = 287) (Oei 2016).
Subgroup: lower oxygen group, SpO2 target 85% to 90%: our meta‐analysis showed no significant difference between groups (RR 0.98, 95% CI 0.79 to 1.22; participants = 479; studies = 6).
Test for subgroup differences found no significant difference (P = 0.59; I² = 0%).
Comparison 4. Lower versus higher oxygen concentrations — subgrouped by higher limit of oxygen saturation target range at 5 to 10 minutes
One study reported outcomes in infants receiving lower or higher oxygen concentrations targeted to a higher limit of oxygen saturation target range of 85% to 90% (Escrig 2008).
Six studies reported outcomes for infants receiving lower or higher oxygen concentrations targeted to a highest SpO2 limit of 91% to 95% (Kapadia 2013; Kumar 2014; Oei 2016; Rabi 2011; Rook 2014; Vento 2009).
Three studies did not report higher limit of oxygen saturation target ranges (Aguar 2013; Armanian 2012; Vento 2009).
No studies reported outcomes for infants receiving lower or higher oxygen concentrations targeted to a higher limit of oxygen saturation target range of < 85% or > 95% for postbirth resuscitation.
Primary Outcomes
Mortality, near term corrected age or discharge (latest reported) (Analysis 4.1)
Subgroup: higher limit of the oxygen saturation target range 85% to 90%: one study reported no significant difference between groups (RR 1.61, 95% CI 0.41 to 6.34; participants = 42) (Escrig 2008).
Subgroup: higher limit of the oxygen saturation target range 90% to 95%: our meta‐analysis showed no significant difference between groups (RR 1.16, 95% CI 0.67 to 2.01; participants = 695; studies = 6).
The test for subgroup differences found no significant difference (P = 0.66; I² = 0%).
Neurodevelopmental disability (Analysis 4.2)
Subgroup: higher limit of the oxygen saturation target range 90% to 95%: one study reported no significant difference between lower and higher oxygen groups (RR 0.71, 95% CI 0.42 to 1.21; participants = 177) (Rook 2014). Test for subgroup differences not indicated.
Secondary Outcomes
Intermittent positive pressure ventilation (IPPV) in the delivery room (Analysis 4.3)
Subgroup: higher limit of the oxygen saturation target range 85% to 90%: one study reported no significant difference between groups (RR 0.87, 95% CI 0.60 to 1.27; participants = 42) (Escrig 2008).
Subgroup: higher limit of the oxygen saturation target range 90% to 95%: our meta‐analysis showed no significant difference between groups (RR 0.92, 95% CI 0.76 to 1.12; participants = 147; studies = 3).
The test for subgroup differences found no significant difference (P = 0.81; I² = 0%).
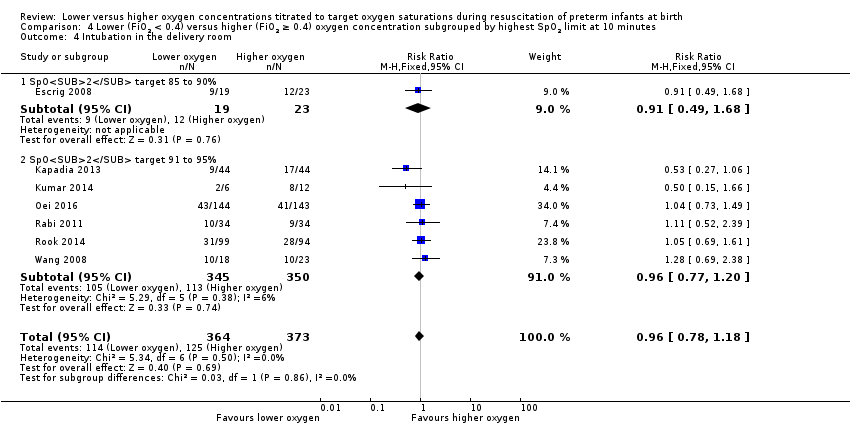
Intubation in the delivery room (Analysis 4.4)
Subgroup: higher limit of the oxygen saturation target range 85% to 90%: one study reported no significant difference between groups (RR 0.91, 95% CI 0.49 to 1.68; participants = 42) (Escrig 2008).
Subgroup: higher limit of the oxygen saturation target range 91% to 95%: our meta‐analysis showed no significant difference between groups (RR 0.96, 95% CI 0.77 to 1.20; participants = 695; studies = 6).
The test for subgroup differences found no significant difference (P = 0.86; I² = 0%).
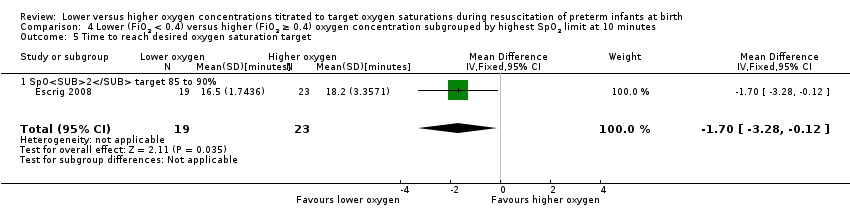
Time to reach desired oxygen saturation target (min) (Analysis 4.5)
Subgroup: higher limit of the oxygen saturation target range 85% to 90%: one study reported a reduction in time to each desired oxygen saturation target in infants allocated to the lower (FiO2 0.3) versus higher (FiO2 0.9) oxygen group (MD ‐1.70 minutes, 95% CI ‐3.28 to ‐0.12; participants = 42) (Escrig 2008). Test for subgroup differences not indicated.
Time to reach heart rate > 100 beats per minute
No studies that reported targeting a highest SpO2 limit reported this outcome.
Retinopathy of prematurity (any) (Analysis 4.6)
Subgroup: higher limit of the oxygen saturation target range 85% to 90%: one study reported no significant difference between groups (RR 0.61, 95% CI 0.06 to 6.17; participants = 42) (Escrig 2008).
Subgroup: highest limit of the oxygen saturation target range 91% to 95%: one study reported no significant difference between groups (RR 1.14, 95% CI 0.36 to 3.61; participants = 193) (Rook 2014).
The test for subgroup differences found no significant difference (P = 0.63; I² = 0%).
Severe retinopathy of prematurity (≥ stage 3) (Analysis 4.7)
Subgroup:higher limit of oxygen saturation target range 91% to 95%: our meta‐analysis showed no significant difference between groups (RR 0.43, 95% CI 0.16 to 1.14; participants = 393; studies = 3). Test for subgroup differences not indicated.
Intraventricular haemorrhage (IVH) (any) (Analysis 4.8)
Subgroup: higher limit of oxygen saturation target range 91% to 95%: our meta‐analysis showed no significant difference between groups (RR 0.70, 95% CI 0.30 to 1.64; participants = 211; studies = 2). Test for subgroup differences not indicated.
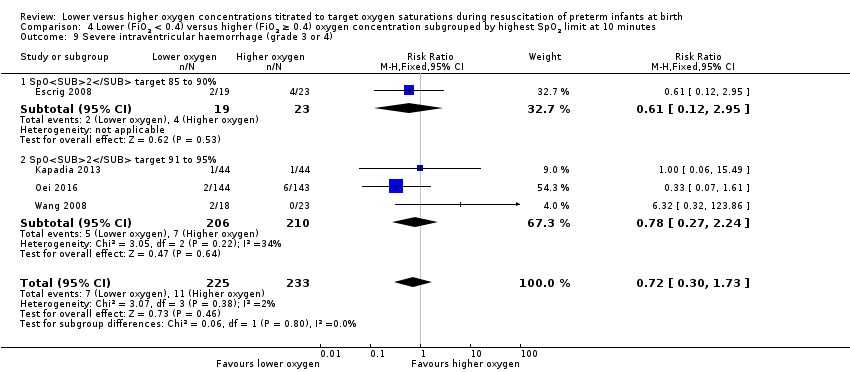
Severe intraventricular haemorrhage (IVH) (grade 3 or 4) (Analysis 4.9)
Subgroup: higher limit of the oxygen saturation target range 85% to 90%: one study reported no significant difference between groups (RR 0.61, 95% CI 0.12 to 2.95; participants = 42) (Escrig 2008).
Subgroup: higher limit of the oxygen saturation target range 91% to 95%: our meta‐analysis showed no significant difference between groups (RR 0.78, 95% CI 0.27 to 2.24; participants = 416; studies = 3).
The test for subgroup differences found no significant difference (P = 0.80; I² = 0%).
Periventricular leukomalacia (Analysis 4.10)
Subgroup: higher limit of the oxygen saturation target range 85% to 90%: one study reported no significant difference between groups (RR 1.21, 95% CI 0.08 to 18.09; participants = 42) (Escrig 2008).
Subgroup: higher limit of the oxygen saturation target range 91% to 95%: one study reported no significant difference between groups (RR 0.33, 95% CI 0.01 to 7.97; participants = 88) (Kapadia 2013).
The test for subgroup differences found no significant difference (P = 0.54; I² = 0%).
Necrotising enterocolitis (proven) (Analysis 4.11)
Subgroup: higher limit of the oxygen saturation target range 85% to 90%: one study reported no significant difference between groups (RR 0.40, 95% CI 0.02 to 9.29; participants = 42) (Escrig 2008).
Subgroup: higher SpO2 limit 91% to 95%: our meta‐analysis showed no significant difference between groups (RR 0.85, 95% CI 0.40 to 1.79; participants = 627; studies = 5).
The test for subgroup differences found no significant difference (P = 0.65; I² = 0%).
Chronic lung disease (28 days) (Analysis 4.12)
Subgroup: higher SpO2 limit 91% to 95%: one study reported a lower incidence of chronic lung disease at 28 days (RR 0.47, 95% CI 0.23 to 0.98; participants = 88) (Kapadia 2013). Test for subgroup differences not indicated.
Chronic lung disease (36 weeks) (Analysis 4.13)
Subgroup: higher SpO2 limit 85% to 90%: one study reported no significant difference between groups (RR 0.73, 95% CI 0.20 to 2.65; participants = 42) (Escrig 2008).
Subgroup: higher SpO2 limit 91% to 95%: our meta‐analysis showed no significant difference between groups (RR 0.94, 95% CI 0.74 to 1.21; participants = 692; studies = 6).
The test for subgroup differences found no significant difference (P = 0.70; I² = 0%).
Duration of respiratory support (mechanical ventilation or CPAP) (days from birth) (Analysis 4.14)
Subgroup: highest limit of the oxygen saturation target range 91% to 95%: one study reported a shorter duration of respiratory support (mechanical ventilation or CPAP) in infants allocated to the 30% oxygen group compared to those in the 90% oxygen group (MD ‐13.70, 95% CI ‐14.85 to ‐12.55; participants = 266) (Oei 2016). The definition of respiratory support included ventilation, CPAP, high‐flow nasal cannula or low‐flow oxygen. Test for subgroup differences not indicated.
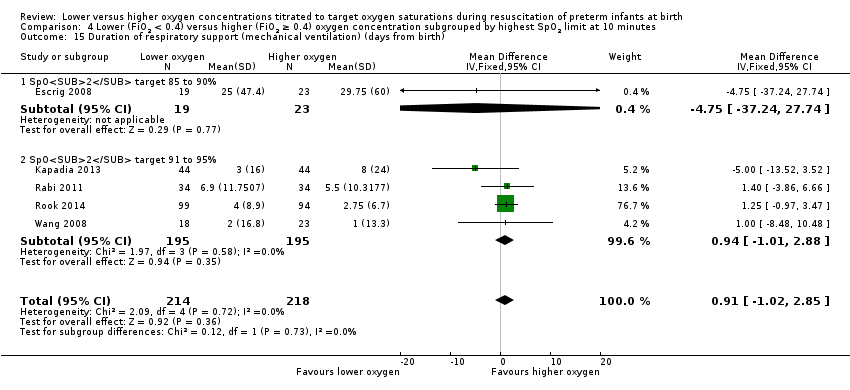
Duration of respiratory support (mechanical ventilation) (days from birth) (Analysis 4.15)
Subgroup: higher limit of the oxygen saturation target range 85% to 90%: one study reported no significant difference between groups (MD ‐4.75, 95% CI ‐37.24 to 27.74; participants = 42) (Escrig 2008).
Subgroup: higher limit of the oxygen saturation target range 91% to 95%: our meta‐analysis showed no significant difference between groups (MD 0.94, 95% CI ‐1.01 to 2.88; participants = 390; studies = 4).
The test for subgroup differences found no significant difference (P = 0.73; I² = 0%).
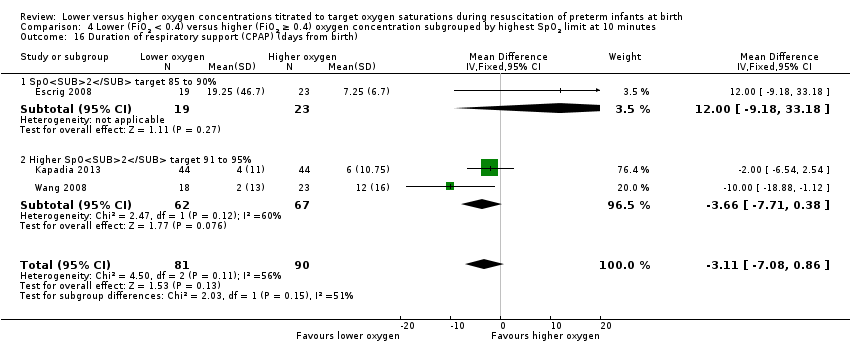
Duration of respiratory support (CPAP) (days from birth) (Analysis 4.16)
Subgroup: highest limit of the oxygen saturation target range 85% to 90%: one study reported no significant difference between groups (MD 12.00, 95% CI ‐9.18 to 33.18; participants = 42) (Escrig 2008).
Subgroup: highest limit of the oxygen saturation target range 91% to 95%: our meta‐analysis showed a shorter duration of respiratory support (CPAP) (MD ‐3.66 days, 95% CI ‐7.71 to 0.38; participants = 129; studies = 2).
The test for subgroup differences found no significant difference (P = 0.15; I² = 50.7%).
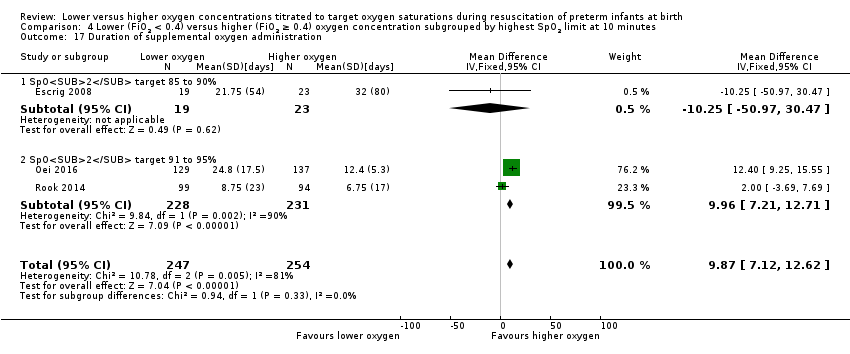
Duration of supplemental oxygen administration (days) (Analysis 4.17)
Subgroup: highest limit of the oxygen saturation target range 85% to 90%: one study reported no significant difference between groups (MD ‐10.25 days, 95% CI ‐50.97 to 30.47; participants = 42) (Escrig 2008).
Subgroup: highest limit of the oxygen saturation target range 91% to 95%: our meta‐analysis showed a longer duration of supplemental oxygen (MD 9.96 days, 95% CI 7.21 to 12.71; participants = 459; studies = 2).
Test for subgroup differences found no significant difference (P = 0.33; I² = 0%).
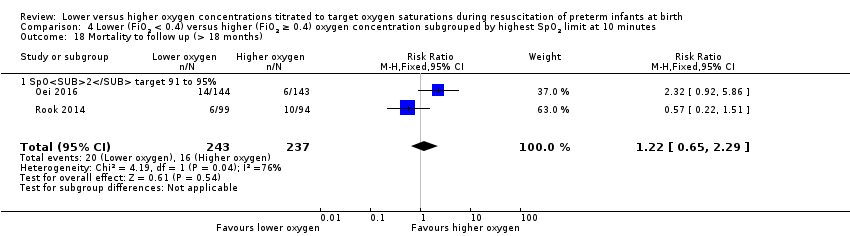
Mortality to follow‐up (> 18 months) (Analysis 4.18)
Subgroup: higher limit of the oxygen saturation target range 91% to 95%: our meta‐analysis showed no significant difference between groups (RR 1.22, 95% CI 0.65 to 2.29; participants = 480; studies = 2). Test for subgroup differences not indicated.
Postnatal growth failure (weight < 10th percentile at discharge)
No study with a prespecified higher oxygen saturation limit reported this outcome.
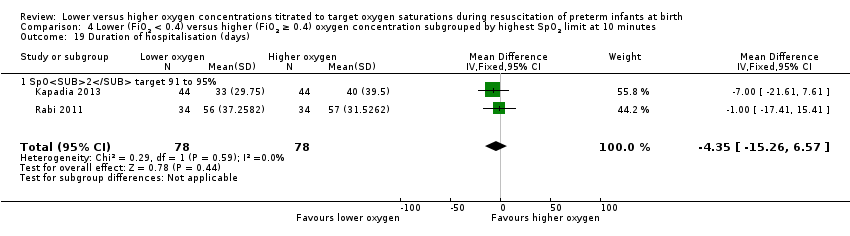
Duration of hospitalisation (days) (Analysis 4.19)
Subgroup: higher limit of the oxygen saturation target range 91% to 95%: our meta‐analysis showed no significant difference between groups (MD ‐4.35, 95% CI ‐15.26 to 6.57; participants = 156; studies = 2; I2 = 0%). Test for subgroup differences not indicated.
Patent ductus arteriosus (not prespecified) (Analysis 4.20)
Subgroup: highest limit of the oxygen saturation target range 85% to 90%: one study reported no significant difference between groups (RR 1.10, 95% CI 0.60 to 2.01; participants = 42) (Escrig 2008).
Subgroup: highest limit of the oxygen saturation target range 91% to 95%: our meta‐analysis showed no significant difference between groups (RR 0.94, 95% CI 0.72 to 1.22; participants = 586; studies = 4).
The test for subgroup differences found no significant difference (P = 0.64; I² = 0%).
Comparison 5. Lower versus higher oxygen concentrations — subgrouped by gestational age
Mortality, near term corrected age or discharge (latest reported) (Analysis 5.1)
Subgroup: gestation ≤ 28 weeks: our meta‐analysis showed no significant difference between groups (RR 1.04, 95% CI 0.68 to 1.61; participants = 516; studies = 8).
Subgroup: gestation > 28 weeks to 32 weeks: our meta‐analysis showed no significant difference between groups (RR 0.50, 95% CI 0.05 to 5.26; participants = 316; studies = 4).
The test for subgroup differences found no significant difference (P = 0.55; I² = 0%).
Neurodevelopmental disability at > 18 months of age (Analysis 5.2)
Subgroup: gestation ≤ 28 weeks: one study reported no significant difference between groups (RR 3.64, 95% CI 0.42 to 31.27; participants = 31) (Aguar 2013). Test for subgroup differences not indicated.
IPPV in the delivery room (Analysis 5.3)
Subgroup: gestation ≤ 28 weeks: our meta‐analysis showed no significant difference between groups (RR 0.96, 95% CI 0.84 to 1.09; participants = 102; studies = 2). Test for subgroup differences not indicated.
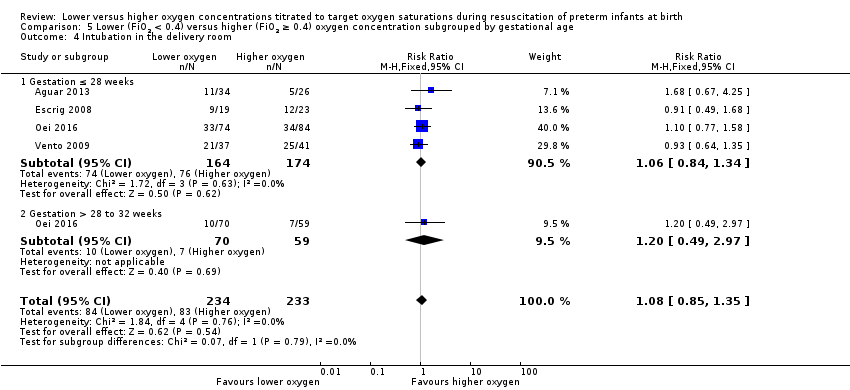
Intubation in the delivery room (Analysis 5.4)
Subgroup: gestation ≤ 28 weeks: our meta‐analysis showed no significant difference between groups (RR 1.06, 95% CI 0.84 to 1.34; participants = 338; studies = 4).
Subgroup: gestation > 28 weeks to 32 weeks: one study reported no significant difference between groups (RR 1.20, 95% CI 0.49 to 2.97; participants = 129) (Oei 2016).
The test for subgroup differences found no significant difference (P = 0.79; I² = 0%).
Time to reach desired oxygen saturation target [minutes] (Analysis 5.5)
Subgroup: gestation ≤ 28 weeks: our meta‐analysis showed no significant difference between groups (MD ‐0.52 minutes, 95% CI ‐1.83 to 0.79; participants = 102; studies = 2). Test for subgroup differences not indicated.
Time to reach heart rate > 100 beats per minute (Analysis 5.6)
Subgroup: gestation ≤ 28 weeks: one study reported no significant difference between groups (MD 0.27 minutes, 95% CI ‐1.21 to 1.75; participants = 60) (Aguar 2013). Test for subgroup differences not indicated.
Retinopathy of prematurity (Analysis 5.7)
Subgroup: gestation ≤ 28 weeks: our meta‐analysis showed no significant difference between groups (RR 0.72, 95% CI 0.38 to 1.33; participants = 259; studies = 4). Test for subgroup differences not indicated.
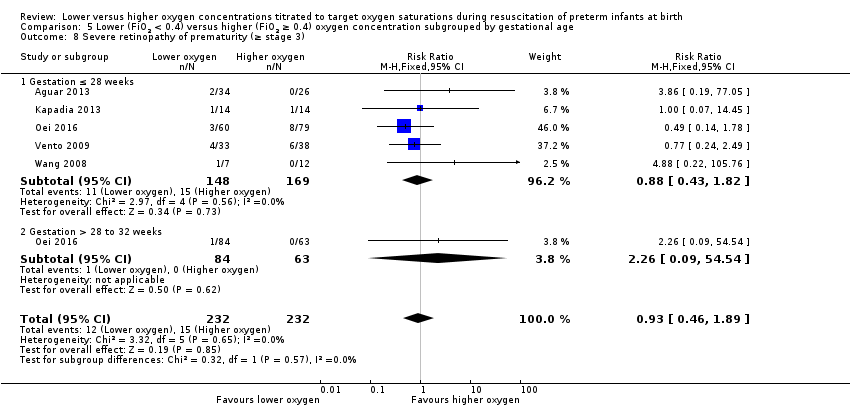
Severe retinopathy of prematurity (≥ stage 3) (Analysis 5.8)
Subgroup: gestation ≤ 28 weeks: our meta‐analysis showed no significant difference between groups (RR 0.88, 95% CI 0.43 to 1.82; participants = 317; studies = 5).
Subgroup: gestation > 28 weeks to 32 weeks: one study reported no significant difference between groups (RR 2.26, 95% CI 0.09 to 54.54; participants = 147) (Oei 2016).
Test for subgroup differences found no significant difference (P = 0.57; I² = 0%).
Intraventricular haemorrhage (any) (Analysis 5.9)
Subgroup: gestation ≤ 28 weeks: our meta‐analysis showed no significant difference between groups (RR 0.87, 95% CI 0.52 to 1.48; participants = 217; studies = 2). Test for subgroup differences not indicated.
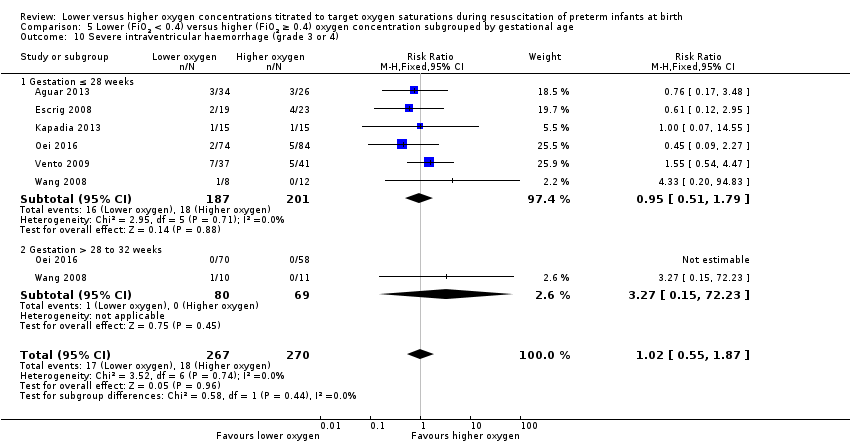
Severe intraventricular haemorrhage (grade 3 or 4) (Analysis 5.10)
Subgroup: gestation ≤ 28 weeks: our meta‐analysis showed no significant difference between groups (RR 0.95, 95% CI 0.51 to 1.79; participants = 388; studies = 6).
Subgroup: gestation > 28 weeks to 32 weeks: our meta‐analysis showed no significant difference between groups (RR 3.27, 95% CI 0.15 to 72.23; participants = 149; studies = 2).
The test for subgroup differences found no significant difference (P = 0.44; I² = 0%).
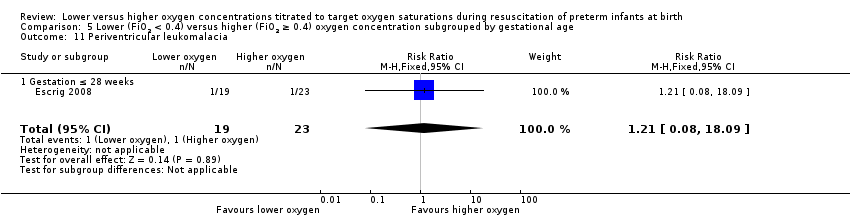
Periventricular leukomalacia (Analysis 5.11)
Subgroup: gestation ≤ 28 weeks: one study reported no significant difference between groups (RR 1.21, 95% CI 0.08 to 18.09; participants = 42) (Escrig 2008). Test for subgroup differences not indicated.
Necrotising enterocolitis (proven) (Analysis 5.12)
Subgroup: gestation ≤ 28 weeks: our meta‐analysis showed no significant difference between groups (RR 1.79, 95% CI 0.80 to 4.01; participants = 483; studies = 7).
Subgroup: gestation > 28 weeks to 32 weeks: our meta‐analysis showed no significant difference between groups (RR 1.02, 95% CI 0.23 to 4.47; participants = 248; studies = 3).
Test for subgroup differences found no significant difference (P = 0.52; I² = 0%).
Chronic lung disease (28 days age) (Analysis 5.13)
Subgroup: gestation ≤ 28 weeks: one study reported no significant difference between groups (RR 1.27, 95% CI 0.53 to 3.05; participants = 60) (Aguar 2013). Test for subgroup differences not indicated.
Chronic lung disease (36 weeks' corrected age) (Analysis 5.14)
Subgroup: gestation ≤ 28 weeks: our meta‐analysis showed no significant difference between groups (RR 0.90, 95% CI 0.72 to 1.13; participants = 411; studies = 8).
Subgroup: gestation > 28 weeks to 32 weeks: our meta‐analysis showed no significant difference between groups (RR 0.92, 95% CI 0.36 to 2.33; participants = 283; studies = 3).
The test for subgroup differences found no significant difference (P = 0.96; I² = 0%).
Duration of respiratory support (mechanical ventilation or CPAP) (days from birth) (Analysis 5.15)
Subgroup: gestation ≤ 28 weeks: one study reported no significant difference between groups (MD 1.06, 95% CI ‐2.63 to 4.75; participants = 60) (Aguar 2013). Test for subgroup differences not indicated.
Duration of respiratory support (mechanical ventilation) (days from birth) (Analysis 5.16)
Subgroup: gestation ≤ 28 weeks: our meta‐analysis showed no significant difference between groups (MD ‐13.64, 95% CI ‐32.62 to 5.33; participants = 120; studies = 2). Test for subgroup differences not indicated.
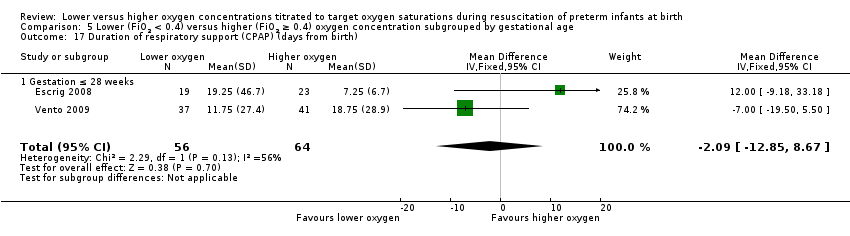
Duration of respiratory support (CPAP) (days from birth) (Analysis 5.17)
Subgroup: gestation ≤ 28 weeks: our meta‐analysis showed no significant difference between groups (MD ‐2.09, 95% CI ‐12.85 to 8.67; participants = 120; studies = 2). Test for subgroup differences not indicated.
Duration of supplemental oxygen administration (days) (Analysis 5.18)
Subgroup: gestation ≤ 28 weeks: our meta‐analysis showed no significant difference between groups (MD ‐0.50 days, 95% CI ‐16.90 to 15.91; participants = 180; studies = 3). Test for subgroup differences not indicated.
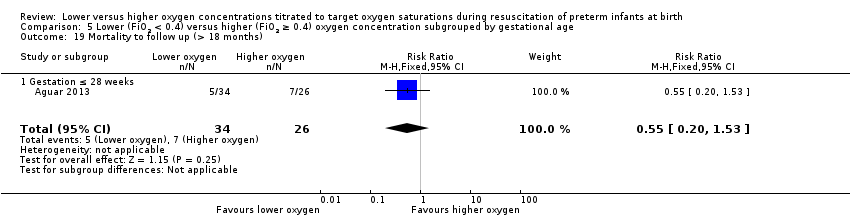
Mortality to follow up (> 18 months) (Analysis 5.19)
Subgroup: gestation ≤ 28 weeks: one study reported no significant difference between groups (RR 0.55, 95% CI 0.20 to 1.53; participants = 60) (Aguar 2013). Test for subgroup differences not indicated.
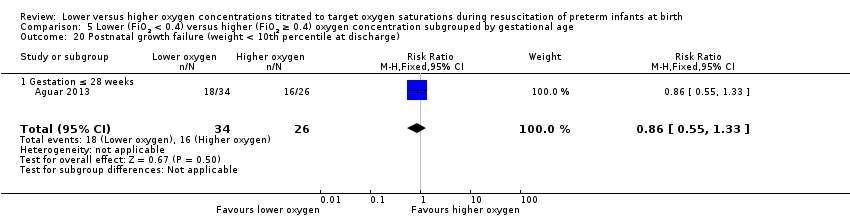
Postnatal growth failure (weight < 10th percentile at discharge) (Analysis 5.20)
Subgroup: gestation ≤ 28 weeks: one study reported no significant difference between groups (RR 0.86, 95% CI 0.55 to 1.33; participants = 60) (Aguar 2013). Test for subgroup differences not indicated.
Duration of hospitalisation (days) (Analysis 5.21)
Subgroup: gestation ≤ 28 weeks: one study reported no significant difference between groups (MD 28.00, 95% CI ‐8.96 to 64.96; participants = 60) (Aguar 2013). Test for subgroup differences not indicated.
Patent ductus arteriosus (not prespecified) (Analysis 5.22)
Subgroup: gestation ≤ 28 weeks: our meta‐analysis showed no significant difference between groups (RR 0.95, 95% CI 0.80 to 1.14; participants = 483; studies = 7).
Subgroup: gestation > 28 weeks to 32 weeks: our meta‐analysis showed no significant difference between groups (RR 1.05, 95% CI 0.54 to 2.05; participants = 227; studies = 2).
The test for subgroup differences found no significant difference (P = 0.78; I² = 0%).
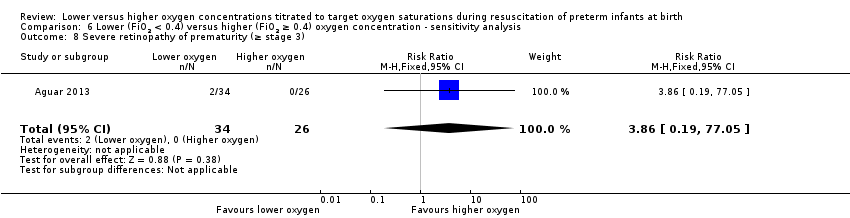
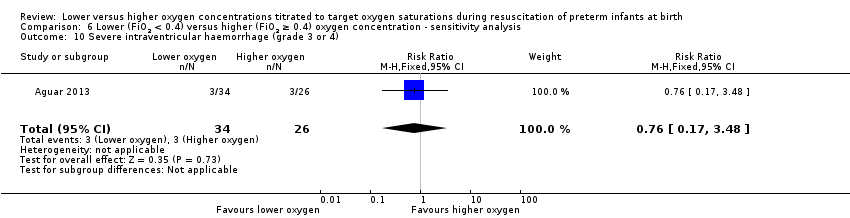
Comparison 6. Lower (FiO2 < 0.4) versus higher (FiO2 ≥ 0.4) oxygen concentration — sensitivity analysis
The following sensitivity analyses report outcomes limited to trials assessed as being at low risk of bias (based on a lack of any of the following: allocation concealment, adequate randomisation, blinding of treatment, less than 10% loss to follow‐up). Two studies were assessed as being at low risk of bias (Aguar 2013; Rook 2014).
Mortality, near term corrected age or discharge (latest reported) (Analysis 6.1)
Our meta‐analysis showed no significant difference between groups (RR 0.51, 95% CI 0.25 to 1.07; participants = 253; studies = 2; I2 = 0%).
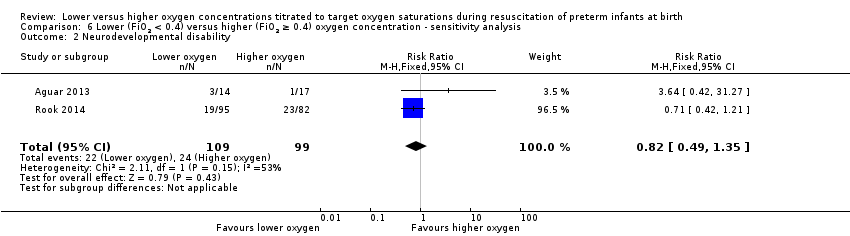
Neurodevelopmental disability at > 18 months of age (Analysis 6.2)
Our meta‐analysis showed no significant difference between groups (RR 0.82, 95% CI 0.49 to 1.35; participants = 208; studies = 2; I2 = 53%).
IPPV in the delivery room (Analysis 6.3)
One study reported no significant difference between groups (RR 1.00, 95% CI 0.94 to 1.07; participants = 60) (Aguar 2013).
Intubation in the delivery room (Analysis 6.4)
Our meta‐analysis showed no significant difference between groups (RR 1.16, 95% CI 0.79 to 1.70; participants = 253; studies = 2; I2 = 0%).
Time to reach desired oxygen saturation target [minutes] (Analysis 6.5)
One study reported no significant difference between groups (MD 2.09 minutes, 95% CI ‐0.26 to 4.44; participants = 60) (Aguar 2013).
Time to reach heart rate > 100 bpm [minutes] (Analysis 6.6)
One study reported no significant difference between groups (MD 0.27 minutes, 95% CI ‐1.21 to 1.75; participants = 60) (Aguar 2013).
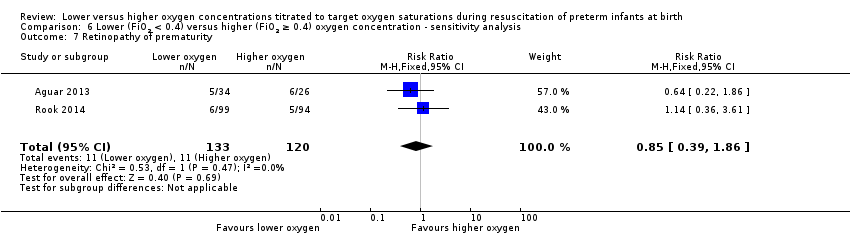
Retinopathy of prematurity (Analysis 6.7)
Our meta‐analysis showed no significant difference between groups (RR 0.85, 95% CI 0.39 to 1.86; participants = 253; studies = 2; I2 = 0%).
Severe retinopathy of prematurity (≥ stage 3) (Analysis 6.8)
One study reported no significant difference between groups (RR 3.86, 95% CI 0.19 to 77.05; participants = 60) (Aguar 2013).
Intraventricular haemorrhage (any) (Analysis 6.9)
Our meta‐analysis showed no significant difference between groups (RR 0.85, 95% CI 0.47 to 1.53; participants = 253; studies = 2; I2 = 0%).
Severe intraventricular haemorrhage (grade 3 or 4) (Analysis 6.10)
One study reported no significant difference between groups (RR 0.76, 95% CI 0.17 to 3.48; participants = 60) (Aguar 2013).
Necrotising enterocolitis (proven) (Analysis 6.11)
Our meta‐analysis showed no significant difference between groups (RR 1.54, 95% CI 0.46 to 5.19; participants = 253; studies = 2; I2 = 0%).
Chronic lung disease (28 days age) (Analysis 6.12)
One study reported no significant difference between groups (RR 1.27, 95% CI 0.53 to 3.05; participants = 60) (Aguar 2013).
Chronic lung disease (36 weeks' corrected age) (Analysis 6.13)
Our meta‐analysis showed no significant difference between groups (RR 1.49, 95% CI 0.90 to 2.47; participants = 243; studies = 2; I2 = 0%).
Duration of respiratory support (mechanical ventilation or CPAP) (days from birth) (Analysis 6.14)
One study (Aguar 2013) reported no significant difference between groups (MD 1.06, 95% CI ‐2.63 to 4.75; participants = 60).
Duration of respiratory support (mechanical ventilation) (days from birth) (Analysis 6.15)
One study reported no significant difference between groups (MD 1.25, 95% CI ‐0.97 to 3.47; participants = 193) (Rook 2014).
Duration of supplemental oxygen administration (days) (Analysis 6.16)
Our meta‐analysis showed no significant difference between groups (MD 2.72 days, 95% CI ‐2.78 to 8.22; participants = 253; studies = 2; I2 = 0%).
Mortality to follow up (> 18 months) (Analysis 6.17)
Our meta‐analysis showed no significant difference between groups (RR 0.56, 95% CI 0.28 to 1.14; participants = 253; studies = 2; I2 = 0%).
Postnatal growth failure (weight < 10th percentile at discharge) (Analysis 6.18)
One study reported no significant difference between groups (RR 0.86, 95% CI 0.55 to 1.33; participants = 60) (Aguar 2013).
Duration of hospitalisation (days) (Analysis 6.19)
One study reported no significant difference between groups (MD 28.00, 95% CI ‐8.96 to 64.96; participants = 60) (Aguar 2013).
Patent ductus arteriosus (not prespecified) (Analysis 6.20)
Our meta‐analysis showed no significant difference between groups (RR 1.18, 95% CI 0.88 to 1.59; participants = 253; studies = 2; I2 = 0%).

Study flow diagram.

'Risk of bias' summary: review authors' judgements about each risk of bias item for each included study.
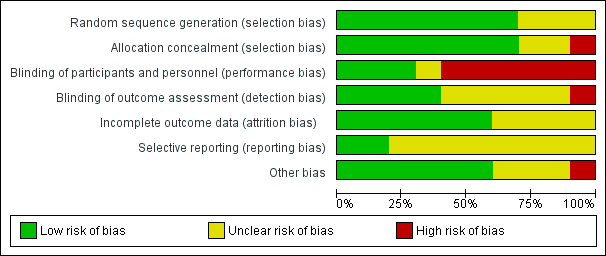
'Risk of bias' graph: review authors' judgements about each risk of bias item presented as percentages across all included studies.

Comparison 1 Lower (FiO2 < 0.4) versus higher (FiO2 ≥ 0.4) oxygen concentration, Outcome 1 Mortality near term corrected age or discharge (latest reported) subgrouped by inspired oxygen concentration.

Comparison 1 Lower (FiO2 < 0.4) versus higher (FiO2 ≥ 0.4) oxygen concentration, Outcome 2 Neurodevelopmental disability.

Comparison 1 Lower (FiO2 < 0.4) versus higher (FiO2 ≥ 0.4) oxygen concentration, Outcome 3 IPPV in the delivery room.

Comparison 1 Lower (FiO2 < 0.4) versus higher (FiO2 ≥ 0.4) oxygen concentration, Outcome 4 Intubation in the delivery room.

Comparison 1 Lower (FiO2 < 0.4) versus higher (FiO2 ≥ 0.4) oxygen concentration, Outcome 5 Time to reach desired oxygen saturation target.

Comparison 1 Lower (FiO2 < 0.4) versus higher (FiO2 ≥ 0.4) oxygen concentration, Outcome 6 Time to reach heart rate > 100 bpm (not prespecified).

Comparison 1 Lower (FiO2 < 0.4) versus higher (FiO2 ≥ 0.4) oxygen concentration, Outcome 7 Retinopathy of prematurity.

Comparison 1 Lower (FiO2 < 0.4) versus higher (FiO2 ≥ 0.4) oxygen concentration, Outcome 8 Severe retinopathy of prematurity (≥ stage 3).
Comparison 1 Lower (FiO2 < 0.4) versus higher (FiO2 ≥ 0.4) oxygen concentration, Outcome 9 Intraventricular haemorrhage.
Comparison 1 Lower (FiO2 < 0.4) versus higher (FiO2 ≥ 0.4) oxygen concentration, Outcome 10 Severe intraventricular haemorrhage (grade 3 or 4).

Comparison 1 Lower (FiO2 < 0.4) versus higher (FiO2 ≥ 0.4) oxygen concentration, Outcome 11 Periventricular leukomalacia.
Comparison 1 Lower (FiO2 < 0.4) versus higher (FiO2 ≥ 0.4) oxygen concentration, Outcome 12 Necrotising enterocolitis.

Comparison 1 Lower (FiO2 < 0.4) versus higher (FiO2 ≥ 0.4) oxygen concentration, Outcome 13 Chronic lung disease (28 days' age).
Comparison 1 Lower (FiO2 < 0.4) versus higher (FiO2 ≥ 0.4) oxygen concentration, Outcome 14 Chronic lung disease (36 weeks' corrected age).

Comparison 1 Lower (FiO2 < 0.4) versus higher (FiO2 ≥ 0.4) oxygen concentration, Outcome 15 Duration of respiratory support (mechanical ventilation or CPAP) (days from birth).

Comparison 1 Lower (FiO2 < 0.4) versus higher (FiO2 ≥ 0.4) oxygen concentration, Outcome 16 Duration of respiratory support (mechanical ventilation) (days from birth).

Comparison 1 Lower (FiO2 < 0.4) versus higher (FiO2 ≥ 0.4) oxygen concentration, Outcome 17 Duration of respiratory support (CPAP) (days from birth).

Comparison 1 Lower (FiO2 < 0.4) versus higher (FiO2 ≥ 0.4) oxygen concentration, Outcome 18 Duration of supplemental oxygen administration.
Comparison 1 Lower (FiO2 < 0.4) versus higher (FiO2 ≥ 0.4) oxygen concentration, Outcome 19 Mortality to follow up (> 18 months).

Comparison 1 Lower (FiO2 < 0.4) versus higher (FiO2 ≥ 0.4) oxygen concentration, Outcome 20 Postnatal growth failure (weight < 10th percentile at discharge).

Comparison 1 Lower (FiO2 < 0.4) versus higher (FiO2 ≥ 0.4) oxygen concentration, Outcome 21 Duration of hospitalisation (days).

Comparison 1 Lower (FiO2 < 0.4) versus higher (FiO2 ≥ 0.4) oxygen concentration, Outcome 22 Patent ductus arteriosus (not prespecified).

Comparison 2 Lower versus higher oxygen concentration subgrouped by FiO2, Outcome 1 Mortality near term corrected age or discharge (latest reported) subgrouped by inspired oxygen concentration.

Comparison 2 Lower versus higher oxygen concentration subgrouped by FiO2, Outcome 2 Neurodevelopmental disability.
Comparison 2 Lower versus higher oxygen concentration subgrouped by FiO2, Outcome 3 IPPV in the delivery room.
Comparison 2 Lower versus higher oxygen concentration subgrouped by FiO2, Outcome 4 Intubation in the delivery room.

Comparison 2 Lower versus higher oxygen concentration subgrouped by FiO2, Outcome 5 Time to reach desired oxygen saturation target.
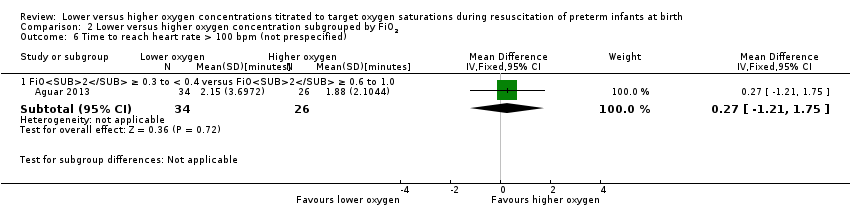
Comparison 2 Lower versus higher oxygen concentration subgrouped by FiO2, Outcome 6 Time to reach heart rate > 100 bpm (not prespecified).

Comparison 2 Lower versus higher oxygen concentration subgrouped by FiO2, Outcome 7 Retinopathy of prematurity.

Comparison 2 Lower versus higher oxygen concentration subgrouped by FiO2, Outcome 8 Severe retinopathy of prematurity (≥ stage 3).

Comparison 2 Lower versus higher oxygen concentration subgrouped by FiO2, Outcome 9 Intraventricular haemorrhage.

Comparison 2 Lower versus higher oxygen concentration subgrouped by FiO2, Outcome 10 Severe intraventricular haemorrhage (grade 3 or 4).

Comparison 2 Lower versus higher oxygen concentration subgrouped by FiO2, Outcome 11 Periventricular leukomalacia.

Comparison 2 Lower versus higher oxygen concentration subgrouped by FiO2, Outcome 12 Necrotising enterocolitis.
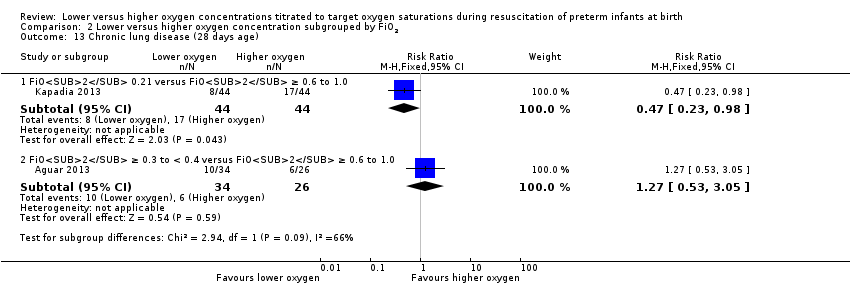
Comparison 2 Lower versus higher oxygen concentration subgrouped by FiO2, Outcome 13 Chronic lung disease (28 days age).
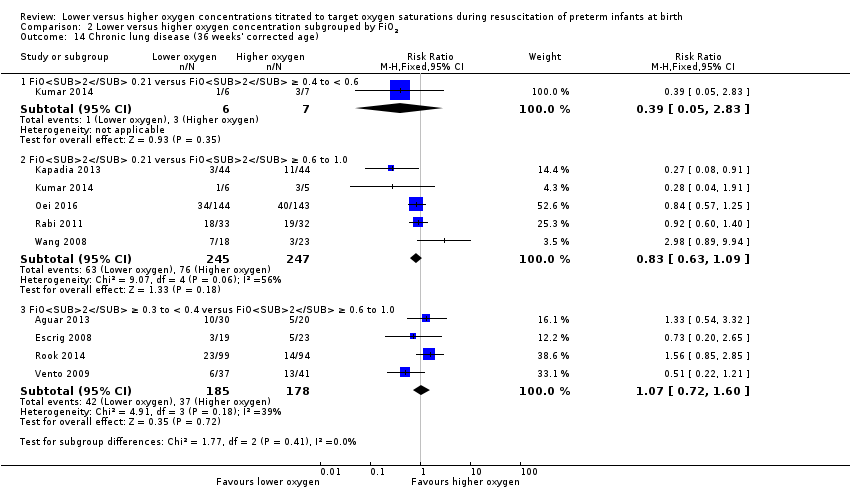
Comparison 2 Lower versus higher oxygen concentration subgrouped by FiO2, Outcome 14 Chronic lung disease (36 weeks' corrected age).
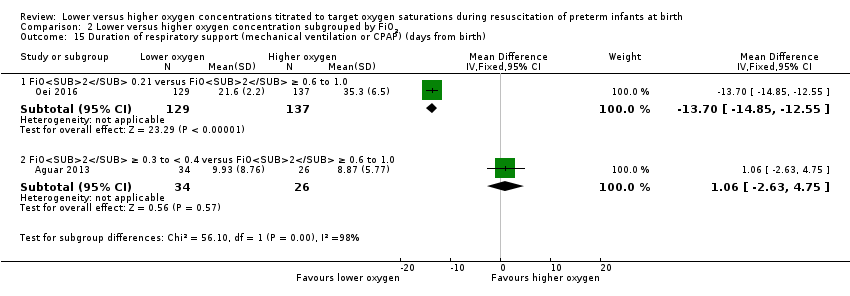
Comparison 2 Lower versus higher oxygen concentration subgrouped by FiO2, Outcome 15 Duration of respiratory support (mechanical ventilation or CPAP) (days from birth).
Comparison 2 Lower versus higher oxygen concentration subgrouped by FiO2, Outcome 16 Duration of respiratory support (mechanical ventilation) (days from birth).
Comparison 2 Lower versus higher oxygen concentration subgrouped by FiO2, Outcome 17 Duration of respiratory support (CPAP) (days from birth).

Comparison 2 Lower versus higher oxygen concentration subgrouped by FiO2, Outcome 18 Duration of supplemental oxygen administration.

Comparison 2 Lower versus higher oxygen concentration subgrouped by FiO2, Outcome 19 Mortality to follow up (> 18 months).

Comparison 2 Lower versus higher oxygen concentration subgrouped by FiO2, Outcome 20 Postnatal growth failure (weight < 10th percentile at discharge).

Comparison 2 Lower versus higher oxygen concentration subgrouped by FiO2, Outcome 21 Duration of hospitalisation (days).
Comparison 2 Lower versus higher oxygen concentration subgrouped by FiO2, Outcome 22 Patent ductus arteriosus (not prespecified).

Comparison 3 Lower (FiO2 < 0.4) versus higher (FiO2 ≥ 0.4) oxygen concentration subgrouped by lower limit of oxygen saturation range at 5 to 10 mintues, Outcome 1 Mortality near term corrected age or discharge (latest reported).

Comparison 3 Lower (FiO2 < 0.4) versus higher (FiO2 ≥ 0.4) oxygen concentration subgrouped by lower limit of oxygen saturation range at 5 to 10 mintues, Outcome 2 Neurodevelopmental disability.
Comparison 3 Lower (FiO2 < 0.4) versus higher (FiO2 ≥ 0.4) oxygen concentration subgrouped by lower limit of oxygen saturation range at 5 to 10 mintues, Outcome 3 IPPV in the delivery room.
Comparison 3 Lower (FiO2 < 0.4) versus higher (FiO2 ≥ 0.4) oxygen concentration subgrouped by lower limit of oxygen saturation range at 5 to 10 mintues, Outcome 4 Intubation in the delivery room.
Comparison 3 Lower (FiO2 < 0.4) versus higher (FiO2 ≥ 0.4) oxygen concentration subgrouped by lower limit of oxygen saturation range at 5 to 10 mintues, Outcome 5 Time to reach desired oxygen saturation target.
Comparison 3 Lower (FiO2 < 0.4) versus higher (FiO2 ≥ 0.4) oxygen concentration subgrouped by lower limit of oxygen saturation range at 5 to 10 mintues, Outcome 6 Time to reach heart rate > 100 bpm (not prespecified).

Comparison 3 Lower (FiO2 < 0.4) versus higher (FiO2 ≥ 0.4) oxygen concentration subgrouped by lower limit of oxygen saturation range at 5 to 10 mintues, Outcome 7 Retinopathy of prematurity.

Comparison 3 Lower (FiO2 < 0.4) versus higher (FiO2 ≥ 0.4) oxygen concentration subgrouped by lower limit of oxygen saturation range at 5 to 10 mintues, Outcome 8 Severe retinopathy of prematurity (≥ stage 3).

Comparison 3 Lower (FiO2 < 0.4) versus higher (FiO2 ≥ 0.4) oxygen concentration subgrouped by lower limit of oxygen saturation range at 5 to 10 mintues, Outcome 9 Intraventricular haemorrhage.
Comparison 3 Lower (FiO2 < 0.4) versus higher (FiO2 ≥ 0.4) oxygen concentration subgrouped by lower limit of oxygen saturation range at 5 to 10 mintues, Outcome 10 Severe intraventricular haemorrhage (grade 3 or 4).
Comparison 3 Lower (FiO2 < 0.4) versus higher (FiO2 ≥ 0.4) oxygen concentration subgrouped by lower limit of oxygen saturation range at 5 to 10 mintues, Outcome 11 Periventricular leukomalacia.

Comparison 3 Lower (FiO2 < 0.4) versus higher (FiO2 ≥ 0.4) oxygen concentration subgrouped by lower limit of oxygen saturation range at 5 to 10 mintues, Outcome 12 Necrotising enterocolitis.

Comparison 3 Lower (FiO2 < 0.4) versus higher (FiO2 ≥ 0.4) oxygen concentration subgrouped by lower limit of oxygen saturation range at 5 to 10 mintues, Outcome 13 Chronic lung disease (28 days' age).

Comparison 3 Lower (FiO2 < 0.4) versus higher (FiO2 ≥ 0.4) oxygen concentration subgrouped by lower limit of oxygen saturation range at 5 to 10 mintues, Outcome 14 Chronic lung disease (36 weeks' corrected age).

Comparison 3 Lower (FiO2 < 0.4) versus higher (FiO2 ≥ 0.4) oxygen concentration subgrouped by lower limit of oxygen saturation range at 5 to 10 mintues, Outcome 15 Duration of respiratory support (mechanical ventilation or CPAP) (days from birth).

Comparison 3 Lower (FiO2 < 0.4) versus higher (FiO2 ≥ 0.4) oxygen concentration subgrouped by lower limit of oxygen saturation range at 5 to 10 mintues, Outcome 16 Duration of respiratory support (mechanical ventilation) (days from birth).
Comparison 3 Lower (FiO2 < 0.4) versus higher (FiO2 ≥ 0.4) oxygen concentration subgrouped by lower limit of oxygen saturation range at 5 to 10 mintues, Outcome 17 Duration of respiratory support (CPAP) (days from birth).

Comparison 3 Lower (FiO2 < 0.4) versus higher (FiO2 ≥ 0.4) oxygen concentration subgrouped by lower limit of oxygen saturation range at 5 to 10 mintues, Outcome 18 Duration of supplemental oxygen administration.

Comparison 3 Lower (FiO2 < 0.4) versus higher (FiO2 ≥ 0.4) oxygen concentration subgrouped by lower limit of oxygen saturation range at 5 to 10 mintues, Outcome 19 Mortality to follow up (> 18 months).

Comparison 3 Lower (FiO2 < 0.4) versus higher (FiO2 ≥ 0.4) oxygen concentration subgrouped by lower limit of oxygen saturation range at 5 to 10 mintues, Outcome 20 Postnatal growth failure (weight < 10th percentile at discharge).

Comparison 3 Lower (FiO2 < 0.4) versus higher (FiO2 ≥ 0.4) oxygen concentration subgrouped by lower limit of oxygen saturation range at 5 to 10 mintues, Outcome 21 Duration of hospitalisation (days).
Comparison 3 Lower (FiO2 < 0.4) versus higher (FiO2 ≥ 0.4) oxygen concentration subgrouped by lower limit of oxygen saturation range at 5 to 10 mintues, Outcome 22 Patent ductus arteriosus (not prespecified).

Comparison 4 Lower (FiO2 < 0.4) versus higher (FiO2 ≥ 0.4) oxygen concentration subgrouped by highest SpO2 limit at 10 minutes, Outcome 1 Mortality near term corrected age or discharge (latest reported).

Comparison 4 Lower (FiO2 < 0.4) versus higher (FiO2 ≥ 0.4) oxygen concentration subgrouped by highest SpO2 limit at 10 minutes, Outcome 2 Neurodevelopmental disability.

Comparison 4 Lower (FiO2 < 0.4) versus higher (FiO2 ≥ 0.4) oxygen concentration subgrouped by highest SpO2 limit at 10 minutes, Outcome 3 IPPV in the delivery room.
Comparison 4 Lower (FiO2 < 0.4) versus higher (FiO2 ≥ 0.4) oxygen concentration subgrouped by highest SpO2 limit at 10 minutes, Outcome 4 Intubation in the delivery room.
Comparison 4 Lower (FiO2 < 0.4) versus higher (FiO2 ≥ 0.4) oxygen concentration subgrouped by highest SpO2 limit at 10 minutes, Outcome 5 Time to reach desired oxygen saturation target.

Comparison 4 Lower (FiO2 < 0.4) versus higher (FiO2 ≥ 0.4) oxygen concentration subgrouped by highest SpO2 limit at 10 minutes, Outcome 6 Retinopathy of prematurity.

Comparison 4 Lower (FiO2 < 0.4) versus higher (FiO2 ≥ 0.4) oxygen concentration subgrouped by highest SpO2 limit at 10 minutes, Outcome 7 Severe retinopathy of prematurity (≥ stage 3).

Comparison 4 Lower (FiO2 < 0.4) versus higher (FiO2 ≥ 0.4) oxygen concentration subgrouped by highest SpO2 limit at 10 minutes, Outcome 8 Intraventricular haemorrhage.
Comparison 4 Lower (FiO2 < 0.4) versus higher (FiO2 ≥ 0.4) oxygen concentration subgrouped by highest SpO2 limit at 10 minutes, Outcome 9 Severe intraventricular haemorrhage (grade 3 or 4).

Comparison 4 Lower (FiO2 < 0.4) versus higher (FiO2 ≥ 0.4) oxygen concentration subgrouped by highest SpO2 limit at 10 minutes, Outcome 10 Periventricular leukomalacia.

Comparison 4 Lower (FiO2 < 0.4) versus higher (FiO2 ≥ 0.4) oxygen concentration subgrouped by highest SpO2 limit at 10 minutes, Outcome 11 Necrotising enterocolitis.

Comparison 4 Lower (FiO2 < 0.4) versus higher (FiO2 ≥ 0.4) oxygen concentration subgrouped by highest SpO2 limit at 10 minutes, Outcome 12 Chronic lung disease (28 days age).

Comparison 4 Lower (FiO2 < 0.4) versus higher (FiO2 ≥ 0.4) oxygen concentration subgrouped by highest SpO2 limit at 10 minutes, Outcome 13 Chronic lung disease (36 weeks' corrected age).

Comparison 4 Lower (FiO2 < 0.4) versus higher (FiO2 ≥ 0.4) oxygen concentration subgrouped by highest SpO2 limit at 10 minutes, Outcome 14 Duration of respiratory support (mechanical ventilation or CPAP) (days from birth).
Comparison 4 Lower (FiO2 < 0.4) versus higher (FiO2 ≥ 0.4) oxygen concentration subgrouped by highest SpO2 limit at 10 minutes, Outcome 15 Duration of respiratory support (mechanical ventilation) (days from birth).
Comparison 4 Lower (FiO2 < 0.4) versus higher (FiO2 ≥ 0.4) oxygen concentration subgrouped by highest SpO2 limit at 10 minutes, Outcome 16 Duration of respiratory support (CPAP) (days from birth).
Comparison 4 Lower (FiO2 < 0.4) versus higher (FiO2 ≥ 0.4) oxygen concentration subgrouped by highest SpO2 limit at 10 minutes, Outcome 17 Duration of supplemental oxygen administration.
Comparison 4 Lower (FiO2 < 0.4) versus higher (FiO2 ≥ 0.4) oxygen concentration subgrouped by highest SpO2 limit at 10 minutes, Outcome 18 Mortality to follow up (> 18 months).
Comparison 4 Lower (FiO2 < 0.4) versus higher (FiO2 ≥ 0.4) oxygen concentration subgrouped by highest SpO2 limit at 10 minutes, Outcome 19 Duration of hospitalisation (days).

Comparison 4 Lower (FiO2 < 0.4) versus higher (FiO2 ≥ 0.4) oxygen concentration subgrouped by highest SpO2 limit at 10 minutes, Outcome 20 Patent ductus arteriosus (not prespecified).

Comparison 5 Lower (FiO2 < 0.4) versus higher (FiO2 ≥ 0.4) oxygen concentration subgrouped by gestational age, Outcome 1 Mortality near term corrected age or discharge (latest reported).

Comparison 5 Lower (FiO2 < 0.4) versus higher (FiO2 ≥ 0.4) oxygen concentration subgrouped by gestational age, Outcome 2 Neurodevelopmental disability.

Comparison 5 Lower (FiO2 < 0.4) versus higher (FiO2 ≥ 0.4) oxygen concentration subgrouped by gestational age, Outcome 3 IPPV in the delivery room.
Comparison 5 Lower (FiO2 < 0.4) versus higher (FiO2 ≥ 0.4) oxygen concentration subgrouped by gestational age, Outcome 4 Intubation in the delivery room.

Comparison 5 Lower (FiO2 < 0.4) versus higher (FiO2 ≥ 0.4) oxygen concentration subgrouped by gestational age, Outcome 5 Time to reach desired oxygen saturation target.

Comparison 5 Lower (FiO2 < 0.4) versus higher (FiO2 ≥ 0.4) oxygen concentration subgrouped by gestational age, Outcome 6 Time to reach heart rate > 100 bpm.

Comparison 5 Lower (FiO2 < 0.4) versus higher (FiO2 ≥ 0.4) oxygen concentration subgrouped by gestational age, Outcome 7 Retinopathy of prematurity.
Comparison 5 Lower (FiO2 < 0.4) versus higher (FiO2 ≥ 0.4) oxygen concentration subgrouped by gestational age, Outcome 8 Severe retinopathy of prematurity (≥ stage 3).

Comparison 5 Lower (FiO2 < 0.4) versus higher (FiO2 ≥ 0.4) oxygen concentration subgrouped by gestational age, Outcome 9 Intraventricular haemorrhage.
Comparison 5 Lower (FiO2 < 0.4) versus higher (FiO2 ≥ 0.4) oxygen concentration subgrouped by gestational age, Outcome 10 Severe intraventricular haemorrhage (grade 3 or 4).
Comparison 5 Lower (FiO2 < 0.4) versus higher (FiO2 ≥ 0.4) oxygen concentration subgrouped by gestational age, Outcome 11 Periventricular leukomalacia.

Comparison 5 Lower (FiO2 < 0.4) versus higher (FiO2 ≥ 0.4) oxygen concentration subgrouped by gestational age, Outcome 12 Necrotising enterocolitis.

Comparison 5 Lower (FiO2 < 0.4) versus higher (FiO2 ≥ 0.4) oxygen concentration subgrouped by gestational age, Outcome 13 Chronic lung disease (28 days age).

Comparison 5 Lower (FiO2 < 0.4) versus higher (FiO2 ≥ 0.4) oxygen concentration subgrouped by gestational age, Outcome 14 Chronic lung disease (36 weeks' corrected age).

Comparison 5 Lower (FiO2 < 0.4) versus higher (FiO2 ≥ 0.4) oxygen concentration subgrouped by gestational age, Outcome 15 Duration of respiratory support (mechanical ventilation or CPAP) (days from birth).

Comparison 5 Lower (FiO2 < 0.4) versus higher (FiO2 ≥ 0.4) oxygen concentration subgrouped by gestational age, Outcome 16 Duration of respiratory support (mechanical ventilation) (days from birth).
Comparison 5 Lower (FiO2 < 0.4) versus higher (FiO2 ≥ 0.4) oxygen concentration subgrouped by gestational age, Outcome 17 Duration of respiratory support (CPAP) (days from birth).

Comparison 5 Lower (FiO2 < 0.4) versus higher (FiO2 ≥ 0.4) oxygen concentration subgrouped by gestational age, Outcome 18 Duration of supplemental oxygen administration.
Comparison 5 Lower (FiO2 < 0.4) versus higher (FiO2 ≥ 0.4) oxygen concentration subgrouped by gestational age, Outcome 19 Mortality to follow up (> 18 months).
Comparison 5 Lower (FiO2 < 0.4) versus higher (FiO2 ≥ 0.4) oxygen concentration subgrouped by gestational age, Outcome 20 Postnatal growth failure (weight < 10th percentile at discharge).

Comparison 5 Lower (FiO2 < 0.4) versus higher (FiO2 ≥ 0.4) oxygen concentration subgrouped by gestational age, Outcome 21 Duration of hospitalisation (days).

Comparison 5 Lower (FiO2 < 0.4) versus higher (FiO2 ≥ 0.4) oxygen concentration subgrouped by gestational age, Outcome 22 Patent ductus arteriosus (not prespecified).

Comparison 6 Lower (FiO2 < 0.4) versus higher (FiO2 ≥ 0.4) oxygen concentration ‐ sensitivity analysis, Outcome 1 Mortality near term corrected age or discharge (latest reported).
Comparison 6 Lower (FiO2 < 0.4) versus higher (FiO2 ≥ 0.4) oxygen concentration ‐ sensitivity analysis, Outcome 2 Neurodevelopmental disability.

Comparison 6 Lower (FiO2 < 0.4) versus higher (FiO2 ≥ 0.4) oxygen concentration ‐ sensitivity analysis, Outcome 3 IPPV in the delivery room.

Comparison 6 Lower (FiO2 < 0.4) versus higher (FiO2 ≥ 0.4) oxygen concentration ‐ sensitivity analysis, Outcome 4 Intubation in the delivery room.

Comparison 6 Lower (FiO2 < 0.4) versus higher (FiO2 ≥ 0.4) oxygen concentration ‐ sensitivity analysis, Outcome 5 Time to reach desired oxygen saturation target.

Comparison 6 Lower (FiO2 < 0.4) versus higher (FiO2 ≥ 0.4) oxygen concentration ‐ sensitivity analysis, Outcome 6 Time to reach heart rate > 100 bpm (not prespecified).
Comparison 6 Lower (FiO2 < 0.4) versus higher (FiO2 ≥ 0.4) oxygen concentration ‐ sensitivity analysis, Outcome 7 Retinopathy of prematurity.
Comparison 6 Lower (FiO2 < 0.4) versus higher (FiO2 ≥ 0.4) oxygen concentration ‐ sensitivity analysis, Outcome 8 Severe retinopathy of prematurity (≥ stage 3).

Comparison 6 Lower (FiO2 < 0.4) versus higher (FiO2 ≥ 0.4) oxygen concentration ‐ sensitivity analysis, Outcome 9 Intraventricular haemorrhage.
Comparison 6 Lower (FiO2 < 0.4) versus higher (FiO2 ≥ 0.4) oxygen concentration ‐ sensitivity analysis, Outcome 10 Severe intraventricular haemorrhage (grade 3 or 4).

Comparison 6 Lower (FiO2 < 0.4) versus higher (FiO2 ≥ 0.4) oxygen concentration ‐ sensitivity analysis, Outcome 11 Necrotising enterocolitis.

Comparison 6 Lower (FiO2 < 0.4) versus higher (FiO2 ≥ 0.4) oxygen concentration ‐ sensitivity analysis, Outcome 12 Chronic lung disease (28 days age).

Comparison 6 Lower (FiO2 < 0.4) versus higher (FiO2 ≥ 0.4) oxygen concentration ‐ sensitivity analysis, Outcome 13 Chronic lung disease (36 weeks' corrected age).

Comparison 6 Lower (FiO2 < 0.4) versus higher (FiO2 ≥ 0.4) oxygen concentration ‐ sensitivity analysis, Outcome 14 Duration of respiratory support (mechanical ventilation or CPAP) (days from birth).

Comparison 6 Lower (FiO2 < 0.4) versus higher (FiO2 ≥ 0.4) oxygen concentration ‐ sensitivity analysis, Outcome 15 Duration of respiratory support (mechanical ventilation) (days from birth).

Comparison 6 Lower (FiO2 < 0.4) versus higher (FiO2 ≥ 0.4) oxygen concentration ‐ sensitivity analysis, Outcome 16 Duration of supplemental oxygen administration.

Comparison 6 Lower (FiO2 < 0.4) versus higher (FiO2 ≥ 0.4) oxygen concentration ‐ sensitivity analysis, Outcome 17 Mortality to follow up (> 18 months).

Comparison 6 Lower (FiO2 < 0.4) versus higher (FiO2 ≥ 0.4) oxygen concentration ‐ sensitivity analysis, Outcome 18 Postnatal growth failure (weight < 10th percentile at discharge).

Comparison 6 Lower (FiO2 < 0.4) versus higher (FiO2 ≥ 0.4) oxygen concentration ‐ sensitivity analysis, Outcome 19 Duration of hospitalisation (days).

Comparison 6 Lower (FiO2 < 0.4) versus higher (FiO2 ≥ 0.4) oxygen concentration ‐ sensitivity analysis, Outcome 20 Patent ductus arteriosus (not prespecified).
| Lower (FiO2 < 0.4) versus higher (FiO2 ≥ 0.4) oxygen concentrations titrated to oxygen saturations during resuscitation of preterm infants at birth | ||||||
| Patient or population: preterm infants | ||||||
| Outcomes | Illustrative comparative risks* (95% CI) | Relative effect | No of Participants | Quality of the evidence | Comments | |
| Assumed risk | Corresponding risk | |||||
| Control | Lower (FiO2 < 0.4) versus higher (FiO2 ≥ 0.4) oxygen concentration | |||||
| Mortality, near term corrected age or discharge | Study population | RR 1.05 | 914 | ⊕⊕⊝⊝ | Subgroup analyses: single study targeting lowest SpO2 < 85% reported increased mortality for infants resuscitated with air compared to 100% oxygen (Oei 2016). Meta‐analysis of 9 studies (627 infants) targeting lowest SpO2 85% to 90% found no difference in mortality. No subgroup differences according to inspired oxygen concentration strata, highest SpO2 limit, or gestational age. Quality of evidence downgraded due to risk of bias and imprecision. | |
| 76 per 1000 | 80 per 1000 | |||||
| Moderate | ||||||
| 68 per 1000 | 71 per 1000 | |||||
| Neurodevelopmental disability | Study population | RR 0.82 | 208 | ⊕⊕⊝⊝ | Subgroup analyses: both studies compared FiO2 ≥ 0.3 to < 0.4 versus FiO2 ≥ 0.6 to 1.0 and had a lowest SpO2 target 85 to 90%. Quality of evidence downgraded due to inconsistency and imprecision. | |
| 242 per 1000 | 199 per 1000 | |||||
| Moderate | ||||||
| 170 per 1000 | 139 per 1000 | |||||
| Intubation in the delivery room | Study population | RR 0.98 | 875 | ⊕⊕⊝⊝ | Subgroup analyses: no subgroup differences according to inspired oxygen concentration strata, lowest or highest SpO2 target, or gestational age. Quality of evidence downgraded due to risk of bias and imprecision. | |
| 352 per 1000 | 345 per 1000 | |||||
| Moderate | ||||||
| 386 per 1000 | 378 per 1000 | |||||
| Severe retinopathy of prematurity (≥ stage 3) | Study population | RR 0.57 | 453 | ⊕⊕⊝⊝ | Subgroup analyses: no subgroup differences according to inspired oxygen concentration strata, lowest SpO2 target, or gestational age. Quality of evidence downgraded due to risk of bias and imprecision. | |
| 58 per 1000 | 33 per 1000 | |||||
| Moderate | ||||||
| 70 per 1000 | 40 per 1000 | |||||
| Severe intraventricular haemorrhage (grade 3 or 4) | Study population | RR 0.93 | 596 | ⊕⊕⊝⊝ | Subgroup analyses: no subgroup differences according to inspired oxygen concentration strata, lowest or highest SpO2 target, or gestational age. Quality of evidence downgraded due to risk of bias and imprecision. | |
| 63 per 1000 | 59 per 1000 | |||||
| Moderate | ||||||
| 79 per 1000 | 73 per 1000 | |||||
| Necrotising enterocolitis | Study population | RR 0.98 | 807 | ⊕⊕⊝⊝ | Subgroup analyses: no subgroup differences according to inspired oxygen concentration strata, lowest or highest SpO2 target, or gestational age. Quality of evidence downgraded due to risk of bias and imprecision. | |
| 47 per 1000 | 46 per 1000 | |||||
| Moderate | ||||||
| 41 per 1000 | 40 per 1000 | |||||
| Chronic lung disease (36 weeks' corrected age) | Study population | RR 0.91 | 862 | ⊕⊝⊝⊝ | Subgroup analyses: no subgroup differences according to inspired oxygen concentration strata, lowest or highest SpO2 target, or gestational age. Quality of evidence downgraded due to risk of bias, inconsistency and imprecision. | |
| 269 per 1000 | 244 per 1000 | |||||
| Moderate | ||||||
| 250 per 1000 | 228 per 1000 | |||||
| *The basis for the assumed risk (e.g. the median control group risk across studies) is provided in footnotes. The corresponding risk (and its 95% confidence interval) is based on the assumed risk in the comparison group and the relative effect of the intervention (and its 95% CI). | ||||||
| GRADE Working Group grades of evidence | ||||||
| 1 Two studies at low risk of bias. | ||||||
| Outcome or subgroup title | No. of studies | No. of participants | Statistical method | Effect size |
| 1 Mortality near term corrected age or discharge (latest reported) subgrouped by inspired oxygen concentration Show forest plot | 10 | 914 | Risk Ratio (M‐H, Fixed, 95% CI) | 1.05 [0.68, 1.63] |
| 2 Neurodevelopmental disability Show forest plot | 2 | 208 | Risk Ratio (M‐H, Fixed, 95% CI) | 0.82 [0.49, 1.35] |
| 3 IPPV in the delivery room Show forest plot | 5 | 249 | Risk Ratio (M‐H, Fixed, 95% CI) | 0.94 [0.83, 1.06] |
| 4 Intubation in the delivery room Show forest plot | 9 | 875 | Risk Ratio (M‐H, Fixed, 95% CI) | 0.98 [0.82, 1.18] |
| 5 Time to reach desired oxygen saturation target Show forest plot | 2 | 102 | Mean Difference (IV, Fixed, 95% CI) | ‐0.52 [‐1.83, 0.79] |
| 6 Time to reach heart rate > 100 bpm (not prespecified) Show forest plot | 1 | 60 | Mean Difference (IV, Fixed, 95% CI) | 0.27 [‐1.21, 1.75] |
| 7 Retinopathy of prematurity Show forest plot | 4 | 373 | Risk Ratio (M‐H, Fixed, 95% CI) | 0.80 [0.43, 1.49] |
| 8 Severe retinopathy of prematurity (≥ stage 3) Show forest plot | 4 | 453 | Risk Ratio (M‐H, Fixed, 95% CI) | 0.57 [0.24, 1.36] |
| 9 Intraventricular haemorrhage Show forest plot | 3 | 271 | Risk Ratio (M‐H, Fixed, 95% CI) | 0.81 [0.46, 1.44] |
| 10 Severe intraventricular haemorrhage (grade 3 or 4) Show forest plot | 6 | 596 | Risk Ratio (M‐H, Fixed, 95% CI) | 0.93 [0.51, 1.71] |
| 11 Periventricular leukomalacia Show forest plot | 2 | 130 | Risk Ratio (M‐H, Fixed, 95% CI) | 0.66 [0.09, 4.73] |
| 12 Necrotising enterocolitis Show forest plot | 8 | 807 | Risk Ratio (M‐H, Fixed, 95% CI) | 0.98 [0.51, 1.87] |
| 13 Chronic lung disease (28 days' age) Show forest plot | 2 | 148 | Risk Ratio (M‐H, Fixed, 95% CI) | 0.70 [0.41, 1.21] |
| 14 Chronic lung disease (36 weeks' corrected age) Show forest plot | 9 | 862 | Risk Ratio (M‐H, Fixed, 95% CI) | 0.91 [0.72, 1.14] |
| 15 Duration of respiratory support (mechanical ventilation or CPAP) (days from birth) Show forest plot | 2 | 326 | Mean Difference (IV, Fixed, 95% CI) | ‐12.39 [‐13.49, ‐11.29] |
| 16 Duration of respiratory support (mechanical ventilation) (days from birth) Show forest plot | 6 | 510 | Mean Difference (IV, Fixed, 95% CI) | 0.61 [‐1.33, 2.54] |
| 17 Duration of respiratory support (CPAP) (days from birth) Show forest plot | 4 | 249 | Mean Difference (IV, Fixed, 95% CI) | ‐1.60 [‐5.39, 2.19] |
| 18 Duration of supplemental oxygen administration Show forest plot | 5 | 639 | Mean Difference (IV, Fixed, 95% CI) | 9.23 [6.52, 11.95] |
| 19 Mortality to follow up (> 18 months) Show forest plot | 3 | 540 | Risk Ratio (M‐H, Fixed, 95% CI) | 1.00 [0.59, 1.70] |
| 20 Postnatal growth failure (weight < 10th percentile at discharge) Show forest plot | 1 | 60 | Risk Ratio (M‐H, Fixed, 95% CI) | 0.86 [0.55, 1.33] |
| 21 Duration of hospitalisation (days) Show forest plot | 3 | 216 | Mean Difference (IV, Fixed, 95% CI) | ‐1.75 [‐12.22, 8.71] |
| 22 Patent ductus arteriosus (not prespecified) Show forest plot | 7 | 766 | Risk Ratio (M‐H, Fixed, 95% CI) | 0.93 [0.77, 1.14] |
| Outcome or subgroup title | No. of studies | No. of participants | Statistical method | Effect size |
| 1 Mortality near term corrected age or discharge (latest reported) subgrouped by inspired oxygen concentration Show forest plot | 10 | Risk Ratio (M‐H, Fixed, 95% CI) | Subtotals only | |
| 1.1 FiO2 0.21 versus FiO2 ≥ 0.4 to < 0.6 | 1 | 13 | Risk Ratio (M‐H, Fixed, 95% CI) | 1.17 [0.09, 14.92] |
| 1.2 FiO2 0.21 versus FiO2 ≥ 0.6 to 1.0 | 5 | 495 | Risk Ratio (M‐H, Fixed, 95% CI) | 1.70 [0.84, 3.46] |
| 1.3 FiO2 ≥ 0.3 to < 0.4 versus FiO2 ≥ 0.6 to 1.0 | 5 | 412 | Risk Ratio (M‐H, Fixed, 95% CI) | 0.75 [0.42, 1.32] |
| 2 Neurodevelopmental disability Show forest plot | 2 | Risk Ratio (M‐H, Fixed, 95% CI) | Subtotals only | |
| 2.2 FiO2 ≥ 0.3 to < 0.4 versus FiO2 ≥ 0.6 to 1.0 | 2 | 208 | Risk Ratio (M‐H, Fixed, 95% CI) | 0.82 [0.49, 1.35] |
| 3 IPPV in the delivery room Show forest plot | 5 | Risk Ratio (M‐H, Fixed, 95% CI) | Subtotals only | |
| 3.1 FiO2 0.21 versus FiO2 ≥ 0.4 to < 0.6 | 1 | 13 | Risk Ratio (M‐H, Fixed, 95% CI) | 0.7 [0.28, 1.77] |
| 3.2 FiO2 0.21 versus FiO2 ≥ 0.6 to 1.0 | 3 | 140 | Risk Ratio (M‐H, Fixed, 95% CI) | 0.93 [0.77, 1.12] |
| 3.3 FiO2 ≥ 0.3 to < 0.4 versus FiO2 ≥ 0.6 to 1.0 | 2 | 102 | Risk Ratio (M‐H, Fixed, 95% CI) | 0.96 [0.84, 1.09] |
| 4 Intubation in the delivery room Show forest plot | 9 | Risk Ratio (M‐H, Fixed, 95% CI) | Subtotals only | |
| 4.1 FiO2 0.21 versus FiO2 ≥ 0.4 to < 0.6 | 1 | 13 | Risk Ratio (M‐H, Fixed, 95% CI) | 0.58 [0.16, 2.14] |
| 4.2 FiO2 0.21 versus FiO2 ≥ 0.6 to 1.0 | 5 | 495 | Risk Ratio (M‐H, Fixed, 95% CI) | 0.93 [0.72, 1.21] |
| 4.3 FiO2 ≥ 0.3 to < 0.4 versus FiO2 ≥ 0.6 to 1.0 | 4 | 373 | Risk Ratio (M‐H, Fixed, 95% CI) | 1.04 [0.81, 1.34] |
| 5 Time to reach desired oxygen saturation target Show forest plot | 2 | Mean Difference (IV, Fixed, 95% CI) | Subtotals only | |
| 5.1 FiO2 ≥ 0.3 to < 0.4 versus FiO2 ≥ 0.6 to 1.0 | 2 | 102 | Mean Difference (IV, Fixed, 95% CI) | ‐0.52 [‐1.83, 0.79] |
| 6 Time to reach heart rate > 100 bpm (not prespecified) Show forest plot | 1 | Mean Difference (IV, Fixed, 95% CI) | Subtotals only | |
| 6.1 FiO2 ≥ 0.3 to < 0.4 versus FiO2 ≥ 0.6 to 1.0 | 1 | 60 | Mean Difference (IV, Fixed, 95% CI) | 0.27 [‐1.21, 1.75] |
| 7 Retinopathy of prematurity Show forest plot | 4 | Risk Ratio (M‐H, Fixed, 95% CI) | Subtotals only | |
| 7.1 FiO2 ≥ 0.3 to < 0.4 versus FiO2 ≥ 0.6 to 1.0 | 4 | 373 | Risk Ratio (M‐H, Fixed, 95% CI) | 0.80 [0.43, 1.49] |
| 8 Severe retinopathy of prematurity (≥ stage 3) Show forest plot | 4 | Risk Ratio (M‐H, Fixed, 95% CI) | Subtotals only | |
| 8.1 FiO2 0.21 versus FiO2 ≥ 0.4 to < 0.6 | 1 | 13 | Risk Ratio (M‐H, Fixed, 95% CI) | 0.0 [0.0, 0.0] |
| 8.2 FiO2 0.21 versus FiO2 ≥ 0.6 to 1.0 | 3 | 386 | Risk Ratio (M‐H, Fixed, 95% CI) | 0.40 [0.15, 1.05] |
| 8.3 FiO2 ≥ 0.3 to < 0.4 versus FiO2 ≥ 0.6 to 1.0 | 1 | 60 | Risk Ratio (M‐H, Fixed, 95% CI) | 3.86 [0.19, 77.05] |
| 9 Intraventricular haemorrhage Show forest plot | 3 | Risk Ratio (M‐H, Fixed, 95% CI) | Subtotals only | |
| 9.1 FiO2 0.21 versus FiO2 ≥ 0.4 to < 0.6 | 1 | 13 | Risk Ratio (M‐H, Fixed, 95% CI) | 0.0 [0.0, 0.0] |
| 9.2 FiO2 0.21 versus FiO2 ≥ 0.6 to 1.0 | 1 | 11 | Risk Ratio (M‐H, Fixed, 95% CI) | 0.17 [0.01, 2.92] |
| 9.3 FiO2 ≥ 0.3 to < 0.4 versus FiO2 ≥ 0.6 to 1.0 | 2 | 253 | Risk Ratio (M‐H, Fixed, 95% CI) | 0.85 [0.47, 1.53] |
| 10 Severe intraventricular haemorrhage (grade 3 or 4) Show forest plot | 6 | Risk Ratio (M‐H, Fixed, 95% CI) | Subtotals only | |
| 10.1 FiO2 0.21 versus FiO2 ≥ 0.6 to 1.0 | 3 | 416 | Risk Ratio (M‐H, Fixed, 95% CI) | 0.78 [0.27, 2.24] |
| 10.2 FiO2 ≥ 0.3 to < 0.4 versus FiO2 ≥ 0.6 to 1.0 | 3 | 180 | Risk Ratio (M‐H, Fixed, 95% CI) | 1.03 [0.49, 2.18] |
| 11 Periventricular leukomalacia Show forest plot | 2 | Risk Ratio (M‐H, Fixed, 95% CI) | Subtotals only | |
| 11.1 FiO2 0.21 versus FiO2 ≥ 0.6 to 1.0 | 1 | 88 | Risk Ratio (M‐H, Fixed, 95% CI) | 0.33 [0.01, 7.97] |
| 11.2 FiO2 ≥ 0.3 to < 0.4 versus FiO2 ≥ 0.6 to 1.0 | 1 | 42 | Risk Ratio (M‐H, Fixed, 95% CI) | 1.21 [0.08, 18.09] |
| 12 Necrotising enterocolitis Show forest plot | 8 | Risk Ratio (M‐H, Fixed, 95% CI) | Subtotals only | |
| 12.1 FiO2 0.21 versus FiO2 ≥ 0.4 to < 0.6 | 1 | 13 | Risk Ratio (M‐H, Fixed, 95% CI) | 0.58 [0.07, 4.95] |
| 12.2 FiO2 0.21 versus FiO2 ≥ 0.6 to 1.0 | 4 | 434 | Risk Ratio (M‐H, Fixed, 95% CI) | 0.74 [0.31, 1.76] |
| 12.3 FiO2 ≥ 0.3 to < 0.4 versus FiO2 ≥ 0.6 to 1.0 | 4 | 373 | Risk Ratio (M‐H, Fixed, 95% CI) | 1.40 [0.52, 3.78] |
| 13 Chronic lung disease (28 days age) Show forest plot | 2 | Risk Ratio (M‐H, Fixed, 95% CI) | Subtotals only | |
| 13.1 FiO2 0.21 versus FiO2 ≥ 0.6 to 1.0 | 1 | 88 | Risk Ratio (M‐H, Fixed, 95% CI) | 0.47 [0.23, 0.98] |
| 13.2 FiO2 ≥ 0.3 to < 0.4 versus FiO2 ≥ 0.6 to 1.0 | 1 | 60 | Risk Ratio (M‐H, Fixed, 95% CI) | 1.27 [0.53, 3.05] |
| 14 Chronic lung disease (36 weeks' corrected age) Show forest plot | 9 | Risk Ratio (M‐H, Fixed, 95% CI) | Subtotals only | |
| 14.1 FiO2 0.21 versus FiO2 ≥ 0.4 to < 0.6 | 1 | 13 | Risk Ratio (M‐H, Fixed, 95% CI) | 0.39 [0.05, 2.83] |
| 14.2 FiO2 0.21 versus FiO2 ≥ 0.6 to 1.0 | 5 | 492 | Risk Ratio (M‐H, Fixed, 95% CI) | 0.83 [0.63, 1.09] |
| 14.3 FiO2 ≥ 0.3 to < 0.4 versus FiO2 ≥ 0.6 to 1.0 | 4 | 363 | Risk Ratio (M‐H, Fixed, 95% CI) | 1.07 [0.72, 1.60] |
| 15 Duration of respiratory support (mechanical ventilation or CPAP) (days from birth) Show forest plot | 2 | Mean Difference (IV, Fixed, 95% CI) | Subtotals only | |
| 15.1 FiO2 0.21 versus FiO2 ≥ 0.6 to 1.0 | 1 | 266 | Mean Difference (IV, Fixed, 95% CI) | ‐13.70 [‐14.85, ‐12.55] |
| 15.2 FiO2 ≥ 0.3 to < 0.4 versus FiO2 ≥ 0.6 to 1.0 | 1 | 60 | Mean Difference (IV, Fixed, 95% CI) | 1.06 [‐2.63, 4.75] |
| 16 Duration of respiratory support (mechanical ventilation) (days from birth) Show forest plot | 6 | Mean Difference (IV, Fixed, 95% CI) | Subtotals only | |
| 16.1 FiO2 0.21 versus FiO2 ≥ 0.6 to 1.0 | 3 | 197 | Mean Difference (IV, Fixed, 95% CI) | ‐0.11 [‐4.16, 3.93] |
| 16.2 FiO2 ≥ 0.3 to < 0.4 versus FiO2 ≥ 0.6 to 1.0 | 3 | 313 | Mean Difference (IV, Fixed, 95% CI) | 0.82 [‐1.38, 3.02] |
| 17 Duration of respiratory support (CPAP) (days from birth) Show forest plot | 4 | Mean Difference (IV, Fixed, 95% CI) | Subtotals only | |
| 17.1 FiO2 0.21 versus FiO2 ≥ 0.6 to 1.0 | 2 | 129 | Mean Difference (IV, Fixed, 95% CI) | ‐1.79 [‐5.84, 2.25] |
| 17.2 FiO2 ≥ 0.3 to < 0.4 versus FiO2 ≥ 0.6 to 1.0 | 2 | 120 | Mean Difference (IV, Fixed, 95% CI) | ‐0.24 [‐11.00, 10.53] |
| 18 Duration of supplemental oxygen administration Show forest plot | 5 | Mean Difference (IV, Fixed, 95% CI) | Subtotals only | |
| 18.1 FiO2 0.21 versus FiO2 ≥ 0.6 to 1.0 | 1 | 266 | Mean Difference (IV, Fixed, 95% CI) | 12.4 [9.25, 15.55] |
| 18.2 FiO2 ≥ 0.3 to < 0.4 versus FiO2 ≥ 0.6 to 1.0 | 4 | 373 | Mean Difference (IV, Fixed, 95% CI) | 0.01 [‐5.37, 5.38] |
| 19 Mortality to follow up (> 18 months) Show forest plot | 3 | Risk Ratio (M‐H, Fixed, 95% CI) | Subtotals only | |
| 19.1 FiO2 0.21 versus FiO2 ≥ 0.6 to 1.0 | 1 | 287 | Risk Ratio (M‐H, Fixed, 95% CI) | 2.32 [0.92, 5.86] |
| 19.2 FiO2 ≥ 0.3 to < 0.4 versus FiO2 ≥ 0.6 to 1.0 | 2 | 253 | Risk Ratio (M‐H, Fixed, 95% CI) | 0.56 [0.28, 1.14] |
| 20 Postnatal growth failure (weight < 10th percentile at discharge) Show forest plot | 1 | Risk Ratio (M‐H, Fixed, 95% CI) | Subtotals only | |
| 20.1 FiO2 ≥ 0.3 to < 0.4 versus FiO2 ≥ 0.6 to 1.0 | 1 | 60 | Risk Ratio (M‐H, Fixed, 95% CI) | 0.86 [0.55, 1.33] |
| 21 Duration of hospitalisation (days) Show forest plot | 3 | Mean Difference (IV, Fixed, 95% CI) | Subtotals only | |
| 21.1 FiO2 0.21 versus FiO2 ≥ 0.6 to 1.0 | 2 | 156 | Mean Difference (IV, Fixed, 95% CI) | ‐4.35 [‐15.26, 6.57] |
| 21.2 FiO2 ≥ 0.3 to < 0.4 versus FiO2 ≥ 0.6 to 1.0 | 1 | 60 | Mean Difference (IV, Fixed, 95% CI) | 28.0 [‐8.96, 64.96] |
| 22 Patent ductus arteriosus (not prespecified) Show forest plot | 7 | 766 | Risk Ratio (M‐H, Fixed, 95% CI) | 0.93 [0.77, 1.14] |
| 22.1 FiO2 0.21 versus FiO2 ≥ 0.6 to 1.0 | 3 | 393 | Risk Ratio (M‐H, Fixed, 95% CI) | 0.80 [0.57, 1.14] |
| 22.2 FiO2 ≥ 0.3 to < 0.4 versus FiO2 ≥ 0.6 to 1.0 | 4 | 373 | Risk Ratio (M‐H, Fixed, 95% CI) | 1.03 [0.82, 1.29] |
| Outcome or subgroup title | No. of studies | No. of participants | Statistical method | Effect size |
| 1 Mortality near term corrected age or discharge (latest reported) Show forest plot | 10 | 914 | Risk Ratio (M‐H, Fixed, 95% CI) | 1.05 [0.68, 1.63] |
| 1.1 SpO2 target < 85% | 1 | 287 | Risk Ratio (M‐H, Fixed, 95% CI) | 2.78 [1.03, 7.52] |
| 1.2 SpO2 target 85 to 90% | 9 | 627 | Risk Ratio (M‐H, Fixed, 95% CI) | 0.77 [0.46, 1.27] |
| 2 Neurodevelopmental disability Show forest plot | 2 | 208 | Risk Ratio (M‐H, Fixed, 95% CI) | 0.82 [0.49, 1.35] |
| 2.1 SpO2 target 85 to 90% | 2 | 208 | Risk Ratio (M‐H, Fixed, 95% CI) | 0.82 [0.49, 1.35] |
| 3 IPPV in the delivery room Show forest plot | 5 | 249 | Risk Ratio (M‐H, Fixed, 95% CI) | 0.94 [0.83, 1.06] |
| 3.1 SpO2 target 85 to 90% | 5 | 249 | Risk Ratio (M‐H, Fixed, 95% CI) | 0.94 [0.83, 1.06] |
| 4 Intubation in the delivery room Show forest plot | 9 | 875 | Risk Ratio (M‐H, Fixed, 95% CI) | 0.98 [0.82, 1.18] |
| 4.1 SpO2 target < 85% | 1 | 287 | Risk Ratio (M‐H, Fixed, 95% CI) | 1.04 [0.73, 1.49] |
| 4.2 SpO2 target 85 to 90% | 8 | 588 | Risk Ratio (M‐H, Fixed, 95% CI) | 0.96 [0.78, 1.18] |
| 5 Time to reach desired oxygen saturation target Show forest plot | 2 | 102 | Mean Difference (IV, Fixed, 95% CI) | ‐0.52 [‐1.83, 0.79] |
| 5.1 SpO2 target 85 to 90% | 2 | 102 | Mean Difference (IV, Fixed, 95% CI) | ‐0.52 [‐1.83, 0.79] |
| 6 Time to reach heart rate > 100 bpm (not prespecified) Show forest plot | 1 | 60 | Mean Difference (IV, Fixed, 95% CI) | 0.27 [‐1.21, 1.75] |
| 6.1 SpO2 target 85 to 90% | 1 | 60 | Mean Difference (IV, Fixed, 95% CI) | 0.27 [‐1.21, 1.75] |
| 7 Retinopathy of prematurity Show forest plot | 4 | 373 | Risk Ratio (M‐H, Fixed, 95% CI) | 0.80 [0.43, 1.49] |
| 7.1 SpO2 target 85 to 90% | 4 | 373 | Risk Ratio (M‐H, Fixed, 95% CI) | 0.80 [0.43, 1.49] |
| 8 Severe retinopathy of prematurity (≥ stage 3) Show forest plot | 4 | 453 | Risk Ratio (M‐H, Fixed, 95% CI) | 0.57 [0.24, 1.36] |
| 8.1 SpO2 target < 85% | 1 | 287 | Risk Ratio (M‐H, Fixed, 95% CI) | 0.50 [0.15, 1.61] |
| 8.2 SpO2 target 85 to 90% | 3 | 166 | Risk Ratio (M‐H, Fixed, 95% CI) | 0.68 [0.19, 2.48] |
| 9 Intraventricular haemorrhage Show forest plot | 3 | 271 | Risk Ratio (M‐H, Fixed, 95% CI) | 0.81 [0.46, 1.44] |
| 9.1 SpO2 target 85 to 90% | 3 | 271 | Risk Ratio (M‐H, Fixed, 95% CI) | 0.81 [0.46, 1.44] |
| 10 Severe intraventricular haemorrhage (grade 3 or 4) Show forest plot | 6 | 596 | Risk Ratio (M‐H, Fixed, 95% CI) | 0.93 [0.51, 1.71] |
| 10.1 SpO2 target < 85% | 1 | 287 | Risk Ratio (M‐H, Fixed, 95% CI) | 0.33 [0.07, 1.61] |
| 10.2 SpO2 target 85 to 90% | 5 | 309 | Risk Ratio (M‐H, Fixed, 95% CI) | 1.21 [0.61, 2.39] |
| 11 Periventricular leukomalacia Show forest plot | 2 | 130 | Risk Ratio (M‐H, Fixed, 95% CI) | 0.66 [0.09, 4.73] |
| 11.1 SpO2 target 85 to 90% | 2 | 130 | Risk Ratio (M‐H, Fixed, 95% CI) | 0.66 [0.09, 4.73] |
| 12 Necrotising enterocolitis Show forest plot | 8 | 807 | Risk Ratio (M‐H, Fixed, 95% CI) | 0.98 [0.51, 1.87] |
| 12.1 SpO2 target < 85% | 1 | 287 | Risk Ratio (M‐H, Fixed, 95% CI) | 4.97 [0.59, 41.97] |
| 12.2 SpO2 target 85 to 90% | 7 | 520 | Risk Ratio (M‐H, Fixed, 95% CI) | 0.74 [0.36, 1.52] |
| 13 Chronic lung disease (28 days' age) Show forest plot | 2 | 148 | Risk Ratio (M‐H, Fixed, 95% CI) | 0.70 [0.41, 1.21] |
| 13.1 SpO2 target 85 to 90% | 2 | 148 | Risk Ratio (M‐H, Fixed, 95% CI) | 0.70 [0.41, 1.21] |
| 14 Chronic lung disease (36 weeks' corrected age) Show forest plot | 9 | 862 | Risk Ratio (M‐H, Random, 95% CI) | 0.91 [0.64, 1.29] |
| 14.1 SpO2 target < 85% | 1 | 287 | Risk Ratio (M‐H, Random, 95% CI) | 0.84 [0.57, 1.25] |
| 14.2 SpO2 target 85 to 90% | 8 | 575 | Risk Ratio (M‐H, Random, 95% CI) | 0.91 [0.58, 1.43] |
| 15 Duration of respiratory support (mechanical ventilation or CPAP) (days from birth) Show forest plot | 2 | 326 | Mean Difference (IV, Fixed, 95% CI) | ‐12.39 [‐13.49, ‐11.29] |
| 15.1 SpO2 target < 85% | 1 | 266 | Mean Difference (IV, Fixed, 95% CI) | ‐13.70 [‐14.85, ‐12.55] |
| 15.2 SpO2 target 85 to 90% | 1 | 60 | Mean Difference (IV, Fixed, 95% CI) | 1.06 [‐2.63, 4.75] |
| 16 Duration of respiratory support (mechanical ventilation) (days from birth) Show forest plot | 6 | 510 | Mean Difference (IV, Fixed, 95% CI) | 0.78 [‐1.15, 2.72] |
| 16.1 SpO2 target 85 to 90% | 6 | 510 | Mean Difference (IV, Fixed, 95% CI) | 0.78 [‐1.15, 2.72] |
| 17 Duration of respiratory support (CPAP) (days from birth) Show forest plot | 4 | 249 | Mean Difference (IV, Fixed, 95% CI) | ‐1.83 [‐5.62, 1.96] |
| 17.1 SpO2 target 85 to 90% | 4 | 249 | Mean Difference (IV, Fixed, 95% CI) | ‐1.83 [‐5.62, 1.96] |
| 18 Duration of supplemental oxygen administration Show forest plot | 5 | 639 | Mean Difference (IV, Fixed, 95% CI) | 9.67 [6.96, 12.39] |
| 18.1 SpO2 target < 85% | 1 | 266 | Mean Difference (IV, Fixed, 95% CI) | 12.4 [9.25, 15.55] |
| 18.2 SpO2 target 85 to 90% | 4 | 373 | Mean Difference (IV, Fixed, 95% CI) | 1.73 [‐3.64, 7.11] |
| 19 Mortality to follow up (> 18 months) Show forest plot | 3 | 540 | Risk Ratio (M‐H, Fixed, 95% CI) | 1.00 [0.59, 1.70] |
| 19.1 SpO2 target < 85% | 1 | 287 | Risk Ratio (M‐H, Fixed, 95% CI) | 2.32 [0.92, 5.86] |
| 19.2 SpO2 target 85 to 90% | 2 | 253 | Risk Ratio (M‐H, Fixed, 95% CI) | 0.56 [0.28, 1.14] |
| 20 Postnatal growth failure (weight < 10th percentile at discharge) Show forest plot | 1 | 60 | Risk Ratio (M‐H, Fixed, 95% CI) | 0.86 [0.55, 1.33] |
| 20.1 SpO2 target 85 to 90% | 1 | 60 | Risk Ratio (M‐H, Fixed, 95% CI) | 0.86 [0.55, 1.33] |
| 21 Duration of hospitalisation (days) Show forest plot | 3 | 216 | Mean Difference (IV, Fixed, 95% CI) | ‐1.75 [‐12.22, 8.71] |
| 21.1 SpO2 target 85 to 90% | 3 | 216 | Mean Difference (IV, Fixed, 95% CI) | ‐1.75 [‐12.22, 8.71] |
| 22 Patent ductus arteriosus (not prespecified) Show forest plot | 7 | 766 | Risk Ratio (M‐H, Fixed, 95% CI) | 0.95 [0.79, 1.15] |
| 22.1 SpO2 target < 85% | 1 | 287 | Risk Ratio (M‐H, Fixed, 95% CI) | 0.87 [0.59, 1.28] |
| 22.2 SpO2 target 85 to 90% | 6 | 479 | Risk Ratio (M‐H, Fixed, 95% CI) | 0.98 [0.79, 1.22] |
| Outcome or subgroup title | No. of studies | No. of participants | Statistical method | Effect size |
| 1 Mortality near term corrected age or discharge (latest reported) Show forest plot | 7 | 737 | Risk Ratio (M‐H, Fixed, 95% CI) | 1.21 [0.72, 2.02] |
| 1.1 SpO2 target 85 to 90% | 1 | 42 | Risk Ratio (M‐H, Fixed, 95% CI) | 1.61 [0.41, 6.34] |
| 1.2 SpO2 target 91 to 95% | 6 | 695 | Risk Ratio (M‐H, Fixed, 95% CI) | 1.16 [0.67, 2.01] |
| 2 Neurodevelopmental disability Show forest plot | 1 | 177 | Risk Ratio (M‐H, Fixed, 95% CI) | 0.71 [0.42, 1.21] |
| 2.1 SpO2 target 91 to 95% | 1 | 177 | Risk Ratio (M‐H, Fixed, 95% CI) | 0.71 [0.42, 1.21] |
| 3 IPPV in the delivery room Show forest plot | 4 | 189 | Risk Ratio (M‐H, Fixed, 95% CI) | 0.91 [0.77, 1.08] |
| 3.1 SpO2 target 85 to 90% | 1 | 42 | Risk Ratio (M‐H, Fixed, 95% CI) | 0.87 [0.60, 1.27] |
| 3.2 SpO2 target 91 to 95% | 3 | 147 | Risk Ratio (M‐H, Fixed, 95% CI) | 0.92 [0.76, 1.12] |
| 4 Intubation in the delivery room Show forest plot | 7 | 737 | Risk Ratio (M‐H, Fixed, 95% CI) | 0.96 [0.78, 1.18] |
| 4.1 SpO2 target 85 to 90% | 1 | 42 | Risk Ratio (M‐H, Fixed, 95% CI) | 0.91 [0.49, 1.68] |
| 4.2 SpO2 target 91 to 95% | 6 | 695 | Risk Ratio (M‐H, Fixed, 95% CI) | 0.96 [0.77, 1.20] |
| 5 Time to reach desired oxygen saturation target Show forest plot | 1 | 42 | Mean Difference (IV, Fixed, 95% CI) | ‐1.70 [‐3.28, ‐0.12] |
| 5.1 SpO2 target 85 to 90% | 1 | 42 | Mean Difference (IV, Fixed, 95% CI) | ‐1.70 [‐3.28, ‐0.12] |
| 6 Retinopathy of prematurity Show forest plot | 2 | 235 | Risk Ratio (M‐H, Fixed, 95% CI) | 1.00 [0.36, 2.79] |
| 6.1 SpO2 target 85 to 90% | 1 | 42 | Risk Ratio (M‐H, Fixed, 95% CI) | 0.61 [0.06, 6.17] |
| 6.2 SpO2 target 91 to 95% | 1 | 193 | Risk Ratio (M‐H, Fixed, 95% CI) | 1.14 [0.36, 3.61] |
| 7 Severe retinopathy of prematurity (≥ stage 3) Show forest plot | 3 | 393 | Risk Ratio (M‐H, Fixed, 95% CI) | 0.43 [0.16, 1.14] |
| 7.1 SpO2 target 91 to 95% | 3 | 393 | Risk Ratio (M‐H, Fixed, 95% CI) | 0.43 [0.16, 1.14] |
| 8 Intraventricular haemorrhage Show forest plot | 2 | 211 | Risk Ratio (M‐H, Fixed, 95% CI) | 0.70 [0.30, 1.64] |
| 8.1 SpO2 target 91 to 95% | 2 | 211 | Risk Ratio (M‐H, Fixed, 95% CI) | 0.70 [0.30, 1.64] |
| 9 Severe intraventricular haemorrhage (grade 3 or 4) Show forest plot | 4 | 458 | Risk Ratio (M‐H, Fixed, 95% CI) | 0.72 [0.30, 1.73] |
| 9.1 SpO2 target 85 to 90% | 1 | 42 | Risk Ratio (M‐H, Fixed, 95% CI) | 0.61 [0.12, 2.95] |
| 9.2 SpO2 target 91 to 95% | 3 | 416 | Risk Ratio (M‐H, Fixed, 95% CI) | 0.78 [0.27, 2.24] |
| 10 Periventricular leukomalacia Show forest plot | 2 | 130 | Risk Ratio (M‐H, Fixed, 95% CI) | 0.66 [0.09, 4.73] |
| 10.1 SpO2 target 85 to 90% | 1 | 42 | Risk Ratio (M‐H, Fixed, 95% CI) | 1.21 [0.08, 18.09] |
| 10.2 SpO2 target 91 to 95% | 1 | 88 | Risk Ratio (M‐H, Fixed, 95% CI) | 0.33 [0.01, 7.97] |
| 11 Necrotising enterocolitis Show forest plot | 6 | 669 | Risk Ratio (M‐H, Fixed, 95% CI) | 0.81 [0.39, 1.67] |
| 11.1 SpO2 target 85 to 90% | 1 | 42 | Risk Ratio (M‐H, Fixed, 95% CI) | 0.4 [0.02, 9.29] |
| 11.2 SpO2 target 91 to 95% | 5 | 627 | Risk Ratio (M‐H, Fixed, 95% CI) | 0.85 [0.40, 1.79] |
| 12 Chronic lung disease (28 days age) Show forest plot | 1 | 88 | Risk Ratio (M‐H, Fixed, 95% CI) | 0.47 [0.23, 0.98] |
| 12.1 SpO2 target 91 to 95% | 1 | 88 | Risk Ratio (M‐H, Fixed, 95% CI) | 0.47 [0.23, 0.98] |
| 13 Chronic lung disease (36 weeks' corrected age) Show forest plot | 7 | 734 | Risk Ratio (M‐H, Fixed, 95% CI) | 0.93 [0.73, 1.19] |
| 13.1 SpO2 target 85 to 90% | 1 | 42 | Risk Ratio (M‐H, Fixed, 95% CI) | 0.73 [0.20, 2.65] |
| 13.2 SpO2 target 91 to 95% | 6 | 692 | Risk Ratio (M‐H, Fixed, 95% CI) | 0.94 [0.74, 1.21] |
| 14 Duration of respiratory support (mechanical ventilation or CPAP) (days from birth) Show forest plot | 1 | 266 | Mean Difference (IV, Fixed, 95% CI) | ‐13.70 [‐14.85, ‐12.55] |
| 14.1 SpO2 target 91 to 95% | 1 | 266 | Mean Difference (IV, Fixed, 95% CI) | ‐13.70 [‐14.85, ‐12.55] |
| 15 Duration of respiratory support (mechanical ventilation) (days from birth) Show forest plot | 5 | 432 | Mean Difference (IV, Fixed, 95% CI) | 0.91 [‐1.02, 2.85] |
| 15.1 SpO2 target 85 to 90% | 1 | 42 | Mean Difference (IV, Fixed, 95% CI) | ‐4.75 [‐37.24, 27.74] |
| 15.2 SpO2 target 91 to 95% | 4 | 390 | Mean Difference (IV, Fixed, 95% CI) | 0.94 [‐1.01, 2.88] |
| 16 Duration of respiratory support (CPAP) (days from birth) Show forest plot | 3 | 171 | Mean Difference (IV, Fixed, 95% CI) | ‐3.11 [‐7.08, 0.86] |
| 16.1 SpO2 target 85 to 90% | 1 | 42 | Mean Difference (IV, Fixed, 95% CI) | 12.0 [‐9.18, 33.18] |
| 16.2 Higher SpO2 target 91 to 95% | 2 | 129 | Mean Difference (IV, Fixed, 95% CI) | ‐3.66 [‐7.71, 0.38] |
| 17 Duration of supplemental oxygen administration Show forest plot | 3 | 501 | Mean Difference (IV, Fixed, 95% CI) | 9.87 [7.12, 12.62] |
| 17.1 SpO2 target 85 to 90% | 1 | 42 | Mean Difference (IV, Fixed, 95% CI) | ‐10.25 [‐50.97, 30.47] |
| 17.2 SpO2 target 91 to 95% | 2 | 459 | Mean Difference (IV, Fixed, 95% CI) | 9.96 [7.21, 12.71] |
| 18 Mortality to follow up (> 18 months) Show forest plot | 2 | 480 | Risk Ratio (M‐H, Fixed, 95% CI) | 1.22 [0.65, 2.29] |
| 18.1 SpO2 target 91 to 95% | 2 | 480 | Risk Ratio (M‐H, Fixed, 95% CI) | 1.22 [0.65, 2.29] |
| 19 Duration of hospitalisation (days) Show forest plot | 2 | 156 | Mean Difference (IV, Fixed, 95% CI) | ‐4.35 [‐15.26, 6.57] |
| 19.1 SpO2 target 91 to 95% | 2 | 156 | Mean Difference (IV, Fixed, 95% CI) | ‐4.35 [‐15.26, 6.57] |
| 20 Patent ductus arteriosus (not prespecified) Show forest plot | 5 | 628 | Risk Ratio (M‐H, Fixed, 95% CI) | 0.96 [0.75, 1.22] |
| 20.1 SpO2 target 85 to 90% | 1 | 42 | Risk Ratio (M‐H, Fixed, 95% CI) | 1.10 [0.60, 2.01] |
| 20.2 SpO2 target 91 to 95% | 4 | 586 | Risk Ratio (M‐H, Fixed, 95% CI) | 0.94 [0.72, 1.22] |
| Outcome or subgroup title | No. of studies | No. of participants | Statistical method | Effect size |
| 1 Mortality near term corrected age or discharge (latest reported) Show forest plot | 8 | 832 | Risk Ratio (M‐H, Fixed, 95% CI) | 1.01 [0.66, 1.55] |
| 1.1 Gestation ≤ 28 weeks | 8 | 516 | Risk Ratio (M‐H, Fixed, 95% CI) | 1.04 [0.68, 1.61] |
| 1.2 Gestation > 28 to 32 weeks | 4 | 316 | Risk Ratio (M‐H, Fixed, 95% CI) | 0.5 [0.05, 5.26] |
| 2 Neurodevelopmental disability Show forest plot | 1 | 31 | Risk Ratio (M‐H, Fixed, 95% CI) | 3.64 [0.42, 31.27] |
| 2.1 Gestation ≤ 28 weeks | 1 | 31 | Risk Ratio (M‐H, Fixed, 95% CI) | 3.64 [0.42, 31.27] |
| 3 IPPV in the delivery room Show forest plot | 2 | 102 | Risk Ratio (M‐H, Fixed, 95% CI) | 0.96 [0.84, 1.09] |
| 3.1 Gestation ≤ 28 weeks | 2 | 102 | Risk Ratio (M‐H, Fixed, 95% CI) | 0.96 [0.84, 1.09] |
| 4 Intubation in the delivery room Show forest plot | 4 | 467 | Risk Ratio (M‐H, Fixed, 95% CI) | 1.08 [0.85, 1.35] |
| 4.1 Gestation ≤ 28 weeks | 4 | 338 | Risk Ratio (M‐H, Fixed, 95% CI) | 1.06 [0.84, 1.34] |
| 4.2 Gestation > 28 to 32 weeks | 1 | 129 | Risk Ratio (M‐H, Fixed, 95% CI) | 1.20 [0.49, 2.97] |
| 5 Time to reach desired oxygen saturation target Show forest plot | 2 | 102 | Mean Difference (IV, Fixed, 95% CI) | ‐0.52 [‐1.83, 0.79] |
| 5.1 Gestation ≤ 28 weeks | 2 | 102 | Mean Difference (IV, Fixed, 95% CI) | ‐0.52 [‐1.83, 0.79] |
| 6 Time to reach heart rate > 100 bpm Show forest plot | 1 | 60 | Mean Difference (IV, Fixed, 95% CI) | 0.27 [‐1.21, 1.75] |
| 6.1 Gestation ≤ 28 weeks | 1 | 60 | Mean Difference (IV, Fixed, 95% CI) | 0.27 [‐1.21, 1.75] |
| 7 Retinopathy of prematurity Show forest plot | 4 | 259 | Risk Ratio (M‐H, Fixed, 95% CI) | 0.72 [0.38, 1.33] |
| 7.1 Gestation ≤ 28 weeks | 4 | 259 | Risk Ratio (M‐H, Fixed, 95% CI) | 0.72 [0.38, 1.33] |
| 8 Severe retinopathy of prematurity (≥ stage 3) Show forest plot | 5 | 464 | Risk Ratio (M‐H, Fixed, 95% CI) | 0.93 [0.46, 1.89] |
| 8.1 Gestation ≤ 28 weeks | 5 | 317 | Risk Ratio (M‐H, Fixed, 95% CI) | 0.88 [0.43, 1.82] |
| 8.2 Gestation > 28 to 32 weeks | 1 | 147 | Risk Ratio (M‐H, Fixed, 95% CI) | 2.26 [0.09, 54.54] |
| 9 Intraventricular haemorrhage Show forest plot | 2 | 217 | Risk Ratio (M‐H, Fixed, 95% CI) | 0.87 [0.52, 1.48] |
| 9.1 Gestation ≤ 28 weeks | 2 | 217 | Risk Ratio (M‐H, Fixed, 95% CI) | 0.87 [0.52, 1.48] |
| 10 Severe intraventricular haemorrhage (grade 3 or 4) Show forest plot | 6 | 537 | Risk Ratio (M‐H, Fixed, 95% CI) | 1.02 [0.55, 1.87] |
| 10.1 Gestation ≤ 28 weeks | 6 | 388 | Risk Ratio (M‐H, Fixed, 95% CI) | 0.95 [0.51, 1.79] |
| 10.2 Gestation > 28 to 32 weeks | 2 | 149 | Risk Ratio (M‐H, Fixed, 95% CI) | 3.27 [0.15, 72.23] |
| 11 Periventricular leukomalacia Show forest plot | 1 | 42 | Risk Ratio (M‐H, Fixed, 95% CI) | 1.21 [0.08, 18.09] |
| 11.1 Gestation ≤ 28 weeks | 1 | 42 | Risk Ratio (M‐H, Fixed, 95% CI) | 1.21 [0.08, 18.09] |
| 12 Necrotising enterocolitis Show forest plot | 7 | 731 | Risk Ratio (M‐H, Fixed, 95% CI) | 1.57 [0.78, 3.17] |
| 12.1 Gestation ≤ 28 weeks | 7 | 483 | Risk Ratio (M‐H, Fixed, 95% CI) | 1.79 [0.80, 4.01] |
| 12.2 Gestation > 28 to 32 weeks | 3 | 248 | Risk Ratio (M‐H, Fixed, 95% CI) | 1.02 [0.23, 4.47] |
| 13 Chronic lung disease (28 days age) Show forest plot | 1 | 60 | Risk Ratio (M‐H, Fixed, 95% CI) | 1.27 [0.53, 3.05] |
| 13.1 Gestation ≤ 28 weeks | 1 | 60 | Risk Ratio (M‐H, Fixed, 95% CI) | 1.27 [0.53, 3.05] |
| 14 Chronic lung disease (36 weeks' corrected age) Show forest plot | 8 | 694 | Risk Ratio (M‐H, Fixed, 95% CI) | 0.90 [0.72, 1.13] |
| 14.1 Gestation ≤ 28 weeks | 8 | 411 | Risk Ratio (M‐H, Fixed, 95% CI) | 0.90 [0.72, 1.13] |
| 14.2 Gestation > 28 to 32 weeks | 3 | 283 | Risk Ratio (M‐H, Fixed, 95% CI) | 0.92 [0.36, 2.33] |
| 15 Duration of respiratory support (mechanical ventilation or CPAP) (days from birth) Show forest plot | 1 | 60 | Mean Difference (IV, Fixed, 95% CI) | 1.06 [‐2.63, 4.75] |
| 15.1 Gestation ≤ 28 weeks | 1 | 60 | Mean Difference (IV, Fixed, 95% CI) | 1.06 [‐2.63, 4.75] |
| 16 Duration of respiratory support (mechanical ventilation) (days from birth) Show forest plot | 2 | 120 | Mean Difference (IV, Fixed, 95% CI) | ‐13.64 [‐32.62, 5.33] |
| 16.1 Gestation ≤ 28 weeks | 2 | 120 | Mean Difference (IV, Fixed, 95% CI) | ‐13.64 [‐32.62, 5.33] |
| 17 Duration of respiratory support (CPAP) (days from birth) Show forest plot | 2 | 120 | Mean Difference (IV, Fixed, 95% CI) | ‐2.09 [‐12.85, 8.67] |
| 17.1 Gestation ≤ 28 weeks | 2 | 120 | Mean Difference (IV, Fixed, 95% CI) | ‐2.09 [‐12.85, 8.67] |
| 18 Duration of supplemental oxygen administration Show forest plot | 3 | 180 | Mean Difference (IV, Fixed, 95% CI) | ‐0.50 [‐16.90, 15.91] |
| 18.1 Gestation ≤ 28 weeks | 3 | 180 | Mean Difference (IV, Fixed, 95% CI) | ‐0.50 [‐16.90, 15.91] |
| 19 Mortality to follow up (> 18 months) Show forest plot | 1 | 60 | Risk Ratio (M‐H, Fixed, 95% CI) | 0.55 [0.20, 1.53] |
| 19.1 Gestation ≤ 28 weeks | 1 | 60 | Risk Ratio (M‐H, Fixed, 95% CI) | 0.55 [0.20, 1.53] |
| 20 Postnatal growth failure (weight < 10th percentile at discharge) Show forest plot | 1 | 60 | Risk Ratio (M‐H, Fixed, 95% CI) | 0.86 [0.55, 1.33] |
| 20.1 Gestation ≤ 28 weeks | 1 | 60 | Risk Ratio (M‐H, Fixed, 95% CI) | 0.86 [0.55, 1.33] |
| 21 Duration of hospitalisation (days) Show forest plot | 1 | 60 | Mean Difference (IV, Fixed, 95% CI) | 28.0 [‐8.96, 64.96] |
| 21.1 Gestation ≤ 28 weeks | 1 | 60 | Mean Difference (IV, Fixed, 95% CI) | 28.0 [‐8.96, 64.96] |
| 22 Patent ductus arteriosus (not prespecified) Show forest plot | 7 | 710 | Risk Ratio (M‐H, Fixed, 95% CI) | 0.96 [0.81, 1.14] |
| 22.1 Gestation ≤ 28 weeks | 7 | 483 | Risk Ratio (M‐H, Fixed, 95% CI) | 0.95 [0.80, 1.14] |
| 22.2 Gestation > 28 to 32 weeks | 2 | 227 | Risk Ratio (M‐H, Fixed, 95% CI) | 1.05 [0.54, 2.05] |
| Outcome or subgroup title | No. of studies | No. of participants | Statistical method | Effect size |
| 1 Mortality near term corrected age or discharge (latest reported) Show forest plot | 2 | 253 | Risk Ratio (M‐H, Fixed, 95% CI) | 0.51 [0.25, 1.07] |
| 2 Neurodevelopmental disability Show forest plot | 2 | 208 | Risk Ratio (M‐H, Fixed, 95% CI) | 0.82 [0.49, 1.35] |
| 3 IPPV in the delivery room Show forest plot | 1 | 60 | Risk Ratio (M‐H, Fixed, 95% CI) | 1.0 [0.94, 1.07] |
| 4 Intubation in the delivery room Show forest plot | 2 | 253 | Risk Ratio (M‐H, Fixed, 95% CI) | 1.16 [0.79, 1.70] |
| 5 Time to reach desired oxygen saturation target Show forest plot | 1 | 60 | Mean Difference (IV, Fixed, 95% CI) | 2.09 [‐0.26, 4.44] |
| 6 Time to reach heart rate > 100 bpm (not prespecified) Show forest plot | 1 | 60 | Mean Difference (IV, Fixed, 95% CI) | 0.27 [‐1.21, 1.75] |
| 7 Retinopathy of prematurity Show forest plot | 2 | 253 | Risk Ratio (M‐H, Fixed, 95% CI) | 0.85 [0.39, 1.86] |
| 8 Severe retinopathy of prematurity (≥ stage 3) Show forest plot | 1 | 60 | Risk Ratio (M‐H, Fixed, 95% CI) | 3.86 [0.19, 77.05] |
| 9 Intraventricular haemorrhage Show forest plot | 2 | 253 | Risk Ratio (M‐H, Fixed, 95% CI) | 0.85 [0.47, 1.53] |
| 10 Severe intraventricular haemorrhage (grade 3 or 4) Show forest plot | 1 | 60 | Risk Ratio (M‐H, Fixed, 95% CI) | 0.76 [0.17, 3.48] |
| 11 Necrotising enterocolitis Show forest plot | 2 | 253 | Risk Ratio (M‐H, Fixed, 95% CI) | 1.54 [0.46, 5.19] |
| 12 Chronic lung disease (28 days age) Show forest plot | 1 | 60 | Risk Ratio (M‐H, Fixed, 95% CI) | 1.27 [0.53, 3.05] |
| 13 Chronic lung disease (36 weeks' corrected age) Show forest plot | 2 | 243 | Risk Ratio (M‐H, Fixed, 95% CI) | 1.49 [0.90, 2.47] |
| 14 Duration of respiratory support (mechanical ventilation or CPAP) (days from birth) Show forest plot | 1 | 60 | Mean Difference (IV, Fixed, 95% CI) | 1.06 [‐2.63, 4.75] |
| 15 Duration of respiratory support (mechanical ventilation) (days from birth) Show forest plot | 1 | 193 | Mean Difference (IV, Fixed, 95% CI) | 1.25 [‐0.97, 3.47] |
| 16 Duration of supplemental oxygen administration Show forest plot | 2 | 253 | Mean Difference (IV, Fixed, 95% CI) | 2.72 [‐2.78, 8.22] |
| 17 Mortality to follow up (> 18 months) Show forest plot | 2 | 253 | Risk Ratio (M‐H, Fixed, 95% CI) | 0.56 [0.28, 1.14] |
| 18 Postnatal growth failure (weight < 10th percentile at discharge) Show forest plot | 1 | 60 | Risk Ratio (M‐H, Fixed, 95% CI) | 0.86 [0.55, 1.33] |
| 19 Duration of hospitalisation (days) Show forest plot | 1 | 60 | Mean Difference (IV, Fixed, 95% CI) | 28.0 [‐8.96, 64.96] |
| 20 Patent ductus arteriosus (not prespecified) Show forest plot | 2 | 253 | Risk Ratio (M‐H, Fixed, 95% CI) | 1.18 [0.88, 1.59] |