Lebih rendah berbanding kepekatan oksigen yang lebih tinggi dititrasi ke sasaran saturasi oksigen semasa resusitasi bayi pramatang ketika dilahirkan
Abstract
Background
Initial resuscitation with air is well tolerated by most infants born at term. However, the optimal fractional inspired oxygen concentration (FiO2 ‐ proportion of the breathed air that is oxygen) targeted to oxygen saturation (SpO2 ‐ an estimate of the amount of oxygen in the blood) for infants born preterm is unclear.
Objectives
To determine whether lower or higher initial oxygen concentrations, when titrated according to oxygen saturation targets during the resuscitation of preterm infants at birth, lead to improved short‐ and long‐term mortality and morbidity.
Search methods
We conducted electronic searches of the Cochrane Central Register of Controlled Trials (13 October 2017), Ovid MEDLINE (1946 to 13 October 2017), Embase (1974 to 13 October 2017) and CINAHL (1982 to 13 October 2017); we also searched previous reviews (including cross‐references), contacted expert informants, and handsearched journals.
Selection criteria
We included randomised controlled trials (including cluster‐ and quasi‐randomised trials) which enrolled preterm infants requiring resuscitation following birth and allocated them to receive either lower (FiO2 < 0.4) or higher (FiO2 ≥ 0.4) initial oxygen concentrations titrated to target oxygen saturation.
Data collection and analysis
Two review authors independently assessed the eligibility of studies for inclusion, extracted data and assessed methodological quality. Primary outcomes included mortality near term or at discharge (latest reported) and neurodevelopmental disability. We conducted meta‐analysis using a fixed‐effect model. We assessed the quality of the evidence using GRADE.
Main results
The search identified 10 eligible trials. Meta‐analysis of the 10 included studies (914 infants) showed no difference in mortality to discharge between lower (FiO2 < 0.4) and higher (FiO2 ≥ 0.4) initial oxygen concentrations targeted to oxygen saturation (risk ratio (RR) 1.05, 95% confidence interval (CI) 0.68 to 1.63). We identified no heterogeneity in this analysis. We graded the quality of the evidence as low due to risk of bias and imprecision. There were no significant subgroup effects according to inspired oxygen concentration strata (FiO2 0.21 versus ≥ 0.4 to < 0.6; FiO2 0.21 versus ≥ 0.6 to 1.0; and FiO2 ≥ 0.3 to < 0.4 versus ≥ 0.6 to 1.0). Subgroup analysis identified a single trial that reported increased mortality from use of lower (FiO2 0.21) versus higher (FiO2 1.0) initial oxygen concentration targeted to a lowest SpO2 of less than 85%, whereas meta‐analysis of nine trials targeting a lowest SpO2 of 85% to 90% found no difference in mortality.
Meta‐analysis of two trials (208 infants) showed no difference in neurodevelopmental disability at 24 months between infants receiving lower (FiO2 < 0.4) versus higher (FiO2 > 0.4) initial oxygen concentrations targeted to oxygen saturation. Other outcomes were incompletely reported by studies. Overall, we found no difference in use of intermittent positive pressure ventilation or intubation in the delivery room; retinopathy (damage to the retina of the eyes, measured as any retinopathy and severe retinopathy); intraventricular haemorrhage (any and severe); periventricular leukomalacia (a type of white‐matter brain injury); necrotising enterocolitis (a condition where a portion of the bowel dies); chronic lung disease at 36 weeks' gestation; mortality to follow up; postnatal growth failure; and patent ductus arteriosus. We graded the quality of the evidence for these outcomes as low or very low.
Authors' conclusions
There is uncertainty as to whether initiating post birth resuscitation in preterm infants using lower (FiO2 < 0.4) or higher (FiO2 ≥ 0.4) oxygen concentrations, targeted to oxygen saturations in the first 10 minutes, has an important effect on mortality or major morbidity, intubation during post birth resuscitation, other resuscitation outcomes, and long‐term outcomes including neurodevelopmental disability. We assessed the quality of the evidence for all outcomes as low to very low. Further large, well designed trials are needed to assess the effect of using different initial oxygen concentrations and the effect of targeting different oxygen saturations.
PICO
Ringkasan bahasa mudah
Lebih rendah berbanding kepekatan oksigen yang lebih tinggi dititrasi ke sasaran saturasi oksigen semasa resusitasi bayi pramatang ketika dilahirkan
Latar belakang
Untuk bayi yang dilahirkan cukup bulan, penggunaan udara (21% oksigen) untuk resusitasi secara umumnya diterima baik dan boleh dikaitkan dengan hasil yang lebih baik. Bayi lahir pramatang (sebelum hamil 37 minggu ) memerlukan lebih banyak resusitasi selepas dilahirkan dan mempunyai lebih banyak masalah dalam penyesuaian terhadap kehidupan.
Soalan ulasan
Ulasan ini bertujuan untuk mengkaji sama ada penggunaan kepekatan oksigen yang lebih rendah atau yang lebih tinggi (diubahsuai berdasarkan saturasi oksigen bayi itu, atau peratusan tapak pengikatan hemoglobin yang diduduki oksigen dalam aliran darah) adalah lebih baik untuk resusitasi bayi pramatang, apabila digunakan dalam masa sepuluh minit yang pertama selepas kelahiran.
Keputusan
Kami sertakan sepuluh kajian dalam ulasan ini. Kajian‐kajian tersebut menyertakan sejumlah 914 bayi, yang sebahagian besar nya dilahirkan sebelum kehamilan 32 mingguj Ulasan ini mendapati tiada bukti tentang kesan daripada penggunaan kepekatan oksigen awal yang lebih rendah berbanding dengan yang lebih tinggi untuk sasaran saturasi oksigen bayi dalam kadar kematian semasa resusitasi atau hasil kesihatan bayi yang lain. Terdapat tiada perbezaan dalam kadar intubasi salur udara (penempatan satu tiub plastik yang fleksibel ke dalam salur udara) semasa resusitasi antara bayi‐bayi yang menerima kepekatan oksigen yang lebih rendah dan mereka yang menerima kepekatan oksigen yang lebih tinggi. Terdapat tidak cukup maklumat untuk menentukan kesan ke atas hasil jangka panjang termasuk kecacatan tumbesaran neuro (terbantut dari segi fizikal, pembelajaran, bahasa atau tingkah laku). Kita menilai kualiti bukti keseluruhan sebagai rendah kerana ketidakpastian dalam kesan‐kesan yang kami dapati dan juga kerana kami mempunyai kemusykilan tentang kaedah yang digunakan dalam banyak kajian. Bukti dalam kajian ini adalah terkini sehingga Oktober 2017.
Kesimpulan
Mengenai sasaran saturasi oksigen bayi, ia adalah tidak jelas lagi pada masa ini sama ada kepekatan oksigen awal yang digunakan dalam resuscitasi bayi pramatang memberikan sebarang kesan dalam jangka masa pendek atau panjang. Lebih banyak kajian yang melibatkan bayi pramatang semasa kelahiran serta menilai kedua‐dua kepekatan oksigen awal dan tahap saturasi oksigen yang terbaik ke sasaran diperlukan.
Authors' conclusions
Summary of findings
| Lower (FiO2 < 0.4) versus higher (FiO2 ≥ 0.4) oxygen concentrations titrated to oxygen saturations during resuscitation of preterm infants at birth | ||||||
| Patient or population: preterm infants | ||||||
| Outcomes | Illustrative comparative risks* (95% CI) | Relative effect | No of Participants | Quality of the evidence | Comments | |
| Assumed risk | Corresponding risk | |||||
| Control | Lower (FiO2 < 0.4) versus higher (FiO2 ≥ 0.4) oxygen concentration | |||||
| Mortality, near term corrected age or discharge | Study population | RR 1.05 | 914 | ⊕⊕⊝⊝ | Subgroup analyses: single study targeting lowest SpO2 < 85% reported increased mortality for infants resuscitated with air compared to 100% oxygen (Oei 2016). Meta‐analysis of 9 studies (627 infants) targeting lowest SpO2 85% to 90% found no difference in mortality. No subgroup differences according to inspired oxygen concentration strata, highest SpO2 limit, or gestational age. Quality of evidence downgraded due to risk of bias and imprecision. | |
| 76 per 1000 | 80 per 1000 | |||||
| Moderate | ||||||
| 68 per 1000 | 71 per 1000 | |||||
| Neurodevelopmental disability | Study population | RR 0.82 | 208 | ⊕⊕⊝⊝ | Subgroup analyses: both studies compared FiO2 ≥ 0.3 to < 0.4 versus FiO2 ≥ 0.6 to 1.0 and had a lowest SpO2 target 85 to 90%. Quality of evidence downgraded due to inconsistency and imprecision. | |
| 242 per 1000 | 199 per 1000 | |||||
| Moderate | ||||||
| 170 per 1000 | 139 per 1000 | |||||
| Intubation in the delivery room | Study population | RR 0.98 | 875 | ⊕⊕⊝⊝ | Subgroup analyses: no subgroup differences according to inspired oxygen concentration strata, lowest or highest SpO2 target, or gestational age. Quality of evidence downgraded due to risk of bias and imprecision. | |
| 352 per 1000 | 345 per 1000 | |||||
| Moderate | ||||||
| 386 per 1000 | 378 per 1000 | |||||
| Severe retinopathy of prematurity (≥ stage 3) | Study population | RR 0.57 | 453 | ⊕⊕⊝⊝ | Subgroup analyses: no subgroup differences according to inspired oxygen concentration strata, lowest SpO2 target, or gestational age. Quality of evidence downgraded due to risk of bias and imprecision. | |
| 58 per 1000 | 33 per 1000 | |||||
| Moderate | ||||||
| 70 per 1000 | 40 per 1000 | |||||
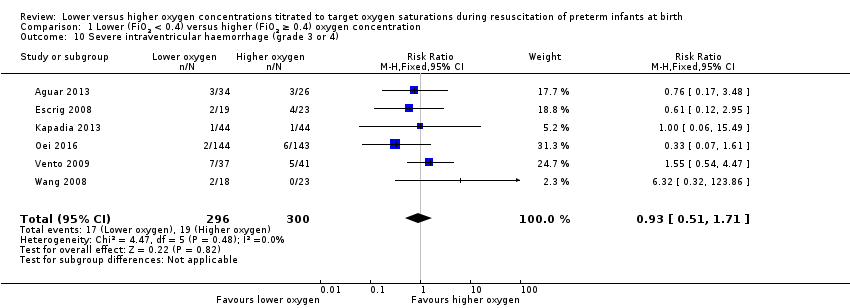
| Severe intraventricular haemorrhage (grade 3 or 4) | Study population | RR 0.93 | 596 | ⊕⊕⊝⊝ | Subgroup analyses: no subgroup differences according to inspired oxygen concentration strata, lowest or highest SpO2 target, or gestational age. Quality of evidence downgraded due to risk of bias and imprecision. | |
| 63 per 1000 | 59 per 1000 | |||||
| Moderate | ||||||
| 79 per 1000 | 73 per 1000 | |||||
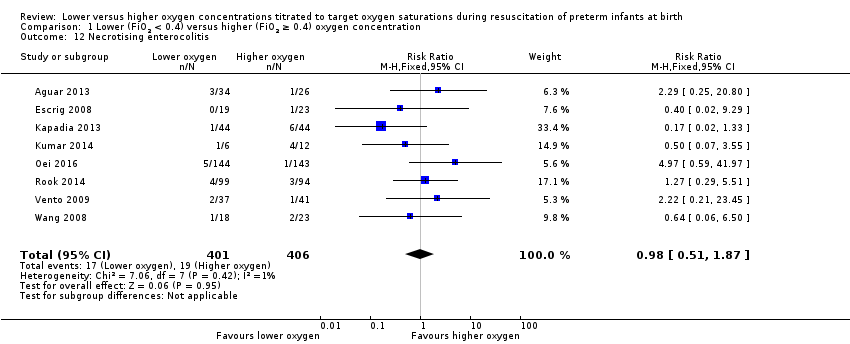
| Necrotising enterocolitis | Study population | RR 0.98 | 807 | ⊕⊕⊝⊝ | Subgroup analyses: no subgroup differences according to inspired oxygen concentration strata, lowest or highest SpO2 target, or gestational age. Quality of evidence downgraded due to risk of bias and imprecision. | |
| 47 per 1000 | 46 per 1000 | |||||
| Moderate | ||||||
| 41 per 1000 | 40 per 1000 | |||||
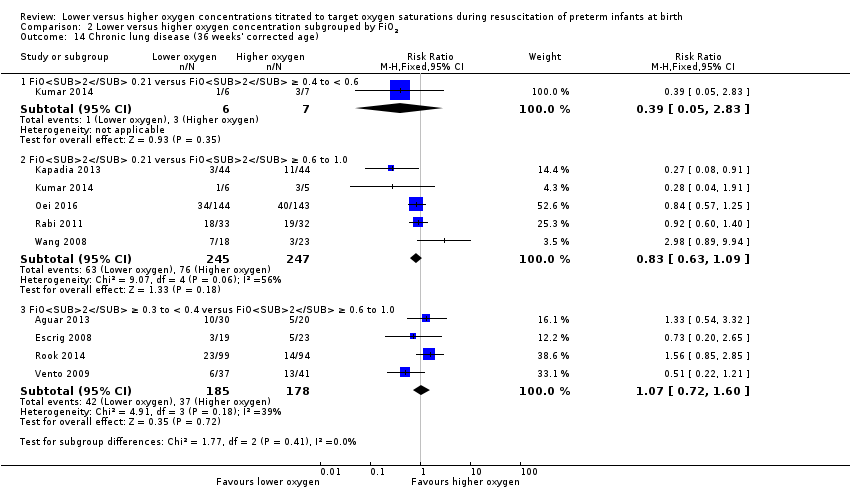
| Chronic lung disease (36 weeks' corrected age) | Study population | RR 0.91 | 862 | ⊕⊝⊝⊝ | Subgroup analyses: no subgroup differences according to inspired oxygen concentration strata, lowest or highest SpO2 target, or gestational age. Quality of evidence downgraded due to risk of bias, inconsistency and imprecision. | |
| 269 per 1000 | 244 per 1000 | |||||
| Moderate | ||||||
| 250 per 1000 | 228 per 1000 | |||||
| *The basis for the assumed risk (e.g. the median control group risk across studies) is provided in footnotes. The corresponding risk (and its 95% confidence interval) is based on the assumed risk in the comparison group and the relative effect of the intervention (and its 95% CI). | ||||||
| GRADE Working Group grades of evidence | ||||||
| 1 Two studies at low risk of bias. | ||||||
Background
Description of the condition
Until the past decade, 100% oxygen was recommended as the gas of choice for all full term and preterm infants requiring resuscitation at birth (O'Donnell 2006; Finer 2010). Oxygen has the potential for both beneficial and deleterious effects (Duc 1992). In the minutes after birth many preterm infants, particularly the very preterm, have lung pathology that often requires respiratory assistance and supplemental oxygen. Acute asphyxia can lead to brain hypoxia and ischaemia. These physiological processes can lead to death and morbidity (Perlman 2004). For example, intraventricular haemorrhage is now thought to be caused by capillary bleeding from an abrupt alteration in cerebral blood flow and pressure. Conversely, hyperoxia has also been found to slow cerebral blood flow in term and preterm infants (Niijima 1988). In addition, the antioxidant defence system is immature in preterm infants and they are more susceptible to the effects of free oxygen radical damage (Finer 2009; Finer 2010; Silvers 1998; Varsila 1995). Oxidative stress caused by free oxygen radicals is associated with significant injury to the brain, lungs, heart, eyes (Castillo 2008; Shiao 2006; Vento 2005), and neonatal bowel (Czyrko 1991). Oxygen free radicals are released during the recovery or reperfusion period and excessive oxidative stress can lead to further tissue damage in preterm infants, such as that seen in hypoxic‐ischaemic brain injury (du Plessis 1997), retinopathy of prematurity (ROP), chronic lung disease (CLD) (Finer 2009; Finer 2010), and cerebral palsy (CP) (Klinger 2005). CLD is a serious condition that results in chronic inflammation and fibrosis in the infant lung with recurring cycles of lung damage and repair that may impair alveolarization and vascularization in the developing lungs (Hayes 2010). ROP is characterised by abnormal retinal vascular development and remains a major cause of blindness and visual impairment despite improvements in neonatal care (Romagnoli 2009).
Description of the intervention
The aim of resuscitation is to prevent death and adverse long‐term neurodevelopmental sequelae (Davis 2004). Accumulating evidence over the last decade has challenged clinicians to reconsider the optimal oxygen concentration for resuscitation of the newborn term infant (Vento 2001; Vento 2002; Vento 2003; Vento 2005). A number of studies have compared varying concentrations of oxygen at resuscitation without targeting a predetermined oxygen saturation range in term infants (for example: Saugstad 1998 ‐ 21% versus 100%; Vento 2001 ‐ 21% versus 100%; Harling 2005 ‐ 50% versus 100%).
Several systematic reviews have compared the use of 100% and 21% oxygen during resuscitation of preterm and term infants (Davis 2004; Saugstad 2008; Tan 2005). A Cochrane review found a reduction in mortality in infants resuscitated with room air and no evidence of adverse effects (Tan 2005). However, more than a quarter of the infants randomised to 21% oxygen (room air) required supplemental oxygen. A planned subgroup analysis based on gestational age was not possible as the results of individual studies were not stratified by gestational age. One study similarly reported that the relative risk of mortality was less when 21% oxygen rather than 100% oxygen was used as the resuscitation gas (Saugstad 2008).
Recently there has been an increased interest in titrating oxygen concentrations according to oxygen saturation range. A randomised controlled trial studied oxidative stress in preterm infants who were resuscitated with 100% oxygen throughout the resuscitation (without oxygen saturation targeting) versus preterm infants who were initially given 100% oxygen and titrated according to a predetermined target oxygen saturation (90 to 95%) (Ezaki 2009). These authors concluded that oxidative stress may be reduced by titrating oxygen concentrations according to targeted oxygen saturations during resuscitation. An observational study compared preterm infants receiving 100% oxygen throughout the entire resuscitation with those that initially received 21% oxygen and then were titrated according to a predetermined target oxygen saturation (80% to 90%) (Dawson 2009). The authors also concluded that it is possible to adjust the fraction of inspired oxygen (FiO2) to keep peripheral oxygen saturation (SpO2) measurements within a targeted range during resuscitation. However, 92% of infants resuscitated with 21% oxygen required supplemental oxygen. Thus, this review assesses trials that have compared lower versus higher oxygen concentrations titrated to target oxygen saturations during resuscitation for preterm infants at birth.
How the intervention might work
The first minutes of transition from fetal to neonatal life require a unique adjustment from lower to higher environmental oxygen exposure. Oxygen saturations are lower in utero than ex utero, and the rate of change from fetal to neonatal values has been shown to be a more gradual process than we previously believed. The natural history of the transition from fetal to neonatal blood oxygen saturations has been documented to be a slow but steady increase in the first five to 10 minutes of life (Finer 2010). Fetal oxygen partial pressures (PaO2) are in the 15 mmHg to 30 mmHg range, resulting in a fetal SpO2 range of 45% to 55%. After delivery, these pressures will normally rise over the next few minutes to between 50 mmHg and 80 mmHg (Kamlin 2006; Rabi 2006), depending on the status of the lungs, the pulmonary circulation, and the presence of other stressors at delivery. It has been shown that the oxygen saturation of healthy preterm infants rises gradually after birth and only reaches 90% saturation readings by a median of seven minutes of life (Kamlin 2006; Rabi 2006). It is postulated that resuscitation with oxygen titrated on the basis of targeted saturations can mimic the oxygen saturations of transitioning preterm infants not needing resuscitation, with a resultant physiological rise of oxygen saturation. Thus, the goal of oxygen saturation targeting is to reduce total oxygen load while 'normal and adequate' oxygen saturation and tissue oxygenation is maintained. Pulse oximetry allows clinicians to continuously monitor and target oxygen saturations within a defined range (Duc 1992). Thus, rather than resuscitating infants with a predetermined oxygen concentration such as 100% or 21% throughout the resuscitation, it has been proposed that titrating oxygen concentrations, for example increasing the initial concentration from 21% oxygen or decreasing initial concentration from 100% according to a predetermined oxygen saturation range, helps prevent hypoxia or hyperoxia or oxidative stress in premature infants (Dawson 2009; Ezaki 2009; Finer 2009; Finer 2010).
Why it is important to do this review
The use of oxygen during the resuscitation of preterm infants has become an increasingly controversial issue (Perlman 2006). There is a growing body of evidence that resuscitation with air is well tolerated in most term infants (Perlman 2006; Tan 2005). However, the optimal oxygen concentration for preterm infants, who often have some element of pulmonary disease and usually require more intensive resuscitation, are less clear (Perlman 2006). The question as to whether lower or higher initial oxygen concentrations that are titrated according to oxygen saturation targets during the resuscitation of preterm infants at birth would lead to improved short‐ and long‐term mortality and morbidity remains unanswered. Therefore, it is currently difficult for clinicians to make informed decisions regarding the use of oxygen in preterm infants.
Objectives
To determine whether lower or higher initial oxygen concentrations, when titrated according to oxygen saturation targets during the resuscitation of preterm infants at birth, lead to improved short‐ and long‐term mortality and morbidity.
Primary comparison
-
Any of the lower concentrations of oxygen (21%, air; > 21% to 29%, very low; ≥ 30% to 39%, low) versus any of the higher concentrations of oxygen (≥ 40% to 59%, high; ≥ 60% to 100%, very high).
The primary comparison was analysed by the following subgroups:
-
targeted oxygen saturation (lower or higher limit for oxygen saturation target range for titration < 85%; 85% to 90%; 91% to 95%; > 95%);
-
type of oxygen saturation monitor (fractional or functional oxygen saturation);
-
gestation (< 28 weeks; 28 weeks to 32 weeks; 33 to 36 weeks).
Secondary analyses
We did not include studies comparing two oxygen concentrations considered to be either in the lower or the higher ranges in the primary analyses. We planned to perform secondary analyses for studies comparing two groups that were both in the lower, or higher, oxygen concentration range (for example, 50% versus 100%).
Methods
Criteria for considering studies for this review
Types of studies
We considered all published and unpublished randomised or quasi‐randomised trials, including cluster‐randomised trials.
Types of participants
Preterm infants < 37 weeks' gestation that required resuscitation at birth.
Types of interventions
Lower versus higher oxygen concentrations (fraction of inspired oxygen (FiO2) < 0.4 or FiO2 ≥ 0.4 as initial gas mixtures) to targeted oxygen saturation during resuscitation at birth. We did not include trials comparing different O2 saturation targets.
Both groups must have had the same targeted oxygen saturation.
Trials were eligible for inclusion if the intervention groups shared similar oxygenation saturation targeting at any time during resuscitation or during initial neonatal intensive care unit (NICU) admission (or both) for the first 30 minutes.
Types of outcome measures
Primary outcomes
-
Mortality, near term corrected or at discharge (latest reported).
-
Neurodevelopmental disability (after at least 18 months postnatal age):
-
-
neurological abnormality including cerebral palsy on clinical examination, developmental delay more than two standard deviations below population mean on any standard test of development;
-
blindness (visual acuity < 6/60);
-
deafness (any hearing impairment requiring amplification).
-
Secondary outcomes
Response to resuscitation
-
need for intermittent positive pressure ventilation (IPPV) in the delivery room;
-
need for intubation in the delivery room;
-
time to reach desired oxygen saturation target (seconds or minutes).
-
time to reach heart rate > 100 beats per minute (bpm) (seconds or minutes).
Neonatal outcomes
-
retinopathy of prematurity (ROP) (any; severe (stage ≥ 3));
-
intraventricular haemorrhage (IVH) (any; severe (stage ≥ 3)) according to Papile classification (Papile 1978);
-
periventricular leukomalacia (PVL) (cystic);
-
hypoxic ischaemic encephalopathy (HIE) Grade 1 to 3 (Sarnat 1976);
-
necrotising enterocolitis (proven = Bell stage ≥ 2) (Bell 1978);
-
chronic lung disease (need for supplemental oxygen at 28 days of life; need for supplemental oxygen at 36 weeks' postmenstrual age for infants born at or before 32 weeks' gestation);
-
duration of respiratory support (mechanical ventilation, continuous positive airway pressure (CPAP)) (days from birth);
-
duration of supplemental oxygen administration (days from birth);
-
late mortality (after at least 18 months postnatal age);
-
postnatal growth failure (weight < 10th percentile at discharge); and
-
duration of hospitalisation (days from birth).
Search methods for identification of studies
We used the standard search strategy of the Cochrane Neonatal Review Group (CNRG) as outlined in the Cochrane Library. See: Appendix 1.
Electronic searches
Two review authors performed the electronic database searches independently. This included electronic searches of the Cochrane Central Register of Controlled Trials (CENTRAL) (January 2017), Ovid MEDLINE (1946 to January 2017), Embase (1974 to January 2017) and CINAHL (1982 to January 2017). We updated these searches on 13 October 2017.
We searched MEDLINE, Embase and CINAHL for relevant articles using: (oxygen.mp. or exp oxygen/) AND (exp resuscitation/ or resuscitation.mp.) AND (exp prematurity/ or preterm.mp or premature.mp). Searches were limited to: MEDLINE ‐ humans and clinical trial, all; Embase ‐ human and (clinical trial or randomised controlled trial or controlled clinical trial or multicenter study or phase 1 clinical trial or phase 2 clinical trial or phase 3 clinical trial or phase 4 clinical trial).
MeSH terms "infant, newborn" or "infant, newborn diseases" or text term "neonat*" AND Resuscitation (explode) [MeSH heading] AND Oxygen (explode) [MeSH heading].
We searched clinical trials registries for current or recently completed trials (clinicaltrials.gov; controlled‐trials.com; who.int/ictrp).
Searching other resources
We also included in our search strategy communication with expert informants; searches of the bibliographies of reviews and trials for references to other trials; previous reviews including cross‐references; abstracts, and conferences and symposia proceedings of the Perinatal Society of Australia and New Zealand and Pediatric Academic Societies (American Pediatric Society, Society for Pediatric Research and European Society for Pediatric Research) from 1990 to 2016. We contacted the corresponding investigator for information if we identified any unpublished trial. We considered unpublished studies or studies only reported as abstracts as eligible for inclusion in the review if methods and data could be confirmed by the author. We also contacted the corresponding authors of identified RCTs for additional information about their studies when further data was required.
Data collection and analysis
We used the standard methods of Cochrane as documented in the Cochrane Handbook for Systematic Reviews of Interventions (Higgins 2011), and recommended by the Cochrane Neonatal Review Group.
Selection of studies
Two review authors (DO and LJ) independently screened titles and abstracts. Four review authors (KL, JF, DO, and LJ) independently assessed eligibility of all studies identified in the searches for inclusion in this review from full text. Any differences in opinion were resolved through discussion (KL, PD, DO).
Data extraction and management
Four review authors (KL, JF, LJ, DO) independently extracted data from the full‐text articles using a specifically designed spread sheet to manage the information. Any differences in opinion were resolved by discussion. We entered the data into Review Manager software (Review Manager 2014), and cross‐checked entries for accuracy. We sought unpublished data from several authors.
Assessment of risk of bias in included studies
We assessed risk of bias for each study using the criteria outlined in the Cochrane Handbook for Systematic Reviews of Interventions.
Review authors (KL, JF, DO and LJ) independently assessed the risk of bias of all included trials using the Cochrane ‘Risk of bias’ tool for the following domains (Higgins 2011):
-
sequence generation (selection bias);
-
allocation concealment (selection bias);
-
blinding of participants and personnel (performance bias);
-
blinding of outcome assessment (detection bias);
-
incomplete outcome data (attrition bias);
-
selective reporting (reporting bias);
-
any other bias.
For each domain, we assigned a judgement of high, low, or unclear risk of bias. We resolved any disagreements by discussion or by involving another assessor. See Appendix 2 for a more detailed description of risk of bias for each domain.
Measures of treatment effect
We analysed the results of the studies using the statistical package in Review Manager (Review Manager 2014). We summarised the data in a meta‐analysis if they were sufficiently homogeneous, both clinically and statistically.
Dichotomous data
We present results as risk ratios (RRs) and risk differences (RDs) with 95% confidence intervals (CIs) for dichotomous data. We intended to calculate the number needed to treat to benefit (NNTB), or number needed to harm (NNTH), and associated 95% CI if there was a statistically significant reduction (or increase) in RD.
Continuous data
We used the mean difference (MD) for continuous data when outcomes were measured in the same way between trials. We used the standardised mean difference (SMD) to combine trials that measured the same outcome but use different methods. Where trials reported continuous data as median and interquartile range(IQR) and data passed a test of skewness, we converted mean to median and estimated the standard deviation as IQR/1.35. Where trials reported medians and ranges we used the methods reported by Hozo 2005.
Unit of analysis issues
The unit of analysis was the participating infant in individually randomised trials. No cluster‐randomised trials were identified.
Cluster‐randomised trials
We planned to make adjustments to the standard errors using the methods described in the Cochrane Handbook for Systematic Reviews of Interventions (Higgins 2011 section 16.3.6) using an estimate of the intracluster correlation co‐efficient (ICC) derived from the trial (if possible), from a similar trial or from a study with a similar population. If we used ICCs from other sources, we planned to report this and conduct sensitivity analyses to investigate the effect of variation in the ICC. We consider it reasonable to combine the results from both cluster‐randomised trials and individually randomised trials if there is little heterogeneity between the study designs and the interaction between the effect of the intervention and the choice of randomisation unit is considered to be unlikely.
Dealing with missing data
We noted levels of attrition for included studies. We intended to explore the impact of including studies with high levels of missing data in the overall assessment of treatment effect by using sensitivity analysis. We carried out analyses for all outcomes, as far as possible, on an intention‐to‐treat basis, that is we attempted to include all participants randomised to each group in the analyses, and we analysed all participants in the group to which they were allocated regardless of whether or not they received the allocated intervention. The denominator for each outcome in each trial was the number randomised minus any participants whose outcomes were known to be missing.
Assessment of heterogeneity
We used Review Manager 5 to assess the heterogeneity of treatment effects between trials (Review Manager 2014). We used the Chi2 test to assess whether observed variability in effect sizes between studies is greater than would be expected by chance. Since this test has low power when the number of studies included in the meta‐analysis is small, we set the probability at the 10% level of significance.
We used the I2 statistic to ensure that pooling of data was valid. We considered a degree of heterogeneity less than 25% to represent no heterogeneity, 25% to 49% may represent minimal heterogeneity, 50% to 74% may represent moderate heterogeneity, and greater than 75% may represent substantial or high heterogeneity.
We assessed the source of the heterogeneity using sensitivity and subgroup analyses, looking for evidence of bias or methodological differences between trials where there is evidence of apparent or statistical heterogeneity.
Assessment of reporting biases
We assessed reporting bias by comparing the stated primary and secondary outcomes and reported outcomes. Where study protocols were available, we compared these to the full publications to determine the likelihood of reporting bias. We investigated reporting biases (such as publication bias) using funnel plots. We assessed funnel plot asymmetry visually; we did not use formal tests. We planned to perform exploratory analyses to investigate if asymmetry was detected by visual assessment.
Data synthesis
We carried out statistical analysis using Review Manager (Review Manager 2014). We used the fixed‐effect model inverse variance meta‐analysis for combining data where trials examined the same intervention and the populations and methods of the trials were judged to be similar. We intended to assess the possible source(s) of heterogeneity using subgroup and sensitivity analysis.
Quality of evidence
We used the GRADE approach, as outlined in the GRADE Handbook (Schünemann 2013), to assess the quality of evidence for the following (clinically relevant) outcomes:
-
mortality (near term corrected or at discharge (latest reported));
-
neurodevelopmental disability (after at least 18 months postnatal age);
-
intubation in the delivery room;
-
retinopathy of prematurity (severe, stage ≥ 3);
-
intraventricular haemorrhage (severe, stage ≥ 3);
-
necrotising enterocolitis (proven, = Bell stage ≥ 2);
-
chronic lung disease.
Two review authors independently assessed the quality of the evidence for each of the outcomes above. We considered evidence from randomised controlled trials as high quality but downgraded the evidence one level for serious (or two levels for very serious) limitations based upon the following: design (risk of bias), consistency across studies, directness of the evidence, precision of estimates, and presence of publication bias. We used GRADEpro GDT to create a ‘Summary of findings’ table to report the quality of the evidence (GRADEpro GDT).
The GRADE approach results in an assessment of the quality of a body of evidence according to one of the following grades.
-
High: we are very confident that the true effect lies close to that of the estimate of the effect.
-
Moderate: we are moderately confident in the effect estimate. The true effect is likely to be close to the estimate of the effect, but there is a possibility that it is substantially different.
-
Low: our confidence in the effect estimate is limited. The true effect may be substantially different from the estimate of the effect.
-
Very low: we have very little confidence in the effect estimate. The true effect is likely to be substantially different from the estimate of effect.
Subgroup analysis and investigation of heterogeneity
We planned to carry out the following subgroup analyses:
-
targeted oxygen saturation (low or high upper target limit for titration, < 85%; 85% to 90%; 91% to 95%; > 95%);
-
time taken to reach oxygen saturation target range (within first 10 minutes; within first 20 minutes; within first 30 minutes);
-
type of oxygen saturation monitor (fractional or functional oxygen saturation);
-
gestation (< 28 weeks; 28 to 32 weeks; 33 to 36 weeks).
Secondary analyses
We intended to undertake secondary analyses of studies in which infants in both the intervention and control arms were exposed to the same category (high or low) of supplemental oxygen (these studies were not included in the primary analyses).
Strategies for exploring heterogeneity
-
Identification of the methodological differences between studies
-
Subgroup analysis
-
Meta‐regression if enough data were available (Higgins 2011)
Sensitivity analysis
We explored methodological heterogeneity through the use of sensitivity analyses, where sufficient data were available. We performed sensitivity analyses through excluding trials of high risk of bias, based on a lack of any of the following: allocation concealment, adequate randomisation, blinding of treatment, less than 10% loss to follow‐up.
Results
Description of studies
Results of the search
Refer to Figure 1 for a flow diagram of searches. The combined searches of CENTRAL, MEDLINE and Embase returned 313 records. Additional databases (WHO, Maternity and Infant Care, PAS Abstracts, www.clinicaltrials.gov and www.controlledtrials.com) returned 66 records. We assessed 39 full‐text reports for eligibility, of which we excluded 12 studies (14 reports). We identified one study as ongoing, one study as awaiting assessment, and included 10 studies (23 reports) for analysis. This includes a report from our updated search on 13 October 2017, a single additional report of neurodevelopmental outcomes of two trials that are incorporated in the review (Aguar 2013; Rook 2014).
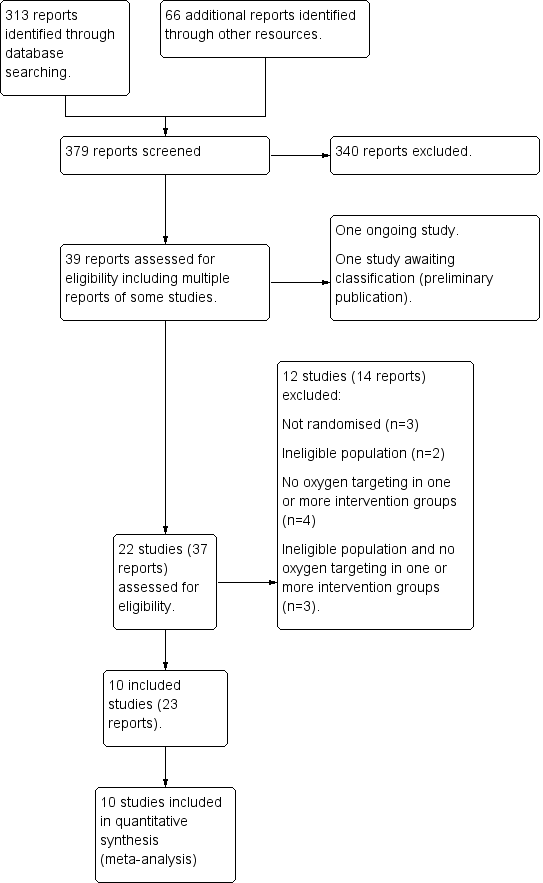
Study flow diagram.
Included studies
We identified 10 eligible trials studies comparing lower versus higher oxygen concentrations titrated to targeted oxygen saturations during resuscitation (Aguar 2013; Armanian 2012; Escrig 2008; Kapadia 2013; Kumar 2014; Oei 2016; Rabi 2011; Rook 2014; Vento 2009; Wang 2008). Refer to Characteristics of included studies for details.
Participants
The trials took place in a variety of perinatal treatment centres in the Netherlands, Spain, Iran, Qatar, Malaysia, Australia, USA and Canada within the last 12 years. A total of 914 infants participated. All 10 trials enrolled infants on the basis of preterm gestation corresponding to the following subgroups: extremely preterm (< 28 weeks' gestation) (Oei 2016; Aguar 2013); very preterm (28 to < 32 weeks' gestation) (Escrig 2008; Kumar 2014; Oei 2016; Rabi 2011; Rook 2014; Vento 2009); extremely to very preterm (24 to < 32 weeks' gestation) (Kapadia 2013; Wang 2008); and very preterm to preterm (28 to < 37 weeks' gestation) (Armanian 2012). Two studies excluded infants of unknown or uncertain gestational ages (Aguar 2013; Escrig 2008). No studies reported on preterm infants born at 32 to < 37 weeks. One study reported subgroups of extremely preterm (100 from 290 enrolled infants) and very preterm (10 from 19 enrolled infants) (Oei 2016). All ten trials included low birth weight infants, but only one trial enrolled infants on the basis of low birth weight ( ≤ 1250 g) if the precise gestational age was unclear (Oei 2016).
Interventions
Oxygen concentrations
A single study compared air (21% oxygen) with ≥ 40% to 60% (high) oxygen for resuscitation (Kumar 2014). Five studies compared air with 100% oxygen (Kapadia 2013; Kumar 2014; Oei 2016; Rabi 2011; Wang 2008). Five studies compared 30% to 40% oxygen with ≥ 60% to 100% (very high) oxygen: one compared 30% oxygen versus 60% oxygen (Aguar 2013); another compared 30% oxygen versus 100% oxygen (Armanian 2012); two studies compared 30% oxygen versus 90% oxygen (Escrig 2008; Vento 2009); and one study compared 30% oxygen versus 65% oxygen (Rook 2014).
Oxygen targeting
Oxygen saturation targeting criteria and timing varied among the included studies. In all ten studies, supplemental oxygen was adjusted to maintain the oxygen saturation (SpO2) above a prespecified lower limit. A lower limit of oxygen saturation target range < 85% was applied in five studies (Aguar 2013; Kapadia 2013; Oei 2016; Vento 2009; Wang 2008). A lower limit of oxygen saturation target range 85% to 90% was applied in eight studies (Aguar 2013; Armanian 2012; Escrig 2008; Kumar 2014; Rabi 2011; Rook 2014; Vento 2009; Wang 2008).
In seven studies (Escrig 2008; Kapadia 2013; Kumar 2014; Oei 2016; Rabi 2011; Rook 2014; Wang 2008), supplemental oxygen was adjusted to maintain the oxygen saturation below a prespecified upper limit in the first 10 minutes of life. Three studies did not prespecify an upper limit (Aguar 2013; Armanian 2012; Vento 2009). An upper limit of oxygen saturation target range 85% to 90% was applied in two studies (Escrig 2008; Wang 2008). An upper limit of oxygen saturation target range > 91% to 95% was applied in six studies (Kapadia 2013; Kumar 2014; Oei 2016; Rabi 2011; Rook 2014; Wang 2008).
Two studies reported oxygen targeting to different SpO2 ranges between lower and higher oxygen groups. One study, which compared 21% oxygen versus 100% oxygen, reported using interquartile values for healthy newborns for the lower limit in the low oxygen group and a lower limit of 85% in the high oxygen group (Kapadia 2013). The other study prespecified a lower limit of 80% to 85% at five minutes, then 85% to 90% after seven minutes, and an upper limit of ≤ 95% for the high oxygen group (Wang 2008).
Type of oximeter
Seven studies used functional oximeters: two studies used Masimo Radical (Escrig 2008; Kapadia 2013); four studies used Masimo Radical 7 Signal Extraction Technology (Kumar 2014; Oei 2016; Vento 2009; Wang 2008); and one study used Nellcor Oximax‐N‐600x (Rook 2014). Three studies did not describe the type of pulse oximeter used (Aguar 2013; Armanian 2012; Rabi 2011). No studies reported using the most recent model fractional or 'rainbow technology Co‐oximeters' described by Masimo.
Outcomes
See Characteristics of included studies for details of outcome reporting for each study.
Primary Outcomes
All ten studies reported mortality. Timing of reporting varied; five studies reported mortality before hospital discharge (Aguar 2013; Kapadia 2013; Rabi 2011; Oei 2016; Escrig 2008), four studies reported neonatal mortality < 28 days from birth (Escrig 2008; Oei 2016;Vento 2009; Wang 2008), two studies reported mortality at an unspecified period (Kumar 2014; Rook 2014), one study reported mortality in early infancy (Armanian 2012), and one study reported late mortality after 18 months postnatal age (Aguar 2013). Other primary outcomes were less commonly reported. Three studies reported neurodevelopmental disability after 18 months postnatal age (Aguar 2013; Escrig 2008; Rook 2014). Two studies provided combined data for this outcome (Aguar 2013; Rook 2014). The data were calculated separately for each study in this review and recombined in meta‐analysis. One study reported no difference in neuro sensorial dysfunction, but no data were provided (Escrig 2008). One study is yet to report the planned primary outcome of combined mortality or major disability (or both) at 18 to 24 months corrected age (Oei 2016).
Secondary outcomes
These were all incompletely reported. More commonly reported outcomes included intermittent positive pressure ventilation (IPPV) in the delivery room (five studies); intubation in the delivery room (eight studies), duration of respiratory support (seven studies), severe intraventricular haemorrhage (five studies), necrotising enterocolitis (six studies), and chronic lung disease (requiring oxygen at 36 weeks' postmenstrual age) (nine studies). Outcomes reported by a minority of studies included any retinopathy of prematurity (three studies), severe retinopathy of prematurity (four studies), duration of supplemental oxygen administration (three studies), all intraventricular haemorrhage (four studies), periventricular leukomalacia (three studies), late mortality at > 18 months (two studies), postnatal growth failure (weight < 10th percentile at discharge) (one study), and chronic lung disease (requiring oxygen at 28 postnatal days) (two studies). Duration of respiratory support was variably reported. Four studies reported separate data for duration of mechanical ventilation and duration of continuous positive airway pressure (CPAP) (Escrig 2008; Kapadia 2013; Vento 2009; Wang 2008), whilst two studies reported on duration of mechanical ventilation only (Rabi 2011; Rook 2014). One study included both mechanical ventilation and CPAP in their definition of respiratory support (Vento 2009), and one combined mechanical ventilation, CPAP, high‐ and low‐flow nasal cannula (Oei 2016).
Several continuous outcomes were reported as non‐parametric data requiring conversion to parametric data for inclusion in analyses. For duration of respiratory support, three studies reported median and interquartile range (IQR) (Escrig 2008; Rook 2014; Vento 2009), and three reported median and range (Kapadia 2013; Oei 2016; Rabi 2011). Two studies reported time taken to reach the desired oxygen saturation target (Aguar 2013; Escrig 2008), with Escrig 2008 reporting median and IQR. Three studies reported on the post hoc outcome 'time taken to reach a heart rate > 100 bpm (minutes)' (Aguar 2013; Armanian 2012; Escrig 2008), with Escrig 2008 reporting median and IQR. For duration of supplemental oxygen administration (days from birth), one study reported the data as mean and standard deviation (SD) (Aguar 2013), whilst two studies reported median and IQR (Rook 2014; Vento 2009). Three studies reported duration of hospitalisation (Aguar 2013; Kapadia 2013; Rabi 2011), with two studies reporting data as median and range (Kapadia 2013; Rabi 2011).
Excluded studies
We categorised 12 studies as excluded studies (Bajaj 2005; Dawson 2009; Ezaki 2009; Gandhi 2013; Harling 2005; Lundstrom 1995; Pope 2013; Ramji 1993; Ramji 2003; Saugstad 1998; Toma 2006; Toma 2007b). See Characteristics of excluded studies for reasons for exclusion.
Ongoing studies
We are awaiting data following completion of NCT01773746. Refer to Ongoing studies for details.
Studies awaiting classification
We are awaiting an English language translation of Toma 2007b. Refer to Studies awaiting classification for details.
Risk of bias in included studies
See 'Risk of bias' graph (Figure 2) and 'Risk of bias' summary (Figure 3).
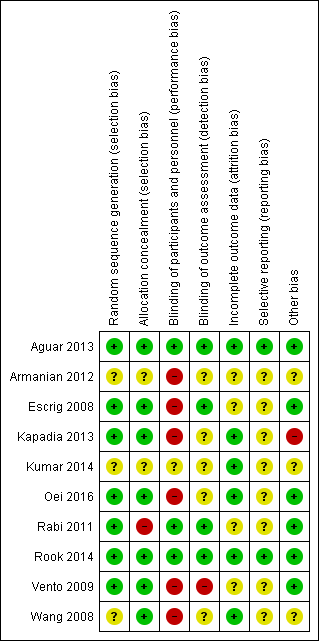
'Risk of bias' summary: review authors' judgements about each risk of bias item for each included study.

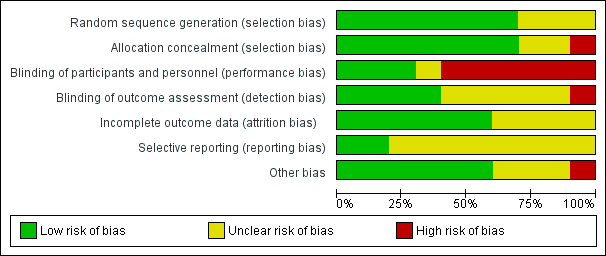
'Risk of bias' graph: review authors' judgements about each risk of bias item presented as percentages across all included studies.
Allocation
We assessed three studies as having unclear risk of selection bias as they did not report the method of sequence generation (Armanian 2012; Kumar 2014; Wang 2008). We assessed one study, Rabi 2011, as having high risk of bias due to lack of allocation concealment as they allowed consent to be obtained from parents after the intervention. Two studies were at unclear risk of selection bias due to lack of reporting of allocation concealment (Armanian 2012; Kumar 2014). We judged six studies as having low risk of selection bias overall (Aguar 2013; Escrig 2008; Kapadia 2013; Oei 2016; Rook 2014; Vento 2009), three studies as having unclear risk of bias (Armanian 2012; Kumar 2014; Wang 2008), and one as having high risk of bias (Rabi 2011).
Studies at unclear or high risk of selection bias have a relatively low weight in analyses of mortality (10.1%); intubation in the delivery room (15.4%); severe retinopathy of prematurity (7.7%); severe intraventricular haemorrhage (2.3%); necrotising enterocolitis (24.7%); and chronic lung disease at 36 weeks (22.8%). Neurodevelopmental disability was reported by a single study assessed as being at low risk of selection bias (Aguar 2013).
Blinding
Six studies did not report blinding of participants or personnel (Armanian 2012; Escrig 2008; Kapadia 2013; Oei 2016; Vento 2009; Wang 2008), and in one study the blinding was unclear (Kumar 2014). One study, Vento 2009, reported not blinding outcome assessment; and blinding was unclear in five (Armanian 2012; Kapadia 2013; Kumar 2014; Oei 2016; Wang 2008). Three studies reported adequate blinding of participants, personnel and outcome assessment and we judged these to have low risk of performance and detection bias (Aguar 2013; Rabi 2011; Rook 2014).
Studies at high or unclear risk of performance and detection bias were heavily weighted in analyses of mortality; intubation in the delivery room; severe retinopathy of prematurity; severe intraventricular haemorrhage; necrotising enterocolitis; and chronic lung disease. Neurodevelopmental disability was reported by two studies assessed as having low risk of performance and detection bias (Aguar 2013; Rook 2014). Outcomes such as intubation in the delivery room were likely to be at highest risk of bias from lack of blinding of personnel.
Incomplete outcome data
Four studies were at unclear risk of attrition bias, including: Armanian 2012 (losses not reported); Escrig 2008 (losses not reported); Rabi 2011 (unclear if 103 infants (49%) were excluded pre‐ or post‐randomisation); and Vento 2009 (18% of infants not resuscitated so 'lost to randomisation'; 2 infants not accounted for and 7 infants who died were not reported for other outcomes). We judged six studies to have low risk of attrition bias (Aguar 2013; Kapadia 2013; Kumar 2014; Oei 2016; Rook 2014; Wang 2008).
Studies that were at high or unclear risk of attrition bias have low to moderate weight in analyses of mortality (21.5%); intubation in the delivery room (39.3%); severe intraventricular haemorrhage (43.7%); necrotising enterocolitis (30%); and chronic lung disease (27.3%). Neurodevelopmental disability was reported by two studies assessed as having low risk of attrition bias (Aguar 2013; Rook 2014); and severe retinopathy of prematurity was reported by four studies which had low risk of bias (Aguar 2013; Kapadia 2013; Kumar 2014; Oei 2016).
Selective reporting
Eight studies were at unclear risk of reporting bias predominantly due to lack of protocol availability (Armanian 2012; Escrig 2008; Kapadia 2013; Kumar 2014; Oei 2016; Rabi 2011; Vento 2009; Wang 2008). We assessed three studies as having low risk of reporting bias (Aguar 2013; Rook 2014; Wang 2008).
Other potential sources of bias
We considered one study to have a substantial baseline difference between groups (breech presentation) (Kapadia 2013); and we assessed three studies as having unclear risk of bias due to some baseline differences or failure to adequately report baseline characteristics (Armanian 2012; Kumar 2014; Wang 2008).
Effects of interventions
Comparison 1. Lower (FiO2 < 0.4) versus higher (FiO2 ≥ 0.4) oxygen concentrations
Ten studies (962 infants) compared lower versus higher oxygen concentrations titrated to target oxygen saturations during resuscitation of preterm infants at birth (Aguar 2013; Armanian 2012; Escrig 2008; Kapadia 2013; Kumar 2014; Oei 2016; Rabi 2011; Rook 2014; Vento 2009; Wang 2008).
Primary Outcomes
Mortality, near term corrected or discharge (latest reported) (Analysis 1.1)
Our meta‐analysis showed no significant difference between lower (FiO2 < 0.4) or higher (FiO2 ≥ 0.4) oxygen groups (risk ratio (RR) 1.05, 95% CI 0.68 to 1.63; participants = 914; studies = 10; I2 = 11%). We graded the quality of evidence as low, due to risk of bias and imprecision of the estimate.
Neurodevelopmental disability (Analysis 1.2)
Our meta‐analysis showed no significant difference between lower (FiO2 < 0.4) or higher (FiO2 ≥ 0.4) oxygen groups (RR 0.82, 95% CI 0.49 to 1.35; participants = 208; studies = 2; I2 = 53%). We identified moderate heterogeneity in this analysis.
Secondary Outcomes
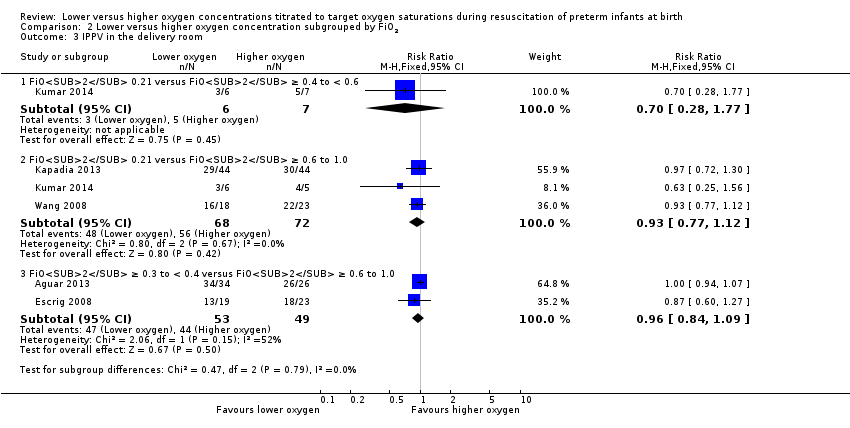
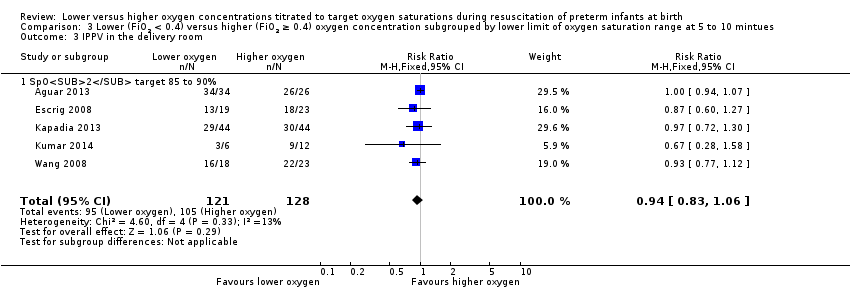
Intermittent positive pressure ventilation (IPPV) in the delivery room (Analysis 1.3)
Our meta‐analysis showed no significant difference in need for IPPV in the delivery room between lower (FiO2 < 0.4) or higher (FiO2 ≥ 0.4) oxygen groups (RR 0.94, 95% CI 0.83 to 1.06; participants = 249; studies = 5; I2 = 13%).
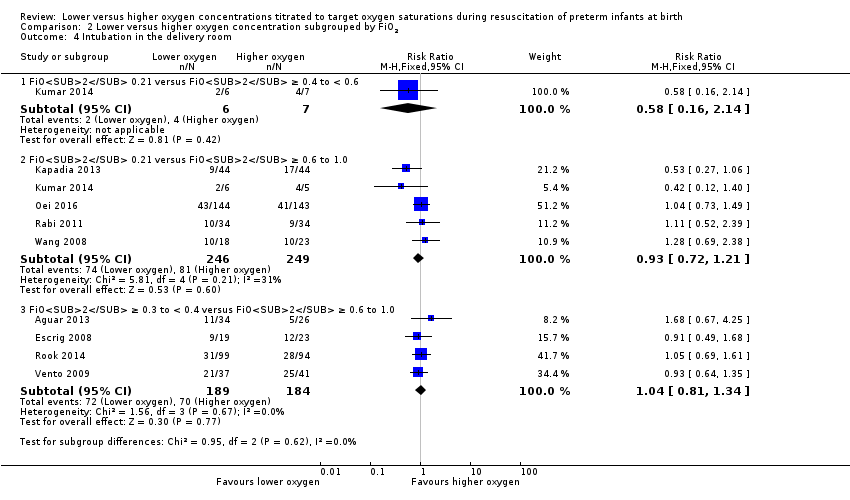
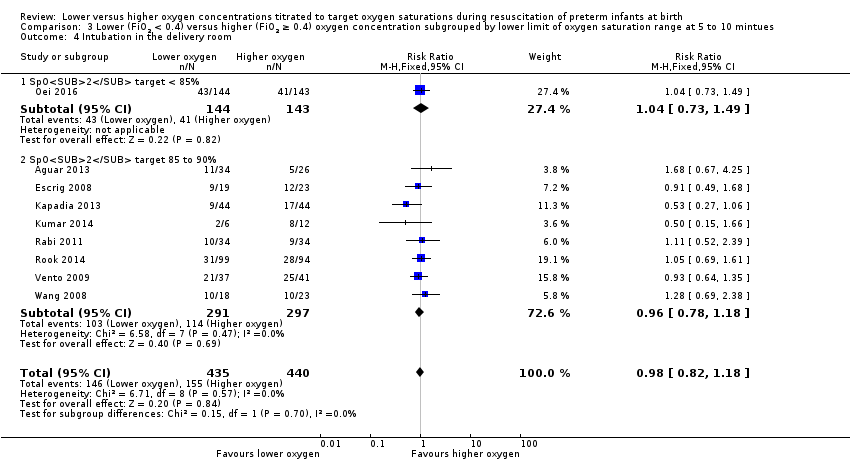
Intubation in the delivery room (Analysis 1.4)
Our meta‐analysis showed no significant difference in the need for intubation in the delivery room between lower (FiO2 < 0.4) or higher (FiO2 ≥ 0.4) oxygen groups (RR 0.98, 95% CI 0.82 to 1.18; participants = 875; studies = 9; I2 = 0%). We graded the quality of evidence as low, due to risk of bias and imprecision of the estimate.
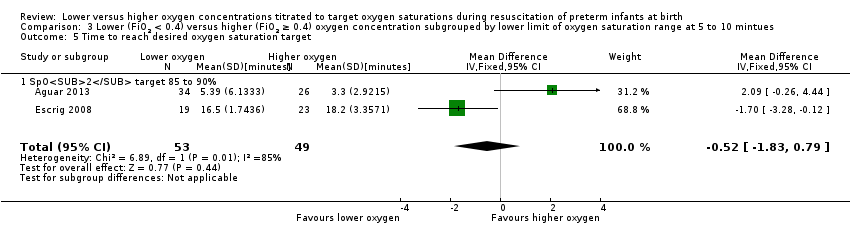
Time to reach desired oxygen saturation target (Analysis 1.5)
Our meta‐analysis showed no significant difference between lower (FiO2 < 0.4) or higher (FiO2 ≥ 0.4) oxygen groups (MD ‐0.52 minutes, 95% CI ‐1.83 to 0.79; participants = 102; studies = 2; I2 = 85%).
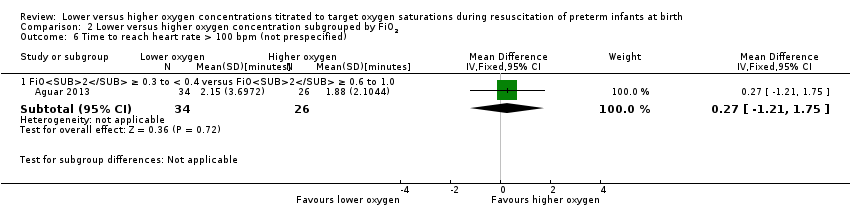
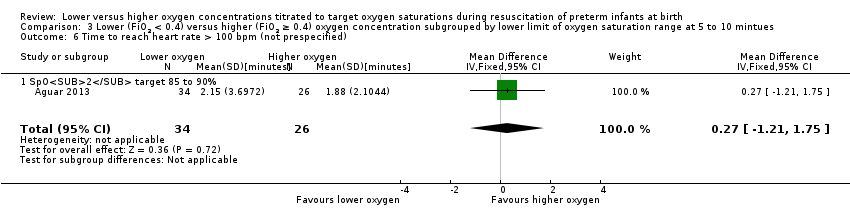
Time to reach heart rate > 100 beats per minute (not prespecified) (Analysis 1.6)
One study, Aguar 2013, reported no significant difference between lower (FiO2 < 0.4) or higher (FiO2 ≥ 0.4) oxygen groups (MD 0.27 minutes, 95% CI ‐1.21 to 1.75; participants = 60; I2 = 0%). One of the studies, Escrig 2008, reported data as median/interquartile range (IQR) and included additional criteria for time to response (SpO2 > 85% and good response to stimuli) so data from this study were not included in meta‐analysis This outcome is reported post hoc.
Retinopathy of prematurity (any) (Analysis 1.7)
Our meta‐analysis showed no significant difference between lower (FiO2 < 0.4) or higher (FiO2 ≥ 0.4) oxygen groups (RR 0.80, 95% CI 0.43 to 1.49; participants = 373; studies = 4; I2 = 0%).
Severe retinopathy of prematurity (≥ stage 3) (Analysis 1.8)
Our meta‐analysis showed no significant difference between lower (FiO2 < 0.4) or higher (FiO2 ≥ 0.4) oxygen groups (RR 0.57, 95% CI 0.24 to 1.36; participants = 453; studies = 4; I2 = 0%). We graded the quality of evidence as low, due to risk of bias and imprecision of the estimate.
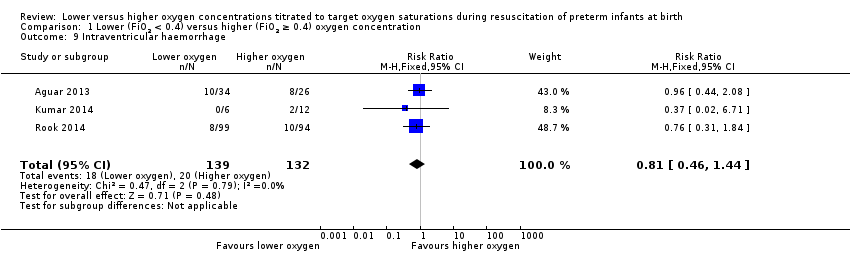
Intraventricular haemorrhage (IVH) (any) (Analysis 1.9)
Our meta‐analysis showed no significant difference between lower (FiO2 < 0.4) or higher (FiO2 ≥ 0.4) oxygen groups (RR 0.81, 95% CI 0.46 to 1.44; participants = 271; studies = 3; I2 = 0%).
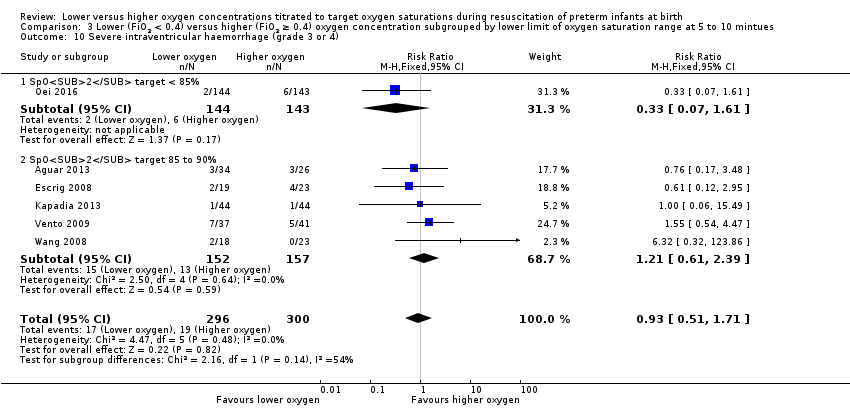
Severe intraventricular haemorrhage (IVH) (grade 3 or 4) (Analysis 1.10)
Our meta‐analysis showed no significant difference between lower (FiO2 < 0.4) or higher (FiO2 ≥ 0.4) oxygen groups (RR 0.93, 95% CI 0.51 to 1.71; participants = 596; studies = 6; I2 = 0%). No individual study reported a significant effect. We graded the quality of evidence as low, due to risk of bias and imprecision of the estimate.
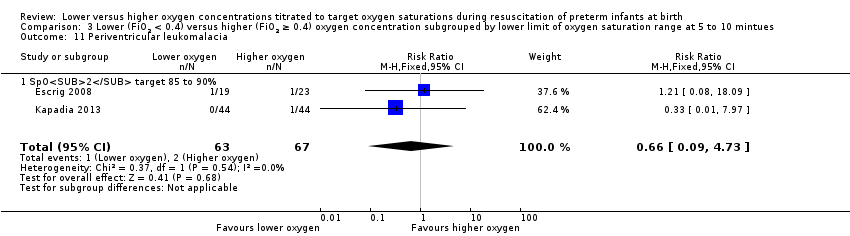
Periventricular leukomalacia (PVL) (Analysis 1.11)
Our meta‐analysis showed no significant difference between lower (FiO2 < 0.4) or higher (FiO2 ≥ 0.4) oxygen group (RR 0.66, 95% CI 0.09 to 4.73; participants = 130; studies = 2; I2 = 0%).
Hypoxic ischaemic encephalopathy
Not reported by any trial.
Necrotising enterocolitis (proven) (Analysis 1.12)
Our meta‐analysis showed no significant difference between lower (FiO2 < 0.4) or higher (FiO2 ≥ 0.4) oxygen groups (RR 0.98, 95% CI 0.51 to 1.87; participants = 807; studies = 8; I2 = 1%). We graded the quality of evidence as low, due to risk of bias and imprecision of the estimate.
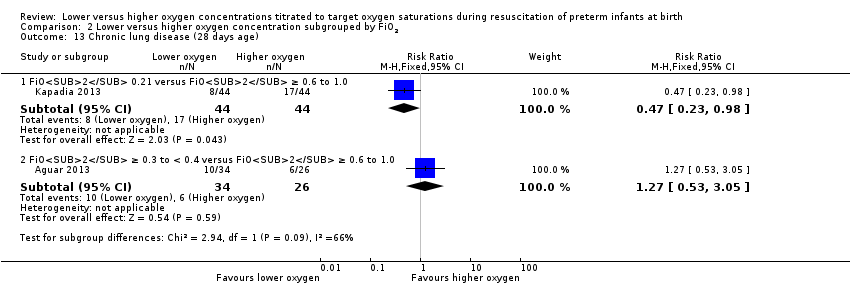
Chronic lung disease (28 days) (Analysis 1.13)
Our meta‐analysis showed no significant difference between lower (FiO2 < 0.4) or higher (FiO2 ≥ 0.4) oxygen groups (RR 0.70, 95% CI 0.41 to 1.21; participants = 148; studies = 2; I2 = 66%). We identified moderate heterogeneity in this analysis.
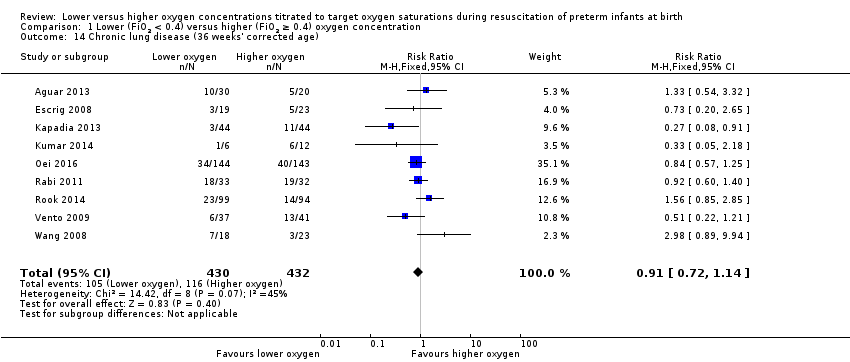
Chronic lung disease (36 weeks) (Analysis 1.14)
Our meta‐analysis showed no significant difference between lower (FiO2 < 0.4) or higher (FiO2 ≥ 0.4) oxygen groups (RR 0.91, 95% CI 0.72 to 1.14; participants = 862; studies = 9; I2 = 45%). We identified mimimal heterogeneity in this analysis. We graded the quality of evidence as low, due to risk of bias of included studies, lack of precision of the estimate and heterogeneity between studies detected in the analysis.
Duration of respiratory support (mechanical ventilation or CPAP ) (days from birth) (Analysis 1.15)
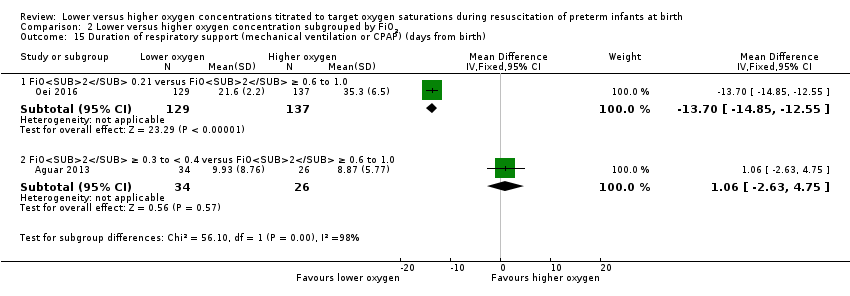
Our meta‐analysis showed infants who received lower (FiO2 < 0.4) oxygen had a shorter duration of respiratory support (mechanical ventilation or CPAP) compared to infants on higher oxygen (FiO2 ≥ 0.4) (MD ‐12.39, 95% CI ‐13.49 to ‐11.29; participants = 326; studies = 2; I2 = 98%). We identified high heterogeneity in this analysis.
Duration of respiratory support (mechanical ventilation) (days from birth) (Analysis 1.16)
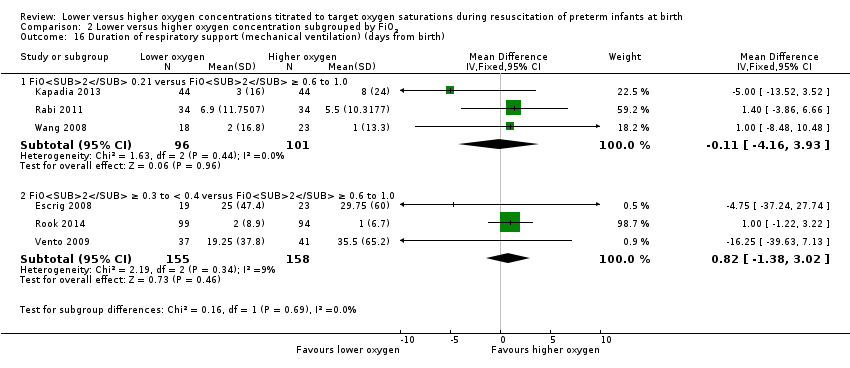
Our meta‐analysis showed no significant difference between lower (FiO2 < 0.4) or higher (FiO2 ≥ 0.4) oxygen groups (MD 0.61, 95% CI ‐1.33 to 2.54; participants = 510; studies = 6; I2 = 0%). This outcome was included post hoc.
Duration of respiratory support (continuous positive airway pressure (CPAP)) (days from birth) (Analysis 1.17)
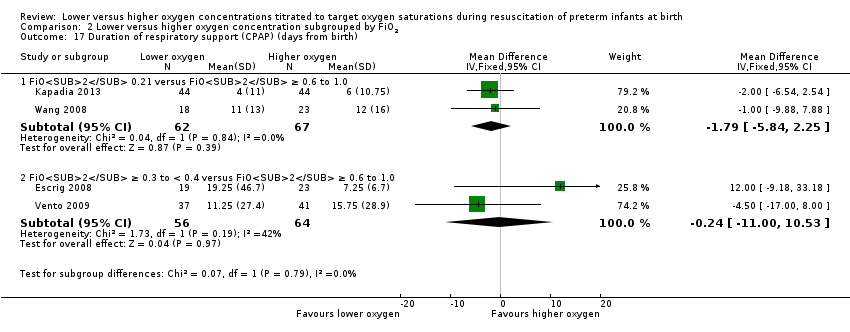
Our meta‐analysis showed no significant difference between lower (FiO2 < 0.4) or higher (FiO2 ≥ 0.4) oxygen groups (MD ‐1.60, 95% CI ‐5.39 to 2.19; participants = 249; studies = 4; I2 = 0%) This outcome was included post hoc.
Duration of supplemental oxygen administration (days) (Analysis 1.18)
Our meta‐analysis showed infants allocated to the lower oxygen group (FiO2 < 0.4) had a shorter duration of supplemental oxygen administration compared to infants allocated to the higher oxygen (FiO2 ≥ 0.4) group (MD 9.23 days, 95% CI 6.52 to 11.95; participants = 639; studies = 5; I2 = 79%). We identified high heterogeneity in this analysis.
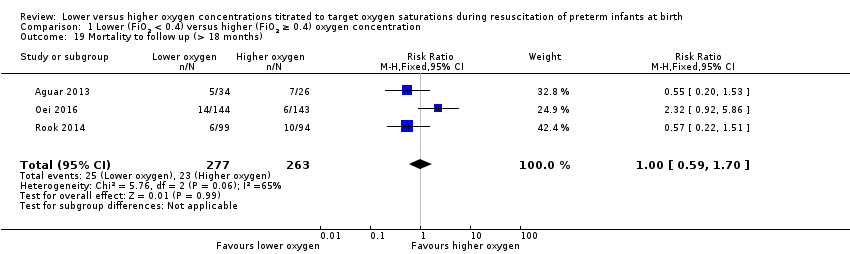
Mortality to follow‐up (> 18 months) (Analysis 1.19)
Our meta‐analysis showed no significant difference between lower (FiO2 < 0.4) or higher (FiO2 ≥ 0.4) oxygen groups (RR 1.00, 95% CI 0.59 to 1.70; participants = 540; studies = 3; I2 = 65%).
Postnatal growth failure (weight < 10th percentile at discharge) (Analysis 1.20)
One study, Aguar 2013, reported no significant difference between lower (FiO2 < 0.4) or higher (FiO2 ≥ 0.4) oxygen groups (RR 0.86, 95% CI 0.55 to 1.33; participants = 60).
Duration of hospitalisation (days) (Analysis 1.21)
Our meta‐analysis showed no significant difference between lower (FiO2 < 0.4) or higher (FiO2 ≥ 0.4) oxygen groups (MD ‐1.75, 95% CI ‐12.22 to 8.71; participants = 216; studies = 3; I2 = 33%).
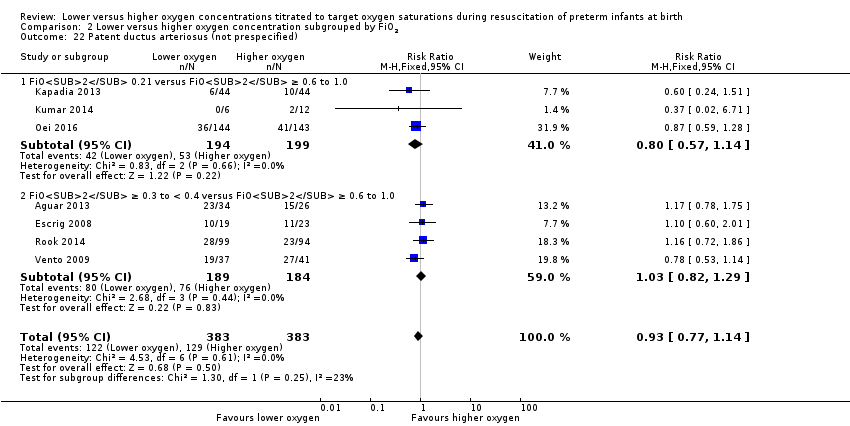
Patent ductus arteriosus (not prespecified) (Analysis 1.22)
Our meta‐analysis showed no significant difference between lower (FiO2 < 0.4) or higher (FiO2 ≥ 0.4) oxygen groups (RR 0.93, 95% CI 0.77 to 1.14; participants = 766; studies = 7; I2 = 0%).
Subgroup analyses (Appendix 3)
The following subgroup comparisons are appended in Appendix 3:
Comparison 2. Lower (FiO2 < 0.4) versus higher (FiO2 ≥ 0.4) oxygen concentrations subgrouped by FiO2
Comparison 3. Lower (FiO2 < 0.4) versus higher (FiO2 ≥ 0.4) oxygen concentration subgrouped by lower limit of oxygen saturation target range at 5 to 10 minutes
Comparison 4. Lower versus higher oxygen concentrations — subgrouped by higher limit of oxygen saturation target range at 5 to 10 minutes
Comparison 5. Lower versus higher oxygen concentrations — subgrouped by gestational age
Comparison 6. Lower (FiO2 < 0.4) versus higher (FiO2 ≥ 0.4) oxygen concentration — sensitivity analysis
Discussion
Summary of main results
Mortality and neurodevelopment
Overall, our meta‐analysis of 10 studies (with a total of 914 infants) showed no difference in mortality to discharge. We downgraded our assessment of the quality of evidence to low, due to risk of bias and imprecision. We found no subgroup differences according to inspired oxygen concentration strata. However we did find a significant subgroup difference in mortality according to lower limit of oxygen saturation target range at 5 to 10 minutes' age. A single study targeting lowest oxygen saturation (SpO2) < 85% reported increased mortality for infants resuscitated with air compared to those resuscitated with 100% oxygen (Oei 2016), whereas meta‐analysis of nine studies (627 infants) targeting lowest SpO2 85% to 90% showed no difference in mortality. We found no subgroup differences according to higher limit of SpO2 target range or gestational age (≤ 28 weeks versus > 28 weeks to 32 weeks).
Meta‐analysis of two studies (208 infants) showed no difference in neurodevelopmental disability at 18 to 24 months of age. Both studies compared fractional inspired oxygen (FiO2) ≥ 0.3 to < 0.4 versus FiO2 ≥ 0.6 to 0.65 and had a lowest SpO2 target of 85% to 90%. We assessed the quality of evidence as low, due to inconsistency and imprecision.
Response to resuscitation
We found no overall difference in use of intermittent positive pressure ventilation or intubation in the delivery room for infants receiving lower versus higher oxygen concentrations. For intubation, subgroup analyses showed no differences between groups according to inspired oxygen concentration strata, lowest or highest SpO2 target, or gestational age. We downgraded our assessment of the quality of evidence to low, due to risk of bias and imprecision. There were limited data that reported time to reach desired oxygen saturation target or heart rate, with no significant differences identified.
Neonatal outcomes
We found no difference between use of lower versus higher concentrations of oxygen for the following outcomes: any retinopathy, severe retinopathy (low‐quality evidence), any intraventricular haemorrhage (IVH), severe IVH (low‐quality evidence), periventricular leukomalacia, necrotising enterocolitis (low‐quality evidence), chronic lung disease at 28 days or 36 weeks' gestation (very low‐quality evidence), postnatal growth failure, duration of hospitalisation, or patent ductus arteriosus. There were also no significant subgroup differences for these neonatal outcomes according to inspired oxygen concentration strata, lowest SpO2 target, highest SpO2 target, and gestational age strata (≤ 28 weeks versus > 28 weeks to 32 weeks).
Studies reported duration of respiratory support as various combinations of mechanical ventilation, continuous positive airway pressure (CPAP), and high‐flow nasal cannula (HFNC). This resulted in difficulty pooling data. For our prespecified outcome, duration of positive pressure respiratory support (mechanical ventilation or CPAP), there was a mean reduction of 12.4 days (95% CI 11.3 to 13.5 days) through use of lower versus higher oxygen concentration, though this was only reported by a minority of studies (two studies, 326 infants). For outcomes that were not prespecified by this review, we found no difference in duration of mechanical ventilation (which was reported by six studies including 510 infants) or duration of CPAP (which was reported by four studies including 249 infants). There was an mean +9.2 day (95% CI 6.5 to 12.0 day) increase in duration of supplemental oxygen administration, which was reported by five studies including 639 infants. We identified high levels of heterogeneity in the analyses of duration of respiratory support and duration of supplemental oxygen. Subgroup analyses showed a decreased duration of respiratory support (mechanical ventilation or CPAP), but an increased duration of supplemental oxygen, from use of low oxygen concentrations. This was attributable to a single study (Oei 2016), which compared inspired oxygen concentrations of 0.21 versus 1.0 and had a lower SpO2 target < 85% at 5 to 10 minutes.
Overall completeness and applicability of evidence
We included ten trials that reported outcomes for 914 infants in this review. The majority of included infants were of extreme preterm gestation, with subgroup analysis of mortality including 516 infants ≤ 28 weeks' gestation and 316 infants of 28 to 32 weeks' gestation.
The trials compared various oxygen concentrations for resuscitation. The common comparisons were air versus 100% oxygen, reported by five studies (Kapadia 2013; Kumar 2014; Oei 2016; Rabi 2011; Wang 2008). A single study compared air with 40% oxygen (Kumar 2014). Five studies used various supplemental oxygen concentrations in both groups: 30% versus 60% oxygen (Aguar 2013); 30% oxygen versus 65% oxygen (Rook 2014); 30% oxygen versus 90% oxygen (Escrig 2008; Vento 2009); and 30% oxygen versus 100% oxygen (Armanian 2012).
All trials reported mortality. Although no significant difference was found between lower (FiO2 < 0.4) versus higher (FiO2 ≥ 0.4) oxygen concentrations overall, the analysis lacks precision so is underpowered to detect an important effect. In addition, a subgroup analysis identified a single study (Oei 2016) targeting a lower limit of oxygen saturation range of < 85% that reported increased mortality in the air group compared to the 100% oxygen group. There were no other significant subgroup effects for mortality according to SpO2 target or gestational strata (≤ 28 weeks or 28 to 32 weeks' gestation).
Reporting of other outcomes was variable among trials and not consistently reported in the same manner. Only two trials reported on neurodevelopmental disability in 208 infants. There were no significant differences in long‐term effects of using lower versus higher oxygen concentrations.
Among hospital outcomes, intubation in the delivery room was reported by nine trials including 875 infants, with no significant difference between groups found. Other commonly reported outcomes were severe Intraventricular haemorrhage (IVH) (6 studies, 596 infants), necrotising enterocolitis (8 studies, 807 infants) and chronic lung disease at 36 weeks (9 studies, 862 infants). All other prespecified outcomes were reported by a minority of studies.
Duration of specific types of respiratory support was reported variably by studies. Only two studies reported our prespecified outcome (mechanical ventilation and CPAP). Duration of mechanical ventilation, duration of CPAP and duration of supplemental oxygen were more commonly reported. There was a high level of heterogeneity between studies of the effect of differing oxygen concentrations on duration of respiratory support (mechanical ventilation and CPAP) in the meta‐analysis. A high level of heterogeneity was also present in the analysis of duration of supplemental oxygen administration. A single study reported a reduction in duration of respiratory support (mechanical ventilation and CPAP) but an increase in duration of supplemental oxygen (Oei 2016). No difference was found in analyses of duration of mechanical ventilation or duration of CPAP, or chronic lung disease at 36 weeks. As effects on duration of respiratory support and duration of supplemental oxygen administration are largely limited to a single study, the results should be treated with caution.
Quality of the evidence
We graded the quality of the evidence as 'low' or 'very low' for all prespecified GRADE rated outcomes. We downgraded our assessment of the quality of evidence for mortality to discharge as only two of 10 studies were at low risk of bias and had sufficiently precise estimates. Common methodological concerns were unclear or high risk of selection bias (four studies) and lack of blinding of intervention (five studies). Two studies reported neurodevelopment in 208 infants; we downgraded our assessment of the quality of this evidence due to inconsistency (moderate heterogeneity, I2 = 53%) and imprecision. There was also inconsistency (high heterogeneity, I2 > 75%) in analyses of duration of respiratory support (mechanical ventilation and CPAP) and duration of supplemental oxygen. Subgroup analyses identified the heterogeneity could be due to differences between studies in inspired oxygen concentrations, or differences in the lowest SpO2 target ranges (or both). Two studies, which reported outcomes of 253 infants, were at low risk of bias and were included in sensitivity analyses (Aguar 2013; Rook 2014). The studies reported no significant differences in mortality to discharge, neurodevelopmental disability, outcomes relating to response to resuscitation and multiple neonatal morbidities. Given the findings of the sensitivity analyses, it is possible observed differences between lower and high oxygen concentration groups in specific analyses were due to bias.
Potential biases in the review process
In this review we prespecified inclusion criteria, performed an extensive search of the literature (supplemented by searches of conference abstracts and expert informants), independently and reproducibly assessed eligibility, assessed risk of bias, extracted data and graded the quality of evidence. We resolved differences by discussion. There were difficulties in extracting data for prespecified respiratory support outcomes, duration of respiratory support, duration of supplemental oxygen and duration of hospitalisation, as the reporting in the majority of trials was not compatible. Data were variably reported as means (standard deviation (SD)), median and range or interquartile range. We converted non‐parametric data to mean (SD) for inclusion in analyses. These data should be treated with caution as means (SD) were estimated and could be affected by data skew.
Agreements and disagreements with other studies or reviews
An earlier systematic review of randomised controlled trials, by Brown and colleagues (Brown 2012b), assessed the effect of lower (FiO2 21% to 50%) versus higher (FiO2 > 50%) oxygen concentrations for delivery room support of preterm infants. Six trials enrolling 484 infants were identified. Most participants were born before 32 weeks' gestation. Meta‐analyses showed a significant reduction in death (RR 0.65, 95% CI 0.43 to 0.98). However, no effect was found when analysis was limited to the four trials with adequate allocation concealment (RR 1.0, 95% CI 0.45 to 2.24).
A recent systematic review of infants born ≤ 28 weeks and six days' gestation randomised to resuscitation with low (FiO2 ≤ 0.3) versus high (FiO2 ≥ 0.6) oxygen at delivery identified 504 infants enrolled in eight studies (Oei 2017). Meta‐analyses found no difference in bronchopulmonary dysplasia (RR 0.88, 95% CI 0.68 to 1.14), intraventricular haemorrhage (RR 0.81, 95% CI 0.52 to 1.27), retinopathy of prematurity (RR 0.82, 95% CI 0.46 to 1.46), patent ductus arteriosus (RR 0.95, 95% CI 0.80 to 1.14) and necrotising enterocolitis (RR 1.61, 95% CI 0.67 to 3.36) and overall mortality (RR 0.99, 95% CI 0.52 to 1.91). The review reported mortality was lower in low oxygen arms of masked studies (RR 0.46, 95% CI 0.23 to 0.92; P = 0.03) and higher in low oxygen arms of unmasked studies (RR 1.94 95% CI 1.02 to 3.68, P = 0.04).
This review has been cross‐checked against Oei 2017, for data accuracy. The conclusion of the review by Oei and colleagues was a finding of no difference in risk of death or other morbidity after resuscitation is initiated at delivery with lower (≤ 0.3) or higher (≥ 0.6) oxygen concentrations (Oei 2017). The need for larger, well designed studies was identified.
A recent systematic review of RCTs that enrolled babies born < 28 weeks’ gestation, at birth or soon thereafter, and targeted SpO2 ranges of either ≤ 90% or > 90% found targeting lower compared to higher SpO2 had no significant effect on the composite outcome of death or major disability or on major disability alone, but increased the average risk of mortality by 28 per 1000 infants treated (Askie 2017). However, the findings are not directly applicable to resuscitation, since three trials enrolled infants < 24 hours' age, one trial infants < 12 hours' age and one trial required infants to be enrolled by 2 hours of age.

Study flow diagram.

'Risk of bias' summary: review authors' judgements about each risk of bias item for each included study.
'Risk of bias' graph: review authors' judgements about each risk of bias item presented as percentages across all included studies.

Comparison 1 Lower (FiO2 < 0.4) versus higher (FiO2 ≥ 0.4) oxygen concentration, Outcome 1 Mortality near term corrected age or discharge (latest reported) subgrouped by inspired oxygen concentration.

Comparison 1 Lower (FiO2 < 0.4) versus higher (FiO2 ≥ 0.4) oxygen concentration, Outcome 2 Neurodevelopmental disability.

Comparison 1 Lower (FiO2 < 0.4) versus higher (FiO2 ≥ 0.4) oxygen concentration, Outcome 3 IPPV in the delivery room.

Comparison 1 Lower (FiO2 < 0.4) versus higher (FiO2 ≥ 0.4) oxygen concentration, Outcome 4 Intubation in the delivery room.

Comparison 1 Lower (FiO2 < 0.4) versus higher (FiO2 ≥ 0.4) oxygen concentration, Outcome 5 Time to reach desired oxygen saturation target.

Comparison 1 Lower (FiO2 < 0.4) versus higher (FiO2 ≥ 0.4) oxygen concentration, Outcome 6 Time to reach heart rate > 100 bpm (not prespecified).

Comparison 1 Lower (FiO2 < 0.4) versus higher (FiO2 ≥ 0.4) oxygen concentration, Outcome 7 Retinopathy of prematurity.

Comparison 1 Lower (FiO2 < 0.4) versus higher (FiO2 ≥ 0.4) oxygen concentration, Outcome 8 Severe retinopathy of prematurity (≥ stage 3).
Comparison 1 Lower (FiO2 < 0.4) versus higher (FiO2 ≥ 0.4) oxygen concentration, Outcome 9 Intraventricular haemorrhage.
Comparison 1 Lower (FiO2 < 0.4) versus higher (FiO2 ≥ 0.4) oxygen concentration, Outcome 10 Severe intraventricular haemorrhage (grade 3 or 4).

Comparison 1 Lower (FiO2 < 0.4) versus higher (FiO2 ≥ 0.4) oxygen concentration, Outcome 11 Periventricular leukomalacia.
Comparison 1 Lower (FiO2 < 0.4) versus higher (FiO2 ≥ 0.4) oxygen concentration, Outcome 12 Necrotising enterocolitis.

Comparison 1 Lower (FiO2 < 0.4) versus higher (FiO2 ≥ 0.4) oxygen concentration, Outcome 13 Chronic lung disease (28 days' age).
Comparison 1 Lower (FiO2 < 0.4) versus higher (FiO2 ≥ 0.4) oxygen concentration, Outcome 14 Chronic lung disease (36 weeks' corrected age).

Comparison 1 Lower (FiO2 < 0.4) versus higher (FiO2 ≥ 0.4) oxygen concentration, Outcome 15 Duration of respiratory support (mechanical ventilation or CPAP) (days from birth).

Comparison 1 Lower (FiO2 < 0.4) versus higher (FiO2 ≥ 0.4) oxygen concentration, Outcome 16 Duration of respiratory support (mechanical ventilation) (days from birth).

Comparison 1 Lower (FiO2 < 0.4) versus higher (FiO2 ≥ 0.4) oxygen concentration, Outcome 17 Duration of respiratory support (CPAP) (days from birth).

Comparison 1 Lower (FiO2 < 0.4) versus higher (FiO2 ≥ 0.4) oxygen concentration, Outcome 18 Duration of supplemental oxygen administration.
Comparison 1 Lower (FiO2 < 0.4) versus higher (FiO2 ≥ 0.4) oxygen concentration, Outcome 19 Mortality to follow up (> 18 months).

Comparison 1 Lower (FiO2 < 0.4) versus higher (FiO2 ≥ 0.4) oxygen concentration, Outcome 20 Postnatal growth failure (weight < 10th percentile at discharge).

Comparison 1 Lower (FiO2 < 0.4) versus higher (FiO2 ≥ 0.4) oxygen concentration, Outcome 21 Duration of hospitalisation (days).

Comparison 1 Lower (FiO2 < 0.4) versus higher (FiO2 ≥ 0.4) oxygen concentration, Outcome 22 Patent ductus arteriosus (not prespecified).

Comparison 2 Lower versus higher oxygen concentration subgrouped by FiO2, Outcome 1 Mortality near term corrected age or discharge (latest reported) subgrouped by inspired oxygen concentration.

Comparison 2 Lower versus higher oxygen concentration subgrouped by FiO2, Outcome 2 Neurodevelopmental disability.
Comparison 2 Lower versus higher oxygen concentration subgrouped by FiO2, Outcome 3 IPPV in the delivery room.
Comparison 2 Lower versus higher oxygen concentration subgrouped by FiO2, Outcome 4 Intubation in the delivery room.

Comparison 2 Lower versus higher oxygen concentration subgrouped by FiO2, Outcome 5 Time to reach desired oxygen saturation target.
Comparison 2 Lower versus higher oxygen concentration subgrouped by FiO2, Outcome 6 Time to reach heart rate > 100 bpm (not prespecified).

Comparison 2 Lower versus higher oxygen concentration subgrouped by FiO2, Outcome 7 Retinopathy of prematurity.

Comparison 2 Lower versus higher oxygen concentration subgrouped by FiO2, Outcome 8 Severe retinopathy of prematurity (≥ stage 3).

Comparison 2 Lower versus higher oxygen concentration subgrouped by FiO2, Outcome 9 Intraventricular haemorrhage.

Comparison 2 Lower versus higher oxygen concentration subgrouped by FiO2, Outcome 10 Severe intraventricular haemorrhage (grade 3 or 4).

Comparison 2 Lower versus higher oxygen concentration subgrouped by FiO2, Outcome 11 Periventricular leukomalacia.

Comparison 2 Lower versus higher oxygen concentration subgrouped by FiO2, Outcome 12 Necrotising enterocolitis.
Comparison 2 Lower versus higher oxygen concentration subgrouped by FiO2, Outcome 13 Chronic lung disease (28 days age).
Comparison 2 Lower versus higher oxygen concentration subgrouped by FiO2, Outcome 14 Chronic lung disease (36 weeks' corrected age).
Comparison 2 Lower versus higher oxygen concentration subgrouped by FiO2, Outcome 15 Duration of respiratory support (mechanical ventilation or CPAP) (days from birth).
Comparison 2 Lower versus higher oxygen concentration subgrouped by FiO2, Outcome 16 Duration of respiratory support (mechanical ventilation) (days from birth).
Comparison 2 Lower versus higher oxygen concentration subgrouped by FiO2, Outcome 17 Duration of respiratory support (CPAP) (days from birth).

Comparison 2 Lower versus higher oxygen concentration subgrouped by FiO2, Outcome 18 Duration of supplemental oxygen administration.

Comparison 2 Lower versus higher oxygen concentration subgrouped by FiO2, Outcome 19 Mortality to follow up (> 18 months).

Comparison 2 Lower versus higher oxygen concentration subgrouped by FiO2, Outcome 20 Postnatal growth failure (weight < 10th percentile at discharge).

Comparison 2 Lower versus higher oxygen concentration subgrouped by FiO2, Outcome 21 Duration of hospitalisation (days).
Comparison 2 Lower versus higher oxygen concentration subgrouped by FiO2, Outcome 22 Patent ductus arteriosus (not prespecified).

Comparison 3 Lower (FiO2 < 0.4) versus higher (FiO2 ≥ 0.4) oxygen concentration subgrouped by lower limit of oxygen saturation range at 5 to 10 mintues, Outcome 1 Mortality near term corrected age or discharge (latest reported).

Comparison 3 Lower (FiO2 < 0.4) versus higher (FiO2 ≥ 0.4) oxygen concentration subgrouped by lower limit of oxygen saturation range at 5 to 10 mintues, Outcome 2 Neurodevelopmental disability.
Comparison 3 Lower (FiO2 < 0.4) versus higher (FiO2 ≥ 0.4) oxygen concentration subgrouped by lower limit of oxygen saturation range at 5 to 10 mintues, Outcome 3 IPPV in the delivery room.
Comparison 3 Lower (FiO2 < 0.4) versus higher (FiO2 ≥ 0.4) oxygen concentration subgrouped by lower limit of oxygen saturation range at 5 to 10 mintues, Outcome 4 Intubation in the delivery room.
Comparison 3 Lower (FiO2 < 0.4) versus higher (FiO2 ≥ 0.4) oxygen concentration subgrouped by lower limit of oxygen saturation range at 5 to 10 mintues, Outcome 5 Time to reach desired oxygen saturation target.
Comparison 3 Lower (FiO2 < 0.4) versus higher (FiO2 ≥ 0.4) oxygen concentration subgrouped by lower limit of oxygen saturation range at 5 to 10 mintues, Outcome 6 Time to reach heart rate > 100 bpm (not prespecified).

Comparison 3 Lower (FiO2 < 0.4) versus higher (FiO2 ≥ 0.4) oxygen concentration subgrouped by lower limit of oxygen saturation range at 5 to 10 mintues, Outcome 7 Retinopathy of prematurity.

Comparison 3 Lower (FiO2 < 0.4) versus higher (FiO2 ≥ 0.4) oxygen concentration subgrouped by lower limit of oxygen saturation range at 5 to 10 mintues, Outcome 8 Severe retinopathy of prematurity (≥ stage 3).

Comparison 3 Lower (FiO2 < 0.4) versus higher (FiO2 ≥ 0.4) oxygen concentration subgrouped by lower limit of oxygen saturation range at 5 to 10 mintues, Outcome 9 Intraventricular haemorrhage.
Comparison 3 Lower (FiO2 < 0.4) versus higher (FiO2 ≥ 0.4) oxygen concentration subgrouped by lower limit of oxygen saturation range at 5 to 10 mintues, Outcome 10 Severe intraventricular haemorrhage (grade 3 or 4).
Comparison 3 Lower (FiO2 < 0.4) versus higher (FiO2 ≥ 0.4) oxygen concentration subgrouped by lower limit of oxygen saturation range at 5 to 10 mintues, Outcome 11 Periventricular leukomalacia.

Comparison 3 Lower (FiO2 < 0.4) versus higher (FiO2 ≥ 0.4) oxygen concentration subgrouped by lower limit of oxygen saturation range at 5 to 10 mintues, Outcome 12 Necrotising enterocolitis.

Comparison 3 Lower (FiO2 < 0.4) versus higher (FiO2 ≥ 0.4) oxygen concentration subgrouped by lower limit of oxygen saturation range at 5 to 10 mintues, Outcome 13 Chronic lung disease (28 days' age).

Comparison 3 Lower (FiO2 < 0.4) versus higher (FiO2 ≥ 0.4) oxygen concentration subgrouped by lower limit of oxygen saturation range at 5 to 10 mintues, Outcome 14 Chronic lung disease (36 weeks' corrected age).

Comparison 3 Lower (FiO2 < 0.4) versus higher (FiO2 ≥ 0.4) oxygen concentration subgrouped by lower limit of oxygen saturation range at 5 to 10 mintues, Outcome 15 Duration of respiratory support (mechanical ventilation or CPAP) (days from birth).

Comparison 3 Lower (FiO2 < 0.4) versus higher (FiO2 ≥ 0.4) oxygen concentration subgrouped by lower limit of oxygen saturation range at 5 to 10 mintues, Outcome 16 Duration of respiratory support (mechanical ventilation) (days from birth).
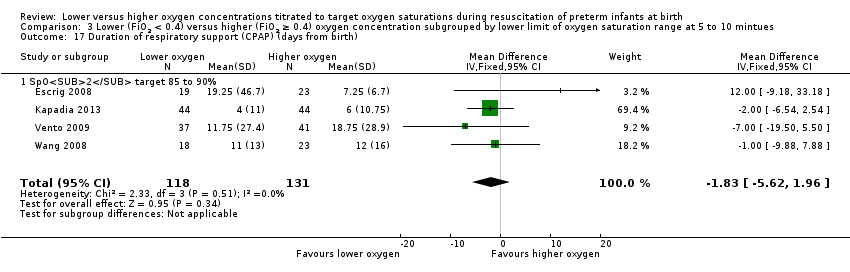
Comparison 3 Lower (FiO2 < 0.4) versus higher (FiO2 ≥ 0.4) oxygen concentration subgrouped by lower limit of oxygen saturation range at 5 to 10 mintues, Outcome 17 Duration of respiratory support (CPAP) (days from birth).

Comparison 3 Lower (FiO2 < 0.4) versus higher (FiO2 ≥ 0.4) oxygen concentration subgrouped by lower limit of oxygen saturation range at 5 to 10 mintues, Outcome 18 Duration of supplemental oxygen administration.

Comparison 3 Lower (FiO2 < 0.4) versus higher (FiO2 ≥ 0.4) oxygen concentration subgrouped by lower limit of oxygen saturation range at 5 to 10 mintues, Outcome 19 Mortality to follow up (> 18 months).

Comparison 3 Lower (FiO2 < 0.4) versus higher (FiO2 ≥ 0.4) oxygen concentration subgrouped by lower limit of oxygen saturation range at 5 to 10 mintues, Outcome 20 Postnatal growth failure (weight < 10th percentile at discharge).

Comparison 3 Lower (FiO2 < 0.4) versus higher (FiO2 ≥ 0.4) oxygen concentration subgrouped by lower limit of oxygen saturation range at 5 to 10 mintues, Outcome 21 Duration of hospitalisation (days).
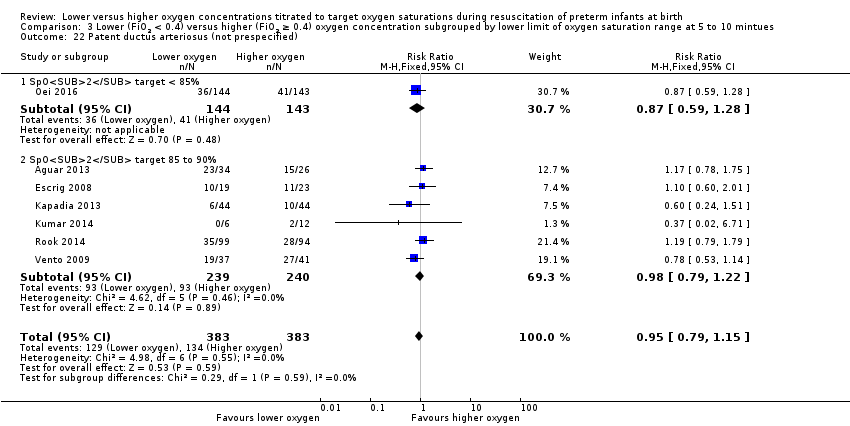
Comparison 3 Lower (FiO2 < 0.4) versus higher (FiO2 ≥ 0.4) oxygen concentration subgrouped by lower limit of oxygen saturation range at 5 to 10 mintues, Outcome 22 Patent ductus arteriosus (not prespecified).

Comparison 4 Lower (FiO2 < 0.4) versus higher (FiO2 ≥ 0.4) oxygen concentration subgrouped by highest SpO2 limit at 10 minutes, Outcome 1 Mortality near term corrected age or discharge (latest reported).

Comparison 4 Lower (FiO2 < 0.4) versus higher (FiO2 ≥ 0.4) oxygen concentration subgrouped by highest SpO2 limit at 10 minutes, Outcome 2 Neurodevelopmental disability.

Comparison 4 Lower (FiO2 < 0.4) versus higher (FiO2 ≥ 0.4) oxygen concentration subgrouped by highest SpO2 limit at 10 minutes, Outcome 3 IPPV in the delivery room.
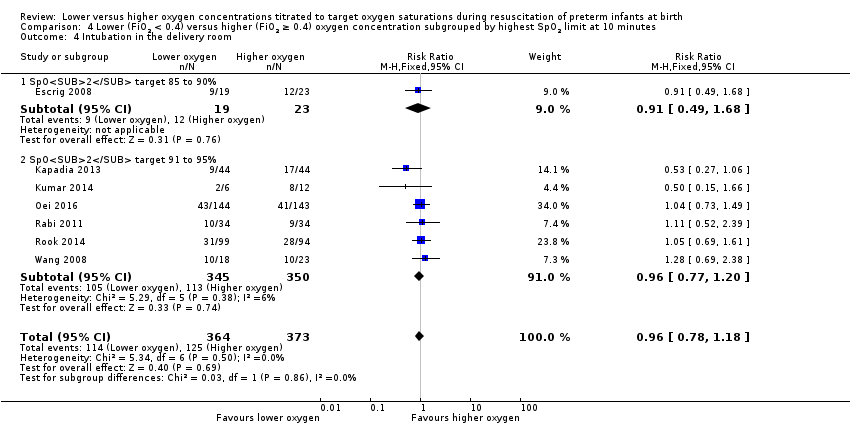
Comparison 4 Lower (FiO2 < 0.4) versus higher (FiO2 ≥ 0.4) oxygen concentration subgrouped by highest SpO2 limit at 10 minutes, Outcome 4 Intubation in the delivery room.
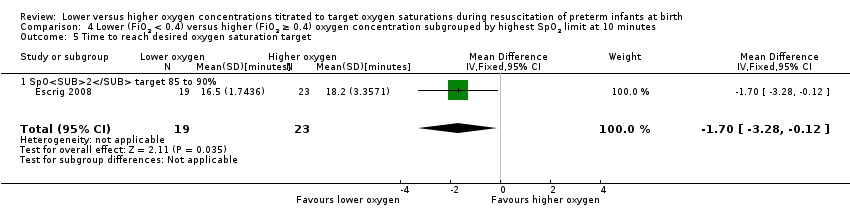
Comparison 4 Lower (FiO2 < 0.4) versus higher (FiO2 ≥ 0.4) oxygen concentration subgrouped by highest SpO2 limit at 10 minutes, Outcome 5 Time to reach desired oxygen saturation target.

Comparison 4 Lower (FiO2 < 0.4) versus higher (FiO2 ≥ 0.4) oxygen concentration subgrouped by highest SpO2 limit at 10 minutes, Outcome 6 Retinopathy of prematurity.

Comparison 4 Lower (FiO2 < 0.4) versus higher (FiO2 ≥ 0.4) oxygen concentration subgrouped by highest SpO2 limit at 10 minutes, Outcome 7 Severe retinopathy of prematurity (≥ stage 3).

Comparison 4 Lower (FiO2 < 0.4) versus higher (FiO2 ≥ 0.4) oxygen concentration subgrouped by highest SpO2 limit at 10 minutes, Outcome 8 Intraventricular haemorrhage.
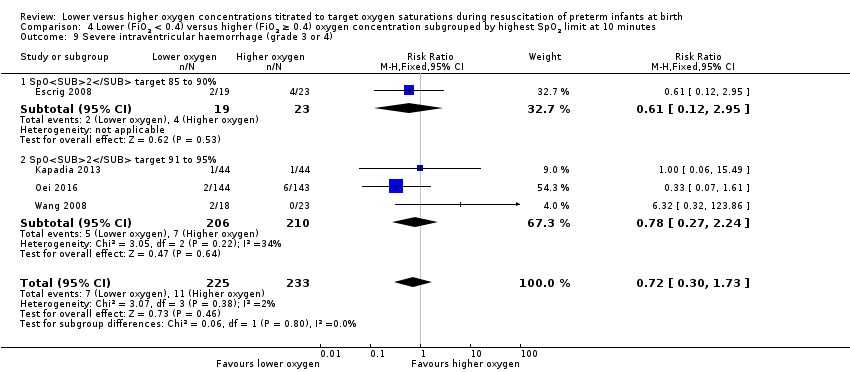
Comparison 4 Lower (FiO2 < 0.4) versus higher (FiO2 ≥ 0.4) oxygen concentration subgrouped by highest SpO2 limit at 10 minutes, Outcome 9 Severe intraventricular haemorrhage (grade 3 or 4).

Comparison 4 Lower (FiO2 < 0.4) versus higher (FiO2 ≥ 0.4) oxygen concentration subgrouped by highest SpO2 limit at 10 minutes, Outcome 10 Periventricular leukomalacia.

Comparison 4 Lower (FiO2 < 0.4) versus higher (FiO2 ≥ 0.4) oxygen concentration subgrouped by highest SpO2 limit at 10 minutes, Outcome 11 Necrotising enterocolitis.

Comparison 4 Lower (FiO2 < 0.4) versus higher (FiO2 ≥ 0.4) oxygen concentration subgrouped by highest SpO2 limit at 10 minutes, Outcome 12 Chronic lung disease (28 days age).

Comparison 4 Lower (FiO2 < 0.4) versus higher (FiO2 ≥ 0.4) oxygen concentration subgrouped by highest SpO2 limit at 10 minutes, Outcome 13 Chronic lung disease (36 weeks' corrected age).

Comparison 4 Lower (FiO2 < 0.4) versus higher (FiO2 ≥ 0.4) oxygen concentration subgrouped by highest SpO2 limit at 10 minutes, Outcome 14 Duration of respiratory support (mechanical ventilation or CPAP) (days from birth).
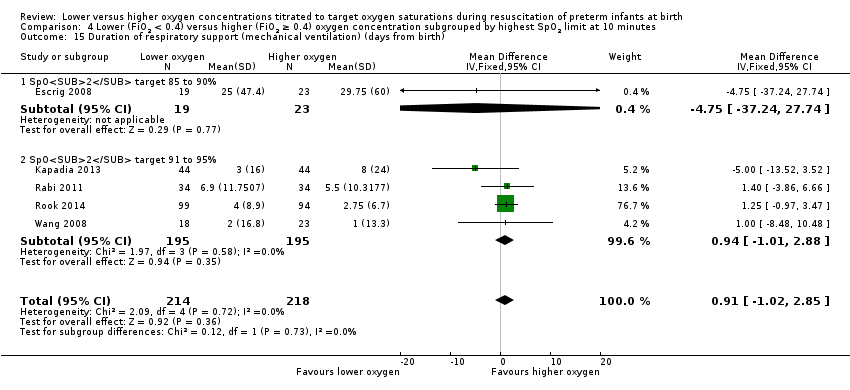
Comparison 4 Lower (FiO2 < 0.4) versus higher (FiO2 ≥ 0.4) oxygen concentration subgrouped by highest SpO2 limit at 10 minutes, Outcome 15 Duration of respiratory support (mechanical ventilation) (days from birth).
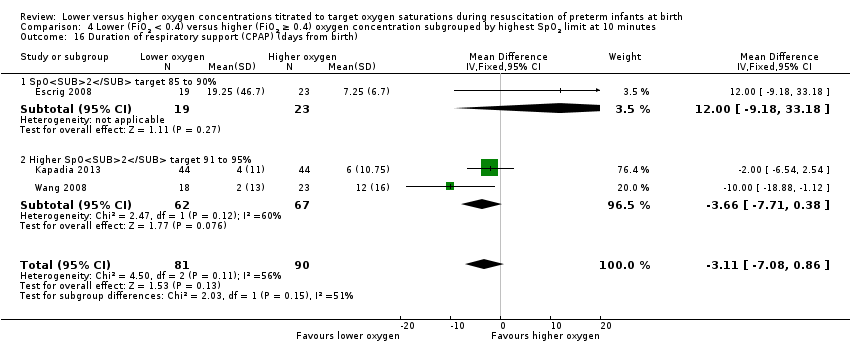
Comparison 4 Lower (FiO2 < 0.4) versus higher (FiO2 ≥ 0.4) oxygen concentration subgrouped by highest SpO2 limit at 10 minutes, Outcome 16 Duration of respiratory support (CPAP) (days from birth).
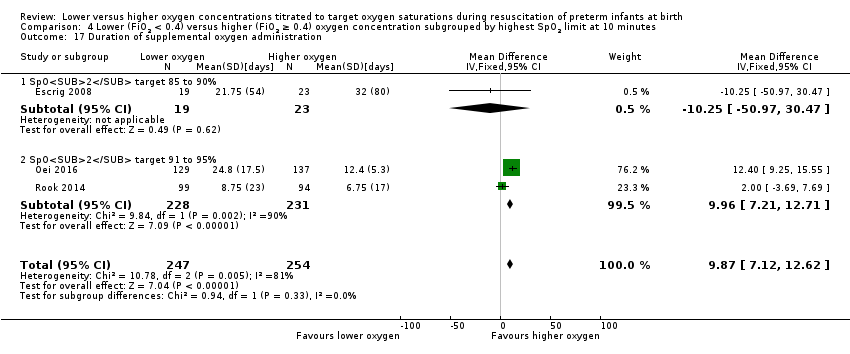
Comparison 4 Lower (FiO2 < 0.4) versus higher (FiO2 ≥ 0.4) oxygen concentration subgrouped by highest SpO2 limit at 10 minutes, Outcome 17 Duration of supplemental oxygen administration.
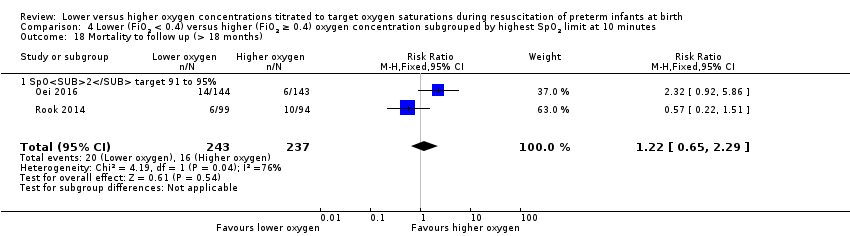
Comparison 4 Lower (FiO2 < 0.4) versus higher (FiO2 ≥ 0.4) oxygen concentration subgrouped by highest SpO2 limit at 10 minutes, Outcome 18 Mortality to follow up (> 18 months).
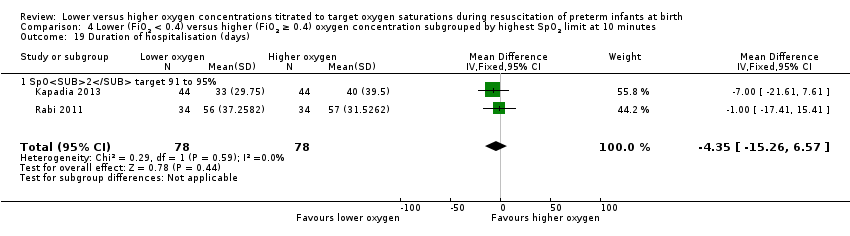
Comparison 4 Lower (FiO2 < 0.4) versus higher (FiO2 ≥ 0.4) oxygen concentration subgrouped by highest SpO2 limit at 10 minutes, Outcome 19 Duration of hospitalisation (days).

Comparison 4 Lower (FiO2 < 0.4) versus higher (FiO2 ≥ 0.4) oxygen concentration subgrouped by highest SpO2 limit at 10 minutes, Outcome 20 Patent ductus arteriosus (not prespecified).

Comparison 5 Lower (FiO2 < 0.4) versus higher (FiO2 ≥ 0.4) oxygen concentration subgrouped by gestational age, Outcome 1 Mortality near term corrected age or discharge (latest reported).

Comparison 5 Lower (FiO2 < 0.4) versus higher (FiO2 ≥ 0.4) oxygen concentration subgrouped by gestational age, Outcome 2 Neurodevelopmental disability.

Comparison 5 Lower (FiO2 < 0.4) versus higher (FiO2 ≥ 0.4) oxygen concentration subgrouped by gestational age, Outcome 3 IPPV in the delivery room.
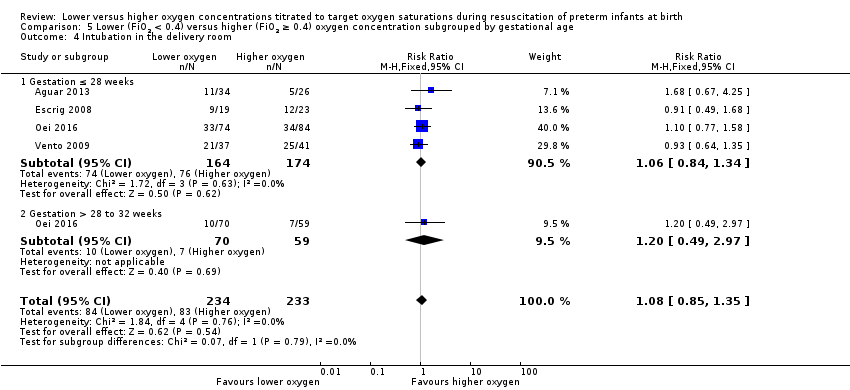
Comparison 5 Lower (FiO2 < 0.4) versus higher (FiO2 ≥ 0.4) oxygen concentration subgrouped by gestational age, Outcome 4 Intubation in the delivery room.

Comparison 5 Lower (FiO2 < 0.4) versus higher (FiO2 ≥ 0.4) oxygen concentration subgrouped by gestational age, Outcome 5 Time to reach desired oxygen saturation target.

Comparison 5 Lower (FiO2 < 0.4) versus higher (FiO2 ≥ 0.4) oxygen concentration subgrouped by gestational age, Outcome 6 Time to reach heart rate > 100 bpm.

Comparison 5 Lower (FiO2 < 0.4) versus higher (FiO2 ≥ 0.4) oxygen concentration subgrouped by gestational age, Outcome 7 Retinopathy of prematurity.
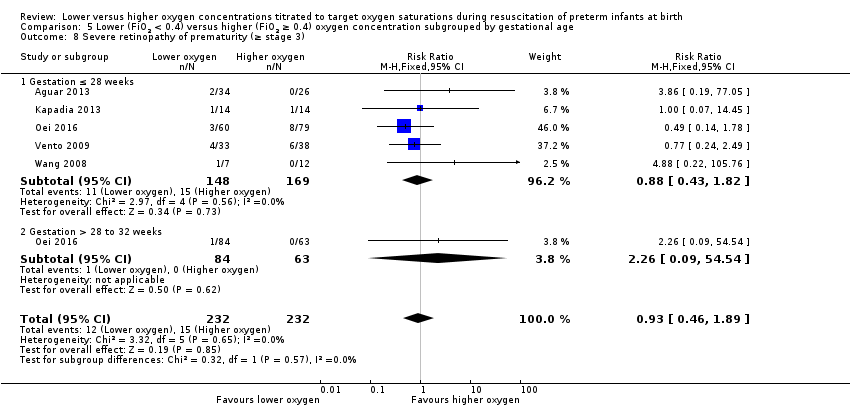
Comparison 5 Lower (FiO2 < 0.4) versus higher (FiO2 ≥ 0.4) oxygen concentration subgrouped by gestational age, Outcome 8 Severe retinopathy of prematurity (≥ stage 3).

Comparison 5 Lower (FiO2 < 0.4) versus higher (FiO2 ≥ 0.4) oxygen concentration subgrouped by gestational age, Outcome 9 Intraventricular haemorrhage.
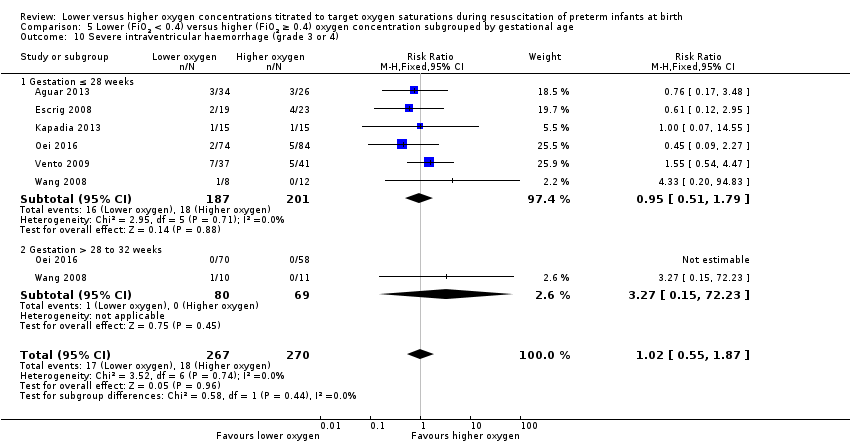
Comparison 5 Lower (FiO2 < 0.4) versus higher (FiO2 ≥ 0.4) oxygen concentration subgrouped by gestational age, Outcome 10 Severe intraventricular haemorrhage (grade 3 or 4).
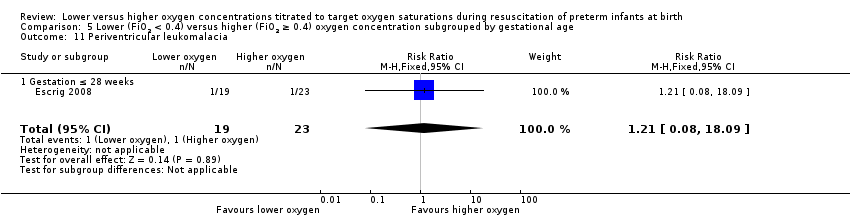
Comparison 5 Lower (FiO2 < 0.4) versus higher (FiO2 ≥ 0.4) oxygen concentration subgrouped by gestational age, Outcome 11 Periventricular leukomalacia.

Comparison 5 Lower (FiO2 < 0.4) versus higher (FiO2 ≥ 0.4) oxygen concentration subgrouped by gestational age, Outcome 12 Necrotising enterocolitis.

Comparison 5 Lower (FiO2 < 0.4) versus higher (FiO2 ≥ 0.4) oxygen concentration subgrouped by gestational age, Outcome 13 Chronic lung disease (28 days age).

Comparison 5 Lower (FiO2 < 0.4) versus higher (FiO2 ≥ 0.4) oxygen concentration subgrouped by gestational age, Outcome 14 Chronic lung disease (36 weeks' corrected age).

Comparison 5 Lower (FiO2 < 0.4) versus higher (FiO2 ≥ 0.4) oxygen concentration subgrouped by gestational age, Outcome 15 Duration of respiratory support (mechanical ventilation or CPAP) (days from birth).

Comparison 5 Lower (FiO2 < 0.4) versus higher (FiO2 ≥ 0.4) oxygen concentration subgrouped by gestational age, Outcome 16 Duration of respiratory support (mechanical ventilation) (days from birth).
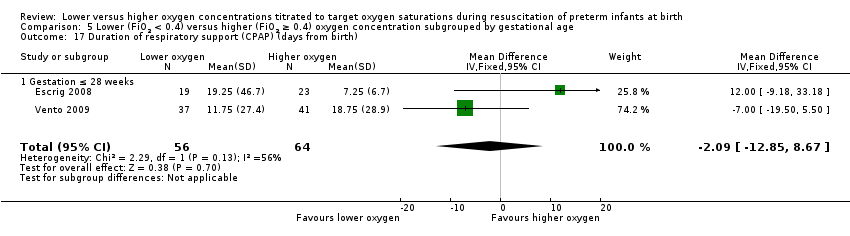
Comparison 5 Lower (FiO2 < 0.4) versus higher (FiO2 ≥ 0.4) oxygen concentration subgrouped by gestational age, Outcome 17 Duration of respiratory support (CPAP) (days from birth).

Comparison 5 Lower (FiO2 < 0.4) versus higher (FiO2 ≥ 0.4) oxygen concentration subgrouped by gestational age, Outcome 18 Duration of supplemental oxygen administration.
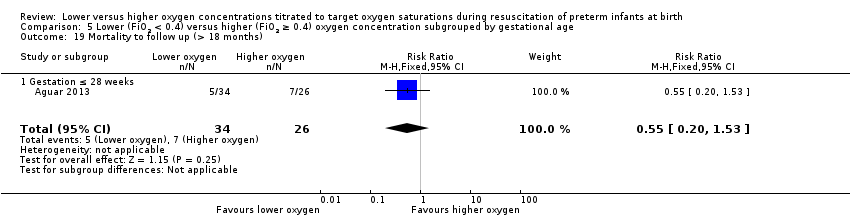
Comparison 5 Lower (FiO2 < 0.4) versus higher (FiO2 ≥ 0.4) oxygen concentration subgrouped by gestational age, Outcome 19 Mortality to follow up (> 18 months).
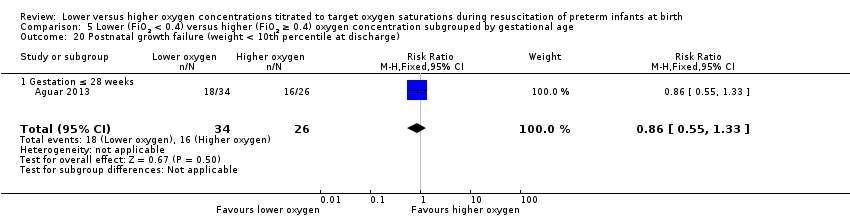
Comparison 5 Lower (FiO2 < 0.4) versus higher (FiO2 ≥ 0.4) oxygen concentration subgrouped by gestational age, Outcome 20 Postnatal growth failure (weight < 10th percentile at discharge).

Comparison 5 Lower (FiO2 < 0.4) versus higher (FiO2 ≥ 0.4) oxygen concentration subgrouped by gestational age, Outcome 21 Duration of hospitalisation (days).

Comparison 5 Lower (FiO2 < 0.4) versus higher (FiO2 ≥ 0.4) oxygen concentration subgrouped by gestational age, Outcome 22 Patent ductus arteriosus (not prespecified).

Comparison 6 Lower (FiO2 < 0.4) versus higher (FiO2 ≥ 0.4) oxygen concentration ‐ sensitivity analysis, Outcome 1 Mortality near term corrected age or discharge (latest reported).
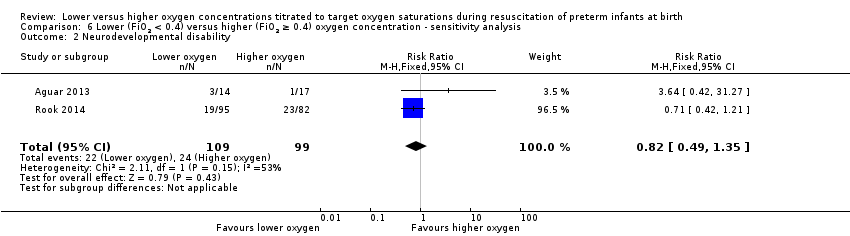
Comparison 6 Lower (FiO2 < 0.4) versus higher (FiO2 ≥ 0.4) oxygen concentration ‐ sensitivity analysis, Outcome 2 Neurodevelopmental disability.

Comparison 6 Lower (FiO2 < 0.4) versus higher (FiO2 ≥ 0.4) oxygen concentration ‐ sensitivity analysis, Outcome 3 IPPV in the delivery room.

Comparison 6 Lower (FiO2 < 0.4) versus higher (FiO2 ≥ 0.4) oxygen concentration ‐ sensitivity analysis, Outcome 4 Intubation in the delivery room.

Comparison 6 Lower (FiO2 < 0.4) versus higher (FiO2 ≥ 0.4) oxygen concentration ‐ sensitivity analysis, Outcome 5 Time to reach desired oxygen saturation target.

Comparison 6 Lower (FiO2 < 0.4) versus higher (FiO2 ≥ 0.4) oxygen concentration ‐ sensitivity analysis, Outcome 6 Time to reach heart rate > 100 bpm (not prespecified).
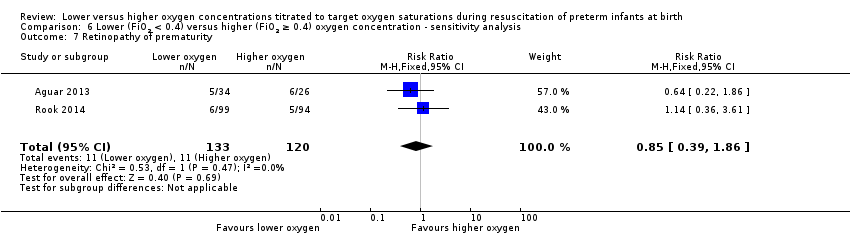
Comparison 6 Lower (FiO2 < 0.4) versus higher (FiO2 ≥ 0.4) oxygen concentration ‐ sensitivity analysis, Outcome 7 Retinopathy of prematurity.
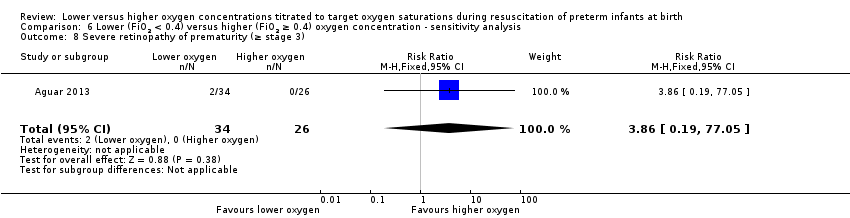
Comparison 6 Lower (FiO2 < 0.4) versus higher (FiO2 ≥ 0.4) oxygen concentration ‐ sensitivity analysis, Outcome 8 Severe retinopathy of prematurity (≥ stage 3).

Comparison 6 Lower (FiO2 < 0.4) versus higher (FiO2 ≥ 0.4) oxygen concentration ‐ sensitivity analysis, Outcome 9 Intraventricular haemorrhage.
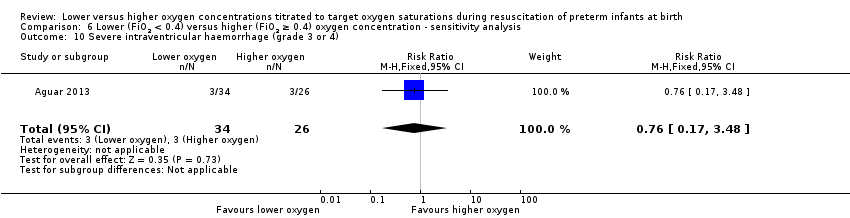
Comparison 6 Lower (FiO2 < 0.4) versus higher (FiO2 ≥ 0.4) oxygen concentration ‐ sensitivity analysis, Outcome 10 Severe intraventricular haemorrhage (grade 3 or 4).

Comparison 6 Lower (FiO2 < 0.4) versus higher (FiO2 ≥ 0.4) oxygen concentration ‐ sensitivity analysis, Outcome 11 Necrotising enterocolitis.

Comparison 6 Lower (FiO2 < 0.4) versus higher (FiO2 ≥ 0.4) oxygen concentration ‐ sensitivity analysis, Outcome 12 Chronic lung disease (28 days age).

Comparison 6 Lower (FiO2 < 0.4) versus higher (FiO2 ≥ 0.4) oxygen concentration ‐ sensitivity analysis, Outcome 13 Chronic lung disease (36 weeks' corrected age).

Comparison 6 Lower (FiO2 < 0.4) versus higher (FiO2 ≥ 0.4) oxygen concentration ‐ sensitivity analysis, Outcome 14 Duration of respiratory support (mechanical ventilation or CPAP) (days from birth).

Comparison 6 Lower (FiO2 < 0.4) versus higher (FiO2 ≥ 0.4) oxygen concentration ‐ sensitivity analysis, Outcome 15 Duration of respiratory support (mechanical ventilation) (days from birth).

Comparison 6 Lower (FiO2 < 0.4) versus higher (FiO2 ≥ 0.4) oxygen concentration ‐ sensitivity analysis, Outcome 16 Duration of supplemental oxygen administration.

Comparison 6 Lower (FiO2 < 0.4) versus higher (FiO2 ≥ 0.4) oxygen concentration ‐ sensitivity analysis, Outcome 17 Mortality to follow up (> 18 months).

Comparison 6 Lower (FiO2 < 0.4) versus higher (FiO2 ≥ 0.4) oxygen concentration ‐ sensitivity analysis, Outcome 18 Postnatal growth failure (weight < 10th percentile at discharge).

Comparison 6 Lower (FiO2 < 0.4) versus higher (FiO2 ≥ 0.4) oxygen concentration ‐ sensitivity analysis, Outcome 19 Duration of hospitalisation (days).

Comparison 6 Lower (FiO2 < 0.4) versus higher (FiO2 ≥ 0.4) oxygen concentration ‐ sensitivity analysis, Outcome 20 Patent ductus arteriosus (not prespecified).
| Lower (FiO2 < 0.4) versus higher (FiO2 ≥ 0.4) oxygen concentrations titrated to oxygen saturations during resuscitation of preterm infants at birth | ||||||
| Patient or population: preterm infants | ||||||
| Outcomes | Illustrative comparative risks* (95% CI) | Relative effect | No of Participants | Quality of the evidence | Comments | |
| Assumed risk | Corresponding risk | |||||
| Control | Lower (FiO2 < 0.4) versus higher (FiO2 ≥ 0.4) oxygen concentration | |||||
| Mortality, near term corrected age or discharge | Study population | RR 1.05 | 914 | ⊕⊕⊝⊝ | Subgroup analyses: single study targeting lowest SpO2 < 85% reported increased mortality for infants resuscitated with air compared to 100% oxygen (Oei 2016). Meta‐analysis of 9 studies (627 infants) targeting lowest SpO2 85% to 90% found no difference in mortality. No subgroup differences according to inspired oxygen concentration strata, highest SpO2 limit, or gestational age. Quality of evidence downgraded due to risk of bias and imprecision. | |
| 76 per 1000 | 80 per 1000 | |||||
| Moderate | ||||||
| 68 per 1000 | 71 per 1000 | |||||
| Neurodevelopmental disability | Study population | RR 0.82 | 208 | ⊕⊕⊝⊝ | Subgroup analyses: both studies compared FiO2 ≥ 0.3 to < 0.4 versus FiO2 ≥ 0.6 to 1.0 and had a lowest SpO2 target 85 to 90%. Quality of evidence downgraded due to inconsistency and imprecision. | |
| 242 per 1000 | 199 per 1000 | |||||
| Moderate | ||||||
| 170 per 1000 | 139 per 1000 | |||||
| Intubation in the delivery room | Study population | RR 0.98 | 875 | ⊕⊕⊝⊝ | Subgroup analyses: no subgroup differences according to inspired oxygen concentration strata, lowest or highest SpO2 target, or gestational age. Quality of evidence downgraded due to risk of bias and imprecision. | |
| 352 per 1000 | 345 per 1000 | |||||
| Moderate | ||||||
| 386 per 1000 | 378 per 1000 | |||||
| Severe retinopathy of prematurity (≥ stage 3) | Study population | RR 0.57 | 453 | ⊕⊕⊝⊝ | Subgroup analyses: no subgroup differences according to inspired oxygen concentration strata, lowest SpO2 target, or gestational age. Quality of evidence downgraded due to risk of bias and imprecision. | |
| 58 per 1000 | 33 per 1000 | |||||
| Moderate | ||||||
| 70 per 1000 | 40 per 1000 | |||||
| Severe intraventricular haemorrhage (grade 3 or 4) | Study population | RR 0.93 | 596 | ⊕⊕⊝⊝ | Subgroup analyses: no subgroup differences according to inspired oxygen concentration strata, lowest or highest SpO2 target, or gestational age. Quality of evidence downgraded due to risk of bias and imprecision. | |
| 63 per 1000 | 59 per 1000 | |||||
| Moderate | ||||||
| 79 per 1000 | 73 per 1000 | |||||
| Necrotising enterocolitis | Study population | RR 0.98 | 807 | ⊕⊕⊝⊝ | Subgroup analyses: no subgroup differences according to inspired oxygen concentration strata, lowest or highest SpO2 target, or gestational age. Quality of evidence downgraded due to risk of bias and imprecision. | |
| 47 per 1000 | 46 per 1000 | |||||
| Moderate | ||||||
| 41 per 1000 | 40 per 1000 | |||||
| Chronic lung disease (36 weeks' corrected age) | Study population | RR 0.91 | 862 | ⊕⊝⊝⊝ | Subgroup analyses: no subgroup differences according to inspired oxygen concentration strata, lowest or highest SpO2 target, or gestational age. Quality of evidence downgraded due to risk of bias, inconsistency and imprecision. | |
| 269 per 1000 | 244 per 1000 | |||||
| Moderate | ||||||
| 250 per 1000 | 228 per 1000 | |||||
| *The basis for the assumed risk (e.g. the median control group risk across studies) is provided in footnotes. The corresponding risk (and its 95% confidence interval) is based on the assumed risk in the comparison group and the relative effect of the intervention (and its 95% CI). | ||||||
| GRADE Working Group grades of evidence | ||||||
| 1 Two studies at low risk of bias. | ||||||
| Outcome or subgroup title | No. of studies | No. of participants | Statistical method | Effect size |
| 1 Mortality near term corrected age or discharge (latest reported) subgrouped by inspired oxygen concentration Show forest plot | 10 | 914 | Risk Ratio (M‐H, Fixed, 95% CI) | 1.05 [0.68, 1.63] |
| 2 Neurodevelopmental disability Show forest plot | 2 | 208 | Risk Ratio (M‐H, Fixed, 95% CI) | 0.82 [0.49, 1.35] |
| 3 IPPV in the delivery room Show forest plot | 5 | 249 | Risk Ratio (M‐H, Fixed, 95% CI) | 0.94 [0.83, 1.06] |
| 4 Intubation in the delivery room Show forest plot | 9 | 875 | Risk Ratio (M‐H, Fixed, 95% CI) | 0.98 [0.82, 1.18] |
| 5 Time to reach desired oxygen saturation target Show forest plot | 2 | 102 | Mean Difference (IV, Fixed, 95% CI) | ‐0.52 [‐1.83, 0.79] |
| 6 Time to reach heart rate > 100 bpm (not prespecified) Show forest plot | 1 | 60 | Mean Difference (IV, Fixed, 95% CI) | 0.27 [‐1.21, 1.75] |
| 7 Retinopathy of prematurity Show forest plot | 4 | 373 | Risk Ratio (M‐H, Fixed, 95% CI) | 0.80 [0.43, 1.49] |
| 8 Severe retinopathy of prematurity (≥ stage 3) Show forest plot | 4 | 453 | Risk Ratio (M‐H, Fixed, 95% CI) | 0.57 [0.24, 1.36] |
| 9 Intraventricular haemorrhage Show forest plot | 3 | 271 | Risk Ratio (M‐H, Fixed, 95% CI) | 0.81 [0.46, 1.44] |
| 10 Severe intraventricular haemorrhage (grade 3 or 4) Show forest plot | 6 | 596 | Risk Ratio (M‐H, Fixed, 95% CI) | 0.93 [0.51, 1.71] |
| 11 Periventricular leukomalacia Show forest plot | 2 | 130 | Risk Ratio (M‐H, Fixed, 95% CI) | 0.66 [0.09, 4.73] |
| 12 Necrotising enterocolitis Show forest plot | 8 | 807 | Risk Ratio (M‐H, Fixed, 95% CI) | 0.98 [0.51, 1.87] |
| 13 Chronic lung disease (28 days' age) Show forest plot | 2 | 148 | Risk Ratio (M‐H, Fixed, 95% CI) | 0.70 [0.41, 1.21] |
| 14 Chronic lung disease (36 weeks' corrected age) Show forest plot | 9 | 862 | Risk Ratio (M‐H, Fixed, 95% CI) | 0.91 [0.72, 1.14] |
| 15 Duration of respiratory support (mechanical ventilation or CPAP) (days from birth) Show forest plot | 2 | 326 | Mean Difference (IV, Fixed, 95% CI) | ‐12.39 [‐13.49, ‐11.29] |
| 16 Duration of respiratory support (mechanical ventilation) (days from birth) Show forest plot | 6 | 510 | Mean Difference (IV, Fixed, 95% CI) | 0.61 [‐1.33, 2.54] |
| 17 Duration of respiratory support (CPAP) (days from birth) Show forest plot | 4 | 249 | Mean Difference (IV, Fixed, 95% CI) | ‐1.60 [‐5.39, 2.19] |
| 18 Duration of supplemental oxygen administration Show forest plot | 5 | 639 | Mean Difference (IV, Fixed, 95% CI) | 9.23 [6.52, 11.95] |
| 19 Mortality to follow up (> 18 months) Show forest plot | 3 | 540 | Risk Ratio (M‐H, Fixed, 95% CI) | 1.00 [0.59, 1.70] |
| 20 Postnatal growth failure (weight < 10th percentile at discharge) Show forest plot | 1 | 60 | Risk Ratio (M‐H, Fixed, 95% CI) | 0.86 [0.55, 1.33] |
| 21 Duration of hospitalisation (days) Show forest plot | 3 | 216 | Mean Difference (IV, Fixed, 95% CI) | ‐1.75 [‐12.22, 8.71] |
| 22 Patent ductus arteriosus (not prespecified) Show forest plot | 7 | 766 | Risk Ratio (M‐H, Fixed, 95% CI) | 0.93 [0.77, 1.14] |
| Outcome or subgroup title | No. of studies | No. of participants | Statistical method | Effect size |
| 1 Mortality near term corrected age or discharge (latest reported) subgrouped by inspired oxygen concentration Show forest plot | 10 | Risk Ratio (M‐H, Fixed, 95% CI) | Subtotals only | |
| 1.1 FiO2 0.21 versus FiO2 ≥ 0.4 to < 0.6 | 1 | 13 | Risk Ratio (M‐H, Fixed, 95% CI) | 1.17 [0.09, 14.92] |
| 1.2 FiO2 0.21 versus FiO2 ≥ 0.6 to 1.0 | 5 | 495 | Risk Ratio (M‐H, Fixed, 95% CI) | 1.70 [0.84, 3.46] |
| 1.3 FiO2 ≥ 0.3 to < 0.4 versus FiO2 ≥ 0.6 to 1.0 | 5 | 412 | Risk Ratio (M‐H, Fixed, 95% CI) | 0.75 [0.42, 1.32] |
| 2 Neurodevelopmental disability Show forest plot | 2 | Risk Ratio (M‐H, Fixed, 95% CI) | Subtotals only | |
| 2.2 FiO2 ≥ 0.3 to < 0.4 versus FiO2 ≥ 0.6 to 1.0 | 2 | 208 | Risk Ratio (M‐H, Fixed, 95% CI) | 0.82 [0.49, 1.35] |
| 3 IPPV in the delivery room Show forest plot | 5 | Risk Ratio (M‐H, Fixed, 95% CI) | Subtotals only | |
| 3.1 FiO2 0.21 versus FiO2 ≥ 0.4 to < 0.6 | 1 | 13 | Risk Ratio (M‐H, Fixed, 95% CI) | 0.7 [0.28, 1.77] |
| 3.2 FiO2 0.21 versus FiO2 ≥ 0.6 to 1.0 | 3 | 140 | Risk Ratio (M‐H, Fixed, 95% CI) | 0.93 [0.77, 1.12] |
| 3.3 FiO2 ≥ 0.3 to < 0.4 versus FiO2 ≥ 0.6 to 1.0 | 2 | 102 | Risk Ratio (M‐H, Fixed, 95% CI) | 0.96 [0.84, 1.09] |
| 4 Intubation in the delivery room Show forest plot | 9 | Risk Ratio (M‐H, Fixed, 95% CI) | Subtotals only | |
| 4.1 FiO2 0.21 versus FiO2 ≥ 0.4 to < 0.6 | 1 | 13 | Risk Ratio (M‐H, Fixed, 95% CI) | 0.58 [0.16, 2.14] |
| 4.2 FiO2 0.21 versus FiO2 ≥ 0.6 to 1.0 | 5 | 495 | Risk Ratio (M‐H, Fixed, 95% CI) | 0.93 [0.72, 1.21] |
| 4.3 FiO2 ≥ 0.3 to < 0.4 versus FiO2 ≥ 0.6 to 1.0 | 4 | 373 | Risk Ratio (M‐H, Fixed, 95% CI) | 1.04 [0.81, 1.34] |
| 5 Time to reach desired oxygen saturation target Show forest plot | 2 | Mean Difference (IV, Fixed, 95% CI) | Subtotals only | |
| 5.1 FiO2 ≥ 0.3 to < 0.4 versus FiO2 ≥ 0.6 to 1.0 | 2 | 102 | Mean Difference (IV, Fixed, 95% CI) | ‐0.52 [‐1.83, 0.79] |
| 6 Time to reach heart rate > 100 bpm (not prespecified) Show forest plot | 1 | Mean Difference (IV, Fixed, 95% CI) | Subtotals only | |
| 6.1 FiO2 ≥ 0.3 to < 0.4 versus FiO2 ≥ 0.6 to 1.0 | 1 | 60 | Mean Difference (IV, Fixed, 95% CI) | 0.27 [‐1.21, 1.75] |
| 7 Retinopathy of prematurity Show forest plot | 4 | Risk Ratio (M‐H, Fixed, 95% CI) | Subtotals only | |
| 7.1 FiO2 ≥ 0.3 to < 0.4 versus FiO2 ≥ 0.6 to 1.0 | 4 | 373 | Risk Ratio (M‐H, Fixed, 95% CI) | 0.80 [0.43, 1.49] |
| 8 Severe retinopathy of prematurity (≥ stage 3) Show forest plot | 4 | Risk Ratio (M‐H, Fixed, 95% CI) | Subtotals only | |
| 8.1 FiO2 0.21 versus FiO2 ≥ 0.4 to < 0.6 | 1 | 13 | Risk Ratio (M‐H, Fixed, 95% CI) | 0.0 [0.0, 0.0] |
| 8.2 FiO2 0.21 versus FiO2 ≥ 0.6 to 1.0 | 3 | 386 | Risk Ratio (M‐H, Fixed, 95% CI) | 0.40 [0.15, 1.05] |
| 8.3 FiO2 ≥ 0.3 to < 0.4 versus FiO2 ≥ 0.6 to 1.0 | 1 | 60 | Risk Ratio (M‐H, Fixed, 95% CI) | 3.86 [0.19, 77.05] |
| 9 Intraventricular haemorrhage Show forest plot | 3 | Risk Ratio (M‐H, Fixed, 95% CI) | Subtotals only | |
| 9.1 FiO2 0.21 versus FiO2 ≥ 0.4 to < 0.6 | 1 | 13 | Risk Ratio (M‐H, Fixed, 95% CI) | 0.0 [0.0, 0.0] |
| 9.2 FiO2 0.21 versus FiO2 ≥ 0.6 to 1.0 | 1 | 11 | Risk Ratio (M‐H, Fixed, 95% CI) | 0.17 [0.01, 2.92] |
| 9.3 FiO2 ≥ 0.3 to < 0.4 versus FiO2 ≥ 0.6 to 1.0 | 2 | 253 | Risk Ratio (M‐H, Fixed, 95% CI) | 0.85 [0.47, 1.53] |
| 10 Severe intraventricular haemorrhage (grade 3 or 4) Show forest plot | 6 | Risk Ratio (M‐H, Fixed, 95% CI) | Subtotals only | |
| 10.1 FiO2 0.21 versus FiO2 ≥ 0.6 to 1.0 | 3 | 416 | Risk Ratio (M‐H, Fixed, 95% CI) | 0.78 [0.27, 2.24] |
| 10.2 FiO2 ≥ 0.3 to < 0.4 versus FiO2 ≥ 0.6 to 1.0 | 3 | 180 | Risk Ratio (M‐H, Fixed, 95% CI) | 1.03 [0.49, 2.18] |
| 11 Periventricular leukomalacia Show forest plot | 2 | Risk Ratio (M‐H, Fixed, 95% CI) | Subtotals only | |
| 11.1 FiO2 0.21 versus FiO2 ≥ 0.6 to 1.0 | 1 | 88 | Risk Ratio (M‐H, Fixed, 95% CI) | 0.33 [0.01, 7.97] |
| 11.2 FiO2 ≥ 0.3 to < 0.4 versus FiO2 ≥ 0.6 to 1.0 | 1 | 42 | Risk Ratio (M‐H, Fixed, 95% CI) | 1.21 [0.08, 18.09] |
| 12 Necrotising enterocolitis Show forest plot | 8 | Risk Ratio (M‐H, Fixed, 95% CI) | Subtotals only | |
| 12.1 FiO2 0.21 versus FiO2 ≥ 0.4 to < 0.6 | 1 | 13 | Risk Ratio (M‐H, Fixed, 95% CI) | 0.58 [0.07, 4.95] |
| 12.2 FiO2 0.21 versus FiO2 ≥ 0.6 to 1.0 | 4 | 434 | Risk Ratio (M‐H, Fixed, 95% CI) | 0.74 [0.31, 1.76] |
| 12.3 FiO2 ≥ 0.3 to < 0.4 versus FiO2 ≥ 0.6 to 1.0 | 4 | 373 | Risk Ratio (M‐H, Fixed, 95% CI) | 1.40 [0.52, 3.78] |
| 13 Chronic lung disease (28 days age) Show forest plot | 2 | Risk Ratio (M‐H, Fixed, 95% CI) | Subtotals only | |
| 13.1 FiO2 0.21 versus FiO2 ≥ 0.6 to 1.0 | 1 | 88 | Risk Ratio (M‐H, Fixed, 95% CI) | 0.47 [0.23, 0.98] |
| 13.2 FiO2 ≥ 0.3 to < 0.4 versus FiO2 ≥ 0.6 to 1.0 | 1 | 60 | Risk Ratio (M‐H, Fixed, 95% CI) | 1.27 [0.53, 3.05] |
| 14 Chronic lung disease (36 weeks' corrected age) Show forest plot | 9 | Risk Ratio (M‐H, Fixed, 95% CI) | Subtotals only | |
| 14.1 FiO2 0.21 versus FiO2 ≥ 0.4 to < 0.6 | 1 | 13 | Risk Ratio (M‐H, Fixed, 95% CI) | 0.39 [0.05, 2.83] |
| 14.2 FiO2 0.21 versus FiO2 ≥ 0.6 to 1.0 | 5 | 492 | Risk Ratio (M‐H, Fixed, 95% CI) | 0.83 [0.63, 1.09] |
| 14.3 FiO2 ≥ 0.3 to < 0.4 versus FiO2 ≥ 0.6 to 1.0 | 4 | 363 | Risk Ratio (M‐H, Fixed, 95% CI) | 1.07 [0.72, 1.60] |
| 15 Duration of respiratory support (mechanical ventilation or CPAP) (days from birth) Show forest plot | 2 | Mean Difference (IV, Fixed, 95% CI) | Subtotals only | |
| 15.1 FiO2 0.21 versus FiO2 ≥ 0.6 to 1.0 | 1 | 266 | Mean Difference (IV, Fixed, 95% CI) | ‐13.70 [‐14.85, ‐12.55] |
| 15.2 FiO2 ≥ 0.3 to < 0.4 versus FiO2 ≥ 0.6 to 1.0 | 1 | 60 | Mean Difference (IV, Fixed, 95% CI) | 1.06 [‐2.63, 4.75] |
| 16 Duration of respiratory support (mechanical ventilation) (days from birth) Show forest plot | 6 | Mean Difference (IV, Fixed, 95% CI) | Subtotals only | |
| 16.1 FiO2 0.21 versus FiO2 ≥ 0.6 to 1.0 | 3 | 197 | Mean Difference (IV, Fixed, 95% CI) | ‐0.11 [‐4.16, 3.93] |
| 16.2 FiO2 ≥ 0.3 to < 0.4 versus FiO2 ≥ 0.6 to 1.0 | 3 | 313 | Mean Difference (IV, Fixed, 95% CI) | 0.82 [‐1.38, 3.02] |
| 17 Duration of respiratory support (CPAP) (days from birth) Show forest plot | 4 | Mean Difference (IV, Fixed, 95% CI) | Subtotals only | |
| 17.1 FiO2 0.21 versus FiO2 ≥ 0.6 to 1.0 | 2 | 129 | Mean Difference (IV, Fixed, 95% CI) | ‐1.79 [‐5.84, 2.25] |
| 17.2 FiO2 ≥ 0.3 to < 0.4 versus FiO2 ≥ 0.6 to 1.0 | 2 | 120 | Mean Difference (IV, Fixed, 95% CI) | ‐0.24 [‐11.00, 10.53] |
| 18 Duration of supplemental oxygen administration Show forest plot | 5 | Mean Difference (IV, Fixed, 95% CI) | Subtotals only | |
| 18.1 FiO2 0.21 versus FiO2 ≥ 0.6 to 1.0 | 1 | 266 | Mean Difference (IV, Fixed, 95% CI) | 12.4 [9.25, 15.55] |
| 18.2 FiO2 ≥ 0.3 to < 0.4 versus FiO2 ≥ 0.6 to 1.0 | 4 | 373 | Mean Difference (IV, Fixed, 95% CI) | 0.01 [‐5.37, 5.38] |
| 19 Mortality to follow up (> 18 months) Show forest plot | 3 | Risk Ratio (M‐H, Fixed, 95% CI) | Subtotals only | |
| 19.1 FiO2 0.21 versus FiO2 ≥ 0.6 to 1.0 | 1 | 287 | Risk Ratio (M‐H, Fixed, 95% CI) | 2.32 [0.92, 5.86] |
| 19.2 FiO2 ≥ 0.3 to < 0.4 versus FiO2 ≥ 0.6 to 1.0 | 2 | 253 | Risk Ratio (M‐H, Fixed, 95% CI) | 0.56 [0.28, 1.14] |
| 20 Postnatal growth failure (weight < 10th percentile at discharge) Show forest plot | 1 | Risk Ratio (M‐H, Fixed, 95% CI) | Subtotals only | |
| 20.1 FiO2 ≥ 0.3 to < 0.4 versus FiO2 ≥ 0.6 to 1.0 | 1 | 60 | Risk Ratio (M‐H, Fixed, 95% CI) | 0.86 [0.55, 1.33] |
| 21 Duration of hospitalisation (days) Show forest plot | 3 | Mean Difference (IV, Fixed, 95% CI) | Subtotals only | |
| 21.1 FiO2 0.21 versus FiO2 ≥ 0.6 to 1.0 | 2 | 156 | Mean Difference (IV, Fixed, 95% CI) | ‐4.35 [‐15.26, 6.57] |
| 21.2 FiO2 ≥ 0.3 to < 0.4 versus FiO2 ≥ 0.6 to 1.0 | 1 | 60 | Mean Difference (IV, Fixed, 95% CI) | 28.0 [‐8.96, 64.96] |
| 22 Patent ductus arteriosus (not prespecified) Show forest plot | 7 | 766 | Risk Ratio (M‐H, Fixed, 95% CI) | 0.93 [0.77, 1.14] |
| 22.1 FiO2 0.21 versus FiO2 ≥ 0.6 to 1.0 | 3 | 393 | Risk Ratio (M‐H, Fixed, 95% CI) | 0.80 [0.57, 1.14] |
| 22.2 FiO2 ≥ 0.3 to < 0.4 versus FiO2 ≥ 0.6 to 1.0 | 4 | 373 | Risk Ratio (M‐H, Fixed, 95% CI) | 1.03 [0.82, 1.29] |
| Outcome or subgroup title | No. of studies | No. of participants | Statistical method | Effect size |
| 1 Mortality near term corrected age or discharge (latest reported) Show forest plot | 10 | 914 | Risk Ratio (M‐H, Fixed, 95% CI) | 1.05 [0.68, 1.63] |
| 1.1 SpO2 target < 85% | 1 | 287 | Risk Ratio (M‐H, Fixed, 95% CI) | 2.78 [1.03, 7.52] |
| 1.2 SpO2 target 85 to 90% | 9 | 627 | Risk Ratio (M‐H, Fixed, 95% CI) | 0.77 [0.46, 1.27] |
| 2 Neurodevelopmental disability Show forest plot | 2 | 208 | Risk Ratio (M‐H, Fixed, 95% CI) | 0.82 [0.49, 1.35] |
| 2.1 SpO2 target 85 to 90% | 2 | 208 | Risk Ratio (M‐H, Fixed, 95% CI) | 0.82 [0.49, 1.35] |
| 3 IPPV in the delivery room Show forest plot | 5 | 249 | Risk Ratio (M‐H, Fixed, 95% CI) | 0.94 [0.83, 1.06] |
| 3.1 SpO2 target 85 to 90% | 5 | 249 | Risk Ratio (M‐H, Fixed, 95% CI) | 0.94 [0.83, 1.06] |
| 4 Intubation in the delivery room Show forest plot | 9 | 875 | Risk Ratio (M‐H, Fixed, 95% CI) | 0.98 [0.82, 1.18] |
| 4.1 SpO2 target < 85% | 1 | 287 | Risk Ratio (M‐H, Fixed, 95% CI) | 1.04 [0.73, 1.49] |
| 4.2 SpO2 target 85 to 90% | 8 | 588 | Risk Ratio (M‐H, Fixed, 95% CI) | 0.96 [0.78, 1.18] |
| 5 Time to reach desired oxygen saturation target Show forest plot | 2 | 102 | Mean Difference (IV, Fixed, 95% CI) | ‐0.52 [‐1.83, 0.79] |
| 5.1 SpO2 target 85 to 90% | 2 | 102 | Mean Difference (IV, Fixed, 95% CI) | ‐0.52 [‐1.83, 0.79] |
| 6 Time to reach heart rate > 100 bpm (not prespecified) Show forest plot | 1 | 60 | Mean Difference (IV, Fixed, 95% CI) | 0.27 [‐1.21, 1.75] |
| 6.1 SpO2 target 85 to 90% | 1 | 60 | Mean Difference (IV, Fixed, 95% CI) | 0.27 [‐1.21, 1.75] |
| 7 Retinopathy of prematurity Show forest plot | 4 | 373 | Risk Ratio (M‐H, Fixed, 95% CI) | 0.80 [0.43, 1.49] |
| 7.1 SpO2 target 85 to 90% | 4 | 373 | Risk Ratio (M‐H, Fixed, 95% CI) | 0.80 [0.43, 1.49] |
| 8 Severe retinopathy of prematurity (≥ stage 3) Show forest plot | 4 | 453 | Risk Ratio (M‐H, Fixed, 95% CI) | 0.57 [0.24, 1.36] |
| 8.1 SpO2 target < 85% | 1 | 287 | Risk Ratio (M‐H, Fixed, 95% CI) | 0.50 [0.15, 1.61] |
| 8.2 SpO2 target 85 to 90% | 3 | 166 | Risk Ratio (M‐H, Fixed, 95% CI) | 0.68 [0.19, 2.48] |
| 9 Intraventricular haemorrhage Show forest plot | 3 | 271 | Risk Ratio (M‐H, Fixed, 95% CI) | 0.81 [0.46, 1.44] |
| 9.1 SpO2 target 85 to 90% | 3 | 271 | Risk Ratio (M‐H, Fixed, 95% CI) | 0.81 [0.46, 1.44] |
| 10 Severe intraventricular haemorrhage (grade 3 or 4) Show forest plot | 6 | 596 | Risk Ratio (M‐H, Fixed, 95% CI) | 0.93 [0.51, 1.71] |
| 10.1 SpO2 target < 85% | 1 | 287 | Risk Ratio (M‐H, Fixed, 95% CI) | 0.33 [0.07, 1.61] |
| 10.2 SpO2 target 85 to 90% | 5 | 309 | Risk Ratio (M‐H, Fixed, 95% CI) | 1.21 [0.61, 2.39] |
| 11 Periventricular leukomalacia Show forest plot | 2 | 130 | Risk Ratio (M‐H, Fixed, 95% CI) | 0.66 [0.09, 4.73] |
| 11.1 SpO2 target 85 to 90% | 2 | 130 | Risk Ratio (M‐H, Fixed, 95% CI) | 0.66 [0.09, 4.73] |
| 12 Necrotising enterocolitis Show forest plot | 8 | 807 | Risk Ratio (M‐H, Fixed, 95% CI) | 0.98 [0.51, 1.87] |
| 12.1 SpO2 target < 85% | 1 | 287 | Risk Ratio (M‐H, Fixed, 95% CI) | 4.97 [0.59, 41.97] |
| 12.2 SpO2 target 85 to 90% | 7 | 520 | Risk Ratio (M‐H, Fixed, 95% CI) | 0.74 [0.36, 1.52] |
| 13 Chronic lung disease (28 days' age) Show forest plot | 2 | 148 | Risk Ratio (M‐H, Fixed, 95% CI) | 0.70 [0.41, 1.21] |
| 13.1 SpO2 target 85 to 90% | 2 | 148 | Risk Ratio (M‐H, Fixed, 95% CI) | 0.70 [0.41, 1.21] |
| 14 Chronic lung disease (36 weeks' corrected age) Show forest plot | 9 | 862 | Risk Ratio (M‐H, Random, 95% CI) | 0.91 [0.64, 1.29] |
| 14.1 SpO2 target < 85% | 1 | 287 | Risk Ratio (M‐H, Random, 95% CI) | 0.84 [0.57, 1.25] |
| 14.2 SpO2 target 85 to 90% | 8 | 575 | Risk Ratio (M‐H, Random, 95% CI) | 0.91 [0.58, 1.43] |
| 15 Duration of respiratory support (mechanical ventilation or CPAP) (days from birth) Show forest plot | 2 | 326 | Mean Difference (IV, Fixed, 95% CI) | ‐12.39 [‐13.49, ‐11.29] |
| 15.1 SpO2 target < 85% | 1 | 266 | Mean Difference (IV, Fixed, 95% CI) | ‐13.70 [‐14.85, ‐12.55] |
| 15.2 SpO2 target 85 to 90% | 1 | 60 | Mean Difference (IV, Fixed, 95% CI) | 1.06 [‐2.63, 4.75] |
| 16 Duration of respiratory support (mechanical ventilation) (days from birth) Show forest plot | 6 | 510 | Mean Difference (IV, Fixed, 95% CI) | 0.78 [‐1.15, 2.72] |
| 16.1 SpO2 target 85 to 90% | 6 | 510 | Mean Difference (IV, Fixed, 95% CI) | 0.78 [‐1.15, 2.72] |
| 17 Duration of respiratory support (CPAP) (days from birth) Show forest plot | 4 | 249 | Mean Difference (IV, Fixed, 95% CI) | ‐1.83 [‐5.62, 1.96] |
| 17.1 SpO2 target 85 to 90% | 4 | 249 | Mean Difference (IV, Fixed, 95% CI) | ‐1.83 [‐5.62, 1.96] |
| 18 Duration of supplemental oxygen administration Show forest plot | 5 | 639 | Mean Difference (IV, Fixed, 95% CI) | 9.67 [6.96, 12.39] |
| 18.1 SpO2 target < 85% | 1 | 266 | Mean Difference (IV, Fixed, 95% CI) | 12.4 [9.25, 15.55] |
| 18.2 SpO2 target 85 to 90% | 4 | 373 | Mean Difference (IV, Fixed, 95% CI) | 1.73 [‐3.64, 7.11] |
| 19 Mortality to follow up (> 18 months) Show forest plot | 3 | 540 | Risk Ratio (M‐H, Fixed, 95% CI) | 1.00 [0.59, 1.70] |
| 19.1 SpO2 target < 85% | 1 | 287 | Risk Ratio (M‐H, Fixed, 95% CI) | 2.32 [0.92, 5.86] |
| 19.2 SpO2 target 85 to 90% | 2 | 253 | Risk Ratio (M‐H, Fixed, 95% CI) | 0.56 [0.28, 1.14] |
| 20 Postnatal growth failure (weight < 10th percentile at discharge) Show forest plot | 1 | 60 | Risk Ratio (M‐H, Fixed, 95% CI) | 0.86 [0.55, 1.33] |
| 20.1 SpO2 target 85 to 90% | 1 | 60 | Risk Ratio (M‐H, Fixed, 95% CI) | 0.86 [0.55, 1.33] |
| 21 Duration of hospitalisation (days) Show forest plot | 3 | 216 | Mean Difference (IV, Fixed, 95% CI) | ‐1.75 [‐12.22, 8.71] |
| 21.1 SpO2 target 85 to 90% | 3 | 216 | Mean Difference (IV, Fixed, 95% CI) | ‐1.75 [‐12.22, 8.71] |
| 22 Patent ductus arteriosus (not prespecified) Show forest plot | 7 | 766 | Risk Ratio (M‐H, Fixed, 95% CI) | 0.95 [0.79, 1.15] |
| 22.1 SpO2 target < 85% | 1 | 287 | Risk Ratio (M‐H, Fixed, 95% CI) | 0.87 [0.59, 1.28] |
| 22.2 SpO2 target 85 to 90% | 6 | 479 | Risk Ratio (M‐H, Fixed, 95% CI) | 0.98 [0.79, 1.22] |
| Outcome or subgroup title | No. of studies | No. of participants | Statistical method | Effect size |
| 1 Mortality near term corrected age or discharge (latest reported) Show forest plot | 7 | 737 | Risk Ratio (M‐H, Fixed, 95% CI) | 1.21 [0.72, 2.02] |
| 1.1 SpO2 target 85 to 90% | 1 | 42 | Risk Ratio (M‐H, Fixed, 95% CI) | 1.61 [0.41, 6.34] |
| 1.2 SpO2 target 91 to 95% | 6 | 695 | Risk Ratio (M‐H, Fixed, 95% CI) | 1.16 [0.67, 2.01] |
| 2 Neurodevelopmental disability Show forest plot | 1 | 177 | Risk Ratio (M‐H, Fixed, 95% CI) | 0.71 [0.42, 1.21] |
| 2.1 SpO2 target 91 to 95% | 1 | 177 | Risk Ratio (M‐H, Fixed, 95% CI) | 0.71 [0.42, 1.21] |
| 3 IPPV in the delivery room Show forest plot | 4 | 189 | Risk Ratio (M‐H, Fixed, 95% CI) | 0.91 [0.77, 1.08] |
| 3.1 SpO2 target 85 to 90% | 1 | 42 | Risk Ratio (M‐H, Fixed, 95% CI) | 0.87 [0.60, 1.27] |
| 3.2 SpO2 target 91 to 95% | 3 | 147 | Risk Ratio (M‐H, Fixed, 95% CI) | 0.92 [0.76, 1.12] |
| 4 Intubation in the delivery room Show forest plot | 7 | 737 | Risk Ratio (M‐H, Fixed, 95% CI) | 0.96 [0.78, 1.18] |
| 4.1 SpO2 target 85 to 90% | 1 | 42 | Risk Ratio (M‐H, Fixed, 95% CI) | 0.91 [0.49, 1.68] |
| 4.2 SpO2 target 91 to 95% | 6 | 695 | Risk Ratio (M‐H, Fixed, 95% CI) | 0.96 [0.77, 1.20] |
| 5 Time to reach desired oxygen saturation target Show forest plot | 1 | 42 | Mean Difference (IV, Fixed, 95% CI) | ‐1.70 [‐3.28, ‐0.12] |
| 5.1 SpO2 target 85 to 90% | 1 | 42 | Mean Difference (IV, Fixed, 95% CI) | ‐1.70 [‐3.28, ‐0.12] |
| 6 Retinopathy of prematurity Show forest plot | 2 | 235 | Risk Ratio (M‐H, Fixed, 95% CI) | 1.00 [0.36, 2.79] |
| 6.1 SpO2 target 85 to 90% | 1 | 42 | Risk Ratio (M‐H, Fixed, 95% CI) | 0.61 [0.06, 6.17] |
| 6.2 SpO2 target 91 to 95% | 1 | 193 | Risk Ratio (M‐H, Fixed, 95% CI) | 1.14 [0.36, 3.61] |
| 7 Severe retinopathy of prematurity (≥ stage 3) Show forest plot | 3 | 393 | Risk Ratio (M‐H, Fixed, 95% CI) | 0.43 [0.16, 1.14] |
| 7.1 SpO2 target 91 to 95% | 3 | 393 | Risk Ratio (M‐H, Fixed, 95% CI) | 0.43 [0.16, 1.14] |
| 8 Intraventricular haemorrhage Show forest plot | 2 | 211 | Risk Ratio (M‐H, Fixed, 95% CI) | 0.70 [0.30, 1.64] |
| 8.1 SpO2 target 91 to 95% | 2 | 211 | Risk Ratio (M‐H, Fixed, 95% CI) | 0.70 [0.30, 1.64] |
| 9 Severe intraventricular haemorrhage (grade 3 or 4) Show forest plot | 4 | 458 | Risk Ratio (M‐H, Fixed, 95% CI) | 0.72 [0.30, 1.73] |
| 9.1 SpO2 target 85 to 90% | 1 | 42 | Risk Ratio (M‐H, Fixed, 95% CI) | 0.61 [0.12, 2.95] |
| 9.2 SpO2 target 91 to 95% | 3 | 416 | Risk Ratio (M‐H, Fixed, 95% CI) | 0.78 [0.27, 2.24] |
| 10 Periventricular leukomalacia Show forest plot | 2 | 130 | Risk Ratio (M‐H, Fixed, 95% CI) | 0.66 [0.09, 4.73] |
| 10.1 SpO2 target 85 to 90% | 1 | 42 | Risk Ratio (M‐H, Fixed, 95% CI) | 1.21 [0.08, 18.09] |
| 10.2 SpO2 target 91 to 95% | 1 | 88 | Risk Ratio (M‐H, Fixed, 95% CI) | 0.33 [0.01, 7.97] |
| 11 Necrotising enterocolitis Show forest plot | 6 | 669 | Risk Ratio (M‐H, Fixed, 95% CI) | 0.81 [0.39, 1.67] |
| 11.1 SpO2 target 85 to 90% | 1 | 42 | Risk Ratio (M‐H, Fixed, 95% CI) | 0.4 [0.02, 9.29] |
| 11.2 SpO2 target 91 to 95% | 5 | 627 | Risk Ratio (M‐H, Fixed, 95% CI) | 0.85 [0.40, 1.79] |
| 12 Chronic lung disease (28 days age) Show forest plot | 1 | 88 | Risk Ratio (M‐H, Fixed, 95% CI) | 0.47 [0.23, 0.98] |
| 12.1 SpO2 target 91 to 95% | 1 | 88 | Risk Ratio (M‐H, Fixed, 95% CI) | 0.47 [0.23, 0.98] |
| 13 Chronic lung disease (36 weeks' corrected age) Show forest plot | 7 | 734 | Risk Ratio (M‐H, Fixed, 95% CI) | 0.93 [0.73, 1.19] |
| 13.1 SpO2 target 85 to 90% | 1 | 42 | Risk Ratio (M‐H, Fixed, 95% CI) | 0.73 [0.20, 2.65] |
| 13.2 SpO2 target 91 to 95% | 6 | 692 | Risk Ratio (M‐H, Fixed, 95% CI) | 0.94 [0.74, 1.21] |
| 14 Duration of respiratory support (mechanical ventilation or CPAP) (days from birth) Show forest plot | 1 | 266 | Mean Difference (IV, Fixed, 95% CI) | ‐13.70 [‐14.85, ‐12.55] |
| 14.1 SpO2 target 91 to 95% | 1 | 266 | Mean Difference (IV, Fixed, 95% CI) | ‐13.70 [‐14.85, ‐12.55] |
| 15 Duration of respiratory support (mechanical ventilation) (days from birth) Show forest plot | 5 | 432 | Mean Difference (IV, Fixed, 95% CI) | 0.91 [‐1.02, 2.85] |
| 15.1 SpO2 target 85 to 90% | 1 | 42 | Mean Difference (IV, Fixed, 95% CI) | ‐4.75 [‐37.24, 27.74] |
| 15.2 SpO2 target 91 to 95% | 4 | 390 | Mean Difference (IV, Fixed, 95% CI) | 0.94 [‐1.01, 2.88] |
| 16 Duration of respiratory support (CPAP) (days from birth) Show forest plot | 3 | 171 | Mean Difference (IV, Fixed, 95% CI) | ‐3.11 [‐7.08, 0.86] |
| 16.1 SpO2 target 85 to 90% | 1 | 42 | Mean Difference (IV, Fixed, 95% CI) | 12.0 [‐9.18, 33.18] |
| 16.2 Higher SpO2 target 91 to 95% | 2 | 129 | Mean Difference (IV, Fixed, 95% CI) | ‐3.66 [‐7.71, 0.38] |
| 17 Duration of supplemental oxygen administration Show forest plot | 3 | 501 | Mean Difference (IV, Fixed, 95% CI) | 9.87 [7.12, 12.62] |
| 17.1 SpO2 target 85 to 90% | 1 | 42 | Mean Difference (IV, Fixed, 95% CI) | ‐10.25 [‐50.97, 30.47] |
| 17.2 SpO2 target 91 to 95% | 2 | 459 | Mean Difference (IV, Fixed, 95% CI) | 9.96 [7.21, 12.71] |
| 18 Mortality to follow up (> 18 months) Show forest plot | 2 | 480 | Risk Ratio (M‐H, Fixed, 95% CI) | 1.22 [0.65, 2.29] |
| 18.1 SpO2 target 91 to 95% | 2 | 480 | Risk Ratio (M‐H, Fixed, 95% CI) | 1.22 [0.65, 2.29] |
| 19 Duration of hospitalisation (days) Show forest plot | 2 | 156 | Mean Difference (IV, Fixed, 95% CI) | ‐4.35 [‐15.26, 6.57] |
| 19.1 SpO2 target 91 to 95% | 2 | 156 | Mean Difference (IV, Fixed, 95% CI) | ‐4.35 [‐15.26, 6.57] |
| 20 Patent ductus arteriosus (not prespecified) Show forest plot | 5 | 628 | Risk Ratio (M‐H, Fixed, 95% CI) | 0.96 [0.75, 1.22] |
| 20.1 SpO2 target 85 to 90% | 1 | 42 | Risk Ratio (M‐H, Fixed, 95% CI) | 1.10 [0.60, 2.01] |
| 20.2 SpO2 target 91 to 95% | 4 | 586 | Risk Ratio (M‐H, Fixed, 95% CI) | 0.94 [0.72, 1.22] |
| Outcome or subgroup title | No. of studies | No. of participants | Statistical method | Effect size |
| 1 Mortality near term corrected age or discharge (latest reported) Show forest plot | 8 | 832 | Risk Ratio (M‐H, Fixed, 95% CI) | 1.01 [0.66, 1.55] |
| 1.1 Gestation ≤ 28 weeks | 8 | 516 | Risk Ratio (M‐H, Fixed, 95% CI) | 1.04 [0.68, 1.61] |
| 1.2 Gestation > 28 to 32 weeks | 4 | 316 | Risk Ratio (M‐H, Fixed, 95% CI) | 0.5 [0.05, 5.26] |
| 2 Neurodevelopmental disability Show forest plot | 1 | 31 | Risk Ratio (M‐H, Fixed, 95% CI) | 3.64 [0.42, 31.27] |
| 2.1 Gestation ≤ 28 weeks | 1 | 31 | Risk Ratio (M‐H, Fixed, 95% CI) | 3.64 [0.42, 31.27] |
| 3 IPPV in the delivery room Show forest plot | 2 | 102 | Risk Ratio (M‐H, Fixed, 95% CI) | 0.96 [0.84, 1.09] |
| 3.1 Gestation ≤ 28 weeks | 2 | 102 | Risk Ratio (M‐H, Fixed, 95% CI) | 0.96 [0.84, 1.09] |
| 4 Intubation in the delivery room Show forest plot | 4 | 467 | Risk Ratio (M‐H, Fixed, 95% CI) | 1.08 [0.85, 1.35] |
| 4.1 Gestation ≤ 28 weeks | 4 | 338 | Risk Ratio (M‐H, Fixed, 95% CI) | 1.06 [0.84, 1.34] |
| 4.2 Gestation > 28 to 32 weeks | 1 | 129 | Risk Ratio (M‐H, Fixed, 95% CI) | 1.20 [0.49, 2.97] |
| 5 Time to reach desired oxygen saturation target Show forest plot | 2 | 102 | Mean Difference (IV, Fixed, 95% CI) | ‐0.52 [‐1.83, 0.79] |
| 5.1 Gestation ≤ 28 weeks | 2 | 102 | Mean Difference (IV, Fixed, 95% CI) | ‐0.52 [‐1.83, 0.79] |
| 6 Time to reach heart rate > 100 bpm Show forest plot | 1 | 60 | Mean Difference (IV, Fixed, 95% CI) | 0.27 [‐1.21, 1.75] |
| 6.1 Gestation ≤ 28 weeks | 1 | 60 | Mean Difference (IV, Fixed, 95% CI) | 0.27 [‐1.21, 1.75] |
| 7 Retinopathy of prematurity Show forest plot | 4 | 259 | Risk Ratio (M‐H, Fixed, 95% CI) | 0.72 [0.38, 1.33] |
| 7.1 Gestation ≤ 28 weeks | 4 | 259 | Risk Ratio (M‐H, Fixed, 95% CI) | 0.72 [0.38, 1.33] |
| 8 Severe retinopathy of prematurity (≥ stage 3) Show forest plot | 5 | 464 | Risk Ratio (M‐H, Fixed, 95% CI) | 0.93 [0.46, 1.89] |
| 8.1 Gestation ≤ 28 weeks | 5 | 317 | Risk Ratio (M‐H, Fixed, 95% CI) | 0.88 [0.43, 1.82] |
| 8.2 Gestation > 28 to 32 weeks | 1 | 147 | Risk Ratio (M‐H, Fixed, 95% CI) | 2.26 [0.09, 54.54] |
| 9 Intraventricular haemorrhage Show forest plot | 2 | 217 | Risk Ratio (M‐H, Fixed, 95% CI) | 0.87 [0.52, 1.48] |
| 9.1 Gestation ≤ 28 weeks | 2 | 217 | Risk Ratio (M‐H, Fixed, 95% CI) | 0.87 [0.52, 1.48] |
| 10 Severe intraventricular haemorrhage (grade 3 or 4) Show forest plot | 6 | 537 | Risk Ratio (M‐H, Fixed, 95% CI) | 1.02 [0.55, 1.87] |
| 10.1 Gestation ≤ 28 weeks | 6 | 388 | Risk Ratio (M‐H, Fixed, 95% CI) | 0.95 [0.51, 1.79] |
| 10.2 Gestation > 28 to 32 weeks | 2 | 149 | Risk Ratio (M‐H, Fixed, 95% CI) | 3.27 [0.15, 72.23] |
| 11 Periventricular leukomalacia Show forest plot | 1 | 42 | Risk Ratio (M‐H, Fixed, 95% CI) | 1.21 [0.08, 18.09] |
| 11.1 Gestation ≤ 28 weeks | 1 | 42 | Risk Ratio (M‐H, Fixed, 95% CI) | 1.21 [0.08, 18.09] |
| 12 Necrotising enterocolitis Show forest plot | 7 | 731 | Risk Ratio (M‐H, Fixed, 95% CI) | 1.57 [0.78, 3.17] |
| 12.1 Gestation ≤ 28 weeks | 7 | 483 | Risk Ratio (M‐H, Fixed, 95% CI) | 1.79 [0.80, 4.01] |
| 12.2 Gestation > 28 to 32 weeks | 3 | 248 | Risk Ratio (M‐H, Fixed, 95% CI) | 1.02 [0.23, 4.47] |
| 13 Chronic lung disease (28 days age) Show forest plot | 1 | 60 | Risk Ratio (M‐H, Fixed, 95% CI) | 1.27 [0.53, 3.05] |
| 13.1 Gestation ≤ 28 weeks | 1 | 60 | Risk Ratio (M‐H, Fixed, 95% CI) | 1.27 [0.53, 3.05] |
| 14 Chronic lung disease (36 weeks' corrected age) Show forest plot | 8 | 694 | Risk Ratio (M‐H, Fixed, 95% CI) | 0.90 [0.72, 1.13] |
| 14.1 Gestation ≤ 28 weeks | 8 | 411 | Risk Ratio (M‐H, Fixed, 95% CI) | 0.90 [0.72, 1.13] |
| 14.2 Gestation > 28 to 32 weeks | 3 | 283 | Risk Ratio (M‐H, Fixed, 95% CI) | 0.92 [0.36, 2.33] |
| 15 Duration of respiratory support (mechanical ventilation or CPAP) (days from birth) Show forest plot | 1 | 60 | Mean Difference (IV, Fixed, 95% CI) | 1.06 [‐2.63, 4.75] |
| 15.1 Gestation ≤ 28 weeks | 1 | 60 | Mean Difference (IV, Fixed, 95% CI) | 1.06 [‐2.63, 4.75] |
| 16 Duration of respiratory support (mechanical ventilation) (days from birth) Show forest plot | 2 | 120 | Mean Difference (IV, Fixed, 95% CI) | ‐13.64 [‐32.62, 5.33] |
| 16.1 Gestation ≤ 28 weeks | 2 | 120 | Mean Difference (IV, Fixed, 95% CI) | ‐13.64 [‐32.62, 5.33] |
| 17 Duration of respiratory support (CPAP) (days from birth) Show forest plot | 2 | 120 | Mean Difference (IV, Fixed, 95% CI) | ‐2.09 [‐12.85, 8.67] |
| 17.1 Gestation ≤ 28 weeks | 2 | 120 | Mean Difference (IV, Fixed, 95% CI) | ‐2.09 [‐12.85, 8.67] |
| 18 Duration of supplemental oxygen administration Show forest plot | 3 | 180 | Mean Difference (IV, Fixed, 95% CI) | ‐0.50 [‐16.90, 15.91] |
| 18.1 Gestation ≤ 28 weeks | 3 | 180 | Mean Difference (IV, Fixed, 95% CI) | ‐0.50 [‐16.90, 15.91] |
| 19 Mortality to follow up (> 18 months) Show forest plot | 1 | 60 | Risk Ratio (M‐H, Fixed, 95% CI) | 0.55 [0.20, 1.53] |
| 19.1 Gestation ≤ 28 weeks | 1 | 60 | Risk Ratio (M‐H, Fixed, 95% CI) | 0.55 [0.20, 1.53] |
| 20 Postnatal growth failure (weight < 10th percentile at discharge) Show forest plot | 1 | 60 | Risk Ratio (M‐H, Fixed, 95% CI) | 0.86 [0.55, 1.33] |
| 20.1 Gestation ≤ 28 weeks | 1 | 60 | Risk Ratio (M‐H, Fixed, 95% CI) | 0.86 [0.55, 1.33] |
| 21 Duration of hospitalisation (days) Show forest plot | 1 | 60 | Mean Difference (IV, Fixed, 95% CI) | 28.0 [‐8.96, 64.96] |
| 21.1 Gestation ≤ 28 weeks | 1 | 60 | Mean Difference (IV, Fixed, 95% CI) | 28.0 [‐8.96, 64.96] |
| 22 Patent ductus arteriosus (not prespecified) Show forest plot | 7 | 710 | Risk Ratio (M‐H, Fixed, 95% CI) | 0.96 [0.81, 1.14] |
| 22.1 Gestation ≤ 28 weeks | 7 | 483 | Risk Ratio (M‐H, Fixed, 95% CI) | 0.95 [0.80, 1.14] |
| 22.2 Gestation > 28 to 32 weeks | 2 | 227 | Risk Ratio (M‐H, Fixed, 95% CI) | 1.05 [0.54, 2.05] |
| Outcome or subgroup title | No. of studies | No. of participants | Statistical method | Effect size |
| 1 Mortality near term corrected age or discharge (latest reported) Show forest plot | 2 | 253 | Risk Ratio (M‐H, Fixed, 95% CI) | 0.51 [0.25, 1.07] |
| 2 Neurodevelopmental disability Show forest plot | 2 | 208 | Risk Ratio (M‐H, Fixed, 95% CI) | 0.82 [0.49, 1.35] |
| 3 IPPV in the delivery room Show forest plot | 1 | 60 | Risk Ratio (M‐H, Fixed, 95% CI) | 1.0 [0.94, 1.07] |
| 4 Intubation in the delivery room Show forest plot | 2 | 253 | Risk Ratio (M‐H, Fixed, 95% CI) | 1.16 [0.79, 1.70] |
| 5 Time to reach desired oxygen saturation target Show forest plot | 1 | 60 | Mean Difference (IV, Fixed, 95% CI) | 2.09 [‐0.26, 4.44] |
| 6 Time to reach heart rate > 100 bpm (not prespecified) Show forest plot | 1 | 60 | Mean Difference (IV, Fixed, 95% CI) | 0.27 [‐1.21, 1.75] |
| 7 Retinopathy of prematurity Show forest plot | 2 | 253 | Risk Ratio (M‐H, Fixed, 95% CI) | 0.85 [0.39, 1.86] |
| 8 Severe retinopathy of prematurity (≥ stage 3) Show forest plot | 1 | 60 | Risk Ratio (M‐H, Fixed, 95% CI) | 3.86 [0.19, 77.05] |
| 9 Intraventricular haemorrhage Show forest plot | 2 | 253 | Risk Ratio (M‐H, Fixed, 95% CI) | 0.85 [0.47, 1.53] |
| 10 Severe intraventricular haemorrhage (grade 3 or 4) Show forest plot | 1 | 60 | Risk Ratio (M‐H, Fixed, 95% CI) | 0.76 [0.17, 3.48] |
| 11 Necrotising enterocolitis Show forest plot | 2 | 253 | Risk Ratio (M‐H, Fixed, 95% CI) | 1.54 [0.46, 5.19] |
| 12 Chronic lung disease (28 days age) Show forest plot | 1 | 60 | Risk Ratio (M‐H, Fixed, 95% CI) | 1.27 [0.53, 3.05] |
| 13 Chronic lung disease (36 weeks' corrected age) Show forest plot | 2 | 243 | Risk Ratio (M‐H, Fixed, 95% CI) | 1.49 [0.90, 2.47] |
| 14 Duration of respiratory support (mechanical ventilation or CPAP) (days from birth) Show forest plot | 1 | 60 | Mean Difference (IV, Fixed, 95% CI) | 1.06 [‐2.63, 4.75] |
| 15 Duration of respiratory support (mechanical ventilation) (days from birth) Show forest plot | 1 | 193 | Mean Difference (IV, Fixed, 95% CI) | 1.25 [‐0.97, 3.47] |
| 16 Duration of supplemental oxygen administration Show forest plot | 2 | 253 | Mean Difference (IV, Fixed, 95% CI) | 2.72 [‐2.78, 8.22] |
| 17 Mortality to follow up (> 18 months) Show forest plot | 2 | 253 | Risk Ratio (M‐H, Fixed, 95% CI) | 0.56 [0.28, 1.14] |
| 18 Postnatal growth failure (weight < 10th percentile at discharge) Show forest plot | 1 | 60 | Risk Ratio (M‐H, Fixed, 95% CI) | 0.86 [0.55, 1.33] |
| 19 Duration of hospitalisation (days) Show forest plot | 1 | 60 | Mean Difference (IV, Fixed, 95% CI) | 28.0 [‐8.96, 64.96] |
| 20 Patent ductus arteriosus (not prespecified) Show forest plot | 2 | 253 | Risk Ratio (M‐H, Fixed, 95% CI) | 1.18 [0.88, 1.59] |