Selektive Noradrenalin‐Wiederaufnahmehemmer zur Behandlung von Schizophrenie
Abstract
Background
Schizophrenia is frequently a chronic and disabling illness with a heterogeneous range of symptoms. The positive symptoms usually respond to antipsychotics but the cognitive and negative symptoms of schizophrenia are difficult to treat with conventional antipsychotics and significantly impact on quality of life and social outcomes. Selective noradrenaline reuptake inhibitors (NRIs) increase prefrontal dopamine and noradrenaline levels without significantly affecting subcortical dopamine levels, making them an attractive candidate for treating cognitive and negative symptoms.
Objectives
To investigate the effects of selective noradrenaline reuptake inhibitors (NRIs), compared with a placebo or control treatment, for people with schizophrenia.
Search methods
We searched the Cochrane Schizophrenia Group’s Trials Register (up to 7 February 2017) which is based on regular searches of MEDLINE, Embase, CINAHL, BIOSIS, AMED, PubMed, PsycINFO, and registries of clinical trials. There are no language, date, document type, or publication status limitation for inclusion of records into the register. We inspected references of all included studies for further relevant studies.
Selection criteria
We included randomised controlled trials (RCTs) comparing NRIs with either a control treatment or placebo for people with schizophrenia or related disorders (such as schizoaffective disorder) by any means of diagnosis. We included trials that met our selection criteria and provided useable information.
Data collection and analysis
We independently inspected all citations from searches, identified relevant abstracts, and independently extracted data from all included studies. For binary data we calculated risk ratio (RR), for continuous data we calculated mean difference (MD), and for cognitive outcomes we derived standardised mean difference (SMD) effect sizes, all with 95% confidence intervals (CI) and using a random‐effects model. We assessed risk of bias for the included studies and used the GRADE approach to produce a 'Summary of findings' table which included our prespecified main outcomes of interest.
Main results
Searching identified 113 records. We obtained the full text of 48 of these records for closer inspection. Sixteen trials, randomising a total of 919 participants are included. The majority of trials included adults with schizophrenia or similar illness who were inpatients, and while they were poorly characterised, most appeared to include patients with a chronic presentation. The intervention NRI in nine of the 16 trials was reboxetine, with atomoxetine and viloxazine used in the remaining trials. 14 trials compared NRIs with placebo. Only two trials provided data to compare NRIs against an active control and both compared reboxetine to citalopram but at 4 weeks and 24 weeks respectively so they could not be combined in a meta‐analysis.
One trial was described as 'open' and we considered it to be at high risk of bias for randomisation and blinding, three trials were at high risk of bias for attrition, six for reporting, and two for other sources of bias. Our main outcomes of interest were significant response or improvement in positive/negative mental state, global state and cognitive functioning, average cognitive functioning scores, significant response or improvement in quality of life and incidence of nausea. All data for main outcomes were short term.
NRIs versus placebo
Mental state results showed significantly greater rates of improvement in negative symptoms scores (1 RCT, n = 50; RR 3.17, 95% CI 1.52 to 6.58; very low quality evidence) with NRIs on the PANSS negative. No data were reported for significant response or improvement in positive symptoms, but average endpoint PANSS positive scores were available and showed no difference between NRIs and placebo (5 RCTs, n = 294; MD −0.16, 95% CI −0.96 to 0.63; low‐quality evidence). Improvement in clinical global status was similar between groups (1 RCT, n = 28; RR 0.99, 95% CI 0.45 to 2.20; very low quality evidence). Significant response or improvement in cognitive functioning data were not reported. Average composite cognitive scores showed no difference between NRIs and placebo (4 RCTs, n = 180; SMD 0.04, 95% CI −0.28 to 0.36; low‐quality evidence). Significant response or improvement in quality of life data were not reported, however average endpoint scores from the GQOLI‐74 were reported. Those receiving NRIs had better quality of life scores compared to placebo (1 RCT, n = 114; MD 9.36, 95% CI 7.89 to 10.83; very low quality evidence). All‐cause withdrawals did not differ between the treatment groups (8 RCTs, n = 401, RR 0.94 95% CI 0.63 to 1.39; moderate‐quality evidence). Rates of nausea were not greater with NRIs (3 RCTs, n = 176; RR 0.49, 95% CI 0.10 to 2.41; low‐quality evidence).
Authors' conclusions
Our results provide tentative very low quality evidence that compared to placebo, NRIs (specifically reboxetine) may have a benefit on the negative symptoms of schizophrenia. Limited evidence also suggests that NRIs have no effect on the positive symptoms of schizophrenia or cognitive functioning. NRIs appear generally well tolerated with no real differences in adverse effects such as nausea noted between NRIs and placebo. However, these results are based on short‐term follow‐up and are poor quality — there is need for more good‐quality evidence. A large RCT of reboxetine over a longer period of time, focusing specifically on negative and cognitive symptoms as well as more detailed and comprehensive reporting of outcomes, including adverse events, is required.
PICO
Laienverständliche Zusammenfassung
Selektive Noradrenalin‐Wiederaufnahmehemmer (NRIs) zur Behandlung von Schizophrenie
Fragestellung
Sind selektive Noradrenalin‐Wiederaufnahmehemmer (NRIs) wirksam, um die Symptome, v.a. die Negativsymptomatik, von Schizophrenie zu behandeln?
Hintergrund
Menschen mit Schizophrenie haben oft eine Positivsymptomatik, wie das Hören von Stimmen (Halluzinationen), bizarre Vorstellungen (Wahnvorstellungen), oder verwirrtes Denken (formale Denkstörung). Diese können mit antipsychotischen Medikamenten erfolgreich behandelt werden. Menschen mit Schizophrenie haben auch eine Negativsymptomatik, wie sozialer Rückzug oder mangelnde Motivation, und kognitive Symptome, wie Schwierigkeiten bei Entscheidungen und Probleme mit der Aufmerksamkeit oder dem Gedächtnis. Negativsymptome sind häufig langandauernd und führen zu einer Reduzierung der Lebensqualität. Im Gegensatz zu der Positivsymptomatik gibt es einen Mangel an wirksamer Medikation, um diese Negativsymptomatik zu behandeln.
Noradrenalin‐Wiederaufnahmehemmer (z. B. Reboxetin oder Atomoxetin) sind Medikamente, die vor allem bei den Negativsymptomen der Schizophrenie helfen könnten. Es gibt Studien, die die Wirksamkeit von NRIs zur Behandlung von Menschen mit Schizophrenie untersuchten, aber die gefundenen Ergebnisse sprachen ihnen nur einen geringen Nutzen zu. Allerdings handelte es sich um sehr kleine Studien. Wir wollten herausfinden, ob die Zusammenführung der Ergebnisse aus diesen Studien Evidenz von besserer Qualität erbringen würde.
Suchmethoden und Studienmerkmale
Der Informationspecialist von Cochrane Schizophrenia durchsuchte ihr Spezialregister nach relevanten Studien bis Februar 2017. Wir fanden sechzehn Studien, die eingeschlossen werden konnten. Diese Studien waren randomisierte Studien mit 919 Erwachsenen mit Schizophrenie, die einen NRI, ein Placebo (Scheinbehandlung) oder ein Antidepressivum erhielten. Alle Teilnehmer erhielten weiterhin die antipsychotischen Medikamente, die sie bereits einnahmen. Die meisten Studien enthielten Teilnehmer, die im Krankenhaus waren und Symptome der Schizophrenie schon sehr lange aufwiesen.
Hauptergebnisse und Qualität der verfügbaren Evidenz
Unsere hauptsächlichen Interessenschwerpunkte waren die Wirkung, die NRIs bei der Verbesserung des mentalen und allgemeinen Zustands haben, kognitive Funktion und Lebensqualität von Menschen mit Schizophrenie; und ob NRIs unangenehme Nebenwirkungen, wie Übelkeit, verursachen.
Wir fanden heraus, dass im Vergleich zur Behandlung mit Placebo, NRIs (v.a. Reboxetin) Auswirkungen auf die Verbesserung der Negativsymptome haben. Allerdings fanden wir keine Evidenz, dass NRIs sich auf die Verbesserung der Positivsymptomatik, kognitive Funktion oder Auftreten von Übelkeit auswirken. Eine Studie berichtete einen Nutzen von Reboxetin in Bezug auf die Lebensqualität.
Schlussfolgerungen
Die Ergebnisse unseres Reviews sollten mit Vorsicht betrachtet werden, da die Qualität der verfügbaren Evidenz aufgrund der geringen Größe der Studien und der geringen Qualität der Studien sehr niedrig ist. Um sichere Schlussfolgerungen zur Wirksamkeit von NRIs für Menschen mit Schizophrenie zu ziehen, brauchen wir größere und qualitativ hochwertigere Studien zu NRIs. Diese sollten langfristig sein und vor allem negative und kognitive Symptome, sowie Nebenwirkungen betrachten.
Authors' conclusions
Summary of findings
| Selective noradrenaline reuptake inhibitor (NRI) versus placebo in schizophrenia | ||||||
| Patient or population: adults with schizophrenia | ||||||
| Outcomes | Anticipated absolute effects* (95% CI) | Relative effect | № of participants | Quality of the evidence | Comments | |
| Risk with placebo | Risk with NRI | |||||
| Mental state: significant response or improvement in negative symptoms (PANSS negative subscale, high = worse) ‐ short term (12 weeks) | Study population | RR 3.17 | 50 | ⊕⊝⊝⊝ | Additional information from average negative symptoms score was equivocal | |
| 240 per 1000 | 761 per 1000 | |||||
| Mental state: specific ‐ average positive symptoms score (PANSS positive subscale, high = worse) ‐ short term (2 to 12 weeks) | ‐ | The mean PANSS positive score in the intervention group was 0.16 less (0.96 less to 0.63 more) | ‐ | 294 | ⊕⊕⊝⊝ | No data reported for our prespecified outcome: significant response or improvement in positive symptoms SAPS and BPRS positive subscale outcomes showed similar results |
| Clinical global response: significant response or improvement in global status (CGI‐S, high = worse) ‐ short term (4 weeks) | Study population | RR 0.99 | 28 | ⊕⊝⊝⊝ | Additional information from average clinical global status score found a similar lack of effect | |
| 467 per 1000 | 462 per 1000 | |||||
| Cognitive functioning: significant response or improvement in cognitive functioning | no data reported for this outcome | |||||
| Cognitive functioning: average compostive endpoint score (SMD, low = favours NRI) ‐ short term (2 to 12 weeks) | The mean composite cognitive functioning SMD in the intervention group was 0.04 standard deviations more (0.28 less to 0.36 more) | ‐ | 180 | ⊕⊕⊝⊝ | ||
| Quality of life: Average endpoint score (GQOLI‐74, high = better) ‐ short term (2 to 12 weeks) | ‐ | The mean GQOLI‐74 score in the intervention group was 9.36 more (7.89 more to 10.83 more) | ‐ | 114 | ⊕⊝⊝⊝ | No data reported for our prespecified outcome of significant response or improvement in quality of life |
| Adverse effects: Nausea ‐ short term (2 to 12 weeks) | Study population | RR 0.49 | 176 | ⊕⊕⊝⊝ | ||
| 148 per 1000 | 72 per 1000 | |||||
| *The risk in the intervention group (and its 95% confidence interval) is based on the assumed risk in the comparison group and the relative effect of the intervention (and its 95% CI). | ||||||
| GRADE Working Group grades of evidence | ||||||
| 1 Imprecision: 'Serious' ‐ Small sample size ‐ Downgraded by 1 level 2 Risk of bias: 'Serious' ‐ Methods of random sequence generation and allocation concealment are poorly described ‐ Downgraded by 1 level 3 Risk of bias: 'Serious' ‐ Evidence of selective reporting bias ‐ Downgraded by 1 level 4 Inconsistency: 'No' ‐ Only 1 study ‐ Not downgraded 5 Publication bias: 'Strongly suspected' ‐ Evidence of significant relevant unpublished or unusable results ‐ Downgraded by 1 level 6 Indirectness: 'Serious' ‐ Outcome of interest was not reported so a related outcome was substituted as a surrogate ‐ Downgraded by 1 level 7 Imprecision: 'Serious' ‐ Small sample size, confidence intervals include clinically significant benefits or harms ‐ Downgraded by 1 level 8 Risk of bias: 'Serious' ‐ Includes studies with high risk of attrition, reporting, and other sources of bias ‐ Downgraded by 1 level 9 Indirectness: 'Serious' ‐ Participants recruited specifically with depressive symptoms so unrepresentative of most patients with schizophrenia ‐ Downgraded by 1 level | ||||||
Background
Description of the condition
Schizophrenia is frequently a chronic and disabling illness (Prudo 1987) but it has a variable course and patients present with a heterogeneous range of symptoms. These have been grouped into 'positive' and 'negative' categories (Crow 1980). Positive symptoms include psychotic phenomena such as hallucinations and delusions, and disorganised features including formal thought disorder, bizarre behaviour and inappropriate affect. Negative symptoms include affective flattening, lack of speech (alogia), lack of motivation (avolition) and inability to experience pleasure (anhedonia). In addition to the diagnostic symptoms associated with schizophrenia, it is now clear that it is also accompanied by cognitive deficits, particularly in working memory and attention (Bilder 2000; Weickert 2000). Cognitive and negative symptoms are difficult to treat with conventional antipsychotics and significantly impact on quality of life and social outcomes (Goldberg 2007; Green 1996; Makinen 2008).
Description of the intervention
The selective noradrenaline reuptake inhibitors (NRIs) were originally designed to specifically inhibit noradrenaline reuptake as part of the trend towards more selective targeting of antidepressant action that started with the development of the selective serotonin reuptake inhibitors (SSRIs) (Lopez‐Munoz 2009). The pharmacology of NRIs differs from the SSRIs (e.g. fluoxetine) and serotonin‐noradrenaline reuptake inhibitors (e.g. venlafaxine) by having minimal serotonergic effect.
The two main NRIs are atomoxetine and reboxetine. Atomoxetine (as tomoxetine) was originally trialled in the 1980s as an antidepressant but development was discontinued by Eli Lilly to focus on its use in attention deficit hyperactivity disorder (ADHD) for which it was licensed in the mid‐1990s (Preti 2002). Evidence for an antidepressant effect is largely negative (Fleurence 2009). Conversely, reboxetine was successfully launched by Pfizer as an antidepressant in the mid‐1990s with claims for similar efficacy to SSRIs. However, recently it has been suggested that it is in fact less effective than other antidepressants (Cipriani 2009); and, when unpublished trials are taken into account, may in fact be no better (or even harmful) compared with placebo (Eyding 2010).
Reboxetine is used in two divided doses from 8 mg to 12 mg daily (BNF 2016) with a half‐life of around 13 hours and it is primarily metabolised by the CYP3A4 isozyme of cytochrome P450 (Pfizer 2015). Atomoxetine is used in doses from 40 mg to 120 mg daily (BNF 2016). It is metabolised by the CYP2D6 isozyme of cytochrome P450 and has a half‐life that ranges from 3.6 hours in extensive metabolisers to 21 hours in poor metabolisers (Eli Lilly 2015). The main side‐effects of reboxetine and atomoxetine are loss of appetite, nausea, agitation, insomnia, dizziness, constipation, fatigue, dry mouth, sedation, sweating, and palpitations. Reboxetine is associated with postural hypotension and atomoxetine with hypertension. Rare but more serious complications include liver damage with atomoxetine and suicidal thoughts with both (BNF 2016).
How the intervention might work
In contrast with other stimulant medication (such as amphetamines), NRIs increase prefrontal dopamine without significantly affecting subcortical dopamine levels (Bymaster 2002; Masana 2011; Marcus 2010), which leads to a substantially decreased abuse potential (Jasinski 2008). This makes NRIs an attractive candidate for treating schizophrenia, and particularly negative and cognitive symptoms (Apud 2007b; Friedman 1999; Raedler 2004), since it is thought that subcortical dopamine excess underlies positive symptoms (hence the efficacy of dopamine receptor blockade with antipsychotic medication; Seeman 1975) while relative prefrontal dopamine deficit is hypothesised to contribute to negative symptoms and cognitive dysfunction (Knable 1997).
Meta‐analyses have concluded that antidepressants used as add‐on therapy show a moderate beneficial effect on negative symptoms in schizophrenia (Rummel‐Kluge 2006; Singh 2010). Amphetamines have potent dopaminergic and noradrenergic activity and there is some evidence for a beneficial effect on negative and cognitive symptoms (Daniel 1991; Nolte 2004). In ADHD (Chamberlain 2007; Faraone 2005) and in animal models (Seu 2009), atomoxetine has been associated with improved cognitive function.
Why it is important to do this review
Current recommendations for pharmacological management of negative symptoms in schizophrenia are limited and there are no strategies recommended for the pharmacological treatment of cognitive symptoms. While there is some evidence of a small benefit of certain atypical antipsychotics over typical antipsychotics the effect is small (e.g. an effect size of 0.3 for amisulpride) (Leucht 2009). Augmentation of clozapine can also give some additional benefit (e.g. an effect size of 0.4 for lamotrigine) (Tiihonen 2009). However, SSRIs or mirtazapine are usually recommended first‐line for negative symptoms (Barnes 2011; Maudsley 2015). The overall benefit of antidepressants on negative symptoms is still quite small (an effect size of 0.5 overall, 0.4 for fluoxetine specifically) (Singh 2010) with some evidence of a larger benefit with mirtazapine and mianserin (an effect size of 0.8 to 0.9) (Hecht 2012; Kishi 2014). The relatively larger benefit of mirtazapine and mianserin is interesting as these drugs act as alpha‐2 autoreceptor and heteroreceptor antagonists promoting efflux of not only serotonin but also noradrenaline.
There have been a number of trials of NRIs, both atomoxetine and reboxetine, as add‐on therapy for schizophrenia, all largely negative in their findings but each underpowered with small sample sizes. We sought to combine the data from these trials to increase the power and assess whether the totality of evidence favours the use of NRIs in schizophrenia, given strong theoretical reasons to suspect that they would be beneficial for negative and cognitive symptoms in particular.
Objectives
To investigate the effects of selective noradrenaline reuptake inhibitors (NRIs), compared with a placebo or control treatment, for people with schizophrenia.
Methods
Criteria for considering studies for this review
Types of studies
All relevant randomised controlled trials. If a trial was described as 'double blind' but implied randomisation, we would have included it in a sensitivity analysis. We excluded quasi‐randomised studies, such as those allocating by alternate days of the week. Where people were given additional treatments within a selective noradrenaline reuptake inhibitor (NRI) trial, we only included data if the adjunct treatment was evenly distributed between groups and it was only the NRI treatment that was randomised.
Types of participants
Trials with a majority of participants (≥ 70%) with schizophrenia or related disorders (including schizophreniform disorder, schizoaffective disorder, and delusional disorder, but excluding bipolar disorder or psychotic depression) by any means of diagnosis.
Types of interventions
1. Selective noradrenaline reuptake inhibitor treatment
Defined as treatment with atomoxetine, reboxetine or other NRI by any dose or mode of administration but for a minimum duration of one week; most likely as an augmentation strategy but not excluding studies as monotherapy; excluding non‐selective compounds such as those also significantly affecting dopamine or serotonin reuptake.
2. Placebo treatment
Defined as treatment with an inactive compound.
3. Active control treatment
Defined as treatment with an active compound other than an NRI.
Types of outcome measures
We grouped the outcomes into brief (less than two weeks), short‐term (two to 12 weeks), medium‐term (13 to 26 weeks), and long‐term (over 26 weeks) durations. If outcomes were available for multiple time‐points within the same overall duration we used the longest duration data (e.g. if there were outcomes for 2 weeks, 4 weeks, and 8 weeks, and 24 weeks then we used the data from 8 weeks when considering the short term and 24 weeks for the medium term).
Primary outcomes
1. Mental state
Specific ‒ significant response or improvement in negative symptoms as defined by each study.
2. Cognitive functioning
Significant response or improvement in clinical scale of cognitive functioning as defined by each study.
3. Quality of life
Significant response or improvement in quality of life as defined by each study.
4. Clinical global response
Significant response or improvement in clinical global status as defined by each study.
Secondary outcomes
1. Mental state
1.1 General: significant response or improvement in general/overall symptoms as defined by each study
1.2 General: average general/overall symptoms score
1.3 Specific: significant response or improvement in positive symptoms as defined by each study
1.4 Specific: average positive symptoms score
1.5 Specific: average negative symptoms score
1.6 Specific: significant response or improvement in mood as defined by each study
1.7 Specific: average mood score
1.8 Specific: average score for other symptoms
2. Cognitive functioning
2.1 Average clinical scale of cognitive functioning score
2.2 Significant response or improvement in composite cognitive functioning
2.3 Average composite cognitive functioning score
2.4 Significant response or improvement in working memory as defined by each study
2.5 Average working memory score
2.6 Significant response or improvement in reasoning/problem solving as defined by each study
2.7 Average reasoning/problem solving score
2.8 Significant response or improvement in speed of processing as defined by each study
2.9 Average speed of processing score
2.10 Significant response or improvement in attention as defined by each study
2.11 Average attention score
2.12 Significant response or improvement in verbal learning/memory as defined by each study
2.13 Average verbal learning/memory score
2.14 Significant response or improvement in visual learning/memory as defined by each study
2.15 Average visual learning/memory score
3. Quality of life
3.1 Average quality of life score
4. Clinical global response
4.1 Average clinical global status score
4.2 Relapse as defined by each study
5. Service utilisation outcomes
5.1 Days in hospital
5.2 Admission to hospital
6. Leaving the study early
6.1 for any reason
6.2 due to specific event (e.g. adverse event)
7. Adverse effects
7.1 Death
7.2 General adverse events and side‐effects
7.3 Significant extrapyramidal side‐effects/movement disorder as defined by each study
7.4 Average extrapyramidal side‐effects/movement disorder score
7.5 Incidence of use of antiparkinson medication
7.6 Cumulative dosage of antiparkinson medication
7.7 Average weight gain
7.8 Significant weight gain as defined by each study
8. Satisfaction with treatment
8.1 Significant improvement in satisfaction with treatment as defined by each study
8.2 Average satisfaction with treatment score
8.3 General impression of carer/other
9. Social or general functioning
9.1 Significant response or improvement in social functioning as defined by each study
9.2 Average social functioning score
9.3 Occupational status
10. Economic outcomes
11. 'Summary of findings' table
We have used the GRADE approach to interpret findings (Schünemann 2008) and used GRADE profiler (GRADE PRO) to import data from Review Manager 5 (Review Manager) to create 'Summary of findings' tables. These tables provide outcome‐specific information concerning the overall quality of evidence from each included study in the comparison, the magnitude of effect of the interventions examined, and the sum of available data on all outcomes we rate as important to patient‐care and decision making. We intended to select the following main outcomes for inclusion in the 'Summary of findings' table.
1. Mental state: Specific ‒ significant response or improvement in negative symptoms as defined by each study
2. Mental state: Specific ‒ significant response or improvement in positive symptoms as defined by each study
3. Clinical global response significant response or improvement in clinical global status as defined by each study
4. Cognitive functioning ‒ significant response or improvement in cognitive functioning as defined by each study
5. Cognitive functioning ‒ average composite cognitive functioning score
6. Quality of life ‒ significant response or improvement in quality of life as defined by each study
7. Specific adverse effect ‒ incidence of nausea as defined by each study
Search methods for identification of studies
Electronic searches
1. Cochrane Schizophrenia Group’s Trials Register
The Trials Search Coordinator (TSC) searched the Cochrane Schizophrenia Group’s Registry of Trials (20 August 2014; 17 November 2015; 7 February 2017) using the following search strategy:
(*atomoxetine* or *attentin* or *beloxepin* or *davedax* or *edonax* or *edronax* or *esreboxetine* or *FCE 20124* or *FCE 21684* or *LY 139602 * or *LY 139603* or *nisoxetine* or *norebox* or *Org 4428* or *prolift* or *reboxetine* or *solvex* or *SPN 812* or *strattera* or *talopram* or *talsupram* or *tomoxetin* or *vestra* or *NRI* or *noradrenaline reuptake* or *norepinephrine reuptake*) in Title, Abstract and Keyword Fields of REFERENCE and Intervention Field of Study
In such study‐based registers, searching the major concept retrieves all the synonyms and relevant studies because all the studies have already been organised based on their interventions and linked to the relevant topics (Shokraneh 2017).
This register is compiled by systematic searches of major resources (AMED, BIOSIS, CINAHL, ClinicalTrials.Gov, Embase, MEDLINE, PsycINFO, PubMed, WHO ICTRP) and their monthly updates; ProQuest Dissertations and Theses A&I and its quarterly update; Chinese databases (CBM, CNKI, and Wanfang) and their annual updates; handsearches; grey literature; and conference proceedings (see Group's Module). There are no language, date, document type, or publication status limitations for inclusion of records in the register.
For previous searches, see Appendix 1.
Searching other resources
1. Reference searching
We inspected references of all identified studies for further relevant studies.
2. Personal contact
We attempted to contact the corresponding author of each included study for information regarding unpublished trials.
Data collection and analysis
Selection of studies
Two authors (PM and JH) independently inspected citations from the searches and identified relevant abstracts. We obtained full reports of the abstracts meeting the review criteria or references/abstracts that authors disagreed on; and both review authors inspected them. We would have contacted the authors of studies for clarification if it had not been possible to resolve disagreement by discussion.
Data extraction and management
1. Extraction
Two review authors (PM and MP) independently extracted data from all included studies, discussed any disagreement and documented decisions. We extracted data presented only in graphs and figures whenever possible, but included only if both review authors independently had the same result. We made attempts to contact authors through an open‐ended request in order to obtain missing information or for clarification whenever necessary. If studies were multicentre we attempted to extract data relevant to each component centre separately.
2. Management
2.1 Forms
We extracted data onto standard, simple forms. Information included relevant study details including trial intervention (e.g. atomoxetine), participant numbers and diagnoses (including clinical subgroups and illness duration), baseline symptom severity (and differences between arms), demographics (age, sex), medication (concomitant antipsychotic, NRI dosage), trial duration, outcome measures, and trial quality. Baseline severity was estimated based on Clinical Global Impression (CGI) descriptors (Guy 1976); and utilising correlations between other measures and the CGI when the latter was not reported (Leucht 2005b; Levine 2013; Rabinowitz 2006).
2.2 Scale‐derived data
We included continuous data from rating scales only if:
a. the psychometric properties of the measuring instrument had been described in a peer‐reviewed journal (Marshall 2000); and
b. the measuring instrument had not been written or modified by one of the trialists for that particular trial.
Ideally, the measuring instrument should either be i. a self‐report or ii. completed by an independent rater or relative (not the therapist). We realise that this is not often reported clearly, and noted in Description of studies if this was the case or not.
2.3 Endpoint versus change data
There are advantages of both endpoint and change data. Change data can remove a component of between‐person variability from the analysis. On the other hand, calculation of change needs two assessments (baseline and endpoint) which can be difficult in unstable and difficult‐to‐measure conditions such as schizophrenia. We decided to preferentially use endpoint data if both endpoint and change data were available, if the standard deviation (SD) of end scores needed to be imputed but the SD for change scores was available then we used the latter in order to minimise the use of imputation. We combined endpoint and change data from different trials in analyses using mean differences (MD) where possible.
2.4 Skewed data
Continuous data on clinical and social outcomes are often not normally distributed. To avoid the pitfall of applying parametric tests to non‐parametric data, we applied the following standards to relevant data before inclusion.
a) Standard deviations (SDs) and means were reported in the paper or obtainable from the authors (this is not possible if the SD is imputed).
b) When a scale starts from the finite number zero, the SD, when multiplied by two, is less than the mean (as otherwise the mean is unlikely to be an appropriate measure of the centre of the distribution (Altman 1996)).
c) If a scale started from a positive value (such as the Positive and Negative Syndrome Scale, PANSS, which can have values from 30 to 210), we modified the calculation described above to take the scale starting point into account. In these cases skew is present if 2SD > (S − Smin), where S is the mean score and Smin is the minimum score. Endpoint scores on scales often have a finite start and end point and these rules can be applied. When continuous data are presented on a scale that includes a possibility of negative values (such as change data), it is difficult to tell whether data are skewed or not. Skewed data pose less of a problem when looking at means if the sample size is large and would have been entered into syntheses. We entered skewed endpoint data from studies of less than 200 participants as Additional tables rather than into analyses.
Although we could not determine whether change scores were skewed we attempted to calculate endpoint scores from these where possible and assessed these for evidence of skew. While using the associated change scores rather than endpoint scores could correct the skew it was not possible to test this so we performed a sensitivity analysis where we excluded those change scores which were associated with skewed endpoint scores.
2.5 Common measure
To facilitate comparison between trials, we converted variables that could be reported in different metrics, such as days in hospital (mean days per year, per week or per month) to a common metric (e.g. mean days per month).
2.6 Conversion of continuous to binary
We made efforts to convert outcome measures to dichotomous data where sufficient information was available. This can be done by identifying cut‐off points on rating scales and dividing participants accordingly into 'clinically improved' or 'not clinically improved'. It is generally assumed that if there is a 50% reduction in a scale‐derived score such as the Brief Psychiatric Rating Scale (BPRS, Overall 1962) or the PANSS (Kay 1986), this could be considered as a clinically significant response (Leucht 2005a; Leucht 2005b). If data based on these thresholds were not available, we used the primary cut‐off presented by the original authors. We did not use methods to estimate dichotomous outcomes directly from summary statistics (mean and SD) of continuous data. Even if we had been able to convert continuous data to dichotomous data, we would also have analysed the continuous data separately as it provides additional, complementary information to dichotomous data.
2.7 Direction of graphs
Where possible, we entered data in such a way that the area to the left of the line of no effect indicates a favourable outcome for NRIs. Where keeping to this made it impossible to avoid outcome titles with clumsy double‐negatives (e.g. 'Not un‐improved') we reported data where the left of the line indicates an unfavourable outcome and noted this in the relevant graphs.
2.8 Composite cognitive scores
We used composite scores for cognitive functioning as defined in each study. If composite scores were not reported directly then we calculated these as the mean of the individual effect sizes of outcomes presented in that study where possible (after Wykes 2011).
Assessment of risk of bias in included studies
Again, two review authors (PM and MP) worked independently to assess risk of bias by using criteria described in the Cochrane Handbook for Systematic Reviews of Interventions to assess trial quality (Higgins 2011). This set of criteria is based on evidence of associations between overestimate of effect and high risk of bias of the article such as sequence generation, allocation concealment, blinding, incomplete outcome data and selective reporting.
If the raters disagreed, they made the final rating decision by consensus. Where inadequate details of randomisation and other characteristics of trials were provided, we contacted authors of the studies in order to obtain further information. We report non‐concurrence in quality assessment , but if disputes arose as to which category a trial was to be allocated, again we resolved by discussion.
The level of risk of bias is noted in both the text of the review and in the summary of findings Table for the main comparison.
Measures of treatment effect
1. Binary data
For binary outcomes we calculated a standard estimation of the risk ratio (RR) and its 95% confidence interval (CI). It has been shown that RR is more intuitive than odds ratios (Boissel 1999); and that odds ratios tend to be interpreted as RR by clinicians (Deeks 2000). Further illustrative comparative risks are found in the summary of findings Table for the main comparison.
2. Continuous data
For continuous outcomes we estimated mean difference (MD) between groups where possible. However, we were particularly interested in measures of cognitive function and traditionally a number of different tests have been used to measure each cognitive domain. Frequently these are only really interpretable, or meaningful, when normalised. Therefore, we used effect size measures (standardised mean difference, SMD) to combine all tests reported by a study that measure the same cognitive domain and also to calculate an overall composite cognitive score for that study.
We pooled the SMD effect size measures using generic inverse variance. The mean effect size approach does not take into account covariation and therefore leads to conservative estimates (Wykes 2011) and we included effect sizes calculated this way in a sensitivity analysis. We have interpreted these estimates of composite effect size cautiously and would have contrasted them with outcomes derived from individual cognitive tests if available. When effect sizes are relatively homogeneous (as would reasonably be assumed for tests measuring the same cognitive domain), the simple mean is a suitable estimate even without taking into account the covariance structure (Marin‐Martinez 1999).
We have drawn our cognitive domains of interest in schizophrenia from the MATRICS‐NIMH review and assigned cognitive tests to domains as outlined in that paper (Nuechterlein 2004). For cognitive function scores which are not covered in Nuechterlein 2004 we referred to the primary literature to assign the best fitting cognitive domain (if any). We understand that there are significant assumptions involved in combining different outcomes scales as SMD (Higgins 2011); and we have interpreted this cautiously and only used the SMD where there is not a substantial level of heterogeneity (see Subgroup analysis and investigation of heterogeneity).
Unit of analysis issues
1. Cluster trials
Studies increasingly employ 'cluster randomisation' (such as randomisation by clinician or practice) but analysis and pooling of clustered data poses problems. Firstly, authors often fail to account for intra‐class correlation in clustered studies, leading to a 'unit of analysis' error whereby P values are spuriously low, confidence intervals unduly narrow and statistical significance overestimated (Divine 1992). This causes type I errors (Bland 1997; Gulliford 1999).
If clustering had not been accounted for in primary studies, we would have presented data in a table, with a (*) symbol to indicate the presence of a probable unit of analysis error. We would have contacted first authors of studies to obtain intra‐class correlation coefficients (ICCs) for their clustered data and adjusted for this by using accepted methods (Gulliford 1999). If clustering had been incorporated into the analysis of primary studies, we would have presented these data as if from a non‐cluster randomised study, but adjusted for the clustering effect.
We have sought statistical advice and have been advised that the binary data as presented in a report should be divided by a 'design effect'. This is calculated using the mean number of participants per cluster (m) and the ICC [Design effect = 1 + (m − 1)*ICC] (Donner 2002). If the ICC is not reported, it will be assumed to be 0.1 (Ukoumunne 1999).
If cluster studies had been appropriately analysed taking into account ICCs and relevant data had been documented in the report, we would have been able to synthesise with other studies using the generic inverse variance technique.
2. Cross‐over trials
A major concern of cross‐over trials is the carry‐over effect. It occurs if an effect (pharmacological, physiological or psychological) of the treatment in the first phase is carried over to the second phase. As a consequence, on entry to the second phase the participants can differ systematically from their initial state despite a wash‐out phase. For the same reason cross‐over trials are not appropriate if the condition of interest is unstable (Elbourne 2002). As both effects are very likely in severe mental illness, we would have only used data from the first phase of cross‐over studies.
3. Studies with multiple treatment groups
Where a study involved more than two treatment arms, if relevant we presented the additional treatment arms in comparisons. For binary data we simply added and combined within the two‐by‐two table. If data were continuous we would have combined data following the formula in section 7.7.3.8 (Combining groups) of the Cochrane Handbook for Systematic Reviews of Interventions. We would not reproduce data that is not relevant to this review.
Dealing with missing data
1. Overall loss of credibility
At some degree of loss of follow‐up, data must lose credibility (Xia 2009). We chose that, for any particular outcome, should more than 50% of data be unaccounted for, we would not reproduce these data or use them within analyses, except for the outcome of leaving the study early. If, however, more than 50% of those in one arm of a study were lost, but the total loss was less than 50%, we would mark such data with (*) to indicate that such a result may well be prone to bias.
2. Binary
In the case where attrition for a binary outcome is between 0% and 50% and where these data are not clearly described, data are presented on a 'once‐randomised‐always‐analyse' basis (an intention‐to‐treat analysis). Those leaving the study early are assumed to have the 'worst case scenario' (e.g. no clinical response). For the outcomes of death and adverse effects we used the rate of those who stayed in the study — in that particular arm of the trial — for those who did not and undertook a sensitivity analysis comparing 'completer' data only with the intention‐to‐treat analysis. Where the denominator for withdrawals was not clear we included all those in that arm of the study who did not withdraw for other reasons.
3. Continuous
3.1 Attrition
In the case where attrition for a continuous outcome was between 0% and 50% and completer‐only data were reported, we reproduced these.
3.2 Standard deviations
If SDs were not reported, we first tried to obtain the missing values from the authors. If not available, where there were missing measures of variance for continuous data, but an exact standard error (SE) and CIs were available for group means, and either P value or t value available for differences in mean, we could calculate them according to the rules described in theCochrane Handbook for Systematic Reviews of Interventions (Higgins 2011). When only the SE is reported, SDs are calculated by the formula SD = SE * √(n). Chapters 7.7.3 and 16.1.3 of the Cochrane Handbook for Systematic Reviews of Interventions present detailed formulae for estimating SDs from P values, t or F values, CIs, ranges or other statistics (Higgins 2011). If these formulae did not apply, we calculated the SDs according to an imputation method which is based on the SDs of the other included studies (Furukawa 2006). An exception to this was when we were imputing the SD for change scores when we already had the SD for endpoint data from that study: in this case we assumed a correlation between baseline and endpoint scores of 0.5 used the formulae in the Cochrane Handbook for Systematic Reviews of Interventions (after Singh 2010). We intended to validate the use of a correlation of 0.5 by deriving estimates from other studies where possible and including these empirical estimates of correlation in a sensitivity analysis. For imputing the SD for endpoint data where we have baseline and change scores we used the baseline SD and examined this assumption in a sensitivity analysis.
Although these imputation strategies can introduce error, the alternative would be to exclude a given study’s outcome and thus to lose information. We nevertheless examined the validity of the imputations in a sensitivity analysis excluding imputed values.
3.3 Last observation carried forward
We anticipated that in some studies the method of last observation carried forward (LOCF) would be employed within the study report. As with all methods of imputation to deal with missing data, LOCF introduces uncertainty about the reliability of the results (Leucht 2007). Therefore, where LOCF data were used in the trial, if less than 50% of the data had been assumed we reproduced these data if completer‐only data were not available, and indicated that they were the product of LOCF assumptions.
Assessment of heterogeneity
1. Clinical heterogeneity
We considered all included studies initially, without seeing comparison data, to judge clinical heterogeneity. We then simply inspected all studies for clearly outlying populations or situations which we had not predicted would arise. When such situations or participant groups arose, we fully discussed these.
2. Methodological heterogeneity
We considered all included studies initially, without seeing comparison data, to judge methodological heterogeneity. We simply inspected all studies for clearly outlying methods which we had not predicted would arise. When such methodological outliers arose, we fully discussed these.
3. Statistical heterogeneity
3.1 Visual inspection
We visually inspected graphs to investigate the possibility of statistical heterogeneity.
3.2 Employing the I² statistic
We investigated heterogeneity between studies by considering the I² statistic alongside the Chi² P value. The I² statistic provides an estimate of the percentage of inconsistency thought to be due to chance (Higgins 2003). The importance of the observed value of I² depends on i. magnitude and direction of effects and ii. strength of evidence for heterogeneity (e.g. P value from Chi² test, or a confidence interval for I²). We interpreted an I² estimate greater than or equal to 50% accompanied by a statistically significant Chi² statistic as evidence of substantial levels of heterogeneity (Section 9.5.2 ‒ Higgins 2011). When substantial levels of heterogeneity were found in the outcome, we explored some potential reasons for heterogeneity (Subgroup analysis and investigation of heterogeneity).
Assessment of reporting biases
Reporting biases arise when the dissemination of research findings is influenced by the nature and direction of results (Egger 1997). These are described in Section 10 of the Cochrane Handbook for Systematic Reviews of Interventions (Higgins 2011). We are aware that funnel plots may be useful in investigating reporting biases but are of limited power to detect small‐study effects (Sterne 2011). We did not use funnel plots for outcomes where there were 10 or fewer studies, or where all studies were of similar size. In other cases, if funnel plots were possible we would have sought statistical advice in their interpretation.
Where study protocols have been published, we compared these to the reported results to look for outcome reporting bias. Otherwise we looked for unreported outcome measures mentioned in the 'Methods' section of the study.
Data synthesis
We understand that there is no closed argument for preference for use of fixed‐effect or random‐effects models. The random‐effects method incorporates an assumption that the different studies are estimating different, yet related, intervention effects. This often seems to be true to us and the random‐effects model takes into account differences between studies even if there is no statistically significant heterogeneity. There is, however, a disadvantage to the random‐effects model: it puts added weight onto small studies which often are the most biased ones. Depending on the direction of effect, these studies can either inflate or deflate the effect size. We chose random‐effects models for all analyses but we examined the consequences of our choice in sensitivity analyses.
Subgroup analysis and investigation of heterogeneity
We only conducted formal subgroup or sensitivity analyses where there were more than three trials available but we investigated all outcomes for sources of heterogeneity.
1. Subgroup analyses
1.1 Individual noradrenaline reuptake inhibitors (NRIs)
As well as reporting findings from NRIs combined as a class, we also analysed data from the two main NRIs (reboxetine and atomoxetine) separately.
1.2 Clinical state, stage or problem
We are interested in making sure that information is as relevant to the current care of people with schizophrenia as possible so intended to clearly highlight the current clinical state (acute, early post‐acute, partial remission, remission) as well as the stage (prodromal, first episode, early illness, persistent) and as to whether the studies primarily focused on people with particular problems (for example, negative symptoms, treatment‐resistant illnesses).
1.3 Participant age
We grouped each study by the age range of the majority of participants included (under 18 years, 18 to 60 years, over 60 years) and analysed separately. If the proportion within each age range was not available then we allocated studies by mean age.
2. Investigation of heterogeneity
We reported if inconsistency was high. First, we investigated whether data were entered correctly. Second, if data were correct, we visually inspected the graph and removed outlying studies to see if homogeneity was restored. If substantial heterogeneity remained, we discussed this but did not perform further investigation of potential causes of heterogeneity (e.g. meta‐regression) beyond our planned subgroup and sensitivity analyses.
When unanticipated clinical or methodological heterogeneity was obvious, we simply stated hypotheses regarding these for future reviews or versions of this review. We did not undertake analyses relating to this.
Sensitivity analysis
1. Implication of randomisation
We aimed to include trials in a sensitivity analysis if they were described in some way as to imply randomisation. We included these studies and if there was no substantive difference when the implied randomised studies were added to those with better description of randomisation, then we used all relevant data from these studies.
2. Assumptions for lost binary data
Where assumptions had to be made regarding people lost to follow‐up (see Dealing with missing data), we compared our intention‐to‐treat assumptions with completer data only. If there was a substantial difference, we reported results and discussed them but continued to employ our assumption.
3. Risk of bias
We analysed the effects of excluding trials that were judged to be at high risk of bias across one or more of the domains of randomisation, allocation concealment, blinding and outcome reporting for the meta‐analysis. If the exclusion of trials at high risk of bias did not substantially alter the direction of effect or the precision of the effect estimates, then we entered relevant data from these trials in the analysis.
4. Imputed values
We undertook a sensitivity analysis to assess the effects of including data from trials where we used imputed values (see Dealing with missing data). If we noted substantial differences in the direction or precision of effect estimates in these sensitivity analyses then we did not pool data from the imputed trials with the other trials contributing to the outcome, but presented them separately. Where imputed SDs depend on an assumption of 0.5 correlation of baseline to endpoint scores, we attempted to derive an estimate of this correlation coefficient empirically from included studies and to compare this estimate with the assumption of 0.5 in a sensitivity analysis.
5. Mean effect sizes for composite cognitive scores
Where we calculated mean effect sizes to create composite cognitive scores, we attempted to examine the effect of including or excluding these from other studies where composite scores were reported directly. Where there were substantial differences, we presented these data separately.
6. Fixed‐effect and random‐effects
We synthesised all data using a random‐effects model but we also reported outcomes using a fixed‐effect model to evaluate whether the greater weights assigned to larger trials with greater event rates altered the significance of the results compared with the more evenly distributed weights in the random‐effects model.
7. Skew
Where we used change scores, but these were associated with skewed endpoint scores, we examined the effect of excluding these change scores.
Results
Description of studies
Results of the search
See Figure 1 for the search flow diagram. We identified 80 distinct records from searches up to 2012, a further six records repeating the search in 2014, a further three records in 2015, and a further 17 records in 2017. In addition we identified one further record when the search criteria were broadened in 2015. We also identified three records through handsearching citations, responses from authors contacted, and other sources.

Study flow diagram.
Of the 110 distinct records identified 62 were excluded based on the title and abstract alone as they did not meet the inclusion criteria (i.e. they were not RCTs of NRIs). We obtained the full text of 48 records. Of these, 16 distinct studies were included in the review, representing 31 records. Eight distinct studies were excluded as they did not meet the inclusion criteria, representing 11 records. There are two studies awaiting classification (see also Characteristics of studies awaiting classification) , which represent five records; and there is one ongoing study (see also Characteristics of ongoing studies). All records identified from sources other than the main search were for studies also identified by records in the main search.
In 2015 we broadened the search criteria to include further substances we identified as selective noradrenaline reuptake inhibitors, including viloxazine which we had previously included in the search under the name 'SPN‐812'. We identified one study utilising viloxazine (Kurland 1981). Viloxazine is a selective noradrenaline reuptake inhibitor that was manufactured by ICI and used as an antidepressant in Europe until being withdrawn in the early 2000s. It has since been investigated by Supernus Pharmaceuticals as an antidepressant and treatment for ADHD as SPN‐809 and SPN‐812 respectively.
Studies awaiting classification
We have identified one RCT of atomoxetine which has been terminated (Shekhar 2005) and another RCT which has been completed (Tamminga 2009) but could find no further information on the results. See Characteristics of studies awaiting classification.
Ongoing studies
We have identified one RCT of reboxetine started in 2006 for which we have not been able to determine any further information (Baranchik 2006). Therefore it is unclear if this trial is ongoing or terminated. See Characteristics of ongoing studies.
Included studies
1.1 Methods
We included sixteen studies; details of individual studies are listed in the Characteristics of included studies table. All were randomised parallel trials and double‐blind placebo controlled except for one randomised open trial (Yu 2012); while two trails also had a citalopram arm (Hinkelmann 2013; Usall 2014). All studies were published in English except for three trials in Chinese (Li 2008; Yu 2012; Zhao 2013).
Most trials were of short duration with eleven lasting between two and 12 weeks (Eli Lilly 2006; Friedman 2008; Hinkelmann 2013; Kelly 2009; Kurland 1981; Li 2008; Poyurovsky 2003; Poyurovsky 2007; Sacco 2009; Schutz 2001; Shafti 2015); and the remaining five were medium term, lasting 13 to 26 weeks (Ball 2011; Ganguli 2008; Usall 2014; Yu 2012; Zhao 2013).
1.2 Setting
Where reported, seven trials included only inpatients (Li 2008; Poyurovsky 2003; Poyurovsky 2007; Schutz 2001; Shafti 2015; Yu 2012; Zhao 2013); two only outpatients (Ball 2011; Friedman 2008); and one reported enrolling both (Kelly 2009).
1.3 Participants
Most studies included only patients diagnosed with schizophrenia (Eli Lilly 2006; Friedman 2008; Hinkelmann 2013; Kurland 1981; Schutz 2001; Shafti 2015; Usall 2014; Yu 2012; Zhao 2013) with some also including schizoaffective disorder (Ball 2011; Ganguli 2008; Kelly 2009; Sacco 2009) or schizophreniform disorder (Poyurovsky 2003; Poyurovsky 2007). Where reported, all participants were adults aged 18 to 65 years with no evidence of participants aged under 18 years or over 65 years being enrolled in trials. All studies used the Diagnostic and Statistical Manual of Mental Disorders, Fourth Edition (DSM‐IV) except two using the Chinese Classification of Mental Disorders, Third Edition (CCMD‐3) (Li 2008; Yu 2012), one using the International Classification of Diseases, 10th Revision (ICD‐10) (Zhao 2013), and one not reporting the criteria used (Kurland 1981).
Duration of illness ranged from 10 months (Yu 2012), one to six years (Li 2008; Poyurovsky 2003; Poyurovsky 2007; Zhao 2013), to over 10 years (Hinkelmann 2013; Kelly 2009; Usall 2014). Although not reporting overall duration of illness two studies indicated at least six months or two years of illness (Ball 2011 and Shafti 2015 respectively). Three studies reported including stable patients (Ball 2011; Sacco 2009; Zhao 2013); and three reported including chronic patients (Li 2008; Schutz 2001; Shafti 2015). The studies by Poyurovsky reported enrolling first episode patients but the mean duration of illness in these studies ranged from three to six years (Poyurovsky 2003; Poyurovsky 2007). Seven studies recruited patients specifically with negative symptoms (Ganguli 2008; Hinkelmann 2013; Li 2008; Shafti 2015; Usall 2014; Yu 2012; Zhao 2013); and one recruited participants with depressive symptoms (Kurland 1981). Specific inclusion criteria included patients with metabolic syndrome (Zhao 2013) or with weight gain (Ball 2011). Overall baseline severity (as rated by mean or estimated CGI score) ranged from borderline mentally ill (Friedman 2008), mildly ill (Ball 2011; Ganguli 2008; Li 2008; Schutz 2001; Usall 2014; Yu 2012; Zhao 2013), moderately ill (Poyurovsky 2003; Poyurovsky 2007), markedly ill (Hinkelmann 2013; Kelly 2009), to severely ill (Shafti 2015).
Two studies involved only patients taking clozapine (Li 2008; Zhao 2013), with two further studies including a mixture of patients taking clozapine and other atypical antipsychotics (Ball 2011; Hinkelmann 2013). The majority of studies included participants taking a variety of atypical antipsychotics (Eli Lilly 2006; Friedman 2008; Kelly 2009; Poyurovsky 2003; Poyurovsky 2007; Usall 2014; Yu 2012); while three studies included participants taking only typical antipsychotics (Kurland 1981; Schutz 2001; Shafti 2015).
1.4 Study size
There were 919 participants across all trials with 72 of these from the two studies which were only included in the qualitative discussions due to a lack of useable data (Ganguli 2008; Sacco 2009); and 39 from the citalopram arms of two trials (Hinkelmann 2013; Usall 2014). Most studies were small: two studies had 20 participants or fewer (Friedman 2008; Sacco 2009); six studies had 21 to 50 participants (Ball 2011; Kelly 2009; Kurland 1981; Poyurovsky 2003; Schutz 2001; Shafti 2015); five had 51 to 100 participants (Ganguli 2008; Hinkelmann 2013; Poyurovsky 2007; Usall 2014; Yu 2012); and three had more than 100 participants (Eli Lilly 2006; Li 2008; Zhao 2013).
1.5 Interventions
1.5.1 Reboxetine
Nine studies used reboxetine as the intervention. Most used up to 8 mg daily (Hinkelmann 2013; Li 2008; Schutz 2001; Usall 2014; Yu 2012; Zhao 2013) with the rest using up to 4 mg daily (Poyurovsky 2003; Poyurovsky 2007; Shafti 2015).
1.5.2 Atomoxetine
Six studies used atomoxetine as the intervention. Most titrated up to 80 mg daily (Eli Lilly 2006; Friedman 2008; Ganguli 2008; Kelly 2009). One study used doses up to 120 mg daily (Ball 2011); and there was one study with two arms which used 40 mg and 80 mg daily (Sacco 2009).
1.5.3 Other drug treatment arms
One study used viloxazine in doses up to 300 mg daily (Kurland 1981). In two studies, in addition to the reboxetine and placebo arms, there was also a citalopram arm with one study using doses up to 30 mg (Usall 2014) and one up to 40 mg daily (Hinkelmann 2013).
1.6 Funding
Four studies did not report their source of funding (Li 2008; Schutz 2001; Yu 2012; Zhao 2013). Three studies were funded partly or wholly by Eli Lilly (Ball 2011; Eli Lilly 2006; Friedman 2008). Eli Lilly also contributed study medication to a further trial (Kelly 2009). Two studies received medication or assistance from other pharmaceutical companies (Kurland 1981; Poyurovsky 2003). Four studies were funded partly or wholly by US Government agencies such as the National Institutes of Health (NIH) (Ball 2011; Friedman 2008; Kelly 2009; Sacco 2009); and a further two trials received funding from other state sources outside the US (Shafti 2015; Usall 2014). The Stanley Medical Research Institute provided funding for four trials (Ganguli 2008; Hinkelmann 2013; Kelly 2009; Poyurovsky 2007); and the National Alliance for Research on Schizophrenia and Depression (NARSAD) contributed funding to one study (Sacco 2009).
1.7 Outcomes
None of the included studies reported results for service utilisation, satisfaction, or economic outcomes.
1.7.1 Mental state
1.7.1.1 Positive and Negative Syndrome Scale (PANSS)
The PANSS is a 30‐item structured clinical interview producing three subscales, positive (seven items), negative (seven items) and general psychopathology (such as anxiety or depressed mood) (16 items) with individual items rated one to seven (Kay 1986). Higher scores indicate more severe illness.
1.7.1.2 Brief Psychiatric Rating Scale (BPRS)
The BPRS is a clinician‐rated instrument used to score 18 items of psychopathology (such as hallucinations or depressed mood) rated one to seven (Overall 1962). Higher scores indicate more severe illness.
1.7.1.3 Scale for the Assessment of Negative Symptoms (SANS)
The SANS is a 26‐item clinician‐rated scale measuring negative symptoms of schizophrenia across five domains (such as alogia or avolition) and items are rated from zero to five. Higher scores indicate more severe illness (Andreasen 1982).
1.7.1.4 Scale for the Assessment of Positive Symptoms (SAPS)
The SAPS is a 34‐item clinician‐rated scale measuring positive symptoms of schizophrenia across four domains (such as hallucinations or delusions) and items are rated from zero to five. Higher scores indicate more severe illness (Andreasen 1984).
1.7.1.5 Hamilton Rating Scale for Depression (HRSD)
The HRSD is a semi‐structured interview producing a 17‐item scale of depressive symptoms (such as depressed mood or feelings of guilt) with each item rated from zero to two, three, or four (depending on the item) for a maximum score of 53 (Hamilton 1980). Longer versions such as a 24‐item scale have been developed but as far as we could determine all studies utilised the 17‐item scale. Higher scores indicate more severe illness.
1.7.2. Cognitive functioning
As predicted, a wide‐range of cognitive tests were utilised in the included studies. These have been classified according to the MATRICS‐NIMH domains (Nuechterlein 2004) and individual tests are not discussed in detail.
1.7.3 Clinical global response
1.7.3.1 Clinical Global Impression (CGI)
1.7.3.1.1 Clinical Global Impression ‒ Severity (CGI‐S)
The CGI‐S is a clinician‐rated scale where the severity of the patient's illness is scored from one to seven based on clinical experience with higher scores indicating more severe illness (Guy 1976).
1.7.3.1.2 Clinical Global Impression ‒ Improvement (CGI‐I)
The CGI‐I is a clinician‐rated scale where the deterioration or improvement in the patient's illness compared to baseline is scored from one to seven where one indicates 'very much improved' and seven indicates 'very much worse' so higher scores indicate more severe illness (Guy 1976).
1.7.4 Quality of life
The General Quality of Life Inventory‐74 (GQOLI‐74) is based on the World Health Organization’s Quality of Life Assessment Instrument modified for use in a Chinese population (Lu 2007). It is a 74‐item inventory with 20 subscores in four domains. Higher scores indicate better quality of life.
1.7.5 Social functioning
1.7.5.1 Scale of Social‐skills for Psychiatric Inpatients (SSPI)
The SSPI is a published Chinese scale with ten factors of social functioning each from three items scored 0 to 2 (Guo 1995). Higher scores represent worse performance.
1.7.5.2 Specific Level of Function (SLOF)
The SLOF scale is a 43‐item instrument administered to the patient's caregiver to assess functional performance in six domains (Schneider 1983). Items are scored on a five‐point Likert scale. Higher scores indicate better performance.
1.7.6 Adverse effects
1.7.6.1 Abnormal Involuntary Movement Scale (AIMS)
The AIMS is a clinician‐rated scale to assess the severity of tardive dyskinesia (Munetz 1988). The 12 items are scored zero to four with a higher score indicating worse side‐effects.
1.7.6.2 Simpson‐Angus Scale (SAS)
The SAS is a clinician‐rated scale to assesses parkinsonism in schizophrenia (Simpson 1970). Ten items are scored zero to four, higher scores indicate worse side‐effects.
1.7.6.3 Barnes Akathisia Scale (BAS)
The BAS is a clinician‐rated scale of drug‐induced akathisia incorporating subjective and objective ratings scored from zero to three with an additional six‐point scale to assess global severity (Barnes 1989). Higher scores indicate worse side‐effects.
Excluded studies
We excluded eight studies; details of individual studies are shown in Characteristics of excluded studies. Three excluded studies were of citalopram which is not a selective NRI and thus does not meet the inclusion criteria (Barnes 2009; Hou 2007; Salokangas 1997). The publication by Mueller 2005 reported on two randomised placebo‐controlled add‐on trials of a COX2‐inhibitor, one trial examined patients with depression who were receiving reboxetine and another examined patients with schizophrenia who were receiving risperidone. Therefore it was not a trial of an NRI in schizophrenia. Shafti 2004 reported trials of multiple psychotropic medications including maprotiline. We did not regard any of these compounds as selective NRIs; in particular we excluded maprotiline due to its significant actions at multiple monoamine receptors in addition to noradrenaline reuptake inhibition.
Amrami‐Weizman 2013 combined data from Poyurovsky 2003 and Poyurovsky 2007 to report metabolic and hormonal measures which were not defined as outcomes of interest in this review. Apud 2007a conducted a cross‐over RCT of atomoxetine in schizophrenia stratified by COMT genotype: only four patients completed the trial and no data was collected. It was terminated early due to slow recruitment and as a low scientific priority for NIMH. Poyurovsky 2013 reported an RCT of the combination of reboxetine and betahistine in schizophrenia; therefore betahistine use was not equally distributed across treatment and control arms and the study did not meet inclusion criteria. This study found a benefit of the reboxetine‒betahistine combination on reducing weight gain from olanzapine but no effect on symptom outcome measures such as the SANS.
Risk of bias in included studies
Information for risk of bias across the included studies is illustrated in Figure 2 and Figure 3. There were three incidents of non‐concurrence in risk ratings: two for assessment of blinding (Friedman 2008; Kurland 1981); and one for assessment of selection bias (Shafti 2015). All decisions were between 'unclear risk' and 'low risk' and overall ratings of 'unclear risk' were agreed in all three cases. The overall value of a weighted kappa was high at 0.96 for 112 decisions across 16 trials.

Risk of bias graph: review authors' judgements about each risk of bias item presented as percentages across all included studies.

Risk of bias summary: review authors' judgements about each risk of bias item for each included study.
Allocation
All studies were described as randomised but only seven studies reported the method of randomisation and were rated as low risk (Ball 2011; Hinkelmann 2013; Kelly 2009; Poyurovsky 2003; Poyurovsky 2007; Schutz 2001; Usall 2014). One study was described as open and was considered high risk for allocation (Yu 2012). The remaining studies were described as double‐blind and placebo‐controlled although only five studies described the method of allocation concealment in detail and were rated as low risk (Ball 2011; Hinkelmann 2013; Kelly 2009; Schutz 2001; Usall 2014). The remaining studies were rated as unclear risk.
Blinding
The majority of studies did not report blinding in detail but we considered the one open study (Yu 2012) to be at high risk for inadequate blinding. Seven studies described blinding of participants and we considered them low risk (Ball 2011; Kelly 2009; Li 2008; Poyurovsky 2007; Schutz 2001; Shafti 2015; Usall 2014). Four studies described blinding of outcomes and we rated them as low risk (Poyurovsky 2003; Poyurovsky 2007; Shafti 2015; Usall 2014). We rated the remaining studies as unclear risk.
Incomplete outcome data
Six studies accounted for incomplete data and we considered them low risk (Friedman 2008; Kurland 1981; Li 2008; Poyurovsky 2003; Poyurovsky 2007; Shafti 2015); while three were classified as high risk due to a very high rate of withdrawals (Ganguli 2008) or an imbalance in withdrawals between arms (Ball 2011; Eli Lilly 2006). We rated the remaining studies as unclear risk.
Selective reporting
Eight studies appeared to report all relevant outcomes and were rated as low risk (Friedman 2008; Kelly 2009; Poyurovsky 2003; Poyurovsky 2007; Schutz 2001; Shafti 2015; Usall 2014; Zhao 2013). Six studies demonstrated selective reporting of outcomes (Ball 2011; Eli Lilly 2006; Ganguli 2008; Kurland 1981; Sacco 2009; Yu 2012). The remaining studies were rated as unclear risk.
Other potential sources of bias
The majority of studies did not demonstrate evidence of other sources of bias and we rated them as low risk. We gave two studies a high risk of bias due to excluding participants after randomisation (Kelly 2009), and evidence of methodological flaws (such as mean PANSS total scores < 30) (Yu 2012). For four studies we rated them as having an unclear risk of bias due to methodological flaws as it was not clear that these would have a significant impact on the results (Eli Lilly 2006; Ganguli 2008; Kurland 1981; Sacco 2009).
Effects of interventions
See: Summary of findings for the main comparison Noradrenaline reuptake inhibitors versus placebo
Two studies did not report any outcomes that could be used in the meta‐analysis and are included in the narrative review only (Ganguli 2008; Sacco 2009). As far as could be determined all studies included patients with a duration of illness of six months or more with the majority over one year, with many described as stable or chronic; and as we did not perform sensitivity analysis looking at duration or stage of illness except to consider studies including participants taking clozapine or recruiting specifically participants with prominent negative symptoms.
Under each heading of the summary of findings Table for the main comparison we included the analysis with the longest period of follow‐up (providing there were more than three studies to include for that time period), otherwise we used the duration which included the most studies. Where there was more than one outcome measure (e.g. PANSS and BPRS) for a time‐point we used the outcome with the most studies.
1. Comparison 1. NRI versus placebo
1.1 Primary outcome ‐ A. Mental state: Specific ‐ clinically significant response or improvement in negative symptoms (SANS, high = worse) ‐ short term (12 weeks)
While all 16 studies included in the review utilised instruments which could produce an indication of rates of improvement in negative symptoms only one provided usable data. Shafti 2015 measured response rates at 12 weeks (defined as 20% reduction in the SANS) and reported rates of 6/25 and 19/25 in the placebo and reboxetine arms respectively indicating a significant benefit of reboxetine (1 RCT, n = 50; RR 3.17, 95% CI 1.52 to 6.58; Analysis 1.1).
1.2 Primary outcome ‐ B. Clinical global response: clinically significant response or improvement in global status (CGI‐S, high = worse) ‐ short term (4 weeks)
Kurland 1981 reported non‐specific improvement rates of 7/15 and 6/13 in the placebo and viloxazine arms respectively, showing no difference (Analysis 1.2). Nine studies measured global response using the CGI‐I or CGI‐S but none defined clinical improvement on these scales or reported dichotomous outcomes.
1.3 Mental state: 1. General ‐ clinically significant response or improvement in general/overall symptoms as defined in each study ‐ short term (2 to 12 weeks)
Kurland 1981 reported non‐specific improvement rates of 7/15 and 6/13 in the placebo and violoxazine arms respectively at 4 weeks (these data have also been included under the primary outcome measure of clinical global response), while Schutz 2001 reported response rates at 6 weeks (defined as 20% reduction in PANSS total score) and we calculated ITT rates of 5/15 and 7/15 for placebo and reboxetine respectively. When combined (n = 58) we found no significant benefit of NRIs (RR 1.15, 95% CI 0.64 to 2.09; Analysis 1.3).
1.4 Mental state: 2a. General: average general/overall symptoms score (various scales, high = worse) ‐ short term (2 to 12 weeks)
Nine studies reported a useable overall clinical symptom scale or general subscale score from either the PANSS or the BPRS.
Li 2008 reported PANSS total and general endpoint scores at 12 weeks. Yu 2012 reported PANSS total endpoint scores at 8 weeks. Zhao 2013 reported PANSS total and general endpoint scores at 8 weeks. Friedman 2008 reported completer‐only PANSS general change scores at 8 weeks and we calculated LOCF PANSS general endpoint scores with an estimated SD but these were skewed and entered into Analysis 1.8. Hinkelmann 2013 reported LOCF PANSS general endpoint scores at 4 weeks which were skewed and entered into Analysis 1.8 and LOCF PANSS general change scores were calculated with an estimated SD. Kelly 2009 reported completer‐only BPRS total scores at 8 weeks which were skewed and entered into Analysis 1.8 and completer‐only BPRS change scores were calculated with an estimated SD. Schutz 2001 reported PANSS total and general endpoint scores at 6 weeks which were skewed and entered into Analysis 1.8 and we calculated change scores and estimated the SD. Usall 2014 reported PANSS total and general endpoint scores at 24 weeks which were skewed and entered into Analysis 1.8 and we calculated change scores and estimated the SD.
1.4.1 BPRS total
Kelly 2009 reported BPRS total change scores and found no benefit of atomoxetine at 8 weeks (MD 1.50, 95% CI −6.64 to 9.64; Analysis 1.4).
1.4.2 PANSS general
Five studies had results for the PANSS general subscale (n = 294) with a statistically significant benefit of NRIs (MD −2.17, 95% CI −3.93 to −0.40; Analysis 1.4).
We performed subgroup and sensitivity analysis (see Table 1). The only study of atomoxetine is Friedman 2008, which shows no benefit; and excluding this to look only at reboxetine studies makes little difference. The two studies looking at only patients on clozapine were both positive (MD −2.8; 95% CI −4.87 to −0.72) (Li 2008; Zhao 2013); and looking only at studies that included patients taking clozapine, which were the studies that specifically recruited patients with negative symptoms, made little difference to the outcome (Hinkelmann 2013; Li 2008; Zhao 2013). The change scores in Hinkelmann 2013 and Schutz 2001 have imputed SDs and excluding these slightly inflated the effect size (MD −2.66, 95% CI −4.50 to −0.82). Excluding all change scores associated with a skewed endscore (Friedman 2008; Hinkelmann 2013; Schutz 2001) left the two clozapine‐only studies utilising unskewed endpoint scores (Li 2008; Zhao 2013). A fixed‐effect model made little difference except to slightly inflate the effect size and narrow the confidence intervals (MD −2.73, 95% CI −3.71 to −1.74). No studies were at high risk of bias for randomisation but only two studies described their method in any detail (Hinkelmann 2013; Schutz 2001), and combining these showed no benefit for NRIs (MD 0.89, 95% CI −3.60 to 5.37). No studies were at high risk of bias in any domain.
| Subgroup or sensitivity analysis (see text for details) | Number of trials | N | Mean difference | 95% Confidence interval | I² |
| Overall outcome | 5 | 294 | ‐2.17 | ‐3.93 to ‐0.40* | 44% |
| Reboxetine | 4 | 279 | ‐2.20 | ‐4.15 to ‐0.25* | 55% |
| Clozapine‐only studies; excluding skewed change‐scores | 2 | 221 | ‐2.80 | ‐4.87 to ‐0.72* | 75% |
| Excluding studies without clozapine; negative symptoms | 3 | 256 | ‐2.40 | ‐4.48 to ‐0.31* | 65% |
| Excluding studies with imputed SD | 3 | 236 | ‐2.66 | ‐4.50 to ‐0.82* | 55% |
| Fixed‐effect model | 5 | 294 | ‐2.73 | ‐3.71 to ‐1.74* | 44% |
| Low risk of randomisation bias | 2 | 58 | 0.89 | ‐3.60 to 5.37 | 0% |
* Statistically significant at p<0.05
1.4.3 PANSS total
Four studies had short‐term PANSS total score results (n = 309) which showed a significant benefit of reboxetine (MD −2.84, 95% CI −5.28 to −0.40; Analysis 1.4) and substantial heterogeneity (I² = 72%).
We performed subgroup and sensitivity analysis (see Table 2). Visually there was no clear outlying trial contributing to heterogeneity but excluding the open study by Yu 2012 abolished the heterogeneity (I² = 0%) while magnifying the effect size (MD −4.20, 95% CI −5.82 to −2.58). The two studies of patients taking only clozapine both showed a significant benefit of reboxetine (MD −4.25, 95% CI −5.89 to −2.62) (Li 2008; Zhao 2013). Excluding Schutz 2001, the single study that did not specifically recruit patients with negative symptoms, made little difference to the overall effect. Schutz 2001 was also the only study using imputed SD. A fixed‐effect model made marginal difference to the overall outcome. No study was considered to be at high risk of bias for randomisation but only Schutz 2001 described the method of randomisation in detail. Yu 2012 was considered at high risk of bias for allocation concealment, blinding of participants and outcomes, selective reporting, and other sources of bias.
| Subgroup or sensitivity analysis (see text for details) | Number of trials | N | Mean difference | 95% Confidence interval | I² |
| Overall outcome | 4 | 309 | ‐2.84 | ‐5.28 to ‐0.40* | 72% |
| Clozapine‐only studies | 2 | 220 | ‐4.25 | ‐5.89 to ‐2.62* | 0% |
| Excluding outlier; excluding high risk of bias | 3 | 244 | ‐4.20 | ‐5.82 to ‐2.58* | 0% |
| Negative symptoms; excluding imputed SD | 3 | 186 | ‐2.94 | ‐5.54 to ‐0.34* | 81% |
| Fixed‐effect model | 4 | 309 | ‐2.12 | ‐3.12 to ‐1.11* | 72% |
* Statistically significant at p<0.05
1.5 Mental state: 2b. General: average general/overall symptoms score (various scales, high = worse) ‐ medium term (13 to 26 weeks)
Yu 2012 reported PANSS total endpoint scores at 16 weeks but we considered these to be skewed, partially because the mean scores were less than 30 which should not be possible with the PANSS total scale, and this was entered into Analysis 1.9. We calculated change scores at 16 weeks and estimated the SD. Zhao 2013 reported PANSS total and general endpoint scores at 24 weeks. Ball 2011 reported BPRS total endpoint scores at 24 weeks which were skewed and are entered into Analysis 1.9 and not included in the meta‐analysis but change scores were calculated with an estimated SD. Usall 2014 reported PANSS total and general endpoint scores at 24 weeks which were skewed and entered into Analysis 1.9 and we calculated change scores and estimated SD.
1.5.1 BPRS total
Ball 2011 reported BPRS total change scores and found no benefit of atomoxetine at 24 weeks (MD −1.40, 95% CI −7.08 to 4.28; Analysis 1.5).
1.5.2 PANSS general
Usall 2014 and Zhao 2013 reported the PANSS general subscale for reboxetine and these were not consistent, with the former showing no effect and the latter a large benefit for reboxetine resulting in a combined estimate that was not significant (MD −2.90, 95% CI −7.57 to 1.77; Analysis 1.5).
1.5.3 PANSS total
Three studies reported this outcome (n = 219) with a large benefit of reboxetine without statistical significance (MD −3.67, 95% CI −10.07 to 2.72; Analysis 1.5) and substantial heterogeneity (I² = 94%).
There were only three trials for medium‐term outcomes so we did not perform a full subgroup and sensitivity analysis but we did look for sources of heterogeneity. The large study by Zhao 2013, which was the only one to look at patients taking clozapine, showed a much greater benefit of reboxetine than the other two studies and could be considered an outlier visually: excluding this both abolished heterogeneity and attenuated the benefit of reboxetine (MD −1.07, 95% CI −2.59 to 0.46). A fixed‐effect model makes little difference to the estimated effect size but narrows the confidence intervals to become statistically significant (see Table 3).
| Subgroup or sensitivity analysis (see text for details) | Number of trials | N | Mean difference | 95% Confidence interval | I² |
| Overall outcome | 3 | 219 | ‐3.67 | ‐10.07 to 2.72 | 94% |
| Excluding outlier; excluding clozapine study | 2 | 112 | ‐1.07 | ‐2.59 to 0.46 | 0% |
| Fixed‐effect model | 3 | 219 | ‐3.63 | ‐4.87 to ‐2.39* | 94% |
* Statistically significant at p<0.05
1.6 Mental state: 3a. Specific: average symptoms score (various scales, high = worse) ‐ short term (2 to 12 weeks)
1.6.1 mood (BPRS)
Kelly 2009 reported BPRS anxiety/depression subscale endpoint completer scores at 8 weeks but these were skewed. We entered them into Analysis 1.8 and calculated change scores and estimated SD.
There was no difference between atomoxetine and placebo (MD 0.20, 95% CI −2.60 to 3.00; Analysis 1.6).
1.6.2 mood (HRSD)
Hinkelmann 2013 reported LOCF HRSD endpoint scores at 4 weeks but these were skewed and entered into Analysis 1.8 and we calculated change scores and imputed the SD. Poyurovsky 2003 reported endpoint scores at 6 weeks but these were skewed and entered into Analysis 1.8 and we calculated change scores and imputed the SD. Poyurovsky 2007 reported endpoint scores at 6 weeks from cognitive testing completers only but these were skewed and entered into Analysis 1.8. They also reported ITT change scores. Schutz 2001 reported endpoint scores for completers at 6 weeks but these were skewed and entered into Analysis 1.8. We could not calculate change scores but there was no difference between the groups in mean scores.
Combining the three studies (n = 114) reporting change scores for the HRSD showed a significant benefit of reboxetine (MD −2.37, 95% CI −4.29 to −0.45; Analysis 1.6). As there were only three trials we did not perform a full subgroup and sensitivity analysis but a fixed‐effect model made little difference (MD −2.53, 95% CI −4.03 to −1.03).
1.6.3 negative (PANSS negative)
Friedman 2008 reported observed PANSS negative change scores at 8 weeks and we calculated LOCF endpoint scores with imputed SD which were skewed and entered into Analysis 1.8. Hinkelmann 2013 reported LOCF endpoint scores at 4 weeks which were skewed and entered into Analysis 1.8 and we calculated change scores with imputed SD. Li 2008 reported endpoint scores at 12 weeks. Schutz 2001 reported endpoint scores for completers at 6 weeks which were skewed and entered into Analysis 1.8 and we derived change scores with imputed SD. Yu 2012 and Zhao 2013 reported endpoint scores at 8 weeks.
Together, these six (n = 359) studies showed no statistically significant benefit of NRIs (MD −0.99, 95% CI −2.53 to 0.56; Analysis 1.6) with significant heterogeneity (I² = 71%).
We performed subgroup and sensitivity analysis (see Table 4). Visually there was no clear individual outlier and excluding any individual study did not markedly reduce the heterogeneity. Friedman 2008 was the only study reporting outcomes for atomoxetine and this showed no benefit. Excluding Friedman 2008 to analyse the effect of reboxetine slightly increased the overall benefit which remained non‐significant (MD −1.20, 95% CI −2.80 to 0.40). The two studies that enrolled only patients on clozapine were inconsistent but magnified the benefit when combined, although this remained non‐significant (MD −1.60, 95% CI −3.96 to 0.76) (Li 2008; Zhao 2013). Adding Hinkelmann 2013 (which included some patients on clozapine) attenuated the overall effect further (MD −0.75, 95% CI −3.25 to 1.75). Four trials specifically recruited patients with negative symptoms which inflated the benefit of NRIs but remained non‐significant (MD −1.47, 95% CI −3.04 to 0.09).
| Subgroup or sensitivity analysis (see text for details) | Number of trials | N | Mean difference | 95% Confidence interval | I² |
| Overall outcome | 6 | 359 | ‐0.99 | ‐2.53 to 0.56 | 71% |
| Reboxetine | 5 | 341 | ‐1.20 | ‐2.80 to 0.40 | 74% |
| Clozapine‐only studies | 2 | 221 | ‐1.60 | ‐3.96 to 0.76 | 84% |
| Excluding studies without clozapine | 3 | 256 | ‐0.75 | ‐3.25 to 1.75 | 81% |
| Negative symptoms | 4 | 321 | ‐1.47 | ‐3.04 to 0.09 | 77% |
| Excluding imputed SD | 4 | 301 | ‐1.68 | ‐3.04 to ‐0.32* | 70% |
| Excluding skewed change scores | 3 | 286 | ‐1.92 | ‐3.28 to ‐0.55* | 75% |
| Fixed‐effect model | 6 | 259 | ‐1.82 | ‐2.46 to ‐1.18* | 71% |
| Low risk of randomisation bias | 2 | 58 | 3.55 | ‐0.43 to 7.54 | 0% |
| Excluding high risk of bias | 5 | 294 | ‐0.12 | ‐2.31 to 2.07 | 71% |
* Statistically significant at p<0.05
Only three studies did not have associated skew and combining these inflated the benefit of reboxetine which became statistically significant (MD −1.92; 95% CI −3.28 to −0.55) (Li 2008; Yu 2012; Zhao 2013). We imputed the SD for two studies and excluding these inflated the benefit of reboxetine which became statistically significant (MD −1.68, 95% CI −3.04 to −0.32) (Hinkelmann 2013; Schutz 2001). Using a fixed‐effect model inflated the benefit of NRIs which became statistically significant (MD −1.82, 95% CI −2.46 to −1.18).
We did not determine that any of these studies were at high risk of bias for randomisation. Only two studies described their randomisation methods in any detail and we considered these at low risk of bias. Combining these two studies showed a large non‐significant benefit for placebo over reboxetine (MD 3.55, 95% CI −0.43 to 7.54) (Hinkelmann 2013; Schutz 2001). We classified Yu 2012 as high risk of bias for allocation concealment, blinding of participants and outcomes, selective reporting, and other sources of bias and excluding this study largely abolished the benefit of NRIs (MD −0.12, 95% CI −2.31 to 2.08). Most sensitivity analyses made little impact on the high overall heterogeneity.
1.6.4 negative (SANS)
Poyurovsky 2003 reported SANS endpoint scores at 6 weeks which were skewed and entered into Analysis 1.8 and we calculated change scores with estimated SD. Poyurovsky 2007 reported ITT change scores at 6 weeks and we derived endpoint data and imputed SD. Shafti 2015 reported endpoint scores at 12 weeks.
Combined together these three (n = 129) studies showed a non‐significant benefit of reboxetine (MD −2.47, 95% CI −6.22 to 1.28; Analysis 1.6) and substantial heterogeneity (I² = 71%).
As there were only three trials we did not perform a full subgroup and sensitivity analysis but we looked for sources of heterogeneity. There was no one clear outlier when we inspected visually. A fixed‐effect model attenuates the effect size but becomes statistically significant (MD −1.66, 95% CI −3.09 to −0.22).
1.6.5 negative (SANS ‐ modified)
Kelly 2009 reported modified SANS endpoint completer scores at 8 weeks. As this has been modified from the original SANS instrument it was not combined directly with other SANS results.
This showed a large benefit of atomoxetine that was not statistically significant (MD −5.70, 95% CI −18.01 to 6.61; Analysis 1.6).
1.6.6 positive (BPRS)
Kelly 2009 reported completer BPRS positive endscores at 8 weeks which were skewed and entered into Analysis 1.8 and we calculated change scores and imputed SD.
This study produced a non‐significant benefit for placebo over atomoxetine (MD 1.60, 95% CI −2.59 to 5.79; Analysis 1.6).
1.6.7 positive (PANSS positive)
Friedman 2008 reported PANSS positive change scores for completers at 8 weeks and we calculated endpoint LOCF scores with imputed SDs which were skewed and we entered these into Analysis 1.8. Hinkelmann 2013 reported LOCF endscores at 4 weeks but these were skewed and we entered them into Analysis 1.8 calculating change scores with estimated SD. Li 2008 report endscores at 12 weeks which were skewed and entered into Analysis 1.8 and we calculated change scores and estimated the SD. Schutz 2001 report endscores for completers at 6 weeks which were skewed and entered into Analysis 1.8 and we derived change scores with estimated SD. Zhao 2013 report endscores at 8 weeks which were skewed and entered into Analysis 1.8 and we calculated change scores with SD imputed.
Five studies (n = 294) reported outcomes with no benefit or harm from NRIs (MD −0.16, 95% CI −0.96 to 0.63; Analysis 1.6).
We performed subgroup and sensitivity analysis for short‐term outcomes (see Table 5). There was only one study of atomoxetine which showed a non‐significant tendency to favour placebo (Friedman 2008); and looking only at studies of reboxetine made little difference to the outcome. The two studies looking at patients taking clozapine only did not show a benefit of reboxetine (Li 2008; Zhao 2013); and looking only at those studies including patients on clozapine (Hinkelmann 2013; Li 2008; Zhao 2013), which were also the studies recruiting patients specifically with negative symptoms, made minimal difference. All studies had imputed SDs except Friedman 2008 and all change scores were associated with skewed endscores. A fixed‐effect model made no difference. We determined that none of the studies were at high risk of bias for randomisation but only two studies reported these methods in any detail and they did not show a benefit for reboxetine (Hinkelmann 2013; Schutz 2001). We did not classify any studies at high risk of bias for any domain.
| Subgroup or sensitivity analysis (see text for details) | Number of trials | N | Mean difference | 95% Confidence interval | I² |
| Overall outcome | 5 | 294 | ‐0.16 | ‐0.96 to 0.63 | 0% |
| Reboxetine | 4 | 279 | ‐0.24 | ‐1.05 to 0.57 | 0% |
| Clozapine‐only studies | 2 | 221 | ‐0.15 | ‐1.02 to 0.72 | 0% |
| Excluding studies without clozapine; negative symptoms | 3 | 256 | ‐0.22 | ‐1.04 to 0.60 | 0% |
| Fixed‐effect model | 5 | 294 | ‐0.16 | ‐0.96 to 0.63 | 0% |
| Low risk of randomisation bias | 2 | 58 | ‐0.76 | ‐2.93 to 1.40 | 0% |
1.6.8 positive (SAPS)
Poyurovsky 2003 report SAPS endscores at 6 weeks which are skewed and entered into Analysis 1.11 and we calculated the change scores and imputed the SD. Poyurovsky 2007 report ITT change scores at 6 weeks and we derived endscores using an imputed SD which were skewed and entered into Analysis 1.11. Shafti 2015 report endscores at 12 weeks.
We combined three studies (n = 129) which showed no overall benefit from reboxetine (MD 0.73, 95% CI −1.29 to 2.74; Analysis 1.6). There were only three trials so a full subgroup and sensitivity analysis was not performed but a fixed‐effect model made little difference (MD 0.59, 95% CI −1.16 to 2.33).
1.7 Mental state: 3b. Specific: Average symptoms score (various scales, high = worse) ‐ medium term (13 to 26 weeks)
1.7.1 negative (PANSS negative)
Usall 2014 reported PANSS negative endpoint scores at 24 weeks which were skewed and entered into Analysis 1.9 and we calculated change scores with imputed SDs. Yu 2012 reported endpoint scores at 16 weeks. Zhao 2013 reported endpoint scores at 24 weeks.
These three studies (n = 219) showed a significant benefit for reboxetine (MD −3.25, 95% CI −4.04 to −2.47; Analysis 1.7) without heterogeneity.
There were only three trials so we did not perform a full subgroup and sensitivity analysis but a fixed‐effect model made no difference to the result (MD −3.25, 95% CI −4.04 to −2.47).
1.7.2 negative (SANS)
Usall 2014 reported SANS endpoint scores at 24 weeks which were skewed and entered into Analysis 1.9 and we calculated change scores with imputed SDs.
This showed a large benefit for reboxetine that was not significant (MD −7.12, 95% CI −19.39 to 5.15; Analysis 1.7)
1.7.3 positive (PANSS positive)
Usall 2014 reported PANSS positive endscores at 24 weeks which were skewed and entered into Analysis 1.9 with change scores calculated and SD imputed. Zhao 2013 report endscores at 24 weeks which were skewed and entered into Analysis 1.9 with change scores calculated and SD imputed.
The reboxetine studies by Usall 2014 and Zhao 2013 showed no benefit overall (MD −0.14, 95% CI −1.30 to 1.02; Analysis 1.7).
1.8 Mental state: 4a. General and specific: Average score (various scales, high = worse) ‐ skewed results ‐ short term (2 ‐ 12 weeks)
Data for this outcome were skewed and are presented as 'other data' .
1.9 Mental state: 4b. General and specific: Average score (various scales, high = worse) ‐ skewed results ‐ medium term (13 ‐ 26 weeks)
Data for this outcome were skewed and are presented as 'other data' .
1.10 Cognitive functioning: 1. General ‐ average composite cognitive functioning score (SMD)
1.10.1 short term (2 to 12 weeks)
Eli Lilly 2006 reported a LOCF composite cognitive change score at 8 weeks. Friedman 2008 reported composite cognitive change scores for completers at 8 weeks. Kelly 2009 reported composite cognitive endscores and change scores for completers at 8 weeks. Poyurovsky 2007 did not report composite cognitive scores but we were able to calculate a composite score at 6 weeks using mean SMD from individual cognitive scale endscores (excluding those that were skewed) with estimated SD.
When combined these four (n = 180) studies showed no overall benefit from NRIs (SMD 0.04, 95% CI −0.28 to 0.36; Analysis 1.10).
We performed subgroup and sensitivity analysis for short‐term outcomes (see Table 6). There was only one reboxetine trial which showed no benefit and this was the one study where we calculated the composite effect size ourselves (Poyurovsky 2007). Excluding this to look only at studies of atomoxetine also showed no benefit. No study specifically recruited patients with negative symptoms. Using a fixed‐effect model made little difference. No study was at high risk of bias for randomisation but only Kelly 2009 and Poyurovsky 2007 reported their methods in detail and their results were not consistent but combined they showed a non‐significant benefit for NRIs (MD −0.18, 95% CI −1.06 to 0.69). Two studies were considered at high risk for other sources of bias and excluding them showed a slight benefit for placebo (MD 0.14, 95% −0.42 to 0.71) (Eli Lilly 2006; Kelly 2009); while excluding only Eli Lilly 2006 which was also considered at high risk of attrition and reporting bias, had little effect.
| Subgroup or sensitivity analysis (see text for details) | Number of trials | N | Mean difference | 95% Confidence interval | I² |
| Overall outcome | 4 | 180 | 0.04 | ‐0.28 to 0.36 | 8% |
| Atomoxetine | 3 | 147 | ‐0.07 | ‐0.55 to 0.41 | 33% |
| Fixed‐effect model | 4 | 180 | 0.06 | ‐0.24 to 0.35 | 8% |
| Low risk of randomisation bias | 2 | 55 | ‐0.18 | ‐1.06 to 0.69 | 61% |
| Excluding high risk of other bias | 2 | 48 | 0.14 | ‐0.42 to 0.71 | 0% |
| Excluding high risk of attrition and reporting bias | 3 | 70 | ‐0.12 | ‐0.66 to 0.43 | 22% |
1.10.2 medium term (13 to 26 weeks)
Ball 2011 reported a composite cognitive change score at 24 weeks.
This showed a large benefit of atomoxetine that was not statistically significant (SMD −0.66, 95% CI −1.46 to 0.13; Analysis 1.16).
1.11 Cognitive functioning: 2. Specific ‐ average individual scores (SMD) ‐ short term (2 to 12 weeks)
1.11.1 working memory
Kelly 2009 reported endscores from three working memory scales (WAIS‐III letter‐number sequencing, Woodcock‐Johnson planning test, number sequencing test) for atomoxetine completers at 8 weeks and we used these to calculate a composite working memory SMD. Poyurovsky 2007 reported endscores from two working memory scales (matching to sample, mental rotation) with reaction time and percentage correct scores for each at 6 weeks for reboxetine. Mental rotation reaction times were skewed and we calculated a composite working memory SMD excluding this.
These showed little benefit of NRIs when combined (MD −0.11, 95% CI −0.89 to 0.67; Analysis 1.11) and a fixed‐effect model made little difference (MD −0.06, 95% CI −0.60 to 0.49).
1.11.2 reasoning/problem solving
Eli Lilly 2006 reported ITT change scores from the Tower of London test at 8 weeks. Friedman 2008 reported change scores from the Tower of London test at 8 weeks for completers. Poyurovsky 2007 reported endpoint scores from the Wisconsin card sorting task at 6 weeks with categories and percentage perseverative errors but the latter were skewed and we excluded them.
The three studies (n = 158) showed no benefit of NRIs (SMD 0.03, 95% CI −0.28 to 0.34; Analysis 1.11). There were only three trials so we did not perform a full subgroup and sensitivity analysis but a fixed‐effect model made no difference (MD 0.03, 95% CI −0.28 to 0.34).
1.11.3 speed of processing
Eli Lilly 2006 reported ITT change scores from three speed of processing measures (token motor task, verbal fluency, symbol coding task) at 8 weeks and we used these to calculate a composite speed of processing SMD. Friedman 2008 reported change scores from four speed of processing measures (token motor task, category instances test, controlled oral word association test, symbol coding task) at 8 weeks for completers and we used these to calculate a composite speed of processing SMD. Kelly 2009 reported completer only endscores from three speed of processing measures (WAIS‐III digit symbol, grooved pegboard, letter fluency) at 8 weeks and we used these to calculate a composite speed of processing SMD. Poyurovsky 2007 reported endpoint scores from three speed of processing tasks (simple reaction time, code substitution, code substitution immediate recall) with reaction time and percentage correct scores for each at 6 weeks. We used these to calculate a composite speed of processing SMD although the simple reaction time task was excluded due to skew and 100% correct responses.
These four studies (n = 177) showed no benefit of NRIs (SMD 0.08, 95% CI −0.21 to 0.38; Analysis 1.11). We performed subgroup and sensitivity analysis (see Table 7). The one study of reboxetine showed a non‐significant benefit of placebo (Poyurovsky 2007); and excluding this to look only at studies of atomoxetine did not change the overall lack of benefit of NRIs. We used calculated composite scores for all studies. None of the trials included patients on clozapine or recruited specifically those with negative symptoms. A fixed‐effect model made no difference. No study was at high risk of bias for randomisation but only Kelly 2009 and Poyurovsky 2007 reported their methods in detail and their results were not consistent but overall suggested a small non‐significant benefit for placebo (SMD 0.13, 95% CI −0.41 to 0.68). We considered two trials at high risk for attrition and other sources of bias and excluding these showed a non‐significant benefit of placebo (SMD 0.23, 95% CI ‐.34 to 0.80) (Eli Lilly 2006; Kelly 2009); while excluding just Eli Lilly 2006, which was also considered at high risk of reporting bias, had little effect.
| Subgroup or sensitivity analysis (see text for details) | Number of trials | N | Mean difference | 95% Confidence interval | I² |
| Overall outcome | 4 | 177 | 0.08 | ‐0.21 to 0.38 | 0% |
| Atomoxetine | 3 | 144 | 0.04 | ‐0.29 to 0.37 | 0% |
| Fixed‐effect model | 4 | 177 | 0.08 | ‐0.21 to 0.38 | 0% |
| Low risk of randomisation bias | 2 | 53 | 0.13 | ‐0.41 to 0.68 | 0% |
| Excluding high risk of attrition and other bias | 2 | 48 | 0.23 | ‐0.34 to 0.80 | 0% |
| Excluding high risk of reporting bias | 3 | 68 | 0.13 | ‐0.34 to 0.61 | 0% |
1.11.4 attention
Eli Lilly 2006 reported ITT change scores from the continuous performance test at 8 weeks. Kelly 2009 reported completer endscores for the GDS continuous performance distractibility test at 8 weeks. Poyurovsky 2007 reported endpoint scores from the continuous performance test at 6 weeks with reaction time and percentage correct scores combined to calculate a composite attention SMD.
These three studies (n = 161) showed no benefit of NRIs (SMD −0.01, 95% CI −0.51 to 0.48; Analysis 1.11). There were only three trials so we did not perform a full subgroup and sensitivity analysis. A fixed‐effect model favoured placebo but was not statistically significant (SMD 0.10, 95% CI −0.21 to 0.41).
1.11.5 verbal learning/memory
Eli Lilly 2006 reported ITT change scores for two verbal learning/memory scales (verbal memory, digit sequencing) at 8 weeks and we tcombined these into a composite verbal learning/memory SMD. Friedman 2008 reported completer change scores for two verbal learning/memory measures (list learning, digit sequencing) at 8 weeks and these were combined into a composite verbal learning/memory SMD. Kelly 2009 reported completer endscores for the California verbal learning test at 8 weeks. Poyurovsky 2007 reported endpoint scores for the code substitution delayed recall task at 6 weeks with reaction time and percentage correct scores combined to calculate a composite verbal learning/memory SMD.
These four studies (n = 181) showed no benefit of NRIs (SMD 0.01, 95% CI −0.31 to 0.32; Analysis 1.11). Subgroup and sensitivity analysis was performed (see Table 8). Only Poyurovsky 2007 studied reboxetine which showed a non‐significant benefit of placebo and excluding this made little difference (SMD −0.08, 95% CI −0.40 to 0.25). None of the studies included patients on clozapine or recruited specifically with negative symptoms. Only Kelly 2009 did not use a composite score and this showed a large but non‐significant benefit of atomoxetine. Using a fixed‐effect model made little difference (SMD 0.01, 95% CI −0.28 to 0.30). We did not classify any study as high risk of bias for randomisation but only Kelly 2009 and Poyurovsky 2007 reported their methods in enough detail to be considered low risk and they showed no benefit when combined (SMD −0.06, 95% CI −1.04 to 0.93). We determined that two studies were high risk for other sources of bias (Eli Lilly 2006; Kelly 2009); and excluding them inflated the benefit of placebo (SMD 0.26, 95% CI −0.31 to 0.83). Eli Lilly 2006 was also considered at high risk of attrition and reporting bias and excluding this made little difference.
| Subgroup or sensitivity analysis (see text for details) | Number of trials | N | Mean difference | 95% Confidence interval | I² |
| Overall outcome | 4 | 181 | 0.01 | ‐0.31 to 0.32 | 7% |
| Atomoxetine | 3 | 148 | ‐0.08 | ‐0.40 to 0.25 | 0% |
| Fixed‐effect model | 4 | 181 | 0.01 | ‐0.28 to 0.30 | 7% |
| Low risk of randomisation bias | 2 | 55 | ‐0.06 | ‐1.04 to 0.93 | 69% |
| Excluding high risk of other bias | 2 | 48 | 0.26 | ‐0.31 to 0.83 | 0% |
| Excluding high risk of attrition and reporting bias | 3 | 70 | ‐0.04 | ‐0.66 to 0.58 | 38% |
1.11.6 visual learning/memory
Kelly 2009 reported completer endscores for the brief visuospatial memory test at 8 weeks with a benefit for atomoxetine that was not statistically significant (SMD −0.44; 95% CI −1.29 to 0.41; Analysis 1.11).
1.12 Quality of life: Average quality of life score (GQOLI‐74, high = better) ‐ short term (2 to 12 weeks)
The reboxetine study by Li 2008 reports GQOLI‐74 endpoint total scores as well as subscores from four domains of functioning and 20 individual subscales at 12 weeks. We made a post hoc decision to consider the total score but also to report scores from the four domains. We did not report the individual subscales due to the likelihood of a small number of statistically significant differences due to chance and the view that a benefit of NRIs on any single subscale is unlikely to be of clinical relevance.
1.12.1 general ‐ total
The GQOLI‐74 total score (MD 9.36, 95% CI 7.89 to 10.83; Analysis 1.12) showed a significant benefit for reboxetine.
1.12.2 specific ‐ well‐being ‐ material
The dimension of material well‐being (MD 0.21, 95% CI −2.34 to 2.76; N = 114) did not show a benefit (Analysis 1.12).
1.12.3 specific ‐ well‐being ‐ physical
The dimension of physical well‐being (MD 0.68, 95% CI −1.35 to 2.71; N = 114) did not show a benefit (Analysis 1.12).
1.12.4 specific ‐ well‐being ‐ psychological
The dimension of psychological well‐being (MD 10.00, 95% CI 8.01 to 11.99; N = 114) showed a large benefit for reboxetine over placebo (Analysis 1.12).
1.12.5 specific ‐ well‐being ‐ social
The dimension of social well‐being (MD 10.02, 95% CI 8.03 to 12.01; N = 114) showed a large benefit for reboxetine over placebo (Analysis 1.12).
1.13 Clinical global response: 1a. Average clinical global status score (CGI‐S, high = worse) ‐ short term (2 to 12 weeks)
Hinkelmann 2013 reported CGI‐S endscores at 4 weeks which were skewed and entered into Analysis 1.14 and we estimated change scores with imputed SD. Kelly 2009 reported completer‐only CGI‐S endscores at 8 weeks. Poyurovsky 2003 reported CGI‐S endscores at 6 weeks which were skewed and we entered these into Analysis 1.14 and calculated change scores with estimated SD. Poyurovsky 2007 reported ITT CGI‐S change scores at 6 weeks and we could estimate endscores and impute the SD. Schutz 2001 reported completer CGI‐S and CGI‐I endpoint scores at 6 weeks and the latter were skewed and entered into Analysis 1.14.
Five studies (n = 160) provided CGI‐S scores and they did not show an overall effect of NRIs (MD −0.03, 95% CI −0.35 to 0.28; Analysis 1.13). We performed subgroup and sensitivity analysis (see Table 9). There was only one study of atomoxetine which did not show a statistically significant benefit (Kelly 2009); and excluding this to look at reboxetine resulted in a small benefit for the control group which was not statistically significant (MD 0.10, 95% CI −0.23 to 0.42). Only Hinkelmann 2013 included patients taking clozapine and specifically recruited those with negative symptoms and this showed a benefit of placebo that was not statistically significant. Excluding imputed SDs slightly inflates the benefit of NRIs but remains non‐significant (MD −0.15; 95% CI −0.60 to 0.29) — these were also the studies with skewed endscores (Hinkelmann 2013; Poyurovsky 2003). A fixed‐effect model made no difference. All trials were low risk of bias for randomisation. We considered Kelly 2009 to be at high risk for other sources of bias due to apparently changing exclusion criteria after randomisation.
| Subgroup or sensitivity analysis (see text for details) | Number of trials | N | Mean difference | 95% Confidence interval | I² |
| Overall outcome | 5 | 160 | ‐0.03 | ‐0.35 to 0.28 | 7% |
| Reboxetine; excluding high risk of bias | 4 | 137 | 0.10 | ‐0.23 to 0.42 | 0% |
| Excluding imputed SD; excluding skewed change scores | 3 | 105 | ‐0.15 | ‐0.60 to 0.29 | 37% |
| Fixed‐effect model | 5 | 160 | ‐0.03 | ‐0.32 to 0.27 | 7% |
1.15 Leaving the study early: 1a. Short term (2 to 12 weeks)
1.15.1 any reason
Li 2008 reported 4/115 withdrawals which could not be assigned to a treatment arm and Sacco 2009 did not report withdrawals. Eight trials (n = 401) reported little difference (RR 0.94, 95% CI 0.63 to 1.39; Analysis 1.15). One of these eight trials had no withdrawals so did not contribute to the overall estimate (Shafti 2015).
We performed subgroup and sensitivity analysis (see Table 10). There was little difference when atomoxetine or reboxetine trials were considered separately and the single viloxazine study showed a similar lack of effect (Kurland 1981). No study included only patients on clozapine and only Hinkelmann 2013 included any patients taking clozapine and this study showed a non‐significant benefit for placebo. This was one of only two studies (the other being Shafti 2015) recruiting patients specifically with negative symptoms. A fixed‐effect model made no difference to the relative risk. No study was at high risk of bias for randomisation and five studies reported their methods in enough detail to be considered low risk; analysing these separately made little difference (Hinkelmann 2013; Kelly 2009; Poyurovsky 2003; Poyurovsky 2007; Schutz 2001). We rated two studies as high risk of other sources of bias (Eli Lilly 2006; Kelly 2009), two studies were high risk for reporting bias (Eli Lilly 2006; Kurland 1981), and one study (Kelly 2009) at high risk of attrition bias; but excluding these made little difference.
| Subgroup or sensitivity analysis (see text for details) | Number of trials | N | Relative risk | 95% Confidence interval | I² |
| Overall outcome | 8 | 401 | 0.94 | 0.63 to 1.39 | 0% |
| Atomoxetine | 3 | 173 | 0.89 | 0.49 to 1.59 | 0% |
| Reboxetine | 5 | 200 | 0.95 | 0.54 to 1.70 | 0% |
| Fixed‐effect model | 8 | 401 | 0.95 | 0.64 to 1.41 | 0% |
| Low risk of bias in randomisation | 5 | 182 | 0.92 | 0.54 to 1.56 | 0% |
| Excluding high risk of other bias | 7 | 248 | 1.03 | 0.62 to 1.70 | 0% |
| Excluding high risk of reporting bias | 7 | 252 | 0.97 | 0.58 to 1.60 | 0% |
| Excluding high risk of attrition bias | 8 | 369 | 0.96 | 0.63 to 1.45 | 0% |
1.15.2 due to adverse effects
Four studies (n = 178) showed a non‐significant benefit of placebo (RR 2.08, 95% CI 0.70 to 6.21; Analysis 1.15).
We performed subgroup and sensitivity analysis for short‐term outcomes (see Table 11). Only Schutz 2001 looked at reboxetine but this showed little difference from the atomoxetine studies. None of the studies included patients taking clozapine and none recruited specifically those with negative symptoms. A fixed‐effect model made no difference. No study was at high risk of bias for randomisation but only two studies were low risk and these showed contrasting non‐significant benefits for NRI or placebo respectively and no overall effect when combined (RR 1.15, 95% CI 0.15 to 8.60) (Kelly 2009; Schutz 2001). Two studies were at high risk for other sources of bias (Eli Lilly 2006; Kelly 2009); and excluding these magnified the benefit of placebo (RR 4.48, 95% CI 0.56 to 35.52). Eli Lilly 2006 also showed attrition and reporting bias and excluding this slightly attenuated the benefit of placebo which remained non‐significant.
| Subgroup or sensitivity analysis (see text for details) | Number of trials | N | Relative risk | 95% Confidence interval | I² |
| Overall outcome | 4 | 178 | 2.08 | 0.70 to 6.21 | 0% |
| Atomoxetine | 3 | 153 | 1.88 | 0.58 to 6.08 | 0% |
| Fixed‐effect model | 4 | 178 | 2.18 | 0.79 to 6.02 | 0% |
| Low risk of bias in randomisation | 2 | 53 | 1.15 | 0.15 to 8.60 | 18% |
| Excluding high risk of other bias | 2 | 45 | 4.48 | 0.56 to 35.52 | 0% |
| Excluding high risk of reporting bias | 3 | 73 | 1.66 | 0.36 to 7.72 | 0% |
1.15.3 due to psychiatric symptoms
Eli Lilly 2006 and Kelly 2009 reported withdrawal due to psychiatric symptoms at 8 weeks. Poyurovsky 2007 reported withdrawal due to lack of efficacy at 6 weeks.
Combining the three studies (n = 183) reporting withdrawal due to psychiatric symptoms (variously described) showed no evident difference between NRIs and placebo (RR 0.97, 95% CI 0.44 to 2.13; Analysis 1.15).
There were only three trials so we did not perform a full subgroup and sensitivity analysis but fixed‐effect analysis made no difference (RR 1.01, 95% CI 0.47 to 2.20).
1.16 Leaving the study early: 1b. Medium term (13 to 26 weeks)
1.16.1 any reason
Zhao 2013 reported 3/110 withdrawals which could not be assigned to a treatment arm and Ganguli 2008 did not report withdrawals.
Three trials (n = 169) reported medium‐term (13 to 26 weeks) outcomes (RR 0.92, 95% CI 0.52 to 1.62; Analysis 1.16) with little difference (Ball 2011;Usall 2014;Yu 2012).There were only three trials so a full subgroup and sensitivity analysis was not performed but a fixed‐effect model made little difference (RR 0.88, 95% CI 0.50 to 1.55).
1.16.2 due to adverse effects
The atomoxetine trial by Ball 2011 reported outcomes at 24 weeks (RR 1.47, 95% CI 0.31 to 6.95; Analysis 1.16) and showed a non‐significant trend to favour controls.
1.16.3 due to psychiatric symptoms
Usall 2014 reported withdrawal due to acute exacerbation at 24 weeks.
This showed a benefit to placebo that was not statistically significant (RR 4.44, 95% CI 0.22 to 88.04; Analysis 1.16).
1.17 Adverse effects: 1. General ‐ short term (binary, 2 to 12 weeks)
1.17.1 any
The Eli Lilly 2006 study of atomoxetine reported treatment‐emergent adverse events as percentages which we could use to determine the number of events in each group at 8 weeks and this showed little difference between arms (RR 1.07, 95% CI 0.80 to 1.43; Analysis 1.17). The Kurland 1981 trial of viloxazine reported that there were no adverse events at 4 weeks. Shafti 2015 reported side‐effects in the reboxetine arm at 12 weeks and, assuming that there were none in the placebo arm, this implies a very large risk of side‐effects associated with reboxetine (RR 19.00, 95% CI 1.17 to 309.77). When combined this indicates a large non‐significant benefit for placebo (RR 3.49, 95% CI 0.14 to 90.29; Analysis 1.17) with large heterogeneity (I² = 82%).
1.17.2 serious
The Eli Lilly 2006 study of atomoxetine reported serious adverse events as percentages which we used to determine the number of events in each group at 8 weeks. This showed an increased rate of serious adverse events with atomoxetine that was not statistically significant (RR 2.95, 95% CI 0.32 to 27.58). Hinkelmann 2013 reported that there were no serious adverse events at 4 weeks in either reboxetine or placebo arms. Li 2008 reported one seizure in the reboxetine arm of the study. Overall these showed a non‐significant benefit of placebo (RR 2.95, 95% CI 0.47 to 18.36; Analysis 1.17). No deaths were reported in any study.
1.18 Adverse effects: 2a.i. Specific ‐ short term (binary, 2 to 12 weeks)
Kelly 2009 reported rates of nausea, insomnia, dry mouth, constipation, sedation, malaise (weakness, fatigue), dizziness, anorexia, abdominal pain, vomiting, diarrhoea, sore throat, weight loss, tremor, akathisia, restlessness, and stiffness over 8 weeks in completers and we calculated ITT figures. Li 2008 reported rates of nausea, insomnia, dry mouth, constipation, dizziness, and tachycardia over 12 weeks in completers and we could not calculate ITT figures as withdrawals were not reported by study arm. Poyurovsky 2003 reported rates of daytime somnolence, akathisia, and use of anticholinergic medication over 6 weeks in completers and we calculated ITT figures. They also reported no gastrointestinal side‐effects (0/13 in both arms). Schutz 2001 reported rates of nausea, dry mouth, fatigue, dizziness, impotence, rash, akathisia, parkinsonism, acute dystonia, and hypersalivation over 6 weeks in completers and we calculated ITT figures. Eli Lilly 2006 reported percentages which we used to calculate rates of headache at 8 weeks. Poyurovsky 2003 reported that no anticholinergic medication was used in either the reboxetine or placebo arms over 6 weeks. Poyurovsky 2007 and Shafti 2015 reported rates of anticholinergic medication at 6 or 12 weeks respectively and we assumed these to be ITT.
1.18.1 anticholinergic ‐ constipation
One study showed a benefit for atomoxetine which was not significant (Kelly 2009); and one reboxetine study showed no effect (Li 2008). Overall there was a non‐significant benefit for NRIs (RR 0.74, 95% CI 0.24 to 2.29; Analysis 1.18).
1.18.2 anticholinergic ‐ dry mouth
Combining three studies (n = 176) showed an adverse effect of NRIs (RR 3.46, 95% CI 1.40 to 8.53; Analysis 1.18).
As there were only three trials a full subgroup and sensitivity analysis was not performed but fixed‐effect analysis made little difference (RR 3.55, 95% CI 1.45 to 8.70), nor did using completer rather than ITT data (RR 3.35, 95% 1.35 to 8.30; N = 163).
1.18.3 anticholinergic ‐ impotence
Schutz 2001 found no difference between reboxetine and placebo (Analysis 1.18).
1.18.4 cardiovascular ‐ tachycardia
For reboxetine, Li 2008 reported rates of tachycardia at 12 weeks (RR 3.33, 95% CI 0.97 to 11.48) showing a benefit of placebo that was not statistically significant (Analysis 1.18).
1.18.5 central nervous system ‐ anorexia
Kelly 2009 showed no difference between atomoxetine and placebo (Analysis 1.18).
1.18.6 central nervous system ‐ dizziness
Combining these three studies (n = 176) did not suggest an effect of NRIs (RR 1.52, 95% CI 0.54 to 4.31; Analysis 1.18).
There were only three trials so a full subgroup and sensitivity analysis was not performed but fixed‐effect analysis made little difference (RR 1.55, 95% CI 0.55 to 4.33), nor did using completer rather than ITT data (RR 1.60, 95% CI 0.57 to 4.52).
1.18.7 central nervous system ‐ fatigue
One atomoxetine (Kelly 2009) and one reboxetine (Schutz 2001) study gave no suggestion of an overall effect of NRIs (RR 1.00, 95% CI 0.12 to 8.60; Analysis 1.18).
1.18.8 central nervous system ‐ headache
Eli Lilly 2006 found no difference between atomoxetine and placebo (Analysis 1.18).
1.18.9 central nervous system ‐ insomnia
One atomoxetine (Kelly 2009) and one reboxetine (Li 2008) study showed a non‐significant benefit for placebo (Analysis 1.18).
1.18.10 central nervous system ‐ sedation
Combining one atomoxetine (Kelly 2009) and one reboxetine (Poyurovsky 2003) study produced a non‐significant benefit of NRIs (RR 0.74, 95% CI 0.28 to 1.94; Analysis 1.18).
1.18.11 extrapyramidal ‐ acute dystonia
Schutz 2001 reported no difference between arms (RR 1.00, 95% CI 0.07 to 14.55; Analysis 1.18).
1.18.12 extrapyramidal ‐ akathisia
Kelly 2009 reported rates of akathisia with a non‐significant benefit for atomoxetine and also rates of restlessness which were the same in each arm. Poyurovsky 2003 reported no akathisia in either the reboxetine or placebo arm while the rates in Schutz 2001 were the same in each arm. Overall there was a marginal and non‐significant benefit for NRIs (RR 0.87, 95% CI 0.25 to 3.09; Analysis 1.18).
1.18.13 extrapyramidal ‐ hypersalivation
Schutz 2001 reported a non‐significant benefit for placebo on hypersalivation (RR 0.33, 95% CI 0.01 to 7.58; Analysis 1.18).
1.18.14 extrapyramidal ‐ parkinsonism
Schutz 2001 showed a non‐significant benefit for placebo (RR 1.80, 95% CI 0.79 to 4.11; Analysis 1.18).
1.18.15 extrapyramidal ‐ tremor
Kelly 2009 found no difference between the two arms (RR 1.00, 95% CI 0.24 to 4.23; N = 32; Analysis 1.18).
1.18.16 extrapyramidal ‐ stiffness
Kelly 2009 showed a non‐significant benefit for atomoxetine (RR 5.00, 95% CI 0.66 to 38.15; Analysis 1.18).
1.18.17 extrapyramidal ‐ use of antiparkinson medication
Poyurovsky 2003 reported no use in either the reboxetine or placebo arms while combining Poyurovsky 2007 and Shafti 2015 showed little benefit of reboxetine (RR 0.80, 95% CI 0.44 to 1.45; Analysis 1.18).
1.18.18 gastrointestinal ‐ abdominal pain
Kelly 2009 showed no difference between atomoxetine and placebo (Analysis 1.18).
1.18.19 gastrointestinal ‐ nausea
Three studies (n = 176) showed a non‐significant benefit for NRIs (RR 0.49, 95% CI 0.10 to 2.41; Analysis 1.18).
As there were only three trials we did not perform a full subgroup and sensitivity analysis but fixed‐effect analysis made little difference (RR 0.63; 95% CI 0.28 to 1.43), nor did using completer rather than ITT data (RR 0.60; 95% CI 0.15 to 2.41; N = 163).
1.18.20 gastrointestinal ‐ vomiting
Kelly 2009 showed no difference between atomoxetine and placebo (Analysis 1.18).
1.18.21 gastrointestinal ‐ diarrhoea
Kelly 2009 found no difference between atomoxetine and placebo (Analysis 1.18).
1.18.22 immune system ‐ rash
Schutz 2001 showed no difference between reboxetine and placebo (Analysis 1.18).
1.18.23 immune system ‐ sore throat
Kelly 2009 found no difference between atomoxetine and placebo (Analysis 1.18).
1.18.24 metabolic ‐ weight loss
Kelly 2009 showed no difference between atomoxetine and placebo (Analysis 1.18).
1.18.25 metabolic ‐ significant weight gain
Two reboxetine studies reported rates of weight gain, both using the criterion of 7% or more increase in weight. Poyurovsky 2003 reported weight gain for completers at 6 weeks and we calculated ITT rates from this while Poyurovsky 2007 reported ITT weight gain at 6 weeks. Both studies showed a significant benefit for reboxetine which was demonstrated when they were combined (RR 0.38, 95% CI 0.20 to 0.73; Analysis 1.18). This benefit persists utilising completer only rather than ITT data for Poyurovsky 2003 (RR 0.37, 95% CI 0.19 to 0.75; N = 79).
1.19 Adverse effects: 2a.ii. Specific ‐ extrapyramidal ‐ average change score (continuous, various scales, high = worse) ‐ short term (2 to 12 weeks)
Kelly 2009 reported SAS and AIMS endscores for atomoxetine completers at 8 weeks which were skewed and entered into Analysis 1.20 and we calculated change scores with SD imputed. Poyurovsky 2007 reported SAS and BAS ITT change scores at 6 weeks for reboxetine: we calculated endscores with estimated SDs, and the BAS endscore was skewed. Schutz 2001 reported SAS endscores for reboxetine completers at 6 weeks which were skewed and entered into Analysis 1.20 but it was not possible to calculate change scores as baseline values were not available.
1.19.1 AIMS
AIMS change scores from Kelly 2009 showed no benefit of atomoxetine over placebo (MD 0.30, 95% CI −2.34 to 2.94; Analysis 1.19).
1.19.2 BAS
BAS change scores from Poyurovsky 2007 showed no benefit of reboxetine over placebo (MD −0.18, 95% CI −0.65 to 0.29; Analysis 1.19).
1.19.3 SAS
SAS change scores from Poyurovsky 2007 and Kelly 2009 showed minimal benefit of NRIs (MD −0.27, 95% CI −1.79 to 1.25; Analysis 1.19).
1.21 Adverse effects: 2b.i. Specific ‐ medium term (binary, 13 to 26 weeks)
The reboxetine study of Zhao 2013 reported rates of nausea, insomnia, dry mouth, constipation, dizziness, tachycardia, and sweating over 24 weeks including all completers with no withdrawals. Ball 2011 reported rates of tremor and QT prolongation over 24 weeks in completers and we calculated ITT figures.
1.21.1 anticholinergic ‐ constipation
There was a statistically significant benefit for placebo (RR 4.58, 95% CI 1.04 to 20.23; Analysis 1.21).
1.21.2 anticholinergic ‐ dry mouth
This showed a small but non‐significant benefit for placebo (RR 1.53, 95% CI 0.27 to 8.78; Analysis 1.21).
1.21.3 anticholinergic ‐ sweating
Zhao 2013 showed no difference between reboxetine and placebo (Analysis 1.21).
1.21.4 cardiovascular ‐ QT prolongation
Ball 2011 showed no difference between atomoxetine and placebo (Analysis 1.21).
1.21.5 cardiovascular ‐ tachycardia
There was a benefit of placebo that was not statistically significant (RR 1.78, 95% CI 0.55 to 5.74; Analysis 1.21).
1.21.6 central nervous system ‐ dizziness
This did not suggest an effect of reboxetine (RR 1.36, 95% CI 0.32 to 5.78; Analysis 1.21).
1.21.7 central nervous system ‐ insomnia
We found a non‐significant benefit for placebo (Analysis 1.21).
1.21.8 extrapyramidal ‐ tremor
Ball 2011 showed a significant benefit of atomoxetine (RR 0.42; 95% CI 0.20 to 0.89; Analysis 1.21).
1.21.9 gastrointestinal ‐ nausea
We calculated a large, but not statistically significant, benefit for placebo (RR 5.09, 95% CI 0.62 to 42.16; Analysis 1.21).
1.22 Adverse effects: 2a.iv. Specific ‐ metabolic ‐ average weight gain (continuous, increase in kg)
Ball 2011 did not report weight gain at 24 weeks directly but we could estimate mean change from the figure and SD from the mixed model. Poyurovsky 2003 reported weight gain at 6 weeks. Poyurovsky 2007 reported ITT weight gain at 6 weeks. Zhao 2013 reported endpoint weight and we calculated weight gain at 8 weeks and 24 weeks with estimated SD. Endpoint weights were available or could be estimated for all studies with no evidence of skew.
1.22.1 short term (2 to 12 weeks)
Three studies (n = 186) showed a significant benefit of reboxetine (MD −2.17, 95% CI −3.19 to −1.15; Analysis 1.22).
There were only three trials so we did not perform a full subgroup and sensitivity analysis but a fixed‐effect model made no difference (MD −2.17, 95% CI −3.19 to −1.15).
1.22.2 medium term (13 to 26 weeks)
We found a non‐significant benefit of NRIs (MD −3.12, 95% CI −10.67 to 4.42; Analysis 1.22) with very high heterogeneity (I² = 98%) from two studies. Ball 2011 found little effect of atomoxetine while Zhao 2013 showed a large benefit with reboxetine.
1.23 Social or general functioning: Average social functioning score (various subscales) ‐ short‐term (2 to 12 weeks)
The atomoxetine study of Friedman 2008 reported LOCF and completer change scores for the six SLOF subscales at 8 weeks. We analysed the change scores for completers but were able to calculate LOCF endscores with estimated SD and these were not skewed. We inverted these endscores were inverted by subtracting from zero in order to display them in the same direction as the SSPI scale. With the SLOF, inverted high scores are now worse. The reboxetine study by Li 2008 reported endscores for the ten SSPI subscales at 12 weeks. Three of these subscales were skewed and we calculated change scores with estimated SD.
1.23.1 activity ‐ activities (inverted SLOF, high = worse)
Friedman 2008 showed no benefit of atomoxetine (MD 0.00, 95% CI −3.30 to 3.30; Analysis 1.23).
1.23.2 activity ‐ hospital activity (SSPI, high = worse)
Li 2008 found no benefit of reboxetine (MD −0.03, 95% CI −0.17 to 0.11; Analysis 1.23).
1.23.3 activity ‐ disease indoor activity (SSPI, high = worse)
This was analysed as a change score due to the subscale being skewed and Li 2008 showed no benefit of reboxetine (MD −0.14, 95% CI −0.28 to −0.00; Analysis 1.23).
1.23.4 activity ‐ physical functioning (inverted SLOF, high = worse)
Friedman 2008 showed no benefit of atomoxetine (MD −0.30, 95% CI −1.12 to 0.52; Analysis 1.23).
1.23.5 personal care ‐ personal care skills (inverted SLOF, high = worse)
Friedman 2008 showed no benefit of atomoxetine (MD −0.20, 95% CI −1.43 to 1.03; Analysis 1.23).
1.23.6 personal care ‐ self‐care (SSPI, high = worse)
We analysed this as a change score due to the subscale being skewed and Li 2008 showed no benefit of reboxetine (MD −0.03, 95% CI −0.22 to 0.16; N = 114; Analysis 1.23).
1.23.7 personal care ‐ social acceptability (inverted SLOF, high = worse)
Friedman 2008 showed no benefit of atomoxetine (MD 0.10, 95% CI −0.72 to 0.92; Analysis 1.23).
1.23.8 relationships ‐ family role (SSPI, high = worse)
Li 2008 showed no benefit of reboxetine (MD −0.09, 95% CI −0.23 to 0.05; Analysis 1.23).
1.23.9 relationships ‐ interest and concern in the external environment (SSPI, high = worse)
Li 2008 found a small benefit of reboxetine (MD −0.19, 95% CI −0.37 to −0.01; N = 114; Analysis 1.23).
1.23.10 relationships ‐ interpersonal relationships (inverted SLOF, high = worse)
Friedman 2008 showed no benefit of atomoxetine (MD −1.20, 95% CI −5.41 to 3.01; Analysis 1.23).
1.23.11 relationships ‐ relationships and caring for others (SSPI, high = worse)
Li 2008 showed no benefit of reboxetine (MD −0.09, 95% CI −0.24 to 0.06; Analysis 1.23).
1.23.12 relationships ‐ sexual role (SSPI, high = worse)
Li 2008 showed no benefit of reboxetine (MD −0.03, 95% CI −0.21 to 0.15; Analysis 1.23).
1.23.13 relationships ‐ social withdrawal (SSPI, high = worse)
We analysed this as a change score due to the subscale being skewed and Li 2008 showed a benefit of reboxetine (MD −0.32, 95% CI −0.49 to −0.15; Analysis 1.23).
1.23.14 work ‐ professional skills (SSPI, high = worse)
Li 2008 showed a small benefit of reboxetine (MD −0.19, 95% CI −0.34 to −0.04; Analysis 1.23).
1.23.15 work ‐ responsibility and planning (SSPI, high = worse)
Li 2008 showed no benefit of reboxetine (MD −0.03, 95% CI −0.21 to 0.15; Analysis 1.23).
1.23.16 work ‐ work skills (inverted SLOF, high = worse)
Friedman 2008 showed a benefit of atomoxetine (MD −3.00, 95% CI −5.48 to −0.52; Analysis 1.23).
Missing outcomes
There were no reported results from any study for two of the primary outcomes: significant response or improvement in a clinical scale of cognitive functioning or in quality of life. While many studies measured the PANSS positive subscale, the SAPS, and the HRSD, none defined or reported response or relapse rates. No studies reported scores for any other symptom scales not mentioned above. No studies reported rates of response or improvement for composite cognitive scores or in any individual cognitive domain (e.g. working memory). No studies reported occupational status, economic, or service utilisation outcomes (e.g. admission rates). No study reported 'significant' extrapyramidal side‐effects or movement disorder but they did report rates of specific extrapyramidal symptoms and no studies reported cumulative dosage of antiparkinson medication. No studies reported any measures of satisfaction with treatment, the general impression of carers beyond the CGI, or improvement in social functioning.
Sensitivity analysis
There was not sufficient data to combine studies in a meta‐analysis so we did not perform a subgroup and sensitivity analysis on the primary outcome measures.
2. Comparison 2. NRI versus citalopram
Only two trials provided data to compare NRIs against an active control — Hinkelmann 2013 and Usall 2014 — and both compared reboxetine to citalopram, but at 4 weeks and 24 weeks respectively, so they could not be combined in a meta‐analysis.
2.1 Mental state: 1a. General: Average general/overall symptoms score (PANSS general, high = worse) ‐ short term (2 to 12 weeks)
Hinkelmann 2013 reported LOCF PANSS general endpoint scores at 4 weeks which were skewed and we entered these into Analysis 2.5 and calculated LOCF PANSS general change scores with an estimated SD.
We found a a non‐significant benefit of citalopram over reboxetine (MD 2.90, 95% CI −2.85 to 8.65; Analysis 2.1).
2.2 Mental state: 1b. General: Average general/overall symptoms score (various scales, high = worse) ‐ medium term (13 to 26 weeks)
Usall 2014 reported PANSS total and general endpoint scores at 24 weeks which were skewed and we entered into Analysis 2.6. We calculated change scores with an estimated SD.
2.2.1 PANSS total
Usall 2014 found a non‐significant trend for a benefit of citalopram over reboxetine (MD 1.62, 95% CI −6.89 to 10.13; Analysis 2.2).
2.2.2 PANSS general
Usall 2014 found little difference (MD 0.62, 95% CI −4.00 to 5.24; Analysis 2.2) at 24 weeks.
2.3 Mental state: 2a. Specific: Average symptoms score (various scales, high = worse) ‐ short term (2 to 12 weeks)
Hinkelmann 2013 reported LOCF PANSS negative, HRSD, and PANSS positive endpoint scores at 4 weeks but these were skewed and we entered them into Analysis 2.5. We calculated change scores and imputed the SDs.
2.3.1 mood (HRSD)
This showed a fairly large but non‐significant benefit of citalopram over reboxetine (MD 3.00, 95% CI −1.24 to 7.24; Analysis 2.3).
2.3.2 negative (PANSS negative)
Hinkelmann 2013 found a non‐significant benefit of citalopram over reboxetine (MD 1.50, 95% CI −4.34 to 7.34; Analysis 2.3).
2.3.3 positive (PANSS positive)
We found a non‐significant benefit of citalopram over reboxetine (MD 1.70, 95% CI −1.52 to 4.92; Analysis 2.3).
2.4 Mental state: 2b. Specific: Average symptoms score (various scales, high = worse) ‐ medium term (13 to 26 weeks)
Usall 2014 reported PANSS negative and SANS endpoint scores at 24 weeks which were skewed and entered into Analysis 2.6 and we calculated change scores with imputed SDs.
2.4.1 negative (PANSS negative)
Usall 2014 found little difference (MD 0.26, 95% CI −3.66 to 4.18; Analysis 2.4).
2.4.2 negative (SANS)
There was minimal difference between reboxetine and citalopram (MD −0.27, 95% CI −12.69 to 12.15; Analysis 2.4).
2.4.3 positive (PANSS positive)
Usall 2014 found little difference (MD 0.74, 95% CI −1.86 to 3.34; Analysis 2.4).
2.7 Clinical global response: Average clinical global status score (CGI‐S, high = worse) ‐ short term (2 to 12 weeks)
Hinkelmann 2013 reported CGI‐S endscores at 4 weeks which were not skewed and showed no difference between reboxetine and citalopram (MD 0.00, 95% CI −0.89 to 0.89; Analysis 2.7).
2.8 Leaving the study early: 1a. Short term (2 to 12 weeks)
2.8.1 any reason
In the short‐term Hinkelmann 2013 found a non‐significant benefit of reboxetine over citalopram (RR 0.63, 95% CI 0.17 to 2.41; Analysis 2.8) at 4 weeks. Hinkelmann 2013 reported that there were no serious adverse events at 4 weeks in either reboxetine or citalopram arms.
2.9 Leaving the study early: 1b. Medium term (13 to 26 weeks)
2.9.1 any reason
At 24 weeks Usall 2014 found little difference (RR 1.13, 95% CI 0.48 to 2.67; Analysis 2.9). No deaths were reported.
2.9.2 due to psychiatric symptoms
Usall 2014 reported withdrawal due to acute exacerbation at 24 weeks which showed a non‐significant benefit for citalopram over reboxetine (RR 1.77, 95% CI 0.17 to 18.26; Analysis 2.9).
Discussion
Summary of main results
Sixteen studies (39 articles, 919 participants) met the inclusion criteria for this review, although only 14 studies contributed useable data for the meta‐analysis. Below we discuss the main findings outlined in the summary of findings Table for the main comparison plus selected additional adverse effects.
1. Mental state
1.1 Significant response or improvement in negative symptoms
Only one study reported this outcome in a useable form. Shafti 2015 found a much greater response rate (20% reduction in the SANS) with reboxetine at 12 weeks compared to placebo (Analysis 1.1) and is included in the summary of findings Table for the main comparison. Due to the limited evidence available we have rated this finding as 'very low quality' and it should be interpreted with great caution. We therefore considered that it would be misleading to focus on this outcome in isolation when continuous outcomes offer complementary and comparable information to dichotomous outcomes. Therefore we briefly discuss the results from average negative symptom scores below.
1.1.1 Average negative symptom score
Three studies (N = 129) reported SANS continuous scores in the short‐term (2 to 12 weeks) and combining these we found no benefit of reboxetine on negative symptoms compared to placebo (Poyurovsky 2003; Poyurovsky 2007; Shafti 2015). However, there was substantial heterogeneity and the effect was not robust with a fixed‐effect model showing a statistically significant benefit of reboxetine. Kelly 2009 (N = 23) reported a modified version of the SANS in the short term (2 to 12 weeks) which did not show a significant benefit.
Six studies (N = 359) reported PANSS negative subscale continuous scores in the short term (2 to 12 weeks) and we found no benefit of NRIs over placebo (Friedman 2008; Hinkelmann 2013; Li 2008; Schutz 2001; Yu 2012; Zhao 2013). There was again significant heterogeneity and the effect was not robust as, for example, a fixed‐effect model showed a statistically significant benefit of NRIs.
In the medium term (13 to 26 weeks) one study showed no benefit of reboxetine on the SANS (Usall 2014; N = 47) while three studies (N = 219) reporting the PANSS negative subscale suggested a large benefit of reboxetine over placebo (Usall 2014; Yu 2012; Zhao 2013). The medium term PANSS negative subscale result is not included in the summary of findings Table for the main comparison and we consider it to be 'low quality' by GRADE criteria due to concerns about small sample size and the risk of bias in some of the trials and so it should be interpreted with caution.
The more equivocal findings in the short term could represent a correlation between duration of treatment and effect size and this is borne out by the larger benefit of reboxetine in the medium term compared to the short term seen in the two studies contributing to both analyses (Yu 2012; Zhao 2013).
1.2 Significant response or improvement in positive symptoms
No trials reported this outcome so we used average positive symptom score as a surrogate and downgraded the quality of evidence due to indirectness as per GRADE criteria.
1.2.1 Average positive symptoms score
Three studies (N = 129) reported SAPS continuous scores in the short term (2 to 12 weeks) and we found no effect of reboxetine (Poyurovsky 2003; Poyurovsky 2007; Shafti 2015). One study (Kelly 2009; N = 23) reported short‐term BPRS positive subscale continuous scores and we found no difference between atomoxetine and placebo.
Five studies (N = 294) reported PANSS positive subscale continuous scores in the short term (2 to 12 weeks) with no effect of NRIs over placebo (Friedman 2008; Hinkelmann 2013; Li 2008; Schutz 2001; Zhao 2013). We included this in the summary of findings Table for the main comparison and rated it as 'moderate quality' due to the small sample size. As a surrogate for the dichotomous outcome we further downgraded to 'low quality' due to the indirectness of the measure and it should be interpreted with caution. The lack of effect of NRIs on positive symptoms in the short term (2 to 12 weeks) was quite robust although the confidence intervals did not completely exclude clinically significant effects.
Two further studies also reported medium‐term (13 to 26 weeks) outcomes without effect of reboxetine (Usall 2014; Zhao 2013; N = 154).
2. Cognitive functioning
2.1 Significant response or improvement in clinical scale of cognitive functioning
No trial reported this outcome.
2.2 Average composite cognitive functioning score
Four studies (N = 180) reported composite SMD effect sizes in the short term (2 to 12 weeks) with no benefit for NRIs over placebo (Eli Lilly 2006; Friedman 2008; Kelly 2009; Poyurovsky 2007). and when we combined them there was a fairly robust lack of benefit with confidence intervals excluding all but a small benefit of NRIs. We included this result in the summary of findings Table for the main comparison and rated it as 'low quality' due to the small sample size, width of the confidence intervals, and risk of bias in some studies.
One study reported medium‐term (13 to 26 weeks) outcomes for atomoxetine without a significant benefit (Ball 2011; N = 26).
3. Quality of life
3.1 Significant response or improvement in quality of life
No trial reported this outcome so we used average quality of life score as a surrogate and downgraded the quality of evidence due to indirectness as per GRADE criteria.
3.1.1 Average quality of life score
One trial reported GQOLI‐74 total and subscale continuous scores in the short‐term (2 to 12 weeks) and we found a benefit of reboxetine on the total score and on two out of four subscales (psychological and social wellbeing) compared to placebo (Li 2008; N = 114). We included this result in the summary of findings Table for the main comparison and rated it as 'very low quality' due to concerns about the risk of bias in this trial and evidence of publication bias and it should be interpreted with great caution.
4. Clinical global response
4.1 Significant response or improvement in clinical global status
One study reported non‐specific improvement rates which showed no difference between placebo and viloxazine (Kurland 1981; N = 28). We included this result in the summary of findings Table for the main comparison and rated it as 'very low quality' due to concerns about the quality of the trial and the risk of bias as well as evidence of publication bias and it should be interpreted with great caution. We therefore considered that it would be misleading to focus on this outcome in isolation when continuous outcomes offer complementary and comparable information to dichotomous outcomes. Therefore we briefly discuss the results from average clinical global status score below.
4.1.1 Average clinical global status score
Five studies (n = 160) reported CGI‐S continuous scores in the short term (2 to 12 weeks) and we found no benefit for NRIs over placebo (Hinkelmann 2013; Kelly 2009; Poyurovsky 2003; Poyurovsky 2007; Schutz 2001). These findings were robust although the confidence intervals could not exclude a clinically significant benefit. This result was not included in the summary of findings Table for the main comparison and we have rated it as 'moderate quality' by GRADE criteria due to the small sample size.
5. Leaving the study early
5.1 All cause withdrawals
Eight trials (n = 401) reported short‐term (2 to 12 weeks) outcomes and we found no difference in the rates of withdrawals between NRIs and placebo (Eli Lilly 2006; Friedman 2008; Hinkelmann 2013; Kelly 2009; Poyurovsky 2003; Poyurovsky 2007; Schutz 2001; Shafti 2015). Three trials (n = 169) reported medium‐term (13 to 26 weeks) outcomes with similar results (Ball 2011; Usall 2014; Yu 2012). This lack of effect was robust but the confidence intervals did not rule out clinically significant benefits or harms; and withdrawals were poorly reported. We did not include this result in the summary of findings Table for the main comparison and we have rated it as 'moderate quality' using GRADE criteria due to concerns about the small sample size and wide confidence intervals.
5.2 Withdrawal due to adverse events
Four studies (n = 178) reported results in the short term (2 to 12 weeks) and we found no difference in withdrawals due to adverse events between NRIs and placebo (Eli Lilly 2006; Friedman 2008; Kelly 2009; Schutz 2001). One medium‐term (24 weeks) study (N = 33) of atomoxetine also showed no difference (Ball 2011). The confidence intervals did not rule out clinically significant benefits or harms, and withdrawals were poorly reported. We did not include this in the summary of findings Table for the main comparison and we have rated it as 'low quality' using GRADE criteria due to concerns about small sample size, wide confidence intervals, and likely publication bias, and it should be interpreted with caution.
6. Specific adverse effects
6.1 Incidence of nausea
We were unable to include the data from one study (Hinkelmann 2013).
Three studies (n = 176) reported rates of nausea in the short term (2 to 12 weeks) but we found no evidence of an increased rate with NRIs over placebo (Kelly 2009; Li 2008; Schutz 2001). While this was fairly robust the confidence intervals do not rule out clinically significant benefits or harms and, overall, adverse events were poorly reported and the number of events was low. This result is included in the summary of findings Table for the main comparison and we have rated it as 'low quality' due to concerns about publication bias, small sample size, and wide confidence intervals, and it should be interpreted with caution.
One study reported rates in the medium term (13 to 26 weeks) without a significantly increased rate with reboxetine (Zhao 2013; N = 107).
6.2 Average weight gain
Three studies (n = 186) reported weight gain in the short term (2 to 12 weeks) and we found that patients taking reboxetine gained 2 kg less on average than patients taking placebo (Poyurovsky 2003; Poyurovsky 2007; Zhao 2013). This result was not included in the summary of findings Table for the main comparison and we have rated it as 'low quality' using GRADE criteria due to concerns about publication bias and small sample size, and it should be interpreted with caution.
Two studies reported medium‐term (13 to 26 weeks) results, one finding little benefit of atomoxetine (Ball 2011; N = 26), the other a large benefit of reboxetine (Zhao 2013; N = 107).
6.3 Serious adverse events
Three studies (N = 271) reported rates of serious adverse events in the short term (2 to 12 weeks) and we did not find evidence of an increased rate with NRIs compared to placebo (Eli Lilly 2006; Hinkelmann 2013; Li 2008). The confidence intervals did not rule out clinically significant harms and overall adverse events were poorly reported. We did not include this in the summary of findings Table for the main comparison and we have rated it as 'very low quality' using GRADE criteria due to concerns about the small sample size with few events and very wide confidence intervals and also likely publication bias and it should be interpreted with great caution.
6.4 Other specific adverse effects
We analysed other specific adverse effects, including insomnia, dry mouth, constipation, sedation, fatigue, dizziness, tachycardia, tremor, and akathisia. Single trials reported rates of QT‐prolongation, headache, vomiting, diarrhoea, anorexia, weight loss, abdominal pain, sore throat, impotence, rash, sweating, parkinsonism, acute dystonia, and hypersalivation. Only for dry mouth did we find rates significantly higher for NRIs over placebo in the short term (2 to 12 weeks). In the medium term (13 to 26 weeks) single studies suggested constipation rates were greater with reboxetine while rates of tremor were lower with atomoxetine. These results were not included in the summary of findings Table for the main comparison and in general we would rate them as 'very low quality' using GRADE criteria due to concerns about small sample sizes, few events, very wide confidence intervals, and likely publication bias and they should be interpreted with great caution. The elevated rate of dry mouth with NRIs in the short term (2 to 12 weeks) from three studies (Kelly 2009; Li 2008; Schutz 2001; N = 172) was rated as 'low quality' due to concerns about the small sample size and likely publication bias and should be interpreted with caution.
Overall completeness and applicability of evidence
1. Completeness
1.1 Outcomes
The majority of reported outcomes were mental state scales (e.g. the PANSS), clinical global response (CGI‐S), or cognitive tests. However, even for these outcomes there was evidence of considerable under‐reporting and possible publication bias. Few studies attempted to utilise their continuous outcome measures to define response rates and thus there were few dichotomous outcome measures reported. Dichotomous outcomes, such as the proportion of patients with a 50% reduction in scores on mental state scales, offer complementary information to the mean scores on symptom scales by emphasising the number of patients with clinically significant improvements rather than differences in mean symptom scores averaged across all patients. More patient‐centred outcomes (that likely are more relevant for long‐term prognosis) such as quality of life, social functioning, occupational status, or carer or patient satisfaction, were rarely reported if at all. Withdrawal rates were around 20% overall and did not differ between NRI and placebo arms, suggesting that the validity of outcomes was not compromised.
The limited number of small studies included makes detection of rare but serious adverse events highly unlikely, including those of specific interest such as suicide or acute liver failure. For instance, it is very difficult to interpret the finding of one patient developing seizures in the NRI arm of a single study as we found in this review. We did not detect an increased rate of even the most commonly reported side‐effect with NRIs (nausea) and given the low event rate it is likely that for most side‐effects we did not have the sensitivity to detect an increased rate with NRIs. As is unfortunately often the case in clinical trial reporting, while side‐effects were measured by most studies they were infrequently reported in a useable form. Therefore, although NRIs seemed generally relatively well tolerated, there was certainly evidence consistent with NRIs being associated with an increased rate of side‐effects.
It is increasingly recognised that the economic costs of interventions are important to guide recommendations for treatment. However, no studies reported on economic outcomes or possible proxies for this, such as hospitalisation.
1.2 Duration
The majority of trials were short term (2 to 12 weeks) with some medium term (13 to 26 weeks) and none long term (> 26 weeks). There was some evidence that the benefits of NRIs increase with a longer course of treatment. Therefore it is disappointing that so few studies followed patients up longer than a few weeks when the natural history of schizophrenia and likely duration of treatment would suggest much longer trials are needed to inform treatment decisions.
2. Applicability
2.1 Patients
The majority of trials included only patients with schizophrenia (mostly using DSM‐IV criteria), limiting applicability to patients with other schizophrenia spectrum disorders such as schizoaffective disorder. As is usually the case with clinical trials most studies excluded patients with physical or psychiatric comorbidities, and substance misuse in particular, which somewhat limits applicability to real life clinical populations where comorbidity is common. The patient populations included in each study were relatively poorly characterised but overall it appeared that it was primarily patients with more chronic presentations.
Trials were conducted in a wide range of countries including Spain, South Africa, China, Israel, Iran, and the United States. While most outcomes were homogeneous it is noticeable that in those cases where there appeared to be benefits of NRIs over placebo, these frequently involved Chinese studies (Li 2008; Yu 2012; Zhao 2013), although this is also confounded, with studies specifically recruiting patients with negative symptoms or taking clozapine, and other studies recruiting patients with negative symptoms (e.g. Shafti 2015; Usall 2014), also showing trends for a benefit of NRIs.
2.2 Dosage
Most studies used doses of reboxetine up to 8 mg daily with the rest using up to 4 mg daily. However, 8 mg daily is the starting dose of reboxetine for depression and it can be increased up to 12 mg daily (BNF 2016), suggesting that it may have been under‐dosed in these trials. The more positive Chinese studies used doses of 8 mg daily.
Most trials using atomoxetine titrated up to 80 mg daily, with one study using doses up to 120 mg daily and one study including an arm with 40 mg daily. When used for ADHD atomoxetine is started at 40 mg daily, and increased to a usual maintenance dose of 80 mg to 100 mg daily, and can be increased up to 120 mg daily (BNF 2016), again suggesting that most trials may have used doses at the lower end of the therapeutic range.
2.3 Setting
Where reported, most trials included only inpatients, and while most outcomes were not heterogeneous it is noticeable that in those cases where there appeared to be benefits of NRIs over placebo these frequently involved Chinese inpatients.
Quality of the evidence
For most domains of bias we judged the majority of trials to be of unclear or low risk; however in most domains there were also some trials at high risk of bias (see Figure 2; Figure 3). Although we included one open trial (Yu 2012), our sensitivity analyses did not suggest that this was driving the outcomes. We considered the quality of the current evidence to be low or very low using GRADE criteria, except for the findings of no effect of NRIs on CGI‐S and PANSS positive score (summary of findings Table for the main comparison); or all cause withdrawals, where we considered the evidence to be of moderate quality. The quality of evidence was downgraded due to small sample sizes with wide confidence intervals, poorly described methods, and evidence of selective reporting of outcomes and publication bias. There was a mixture of studies funded by pharmaceutical companies and by government agencies with no evidence of differential outcomes depending on funding source. There was a particular issue with skewed outcomes and we were unable to establish whether utilising change scores rather than endscores ameliorated this. We also made widespread utilisation of imputed SD. In our sensitivity analyses we did not detect evidence that skewed scores or imputed SD made a substantial difference to results.
Potential biases in the review process
1. Unpublished data
Our review has certainly identified the most studies of NRIs in schizophrenia to date. A number of the included studies were performed in China and reported in Chinese and had not previously been identified. This suggests that there may be a considerable literature available, published in regional non‐English journals. There were also a number of studies which did not fully report their results or which appear to be completed but unpublished, suggesting that there is still a substantial amount of data that we have not been able to include in the review.
2. Poor reporting and publication bias
A number of studies did not provide useable data, often reporting no significant effect on these outcomes, which suggests the possibility of publication bias for positive studies. However, the vast majority of studies found no significant changes, partially due to small effect sizes resulting in low statistical power. The NRI literature is unusual in that most published studies have found negative results but more recently larger more positive studies have been published. It is possible that some smaller negative studies were not thought to warrant publication given the largely negative existing literature. Due to the limited number of studies, it was not possible to perform funnel plots to investigate publication bias.
3. Chinese studies
Three positive Chinese studies were major contributors to our review, driving many significant results (Li 2008; Yu 2012; Zhao 2013). There is some evidence that trial results from non‐Western countries tend to over‐report positive findings (Panagiotou 2013), particularly Chinese studies, and the most likely explanation for this is lower trial quality (Zhang 2011). We have not specifically conducted sensitivity analyses excluding these trials, preferring to rely on our assessments of risk on a trial‐by‐trial basis. Apart from the unblinded study by Yu 2012, the other two Chinese trials — Li 2008 and Zhao 2013 — were not clearly of lower quality than the other studies in this review (Figure 3) but it is noticeable that reported standard deviations in all three trials were smaller than for the other trials included in this review and the random‐effects model we used will only partially compensate for this.
Agreements and disagreements with other studies or reviews
We have reported effect sizes in terms of the underlying measurement scales in order to facilitate their interpretation. Paradoxically this makes comparisons with other studies difficult as these have mostly used the SMD as a measure of effect size. For illustrative purposes we have converted the short‐term PANSS total scores and medium‐term PANSS negative scores to the corresponding SMD using all change scores (as endscores and change scores cannot be combined when calculating the SMD). The PANSS total effect size goes from 2.8 to 2.4 points using change scores and this corresponds to an SMD of 0.4. Similarly the PANSS negative effect size goes from 3.3 to 3.7 points using change scores and this corresponds to an SMD of 1.1.
Rummel‐Kluge 2006 conducted a Cochrane Review of antidepressants for negative symptoms in schizophrenia but did not include any selective noradrenaline reuptake inhibitors (NRIs), specifically excluding three studies as they did not recruit patients with predominantly negative symptoms (Kurland 1981; Poyurovsky 2003; Schutz 2001). Another Cochrane Review by Whitehead 2002 looked at the use of antidepressants in patients with comorbid schizophrenia and depression but the only trial of NRIs identified was Kurland 1981. Vernon 2014 conducted a review of antidepressants for cognitive symptoms in schizophrenia and found mostly non‐significant or clinically unimportant effects and only identified one NRI study (Poyurovsky 2007). Singh 2010 conducted a meta‐analysis looking at antidepressants for the treatment of the negative symptoms of schizophrenia. This found an overall benefit of antidepressants with an SMD around 0.5; but looking at three studies — Poyurovsky 2003, Poyurovsky 2007 and Schutz 2001 — concluded there was no benefit of reboxetine. They did not include atomoxetine as it is not considered an antidepressant. It is interesting that studies of mirtazapine and mianserin have found larger benefits than studies of SSRIs since the former have noradrenergic as well as serotonergic effects (Hecht 2012; Kishi 2014). We had only limited evidence to compare NRIs directly against SSRIs but two studies including reboxetine and citalopram arms found no statistically significant differences between them (Hinkelmann 2013; Usall 2014). However, neither study found a benefit of either citalopram or reboxetine over placebo and were not sufficiently powered to detect differences.
The most comparable study to our review is a meta‐analysis by Kishi 2013 which updates Singh 2010 to look specifically at noradrenaline reuptake inhibitors. They included seven studies which are also included in our review (Ball 2011; Friedman 2008; Kelly 2009; Poyurovsky 2003; Poyurovsky 2007; Sacco 2009; Schutz 2001). They also included Poyurovsky 2013, which we excluded from our review as the intervention was reboxetine plus betahistine. In addition they included a trial of mazindol which they classified as a noradrenaline reuptake inhibitor but pointed out that it is known to additionally inhibit dopamine and serotonin reuptake. As our study looked specifically at selective noradrenaline reuptake inhibitors (NRIs) we made an a priori decision not to include mazindol. There were nine additional studies identified and included in our review that were not included in Kishi 2013 (Eli Lilly 2006; Ganguli 2008; Hinkelmann 2013; Kurland 1981; Li 2008; Shafti 2015; Usall 2014; Yu 2012; Zhao 2013). They are characterised mostly by having been published more recently or being published in Chinese. Kishi 2013 found no benefit of NRIs on overall, positive, or negative symptoms of schizophrenia with a borderline significant benefit on depressive symptoms. They also found no greater side‐effects with noradrenaline reuptake‐inhibitors except for an increased pulse rate and weight loss. Areas of overlap include the findings of NRIs benefiting depressive symptoms and decreasing weight gain and a general lack of side‐effects for NRIs. Areas of difference include our finding of a benefit of NRIs on PANSS total scores in the short term (2 to 12 weeks) and PANSS negative scores in the medium term (13 to 26 weeks). It is notable that few of the studies contributing to these outcomes were included in Kishi 2013. The increased rate of dry mouth in our review was not analysed by Kishi 2013 and we did not look specifically at heart rate as a continuous outcome. They did not analyse cognitive outcomes, social functioning, or quality of life. We included viloxazine in our review as the limited data available about its pharmacological profile suggests it is selective for noradrenaline reuptake but it contributed few measures to our analysis.
Choi 2015 conducted a meta‐analysis looking at medication for weight control in schizophrenia and identified two out of three studies included in our short‐term analysis — Poyurovsky 2003 and Poyurovsky 2007 — finding a similar effect size. Mizuno 2014 also looked at medication for weight control and as well as the two studies included in Choi 2015 they also identified the Ball 2011 study of atomoxetine which showed no benefit on weight. Neither review identified Zhao 2013.

Study flow diagram.
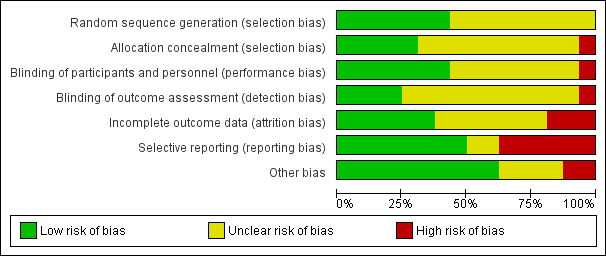
Risk of bias graph: review authors' judgements about each risk of bias item presented as percentages across all included studies.

Risk of bias summary: review authors' judgements about each risk of bias item for each included study.
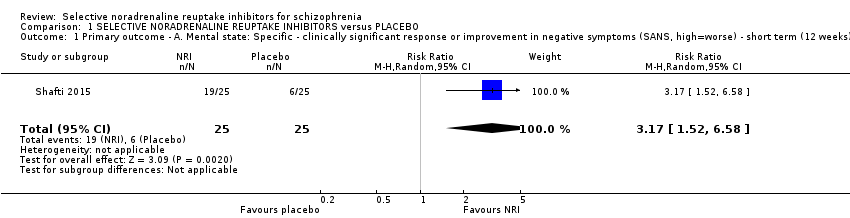
Comparison 1 SELECTIVE NORADRENALINE REUPTAKE INHIBITORS versus PLACEBO, Outcome 1 Primary outcome ‐ A. Mental state: Specific ‐ clinically significant response or improvement in negative symptoms (SANS, high=worse) ‐ short term (12 weeks).

Comparison 1 SELECTIVE NORADRENALINE REUPTAKE INHIBITORS versus PLACEBO, Outcome 2 Primary outcome ‐ B. Clinical global response: Clinically significant response or improvement in global status (CGI‐S, high=worse) ‐ short term (4 weeks).

Comparison 1 SELECTIVE NORADRENALINE REUPTAKE INHIBITORS versus PLACEBO, Outcome 3 Mental state: 1. General ‐ clinically significant response or improvement in general/overall symptoms as defined in each study ‐ short term (2‐12 weeks).

Comparison 1 SELECTIVE NORADRENALINE REUPTAKE INHIBITORS versus PLACEBO, Outcome 4 Mental state: 2a. General: Average general/overall symptoms score (various scales, high=worse) ‐ short term (2 ‐ 12 weeks).

Comparison 1 SELECTIVE NORADRENALINE REUPTAKE INHIBITORS versus PLACEBO, Outcome 5 Mental state: 2b. General: Average general/overall symptoms score (various scales, high=worse) ‐ medium term (13 ‐ 26 weeks).
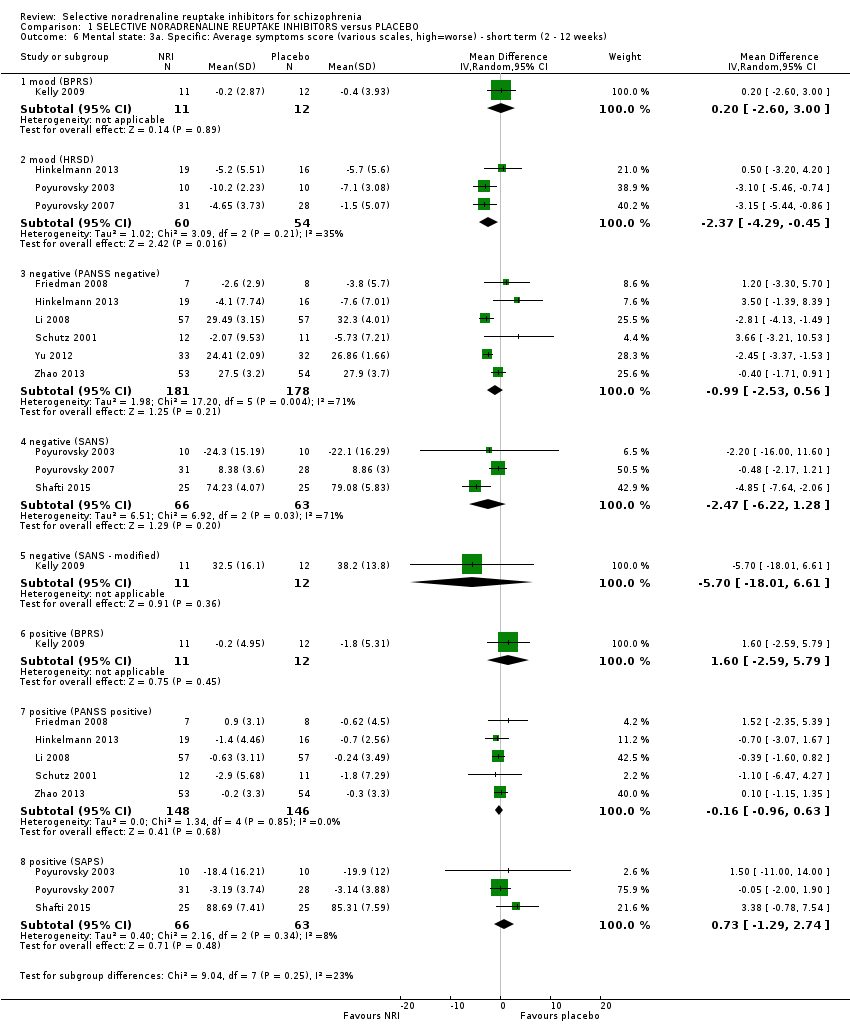
Comparison 1 SELECTIVE NORADRENALINE REUPTAKE INHIBITORS versus PLACEBO, Outcome 6 Mental state: 3a. Specific: Average symptoms score (various scales, high=worse) ‐ short term (2 ‐ 12 weeks).

Comparison 1 SELECTIVE NORADRENALINE REUPTAKE INHIBITORS versus PLACEBO, Outcome 7 Mental state: 3b. Specific: Average symptoms score (various scales, high=worse) ‐ medium term (13 ‐ 26 weeks).
| Study | NRI | NRI mean | NRI SD | NRI N | Placebo mean | Placebo SD | Placebo N |
| general ‐ overall symptoms (BPRS total) | |||||||
| Kelly 2009 | Atomoxetine | 30.2 | 8.2 | 11 | 36 | 11.6 | 12 |
| general ‐ overall symptoms (PANSS general) | |||||||
| Friedman 2008 | Atomoxetine | 26.7 | 4.4 | 10 | 32 | 8 | 10 |
| Hinkelmann 2013 | Reboxetine | 28.7 | 9.4 | 19 | 28.4 | 10.1 | 16 |
| Schutz 2001 | Reboxetine | 29.6 | 8.92 | 12 | 30.4 | 7.44 | 11 |
| general ‐ overall symptoms (PANSS total) | |||||||
| Schutz 2001 | Reboxetine | 67.67 | 20.66 | 12 | 70.67 | 14.96 | 11 |
| specific ‐ mood (BPRS anxiety/depression) | |||||||
| Kelly 2009 | Atomoxetine | 6.4 | 1.9 | 11 | 8.3 | 3.6 | 12 |
| specific ‐ mood (HRSD) | |||||||
| Hinkelmann 2013 | Reboxetine | 8.3 | 6.1 | 19 | 6.5 | 5.6 | 16 |
| Poyurovsky 2003 | Reboxetine | 4.6 | 3.5 | 10 | 4.6 | 3.5 | 10 |
| Poyurovsky 2007 | Reboxetine | 4.53 | 2 | 16 | 3 | 2 | 17 |
| Schutz 2001 | Reboxetine | 6.93 | 4.95 | 12 | 6.93 | 3.17 | 11 |
| specific ‐ negative symptoms (SANS) | |||||||
| Poyurovsky 2003 | Reboxetine | 18.9 | 13.4 | 10 | 23.2 | 18.8 | 10 |
| specific ‐ negative symptoms (PANSS negative) | |||||||
| Friedman 2008 | Atomoxetine | 15.2 | 4.8 | 10 | 15.5 | 5.9 | 10 |
| Hinkelmann 2013 | Reboxetine | 21.5 | 8.6 | 19 | 19.1 | 5.5 | 16 |
| Schutz 2001 | Reboxetine | 25.13 | 9.53 | 12 | 23.27 | 7.21 | 11 |
| specific ‐ positive symptoms (BPRS positive) | |||||||
| Kelly 2009 | Atomoxetine | 9.8 | 4.9 | 11 | 10.3 | 5.5 | 12 |
| specific ‐ positive symptoms (PANSS positive) | |||||||
| Friedman 2008 | Atomoxetine | 13.2 | 4.5 | 10 | 14.6 | 4.5 | 10 |
| Hinkelmann 2013 | Reboxetine | 10.6 | 4.6 | 19 | 8.6 | 2.4 | 16 |
| Li 2008 | Reboxetine | 9.02 | 2.64 | 57 | 8.72 | 3.21 | 57 |
| Schutz 2001 | Reboxetine | 14.1 | 5.68 | 12 | 15.8 | 7.29 | 11 |
| Zhao 2013 | Reboxetine | 9.1 | 3.4 | 54 | 9.1 | 3.1 | 53 |
| specific ‐ positive symptoms (SAPS) | |||||||
| Poyurovsky 2003 | Reboxetine | 4.8 | 3.9 | 10 | 11.8 | 12.2 | 10 |
| Poyurovsky 2007 | Reboxetine | 3.21 | 3.2 | 31 | 2.66 | 2.4 | 28 |
Comparison 1 SELECTIVE NORADRENALINE REUPTAKE INHIBITORS versus PLACEBO, Outcome 8 Mental state: 4a. General and specific: Average score (various scales, high=worse) ‐ skewed results ‐ short term (2 ‐ 12 weeks).
| Study | NRI | NRI mean | NRI SD | NRI N | Placebo mean | Placebo SD | Placebo N |
| general ‐ overall symptoms (BPRS total) | |||||||
| Ball 2011 | Atomoxetine | 30.8 | 5.8 | 14 | 31 | 8.9 | 12 |
| general ‐ overall symptoms (PANSS general) | |||||||
| Usall 2014 | Reboxetine | 28.83 | 8.1 | 24 | 30.09 | 7.93 | 23 |
| general ‐ overall symptoms (PANSS total) | |||||||
| Usall 2014 | Reboxetine | 59.96 | 17.89 | 24 | 62.04 | 19.9 | 23 |
| Yu 2012 | Reboxetine | 24.24 | 3.54 | 33 | 26.86 | 1.66 | 32 |
| specific ‐ negative symptoms (PANSS negative) | |||||||
| Usall 2014 | Reboxetine | 19.67 | 8.41 | 24 | 22.65 | 5.54 | 23 |
| specific ‐ negative symptoms (SANS) | |||||||
| Usall 2014 | Reboxetine | 46.75 | 26.12 | 24 | 54.61 | 19.13 | 23 |
| specific ‐ positive symptoms (PANSS positive) | |||||||
| Usall 2014 | Reboxetine | 11.46 | 4.14 | 24 | 12 | 5.68 | 23 |
| Zhao 2013 | Reboxetine | 9 | 3.2 | 54 | 9.3 | 3.4 | 53 |
Comparison 1 SELECTIVE NORADRENALINE REUPTAKE INHIBITORS versus PLACEBO, Outcome 9 Mental state: 4b. General and specific: Average score (various scales, high=worse) ‐ skewed results ‐ medium term (13 ‐ 26 weeks).

Comparison 1 SELECTIVE NORADRENALINE REUPTAKE INHIBITORS versus PLACEBO, Outcome 10 Cognitive functioning: 1. General ‐ average composite cognitive functioning score (SMD).

Comparison 1 SELECTIVE NORADRENALINE REUPTAKE INHIBITORS versus PLACEBO, Outcome 11 Cognitive functioning: 2. Specific ‐ average individual scores (SMD) ‐ short term (2 ‐ 12 weeks).

Comparison 1 SELECTIVE NORADRENALINE REUPTAKE INHIBITORS versus PLACEBO, Outcome 12 Quality of life: Average quality of life score (GQOLI‐74, high=better) ‐ short term (2 ‐ 12 weeks).
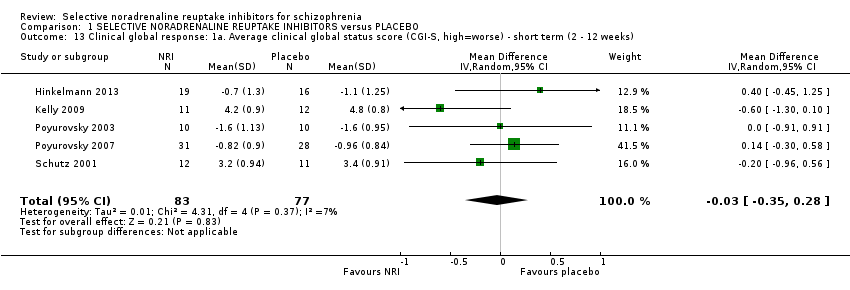
Comparison 1 SELECTIVE NORADRENALINE REUPTAKE INHIBITORS versus PLACEBO, Outcome 13 Clinical global response: 1a. Average clinical global status score (CGI‐S, high=worse) ‐ short term (2 ‐ 12 weeks).
| Study | NRI | NRI mean | NRI SD | NRI N | Placebo mean | Placebo SD | Placebo N |
| CGI‐I | |||||||
| Schutz 2001 | Reboxetine | 3.4 | 1.35 | 12 | 3.07 | 1.22 | 11 |
| CGI‐S | |||||||
| Hinkelmann 2013 | Reboxetine | 4.2 | 1.5 | 19 | 3.6 | 1.3 | 16 |
| Poyurovsky 2003 | Reboxetine | 3.1 | 1.3 | 10 | 3 | 1.1 | 10 |
Comparison 1 SELECTIVE NORADRENALINE REUPTAKE INHIBITORS versus PLACEBO, Outcome 14 Clinical global response: 1b. Average clinical global status score (various scales, high=worse) ‐ short term (2 ‐ 12 weeks) ‐ skewed results.

Comparison 1 SELECTIVE NORADRENALINE REUPTAKE INHIBITORS versus PLACEBO, Outcome 15 Leaving the study early: 1a. Short term (2 ‐ 12 weeks).

Comparison 1 SELECTIVE NORADRENALINE REUPTAKE INHIBITORS versus PLACEBO, Outcome 16 Leaving the study early: 1b. Medium term (13 ‐ 26 weeks).
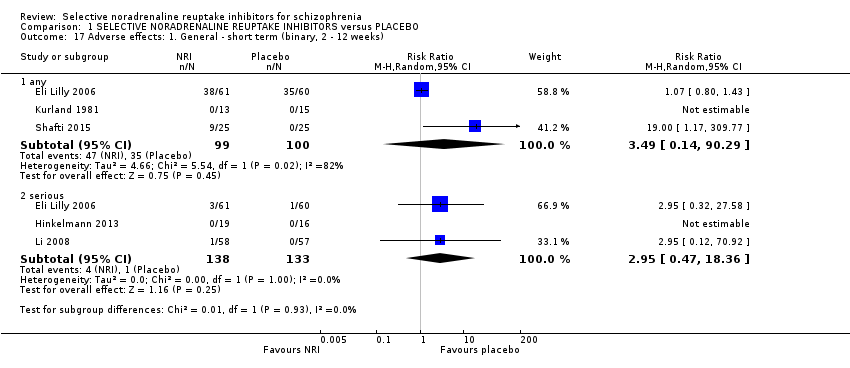
Comparison 1 SELECTIVE NORADRENALINE REUPTAKE INHIBITORS versus PLACEBO, Outcome 17 Adverse effects: 1. General ‐ short term (binary, 2 ‐ 12 weeks).

Comparison 1 SELECTIVE NORADRENALINE REUPTAKE INHIBITORS versus PLACEBO, Outcome 18 Adverse effects: 2a.i. Specific ‐ short term (binary, 2 ‐ 12 weeks).

Comparison 1 SELECTIVE NORADRENALINE REUPTAKE INHIBITORS versus PLACEBO, Outcome 19 Adverse effects: 2a.ii. Specific ‐ extrapyramidal ‐ average change score (continuous, various scales, high=worse) ‐ short term (2 ‐ 12 weeks).
| Study | NRI | NRI mean | NRI SD | NRI N | Placebo mean | Placebo SD | Placebo N |
| AIMS | |||||||
| Kelly 2009 | Atomoxetine | 1.33 | 1.88 | 12 | 0.93 | 1.94 | 11 |
| SAS | |||||||
| Kelly 2009 | Atomoxetine | 0.4 | 0.5 | 11 | 1.9 | 2.6 | 15 |
| Schutz 2001 | Reboxetine | 2.5 | 3.4 | 11 | 2.3 | 2.9 | 15 |
Comparison 1 SELECTIVE NORADRENALINE REUPTAKE INHIBITORS versus PLACEBO, Outcome 20 Adverse effects: 2a.iii. Specific ‐ extrapyramidal ‐ average change score (continuous, various scales, high=worse) ‐ short term (2 ‐ 12 weeks) ‐ skewed results.

Comparison 1 SELECTIVE NORADRENALINE REUPTAKE INHIBITORS versus PLACEBO, Outcome 21 Adverse effects: 2b.i. Specific ‐ medium term (binary, 13 ‐ 26 weeks).

Comparison 1 SELECTIVE NORADRENALINE REUPTAKE INHIBITORS versus PLACEBO, Outcome 22 Adverse effects: 2a.iv. Specific ‐ metabolic ‐ average weight gain (continuous, increase in kg).

Comparison 1 SELECTIVE NORADRENALINE REUPTAKE INHIBITORS versus PLACEBO, Outcome 23 Social or general functioning: Average social functioning score (various subscales) ‐ short‐term (2 ‐ 12 weeks).

Comparison 2 SELECTIVE NORADRENALINE REUPTAKE INHIBITORS versus ACTIVE CONTROL, Outcome 1 Mental state: 1a. General: Average general/overall symptoms score (PANSS general, high=worse) ‐ short term (2 ‐ 12 weeks).

Comparison 2 SELECTIVE NORADRENALINE REUPTAKE INHIBITORS versus ACTIVE CONTROL, Outcome 2 Mental state: 1b. General: Average general/overall symptoms score (various scales, high=worse) ‐ medium term (13 ‐ 26 weeks).

Comparison 2 SELECTIVE NORADRENALINE REUPTAKE INHIBITORS versus ACTIVE CONTROL, Outcome 3 Mental state: 2a. Specific: Average symptoms score (various scales, high=worse) ‐ short term (2 ‐ 12 weeks).

Comparison 2 SELECTIVE NORADRENALINE REUPTAKE INHIBITORS versus ACTIVE CONTROL, Outcome 4 Mental state: 2b. Specific: Average symptoms score (various scales, high=worse) ‐ medium term (13 ‐ 26 weeks).
| Study | NRI | NRI mean | NRI SD | NRI N | Active control | Control mean | Control SD | Control N |
| general ‐ overall symptoms (PANSS general) | ||||||||
| Hinkelmann 2013 | Reboxetine | 28.7 | 9.4 | 19 | Citalopram | 26.5 | 6.2 | 16 |
| specific ‐ mood (HRSD) | ||||||||
| Hinkelmann 2013 | Reboxetine | 8.3 | 6.1 | 19 | Citalopram | 9.6 | 5.8 | 16 |
| specific ‐ negative symptoms (PANSS negative) | ||||||||
| Hinkelmann 2013 | Reboxetine | 21.5 | 8.6 | 19 | Citalopram | 19.1 | 8.8 | 16 |
| specific ‐ positive symptoms (PANSS positive) | ||||||||
| Hinkelmann 2013 | Reboxetine | 10.6 | 4.6 | 19 | Citalopram | 11.1 | 4.8 | 16 |
Comparison 2 SELECTIVE NORADRENALINE REUPTAKE INHIBITORS versus ACTIVE CONTROL, Outcome 5 Mental state: 3a. General and specific: Average score (various scales, high=worse) ‐ skewed results ‐ short term (2 ‐ 12 weeks).
| Study | NRI | NRI mean | NRI SD | NRI N | Active control | Control mean | Control SD | Control N |
| general ‐ overall symptoms (PANSS general) | ||||||||
| Usall 2014 | Reboxetine | 28.83 | 8.1 | 24 | Citalopram | 28.88 | 5.32 | 17 |
| general ‐ overall symptoms (PANSS total) | ||||||||
| Usall 2014 | Reboxetine | 59.96 | 17.89 | 24 | Citalopram | 59.41 | 11.72 | 17 |
| specific ‐ negative symptoms (PANSS negative) | ||||||||
| Usall 2014 | Reboxetine | 19.67 | 8.41 | 24 | Citalopram | 19.82 | 4.99 | 17 |
| specific ‐ negative symptoms (SANS) | ||||||||
| Usall 2014 | Reboxetine | 46.75 | 26.12 | 24 | Citalopram | 46.63 | 15.84 | 17 |
| specific ‐ positive symptoms (PANSS positive) | ||||||||
| Usall 2014 | Reboxetine | 11.46 | 4.14 | 24 | Citalopram | 10.71 | 3.58 | 17 |
Comparison 2 SELECTIVE NORADRENALINE REUPTAKE INHIBITORS versus ACTIVE CONTROL, Outcome 6 Mental state: 3b. General and specific: Average score (various scales, high=worse) ‐ skewed results ‐ medium term (13 ‐ 26 weeks).

Comparison 2 SELECTIVE NORADRENALINE REUPTAKE INHIBITORS versus ACTIVE CONTROL, Outcome 7 Clinical global response: Average clinical global status score (CGI‐S, high=worse) ‐ short term (2 ‐ 12 weeks).

Comparison 2 SELECTIVE NORADRENALINE REUPTAKE INHIBITORS versus ACTIVE CONTROL, Outcome 8 Leaving the study early: 1a. Short term (2 ‐ 12 weeks).

Comparison 2 SELECTIVE NORADRENALINE REUPTAKE INHIBITORS versus ACTIVE CONTROL, Outcome 9 Leaving the study early: 1b. Medium term (13 ‐ 26 weeks).
| Study tag | Specific patient characteristics | Intervention | Control | Relevant Cochrane Reviews |
| Negative symptoms | Citalopram | Placebo | ||
| Negative symptoms | Citalopram | Placebo | ||
| Celecoxib | Placebo | |||
| Citalopram | Placebo | ‐ | ||
| Clomipramine | Placebo | ‐ | ||
| Citalopram | ‐ | |||
| Fluoxetine | Placebo | ‐ | ||
| Nortiptyline | ‐ | |||
| Fluvoxamine | Placebo | ‐ | ||
| Maprotiline | ‐ | |||
| Negative symptoms | Reboxetine | Placebo | ||
| Negative symptoms | Reboxetine | Placebo | ||
| Negative symptoms | Reboxetine | Placebo | ||
| Negative symptoms | Reboxetine | Placebo | ||
| Negative symptoms | Reboxetine | Control | ||
| Negative symptoms | Reboxetine | Placebo |
| Methods | Allocation: randomised (with sequence generation and allocation concealment clearly described) |
| Participants | Diagnosis: people with schizophrenia (duration > 6m) and prominent negative symptoms (e.g. PANSS negative > 30) N=300 Age: Any, but with recruitment focused on those aged 18‐65yrs Sex: Men and women |
| Interventions | 1. Reboxetine (8‐12mg daily) in combination with any antipsychotic treatment including clozapine 2. Placebo in combination with any antipsychotic treatment including clozapine |
| Outcomes | Mental state: significant improvement in negative symptoms defined as 20% reduction in the PANSS negative scale*, average scores on the PANSS negative scale, significant improvement and average scores on the PANSS total, general, and positive scales and the HRSD Cognitive functioning: significant improvement in a clinical scale of cognitive functioning such as the Schizophrenia Cognition Rating Scale (SCoRS) total score, average scores on neurocognitive testing such as the MATRICS Consensus Cognitive Battery (MCCB) overall composite T‐score and individual domain scores Quality of life: significant improvement in a quality of life scale, average scores on a quality of life scale Clinical global response: significant improvment in clinical global status defined as CGI‐I scores of 1 or 2, average scores on the CGI‐S Service utilisation Adverse effects: leaving the study early (for any reason), serious adverse effects, average weight gain Satisfaction with treatment Social or general functioning |
| Notes | * recommended primary outcome, other outcomes listed are suggestions rather than an exhaustive list |
| Selective noradrenaline reuptake inhibitor (NRI) versus placebo in schizophrenia | ||||||
| Patient or population: adults with schizophrenia | ||||||
| Outcomes | Anticipated absolute effects* (95% CI) | Relative effect | № of participants | Quality of the evidence | Comments | |
| Risk with placebo | Risk with NRI | |||||
| Mental state: significant response or improvement in negative symptoms (PANSS negative subscale, high = worse) ‐ short term (12 weeks) | Study population | RR 3.17 | 50 | ⊕⊝⊝⊝ | Additional information from average negative symptoms score was equivocal | |
| 240 per 1000 | 761 per 1000 | |||||
| Mental state: specific ‐ average positive symptoms score (PANSS positive subscale, high = worse) ‐ short term (2 to 12 weeks) | ‐ | The mean PANSS positive score in the intervention group was 0.16 less (0.96 less to 0.63 more) | ‐ | 294 | ⊕⊕⊝⊝ | No data reported for our prespecified outcome: significant response or improvement in positive symptoms SAPS and BPRS positive subscale outcomes showed similar results |
| Clinical global response: significant response or improvement in global status (CGI‐S, high = worse) ‐ short term (4 weeks) | Study population | RR 0.99 | 28 | ⊕⊝⊝⊝ | Additional information from average clinical global status score found a similar lack of effect | |
| 467 per 1000 | 462 per 1000 | |||||
| Cognitive functioning: significant response or improvement in cognitive functioning | no data reported for this outcome | |||||
| Cognitive functioning: average compostive endpoint score (SMD, low = favours NRI) ‐ short term (2 to 12 weeks) | The mean composite cognitive functioning SMD in the intervention group was 0.04 standard deviations more (0.28 less to 0.36 more) | ‐ | 180 | ⊕⊕⊝⊝ | ||
| Quality of life: Average endpoint score (GQOLI‐74, high = better) ‐ short term (2 to 12 weeks) | ‐ | The mean GQOLI‐74 score in the intervention group was 9.36 more (7.89 more to 10.83 more) | ‐ | 114 | ⊕⊝⊝⊝ | No data reported for our prespecified outcome of significant response or improvement in quality of life |
| Adverse effects: Nausea ‐ short term (2 to 12 weeks) | Study population | RR 0.49 | 176 | ⊕⊕⊝⊝ | ||
| 148 per 1000 | 72 per 1000 | |||||
| *The risk in the intervention group (and its 95% confidence interval) is based on the assumed risk in the comparison group and the relative effect of the intervention (and its 95% CI). | ||||||
| GRADE Working Group grades of evidence | ||||||
| 1 Imprecision: 'Serious' ‐ Small sample size ‐ Downgraded by 1 level 2 Risk of bias: 'Serious' ‐ Methods of random sequence generation and allocation concealment are poorly described ‐ Downgraded by 1 level 3 Risk of bias: 'Serious' ‐ Evidence of selective reporting bias ‐ Downgraded by 1 level 4 Inconsistency: 'No' ‐ Only 1 study ‐ Not downgraded 5 Publication bias: 'Strongly suspected' ‐ Evidence of significant relevant unpublished or unusable results ‐ Downgraded by 1 level 6 Indirectness: 'Serious' ‐ Outcome of interest was not reported so a related outcome was substituted as a surrogate ‐ Downgraded by 1 level 7 Imprecision: 'Serious' ‐ Small sample size, confidence intervals include clinically significant benefits or harms ‐ Downgraded by 1 level 8 Risk of bias: 'Serious' ‐ Includes studies with high risk of attrition, reporting, and other sources of bias ‐ Downgraded by 1 level 9 Indirectness: 'Serious' ‐ Participants recruited specifically with depressive symptoms so unrepresentative of most patients with schizophrenia ‐ Downgraded by 1 level | ||||||
| Subgroup or sensitivity analysis (see text for details) | Number of trials | N | Mean difference | 95% Confidence interval | I² |
| Overall outcome | 5 | 294 | ‐2.17 | ‐3.93 to ‐0.40* | 44% |
| Reboxetine | 4 | 279 | ‐2.20 | ‐4.15 to ‐0.25* | 55% |
| Clozapine‐only studies; excluding skewed change‐scores | 2 | 221 | ‐2.80 | ‐4.87 to ‐0.72* | 75% |
| Excluding studies without clozapine; negative symptoms | 3 | 256 | ‐2.40 | ‐4.48 to ‐0.31* | 65% |
| Excluding studies with imputed SD | 3 | 236 | ‐2.66 | ‐4.50 to ‐0.82* | 55% |
| Fixed‐effect model | 5 | 294 | ‐2.73 | ‐3.71 to ‐1.74* | 44% |
| Low risk of randomisation bias | 2 | 58 | 0.89 | ‐3.60 to 5.37 | 0% |
| * Statistically significant at p<0.05 | |||||
| Subgroup or sensitivity analysis (see text for details) | Number of trials | N | Mean difference | 95% Confidence interval | I² |
| Overall outcome | 4 | 309 | ‐2.84 | ‐5.28 to ‐0.40* | 72% |
| Clozapine‐only studies | 2 | 220 | ‐4.25 | ‐5.89 to ‐2.62* | 0% |
| Excluding outlier; excluding high risk of bias | 3 | 244 | ‐4.20 | ‐5.82 to ‐2.58* | 0% |
| Negative symptoms; excluding imputed SD | 3 | 186 | ‐2.94 | ‐5.54 to ‐0.34* | 81% |
| Fixed‐effect model | 4 | 309 | ‐2.12 | ‐3.12 to ‐1.11* | 72% |
| * Statistically significant at p<0.05 | |||||
| Subgroup or sensitivity analysis (see text for details) | Number of trials | N | Mean difference | 95% Confidence interval | I² |
| Overall outcome | 3 | 219 | ‐3.67 | ‐10.07 to 2.72 | 94% |
| Excluding outlier; excluding clozapine study | 2 | 112 | ‐1.07 | ‐2.59 to 0.46 | 0% |
| Fixed‐effect model | 3 | 219 | ‐3.63 | ‐4.87 to ‐2.39* | 94% |
| * Statistically significant at p<0.05 | |||||
| Subgroup or sensitivity analysis (see text for details) | Number of trials | N | Mean difference | 95% Confidence interval | I² |
| Overall outcome | 6 | 359 | ‐0.99 | ‐2.53 to 0.56 | 71% |
| Reboxetine | 5 | 341 | ‐1.20 | ‐2.80 to 0.40 | 74% |
| Clozapine‐only studies | 2 | 221 | ‐1.60 | ‐3.96 to 0.76 | 84% |
| Excluding studies without clozapine | 3 | 256 | ‐0.75 | ‐3.25 to 1.75 | 81% |
| Negative symptoms | 4 | 321 | ‐1.47 | ‐3.04 to 0.09 | 77% |
| Excluding imputed SD | 4 | 301 | ‐1.68 | ‐3.04 to ‐0.32* | 70% |
| Excluding skewed change scores | 3 | 286 | ‐1.92 | ‐3.28 to ‐0.55* | 75% |
| Fixed‐effect model | 6 | 259 | ‐1.82 | ‐2.46 to ‐1.18* | 71% |
| Low risk of randomisation bias | 2 | 58 | 3.55 | ‐0.43 to 7.54 | 0% |
| Excluding high risk of bias | 5 | 294 | ‐0.12 | ‐2.31 to 2.07 | 71% |
| * Statistically significant at p<0.05 | |||||
| Subgroup or sensitivity analysis (see text for details) | Number of trials | N | Mean difference | 95% Confidence interval | I² |
| Overall outcome | 5 | 294 | ‐0.16 | ‐0.96 to 0.63 | 0% |
| Reboxetine | 4 | 279 | ‐0.24 | ‐1.05 to 0.57 | 0% |
| Clozapine‐only studies | 2 | 221 | ‐0.15 | ‐1.02 to 0.72 | 0% |
| Excluding studies without clozapine; negative symptoms | 3 | 256 | ‐0.22 | ‐1.04 to 0.60 | 0% |
| Fixed‐effect model | 5 | 294 | ‐0.16 | ‐0.96 to 0.63 | 0% |
| Low risk of randomisation bias | 2 | 58 | ‐0.76 | ‐2.93 to 1.40 | 0% |
| Subgroup or sensitivity analysis (see text for details) | Number of trials | N | Mean difference | 95% Confidence interval | I² |
| Overall outcome | 4 | 180 | 0.04 | ‐0.28 to 0.36 | 8% |
| Atomoxetine | 3 | 147 | ‐0.07 | ‐0.55 to 0.41 | 33% |
| Fixed‐effect model | 4 | 180 | 0.06 | ‐0.24 to 0.35 | 8% |
| Low risk of randomisation bias | 2 | 55 | ‐0.18 | ‐1.06 to 0.69 | 61% |
| Excluding high risk of other bias | 2 | 48 | 0.14 | ‐0.42 to 0.71 | 0% |
| Excluding high risk of attrition and reporting bias | 3 | 70 | ‐0.12 | ‐0.66 to 0.43 | 22% |
| Subgroup or sensitivity analysis (see text for details) | Number of trials | N | Mean difference | 95% Confidence interval | I² |
| Overall outcome | 4 | 177 | 0.08 | ‐0.21 to 0.38 | 0% |
| Atomoxetine | 3 | 144 | 0.04 | ‐0.29 to 0.37 | 0% |
| Fixed‐effect model | 4 | 177 | 0.08 | ‐0.21 to 0.38 | 0% |
| Low risk of randomisation bias | 2 | 53 | 0.13 | ‐0.41 to 0.68 | 0% |
| Excluding high risk of attrition and other bias | 2 | 48 | 0.23 | ‐0.34 to 0.80 | 0% |
| Excluding high risk of reporting bias | 3 | 68 | 0.13 | ‐0.34 to 0.61 | 0% |
| Subgroup or sensitivity analysis (see text for details) | Number of trials | N | Mean difference | 95% Confidence interval | I² |
| Overall outcome | 4 | 181 | 0.01 | ‐0.31 to 0.32 | 7% |
| Atomoxetine | 3 | 148 | ‐0.08 | ‐0.40 to 0.25 | 0% |
| Fixed‐effect model | 4 | 181 | 0.01 | ‐0.28 to 0.30 | 7% |
| Low risk of randomisation bias | 2 | 55 | ‐0.06 | ‐1.04 to 0.93 | 69% |
| Excluding high risk of other bias | 2 | 48 | 0.26 | ‐0.31 to 0.83 | 0% |
| Excluding high risk of attrition and reporting bias | 3 | 70 | ‐0.04 | ‐0.66 to 0.58 | 38% |
| Subgroup or sensitivity analysis (see text for details) | Number of trials | N | Mean difference | 95% Confidence interval | I² |
| Overall outcome | 5 | 160 | ‐0.03 | ‐0.35 to 0.28 | 7% |
| Reboxetine; excluding high risk of bias | 4 | 137 | 0.10 | ‐0.23 to 0.42 | 0% |
| Excluding imputed SD; excluding skewed change scores | 3 | 105 | ‐0.15 | ‐0.60 to 0.29 | 37% |
| Fixed‐effect model | 5 | 160 | ‐0.03 | ‐0.32 to 0.27 | 7% |
| Subgroup or sensitivity analysis (see text for details) | Number of trials | N | Relative risk | 95% Confidence interval | I² |
| Overall outcome | 8 | 401 | 0.94 | 0.63 to 1.39 | 0% |
| Atomoxetine | 3 | 173 | 0.89 | 0.49 to 1.59 | 0% |
| Reboxetine | 5 | 200 | 0.95 | 0.54 to 1.70 | 0% |
| Fixed‐effect model | 8 | 401 | 0.95 | 0.64 to 1.41 | 0% |
| Low risk of bias in randomisation | 5 | 182 | 0.92 | 0.54 to 1.56 | 0% |
| Excluding high risk of other bias | 7 | 248 | 1.03 | 0.62 to 1.70 | 0% |
| Excluding high risk of reporting bias | 7 | 252 | 0.97 | 0.58 to 1.60 | 0% |
| Excluding high risk of attrition bias | 8 | 369 | 0.96 | 0.63 to 1.45 | 0% |
| Subgroup or sensitivity analysis (see text for details) | Number of trials | N | Relative risk | 95% Confidence interval | I² |
| Overall outcome | 4 | 178 | 2.08 | 0.70 to 6.21 | 0% |
| Atomoxetine | 3 | 153 | 1.88 | 0.58 to 6.08 | 0% |
| Fixed‐effect model | 4 | 178 | 2.18 | 0.79 to 6.02 | 0% |
| Low risk of bias in randomisation | 2 | 53 | 1.15 | 0.15 to 8.60 | 18% |
| Excluding high risk of other bias | 2 | 45 | 4.48 | 0.56 to 35.52 | 0% |
| Excluding high risk of reporting bias | 3 | 73 | 1.66 | 0.36 to 7.72 | 0% |
| Outcome or subgroup title | No. of studies | No. of participants | Statistical method | Effect size |
| 1 Primary outcome ‐ A. Mental state: Specific ‐ clinically significant response or improvement in negative symptoms (SANS, high=worse) ‐ short term (12 weeks) Show forest plot | 1 | 50 | Risk Ratio (M‐H, Random, 95% CI) | 3.17 [1.52, 6.58] |
| 2 Primary outcome ‐ B. Clinical global response: Clinically significant response or improvement in global status (CGI‐S, high=worse) ‐ short term (4 weeks) Show forest plot | 1 | 28 | Risk Ratio (M‐H, Random, 95% CI) | 0.99 [0.45, 2.20] |
| 3 Mental state: 1. General ‐ clinically significant response or improvement in general/overall symptoms as defined in each study ‐ short term (2‐12 weeks) Show forest plot | 2 | 58 | Risk Ratio (M‐H, Random, 95% CI) | 1.15 [0.64, 2.09] |
| 4 Mental state: 2a. General: Average general/overall symptoms score (various scales, high=worse) ‐ short term (2 ‐ 12 weeks) Show forest plot | 7 | Mean Difference (IV, Random, 95% CI) | Subtotals only | |
| 4.1 BPRS total | 1 | 23 | Mean Difference (IV, Random, 95% CI) | 1.5 [‐6.64, 9.64] |
| 4.2 PANSS general | 5 | 294 | Mean Difference (IV, Random, 95% CI) | ‐2.17 [‐3.93, ‐0.40] |
| 4.3 PANSS total | 4 | 308 | Mean Difference (IV, Random, 95% CI) | ‐2.84 [‐5.28, ‐0.40] |
| 5 Mental state: 2b. General: Average general/overall symptoms score (various scales, high=worse) ‐ medium term (13 ‐ 26 weeks) Show forest plot | 4 | Mean Difference (IV, Random, 95% CI) | Subtotals only | |
| 5.1 BPRS total | 1 | 26 | Mean Difference (IV, Random, 95% CI) | ‐1.4 [‐7.08, 4.28] |
| 5.2 PANSS general | 2 | 154 | Mean Difference (IV, Random, 95% CI) | ‐2.90 [‐7.57, 1.77] |
| 5.3 PANSS total | 3 | 219 | Mean Difference (IV, Random, 95% CI) | ‐3.67 [‐10.07, 2.72] |
| 6 Mental state: 3a. Specific: Average symptoms score (various scales, high=worse) ‐ short term (2 ‐ 12 weeks) Show forest plot | 10 | Mean Difference (IV, Random, 95% CI) | Subtotals only | |
| 6.1 mood (BPRS) | 1 | 23 | Mean Difference (IV, Random, 95% CI) | 0.2 [‐2.60, 3.00] |
| 6.2 mood (HRSD) | 3 | 114 | Mean Difference (IV, Random, 95% CI) | ‐2.37 [‐4.29, ‐0.45] |
| 6.3 negative (PANSS negative) | 6 | 359 | Mean Difference (IV, Random, 95% CI) | ‐0.99 [‐2.53, 0.56] |
| 6.4 negative (SANS) | 3 | 129 | Mean Difference (IV, Random, 95% CI) | ‐2.47 [‐6.22, 1.28] |
| 6.5 negative (SANS ‐ modified) | 1 | 23 | Mean Difference (IV, Random, 95% CI) | ‐5.70 [‐18.01, 6.61] |
| 6.6 positive (BPRS) | 1 | 23 | Mean Difference (IV, Random, 95% CI) | 1.60 [‐2.59, 5.79] |
| 6.7 positive (PANSS positive) | 5 | 294 | Mean Difference (IV, Random, 95% CI) | ‐0.16 [‐0.96, 0.63] |
| 6.8 positive (SAPS) | 3 | 129 | Mean Difference (IV, Random, 95% CI) | 0.73 [‐1.29, 2.74] |
| 7 Mental state: 3b. Specific: Average symptoms score (various scales, high=worse) ‐ medium term (13 ‐ 26 weeks) Show forest plot | 3 | Mean Difference (IV, Random, 95% CI) | Subtotals only | |
| 7.1 negative (PANSS negative) | 3 | 219 | Mean Difference (IV, Random, 95% CI) | ‐3.25 [‐4.04, ‐2.47] |
| 7.2 negative (SANS) | 1 | 47 | Mean Difference (IV, Random, 95% CI) | ‐7.12 [‐19.39, 5.15] |
| 7.3 positive (PANSS positive) | 2 | 154 | Mean Difference (IV, Random, 95% CI) | ‐0.14 [‐1.30, 1.02] |
| 8 Mental state: 4a. General and specific: Average score (various scales, high=worse) ‐ skewed results ‐ short term (2 ‐ 12 weeks) Show forest plot | Other data | No numeric data | ||
| 8.1 general ‐ overall symptoms (BPRS total) | Other data | No numeric data | ||
| 8.2 general ‐ overall symptoms (PANSS general) | Other data | No numeric data | ||
| 8.3 general ‐ overall symptoms (PANSS total) | Other data | No numeric data | ||
| 8.4 specific ‐ mood (BPRS anxiety/depression) | Other data | No numeric data | ||
| 8.5 specific ‐ mood (HRSD) | Other data | No numeric data | ||
| 8.6 specific ‐ negative symptoms (SANS) | Other data | No numeric data | ||
| 8.7 specific ‐ negative symptoms (PANSS negative) | Other data | No numeric data | ||
| 8.8 specific ‐ positive symptoms (BPRS positive) | Other data | No numeric data | ||
| 8.9 specific ‐ positive symptoms (PANSS positive) | Other data | No numeric data | ||
| 8.10 specific ‐ positive symptoms (SAPS) | Other data | No numeric data | ||
| 9 Mental state: 4b. General and specific: Average score (various scales, high=worse) ‐ skewed results ‐ medium term (13 ‐ 26 weeks) Show forest plot | Other data | No numeric data | ||
| 9.1 general ‐ overall symptoms (BPRS total) | Other data | No numeric data | ||
| 9.2 general ‐ overall symptoms (PANSS general) | Other data | No numeric data | ||
| 9.3 general ‐ overall symptoms (PANSS total) | Other data | No numeric data | ||
| 9.4 specific ‐ negative symptoms (PANSS negative) | Other data | No numeric data | ||
| 9.5 specific ‐ negative symptoms (SANS) | Other data | No numeric data | ||
| 9.6 specific ‐ positive symptoms (PANSS positive) | Other data | No numeric data | ||
| 10 Cognitive functioning: 1. General ‐ average composite cognitive functioning score (SMD) Show forest plot | 5 | Std. Mean Difference (Random, 95% CI) | Subtotals only | |
| 10.1 short term (2 ‐ 12 weeks) | 4 | 180 | Std. Mean Difference (Random, 95% CI) | 0.04 [‐0.28, 0.36] |
| 10.2 medium term (13 ‐ 26 weeks) | 1 | 26 | Std. Mean Difference (Random, 95% CI) | ‐0.66 [‐1.46, 0.13] |
| 11 Cognitive functioning: 2. Specific ‐ average individual scores (SMD) ‐ short term (2 ‐ 12 weeks) Show forest plot | 4 | Std. Mean Difference (Random, 95% CI) | Subtotals only | |
| 11.1 working memory | 2 | 53 | Std. Mean Difference (Random, 95% CI) | ‐0.11 [‐0.89, 0.67] |
| 11.2 reasoning/problem solving | 3 | 158 | Std. Mean Difference (Random, 95% CI) | 0.03 [‐0.28, 0.34] |
| 11.3 speed of processing | 4 | 177 | Std. Mean Difference (Random, 95% CI) | 0.08 [‐0.21, 0.38] |
| 11.4 attention | 3 | 161 | Std. Mean Difference (Random, 95% CI) | ‐0.01 [‐0.51, 0.48] |
| 11.5 verbal learning/memory | 4 | 181 | Std. Mean Difference (Random, 95% CI) | 0.01 [‐0.31, 0.32] |
| 11.6 visual learning/memory | 1 | 22 | Std. Mean Difference (Random, 95% CI) | ‐0.44 [‐1.29, 0.41] |
| 12 Quality of life: Average quality of life score (GQOLI‐74, high=better) ‐ short term (2 ‐ 12 weeks) Show forest plot | 1 | Mean Difference (IV, Random, 95% CI) | Subtotals only | |
| 12.1 general ‐ total | 1 | 114 | Mean Difference (IV, Random, 95% CI) | 9.36 [7.89, 10.83] |
| 12.2 specific ‐ well being ‐ material | 1 | 114 | Mean Difference (IV, Random, 95% CI) | 0.21 [‐2.34, 2.76] |
| 12.3 specific ‐ well being ‐ physical | 1 | 114 | Mean Difference (IV, Random, 95% CI) | 0.68 [‐1.35, 2.71] |
| 12.4 specific ‐ well being ‐ psychological | 1 | 114 | Mean Difference (IV, Random, 95% CI) | 10.0 [8.01, 11.99] |
| 12.5 specific ‐ well being ‐ social | 1 | 114 | Mean Difference (IV, Random, 95% CI) | 10.02 [8.03, 12.01] |
| 13 Clinical global response: 1a. Average clinical global status score (CGI‐S, high=worse) ‐ short term (2 ‐ 12 weeks) Show forest plot | 5 | 160 | Mean Difference (IV, Random, 95% CI) | ‐0.03 [‐0.35, 0.28] |
| 14 Clinical global response: 1b. Average clinical global status score (various scales, high=worse) ‐ short term (2 ‐ 12 weeks) ‐ skewed results Show forest plot | Other data | No numeric data | ||
| 14.1 CGI‐I | Other data | No numeric data | ||
| 14.2 CGI‐S | Other data | No numeric data | ||
| 15 Leaving the study early: 1a. Short term (2 ‐ 12 weeks) Show forest plot | 9 | Risk Ratio (M‐H, Random, 95% CI) | Subtotals only | |
| 15.1 any reason | 9 | 401 | Risk Ratio (M‐H, Random, 95% CI) | 0.94 [0.63, 1.39] |
| 15.2 due to adverse effects | 4 | 178 | Risk Ratio (M‐H, Random, 95% CI) | 2.08 [0.70, 6.21] |
| 15.3 due to psychiatric symptoms | 3 | 183 | Risk Ratio (M‐H, Random, 95% CI) | 0.97 [0.44, 2.13] |
| 16 Leaving the study early: 1b. Medium term (13 ‐ 26 weeks) Show forest plot | 3 | Risk Ratio (M‐H, Random, 95% CI) | Subtotals only | |
| 16.1 any reason | 3 | 169 | Risk Ratio (M‐H, Random, 95% CI) | 0.92 [0.52, 1.62] |
| 16.2 due to adverse effects | 1 | 33 | Risk Ratio (M‐H, Random, 95% CI) | 1.47 [0.31, 6.95] |
| 16.3 due to psychiatric symptoms | 1 | 49 | Risk Ratio (M‐H, Random, 95% CI) | 4.44 [0.22, 88.04] |
| 17 Adverse effects: 1. General ‐ short term (binary, 2 ‐ 12 weeks) Show forest plot | 5 | Risk Ratio (M‐H, Random, 95% CI) | Subtotals only | |
| 17.1 any | 3 | 199 | Risk Ratio (M‐H, Random, 95% CI) | 3.49 [0.14, 90.29] |
| 17.2 serious | 3 | 271 | Risk Ratio (M‐H, Random, 95% CI) | 2.95 [0.47, 18.36] |
| 18 Adverse effects: 2a.i. Specific ‐ short term (binary, 2 ‐ 12 weeks) Show forest plot | 7 | Risk Ratio (M‐H, Random, 95% CI) | Subtotals only | |
| 18.1 anticholinergic ‐ constipation | 2 | 146 | Risk Ratio (M‐H, Random, 95% CI) | 0.74 [0.24, 2.29] |
| 18.2 anticholinergic ‐ dry mouth | 3 | 176 | Risk Ratio (M‐H, Random, 95% CI) | 3.46 [1.40, 8.53] |
| 18.3 anticholinergic ‐ impotence | 1 | 30 | Risk Ratio (M‐H, Random, 95% CI) | 3.0 [0.13, 68.26] |
| 18.4 cardiovascular ‐ tachycardia | 1 | 114 | Risk Ratio (M‐H, Random, 95% CI) | 3.33 [0.97, 11.48] |
| 18.5 central nervious system ‐ anorexia | 1 | 32 | Risk Ratio (M‐H, Random, 95% CI) | 0.14 [0.01, 2.56] |
| 18.6 central nervous system ‐ dizziness | 3 | 176 | Risk Ratio (M‐H, Random, 95% CI) | 1.52 [0.54, 4.31] |
| 18.7 central nervous system ‐ fatigue | 2 | 62 | Risk Ratio (M‐H, Random, 95% CI) | 1.00 [0.12, 8.60] |
| 18.8 central nervous system ‐ headache | 1 | 121 | Risk Ratio (M‐H, Random, 95% CI) | 1.23 [0.52, 2.90] |
| 18.9 central nervous system ‐ insomnia | 2 | 146 | Risk Ratio (M‐H, Random, 95% CI) | 4.79 [0.85, 26.84] |
| 18.10 central nervous system ‐ sedation | 2 | 58 | Risk Ratio (M‐H, Random, 95% CI) | 0.74 [0.28, 1.94] |
| 18.11 extrapyramidal ‐ acute dystonia | 1 | 30 | Risk Ratio (M‐H, Random, 95% CI) | 1.0 [0.07, 14.55] |
| 18.12 extrapyramidal ‐ akathisia | 3 | 88 | Risk Ratio (M‐H, Random, 95% CI) | 0.87 [0.25, 3.09] |
| 18.13 extrapyramidal ‐ hypersalivation | 1 | 30 | Risk Ratio (M‐H, Random, 95% CI) | 0.33 [0.01, 7.58] |
| 18.14 extrapyramidal ‐ parkinsonism | 1 | 30 | Risk Ratio (M‐H, Random, 95% CI) | 1.8 [0.79, 4.11] |
| 18.15 extrapyramidal ‐ tremor | 1 | 32 | Risk Ratio (M‐H, Random, 95% CI) | 1.0 [0.24, 4.23] |
| 18.16 extrapyramidal ‐ stiffness | 1 | 32 | Risk Ratio (M‐H, Random, 95% CI) | 0.2 [0.03, 1.53] |
| 18.17 extrapyramidal ‐ use of antiparkinson medication | 3 | 135 | Risk Ratio (M‐H, Random, 95% CI) | 0.80 [0.44, 1.45] |
| 18.18 gastrointestinal ‐ abdominal pain | 1 | 32 | Risk Ratio (M‐H, Random, 95% CI) | 1.5 [0.29, 7.81] |
| 18.19 gastrointestinal ‐ nausea | 3 | 176 | Risk Ratio (M‐H, Random, 95% CI) | 0.49 [0.10, 2.41] |
| 18.20 gastrointestinal ‐ vomiting | 1 | 32 | Risk Ratio (M‐H, Random, 95% CI) | 0.2 [0.01, 3.86] |
| 18.21 gastrointestinal ‐ diarrhoea | 1 | 32 | Risk Ratio (M‐H, Random, 95% CI) | 0.2 [0.01, 3.86] |
| 18.22 immune system ‐ rash | 1 | 30 | Risk Ratio (M‐H, Random, 95% CI) | 3.0 [0.13, 68.26] |
| 18.23 immune system ‐ sore throat | 1 | 32 | Risk Ratio (M‐H, Random, 95% CI) | 0.2 [0.01, 3.86] |
| 18.24 metabolic ‐ weight loss | 1 | 32 | Risk Ratio (M‐H, Random, 95% CI) | 0.33 [0.04, 2.87] |
| 18.25 metabolic ‐ significant weight gain | 2 | 85 | Risk Ratio (M‐H, Random, 95% CI) | 0.38 [0.20, 0.73] |
| 19 Adverse effects: 2a.ii. Specific ‐ extrapyramidal ‐ average change score (continuous, various scales, high=worse) ‐ short term (2 ‐ 12 weeks) Show forest plot | 2 | Mean Difference (IV, Random, 95% CI) | Subtotals only | |
| 19.1 AIMS | 1 | 26 | Mean Difference (IV, Random, 95% CI) | 0.3 [‐2.34, 2.94] |
| 19.2 BAS | 1 | 59 | Mean Difference (IV, Random, 95% CI) | ‐0.18 [‐0.65, 0.29] |
| 19.3 SAS | 2 | 85 | Mean Difference (IV, Random, 95% CI) | ‐0.27 [‐1.79, 1.25] |
| 20 Adverse effects: 2a.iii. Specific ‐ extrapyramidal ‐ average change score (continuous, various scales, high=worse) ‐ short term (2 ‐ 12 weeks) ‐ skewed results Show forest plot | Other data | No numeric data | ||
| 20.1 AIMS | Other data | No numeric data | ||
| 20.2 SAS | Other data | No numeric data | ||
| 21 Adverse effects: 2b.i. Specific ‐ medium term (binary, 13 ‐ 26 weeks) Show forest plot | 2 | Risk Ratio (M‐H, Random, 95% CI) | Subtotals only | |
| 21.1 anticholinergic ‐ constipation | 1 | 107 | Risk Ratio (M‐H, Random, 95% CI) | 4.58 [1.04, 20.23] |
| 21.2 anticholinergic ‐ dry mouth | 1 | 107 | Risk Ratio (M‐H, Random, 95% CI) | 1.53 [0.27, 8.78] |
| 21.3 anticholinergic ‐ sweating | 1 | 107 | Risk Ratio (M‐H, Random, 95% CI) | 13.24 [0.76, 229.32] |
| 21.4 cardiovascular ‐ QT prolongation | 1 | 37 | Risk Ratio (M‐H, Random, 95% CI) | 3.4 [0.42, 27.59] |
| 21.5 cardiovascular ‐ tachycardia | 1 | 107 | Risk Ratio (M‐H, Random, 95% CI) | 1.78 [0.55, 5.74] |
| 21.6 central nervous system ‐ dizziness | 1 | 107 | Risk Ratio (M‐H, Random, 95% CI) | 1.36 [0.32, 5.78] |
| 21.7 central nervous system ‐ insomnia | 1 | 107 | Risk Ratio (M‐H, Random, 95% CI) | 13.24 [0.76, 229.32] |
| 21.8 extrapyramidal ‐ tremor | 1 | 37 | Risk Ratio (M‐H, Random, 95% CI) | 0.43 [0.20, 0.89] |
| 21.9 gastrointestinal ‐ nausea | 1 | 107 | Risk Ratio (M‐H, Random, 95% CI) | 5.09 [0.62, 42.16] |
| 22 Adverse effects: 2a.iv. Specific ‐ metabolic ‐ average weight gain (continuous, increase in kg) Show forest plot | 4 | Mean Difference (IV, Random, 95% CI) | Subtotals only | |
| 22.1 short term (2 ‐ 12 weeks) | 3 | 186 | Mean Difference (IV, Random, 95% CI) | ‐2.17 [‐3.19, ‐1.15] |
| 22.2 medium term (13 ‐ 26 weeks) | 2 | 133 | Mean Difference (IV, Random, 95% CI) | ‐3.12 [‐10.67, 4.42] |
| 23 Social or general functioning: Average social functioning score (various subscales) ‐ short‐term (2 ‐ 12 weeks) Show forest plot | 2 | Mean Difference (IV, Random, 95% CI) | Subtotals only | |
| 23.1 activity ‐ activities (inverted SLOF, high=worse) | 1 | 15 | Mean Difference (IV, Random, 95% CI) | 0.0 [‐3.30, 3.30] |
| 23.2 activity ‐ hospital activity (SSPI, high=worse) | 1 | 114 | Mean Difference (IV, Random, 95% CI) | ‐0.03 [‐0.17, 0.11] |
| 23.3 activity ‐ disease indoor activity (SSPI, high=worse) | 1 | 114 | Mean Difference (IV, Random, 95% CI) | ‐0.14 [‐0.28, ‐0.00] |
| 23.4 activity ‐ physical functioning (inverted SLOF, high=worse) | 1 | 15 | Mean Difference (IV, Random, 95% CI) | ‐0.3 [‐1.12, 0.52] |
| 23.5 personal care ‐ personal care skills (inverted SLOF, high=worse) | 1 | 15 | Mean Difference (IV, Random, 95% CI) | ‐0.20 [‐1.43, 1.03] |
| 23.6 personal care ‐ self‐care (SSPI, high=worse) | 1 | 114 | Mean Difference (IV, Random, 95% CI) | ‐0.03 [‐0.22, 0.16] |
| 23.7 personal care ‐ social acceptability (inverted SLOF, high=worse) | 1 | 15 | Mean Difference (IV, Random, 95% CI) | 0.1 [‐0.72, 0.92] |
| 23.8 relationships ‐ family role (SSPI, high=worse) | 1 | 114 | Mean Difference (IV, Random, 95% CI) | ‐0.09 [‐0.23, 0.05] |
| 23.9 relationships ‐ interest and concern in the external environment (SSPI, high=worse) | 1 | 114 | Mean Difference (IV, Random, 95% CI) | ‐0.19 [‐0.37, ‐0.01] |
| 23.10 relationships ‐ interpersonal relationships (inverted SLOF, high=worse) | 1 | 15 | Mean Difference (IV, Random, 95% CI) | ‐1.20 [‐5.41, 3.01] |
| 23.11 relationships ‐ relationships and caring for others (SSPI, high=worse) | 1 | 114 | Mean Difference (IV, Random, 95% CI) | ‐0.09 [‐0.24, 0.06] |
| 23.12 relationships ‐ sexual role (SSPI, high=worse) | 1 | 114 | Mean Difference (IV, Random, 95% CI) | ‐0.03 [‐0.21, 0.15] |
| 23.13 relationships ‐ social withdrawal (SSPI, high=worse) | 1 | 114 | Mean Difference (IV, Random, 95% CI) | ‐0.32 [‐0.49, ‐0.15] |
| 23.14 work ‐ professional skills (SSPI, high=worse) | 1 | 114 | Mean Difference (IV, Random, 95% CI) | ‐0.19 [‐0.34, ‐0.04] |
| 23.15 work ‐ responsibility and planning (SSPI, high=worse) | 1 | 114 | Mean Difference (IV, Random, 95% CI) | ‐0.03 [‐0.21, 0.15] |
| 23.16 work ‐ work skills (inverted SLOF, high=worse) | 1 | 15 | Mean Difference (IV, Random, 95% CI) | ‐3.0 [‐5.48, ‐0.52] |
| Outcome or subgroup title | No. of studies | No. of participants | Statistical method | Effect size |
| 1 Mental state: 1a. General: Average general/overall symptoms score (PANSS general, high=worse) ‐ short term (2 ‐ 12 weeks) Show forest plot | 1 | 35 | Mean Difference (IV, Random, 95% CI) | 2.90 [‐2.85, 8.65] |
| 2 Mental state: 1b. General: Average general/overall symptoms score (various scales, high=worse) ‐ medium term (13 ‐ 26 weeks) Show forest plot | 1 | Mean Difference (IV, Random, 95% CI) | Subtotals only | |
| 2.1 PANSS total | 1 | 41 | Mean Difference (IV, Random, 95% CI) | 1.62 [‐6.89, 10.13] |
| 2.2 PANSS general | 1 | 41 | Mean Difference (IV, Random, 95% CI) | 0.62 [‐2.00, 5.24] |
| 3 Mental state: 2a. Specific: Average symptoms score (various scales, high=worse) ‐ short term (2 ‐ 12 weeks) Show forest plot | 1 | Mean Difference (IV, Fixed, 95% CI) | Subtotals only | |
| 3.1 mood (HRSD) | 1 | 35 | Mean Difference (IV, Fixed, 95% CI) | 3.00 [‐1.24, 7.24] |
| 3.2 negative (PANSS negative) | 1 | 35 | Mean Difference (IV, Fixed, 95% CI) | 1.5 [‐4.34, 7.34] |
| 3.3 positive (PANSS positive) | 1 | 35 | Mean Difference (IV, Fixed, 95% CI) | 1.7 [‐1.52, 4.92] |
| 4 Mental state: 2b. Specific: Average symptoms score (various scales, high=worse) ‐ medium term (13 ‐ 26 weeks) Show forest plot | 1 | Mean Difference (IV, Random, 95% CI) | Subtotals only | |
| 4.1 negative (PANSS negative) | 1 | 41 | Mean Difference (IV, Random, 95% CI) | 0.26 [‐3.66, 4.18] |
| 4.2 negative (SANS) | 1 | 41 | Mean Difference (IV, Random, 95% CI) | ‐0.27 [‐12.69, 12.15] |
| 4.3 positive (PANSS positive) | 1 | 41 | Mean Difference (IV, Random, 95% CI) | 0.74 [‐1.86, 3.34] |
| 5 Mental state: 3a. General and specific: Average score (various scales, high=worse) ‐ skewed results ‐ short term (2 ‐ 12 weeks) Show forest plot | Other data | No numeric data | ||
| 5.1 general ‐ overall symptoms (PANSS general) | Other data | No numeric data | ||
| 5.2 specific ‐ mood (HRSD) | Other data | No numeric data | ||
| 5.3 specific ‐ negative symptoms (PANSS negative) | Other data | No numeric data | ||
| 5.4 specific ‐ positive symptoms (PANSS positive) | Other data | No numeric data | ||
| 6 Mental state: 3b. General and specific: Average score (various scales, high=worse) ‐ skewed results ‐ medium term (13 ‐ 26 weeks) Show forest plot | Other data | No numeric data | ||
| 6.1 general ‐ overall symptoms (PANSS general) | Other data | No numeric data | ||
| 6.2 general ‐ overall symptoms (PANSS total) | Other data | No numeric data | ||
| 6.3 specific ‐ negative symptoms (PANSS negative) | Other data | No numeric data | ||
| 6.4 specific ‐ negative symptoms (SANS) | Other data | No numeric data | ||
| 6.5 specific ‐ positive symptoms (PANSS positive) | Other data | No numeric data | ||
| 7 Clinical global response: Average clinical global status score (CGI‐S, high=worse) ‐ short term (2 ‐ 12 weeks) Show forest plot | 1 | 35 | Mean Difference (IV, Random, 95% CI) | 0.0 [‐0.89, 0.89] |
| 8 Leaving the study early: 1a. Short term (2 ‐ 12 weeks) Show forest plot | 1 | Risk Ratio (M‐H, Random, 95% CI) | Subtotals only | |
| 8.1 any reason | 1 | 35 | Risk Ratio (M‐H, Random, 95% CI) | 0.63 [0.17, 2.41] |
| 9 Leaving the study early: 1b. Medium term (13 ‐ 26 weeks) Show forest plot | 1 | Risk Ratio (M‐H, Random, 95% CI) | Subtotals only | |
| 9.1 any reason | 1 | 57 | Risk Ratio (M‐H, Random, 95% CI) | 1.13 [0.48, 2.67] |
| 9.2 due to psychiatric symptoms | 1 | 49 | Risk Ratio (M‐H, Random, 95% CI) | 1.77 [0.17, 18.26] |