Не‐фармакологические вмешательства для предотвращения потери работы трудящимися с воспалительным артритом
Información
- DOI:
- https://doi.org/10.1002/14651858.CD010208.pub2Copiar DOI

- Base de datos:
-
- Cochrane Database of Systematic Reviews
- Versión publicada:
-
- 06 noviembre 2014see what's new
- Tipo:
-
- Intervention
- Etapa:
-
- Review
- Grupo Editorial Cochrane:
-
Grupo Cochrane de Salud laboral
- Copyright:
-
- Copyright © 2014 The Cochrane Collaboration. Published by John Wiley & Sons, Ltd.
Cifras del artículo
Altmetric:
Citado por:
Autores
Contributions of authors
In pairs, JH performed study selection with another review author (DL, DU, TH, JS and MF). Similarly, JH and either JS or MF performed the risk of bias assessment and data extraction. JH performed data‐analysis and the GRADE assessment following instructions from Jos Verbeek. JH wrote the draft of the review. Comments and suggestions on draft and final versions of the review were provided, in order of contribution, by DL, DU, TH, JS and MF. JH is the guarantor of this review.
Sources of support
Internal sources
-
Academic Medical Center, Coronel Institute of Occupational Health, Amsterdam, Netherlands.
External sources
-
Instituut GAK, Netherlands.
Salary support for this review (JH, MF) was made possible by a grant from Instituut Gak and is part of the research program "Pathways to work" (www.verbeteronderzoek.nl). The funding agency had no role in study design, data collection and analysis, decision to publish, or preparation of the manuscript.
Declarations of interest
Jan Hoving: None known
Diane Lacaille: Prof Lacaille has been awarded a grant by the Canadian Institute of Health Research (CIHR) to evaluate an intervention to improve at work productivity and prevent work disability in people with inflammatory arthritis.
Donna Urquhart: None known.
Timo Hannu: Dr. Timo Hannu owns 150 shares (share class B) of Orion Corporation, a European pharmaceuticals and diagnostics company. In 2011, he received an honorarium of GBP 200 for writing a review titled "Reactive arthritis", which was published in the journal Best Practice & Research Clinical Rheumatology.
Judith Sluiter: None known.
Monique Frings‐Dresen: None known.
Acknowledgements
We thank Saralynn Allaire for participating in study selection and commenting on drafts of the review text. We thank Jani Ruotsalainen and Jos Verbeek for providing expert advice on Cochrane procedures during all phases of the Cochrane Review, for writing the plain language summary and for editing the text. We thank Leena Isotalo for designing and performing the electronic database searches and Deirdre Walshe and Jani Ruotsalainen for copy editing the text.
Version history
| Published | Title | Stage | Authors | Version |
| 2014 Nov 06 | Non‐pharmacological interventions for preventing job loss in workers with inflammatory arthritis | Review | Jan L Hoving, Diane Lacaille, Donna M Urquhart, Timo J Hannu, Judith K Sluiter, Monique HW Frings‐Dresen | |
| 2012 Nov 14 | Non‐pharmacological interventions for improving work participation in patients with inflammatory arthritis | Protocol | Jan L Hoving, Donna M Urquhart, Timo J Hannu, Saralynn H Allaire, Diane Lacaille, Judith K Sluiter, Monique HW Frings‐Dresen | |
Differences between protocol and review
We changed the review title from "Non‐pharmacological interventions for improving work participation in patients with inflammatory arthritis" to "Non‐pharmacological interventions for preventing job loss in workers with inflammatory arthritis" as the latter title better represents what the review is about. We did not report funding sources of studies. During the study selection phase we specified that at least half of all participants had to have IA.
Keywords
MeSH
Medical Subject Headings (MeSH) Keywords
Medical Subject Headings Check Words
Adult; Humans; Middle Aged;
PICO
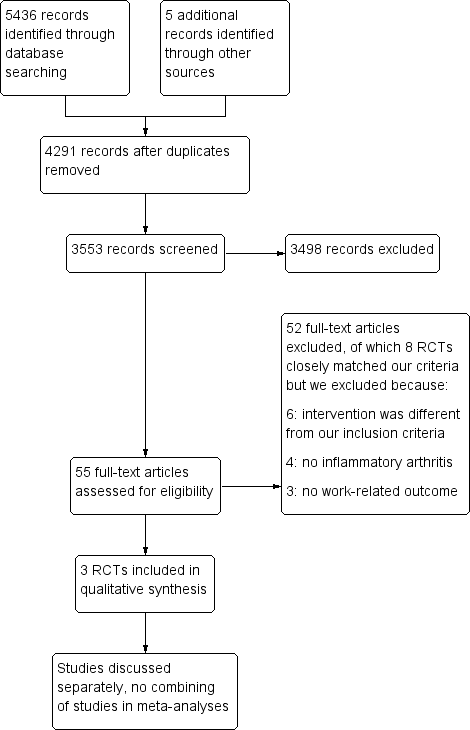
Study flow diagram.
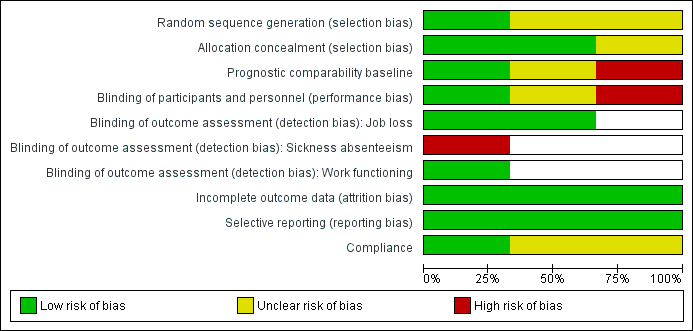
Risk of bias graph: review authors' judgements about each risk of bias item presented as percentages across all included trials.
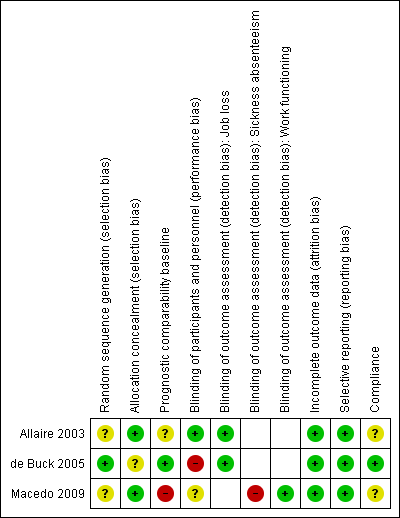
Risk of bias summary: review authors' judgements about each risk of bias item for each included trial.
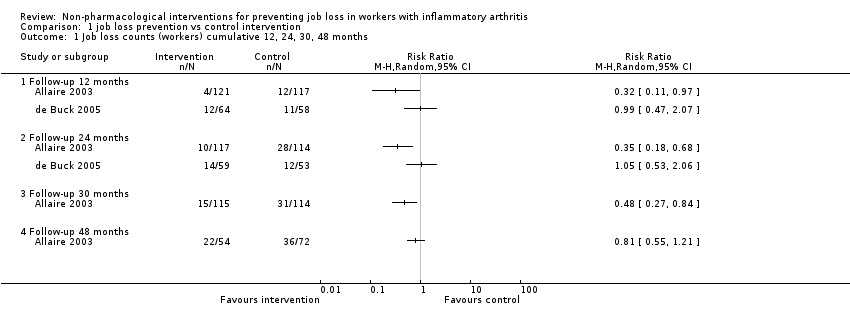
Comparison 1 job loss prevention vs control intervention, Outcome 1 Job loss counts (workers) cumulative 12, 24, 30, 48 months.
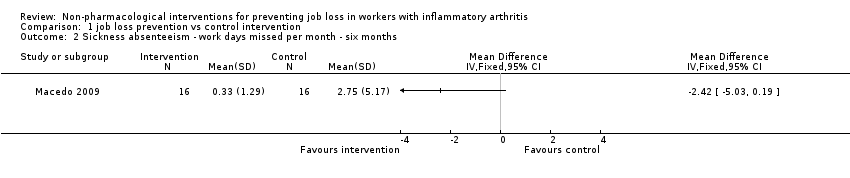
Comparison 1 job loss prevention vs control intervention, Outcome 2 Sickness absenteeism ‐ work days missed per month ‐ six months.
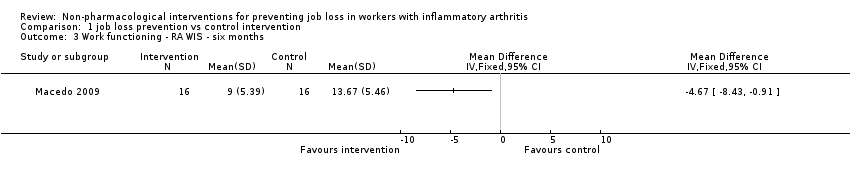
Comparison 1 job loss prevention vs control intervention, Outcome 3 Work functioning ‐ RA WIS ‐ six months.
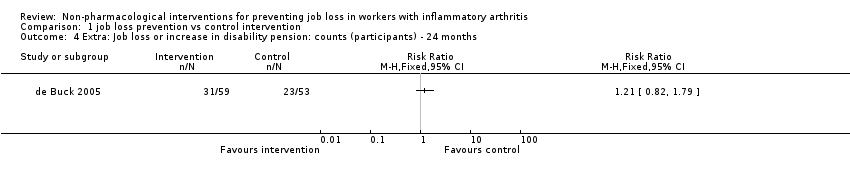
Comparison 1 job loss prevention vs control intervention, Outcome 4 Extra: Job loss or increase in disability pension: counts (participants) ‐ 24 months.
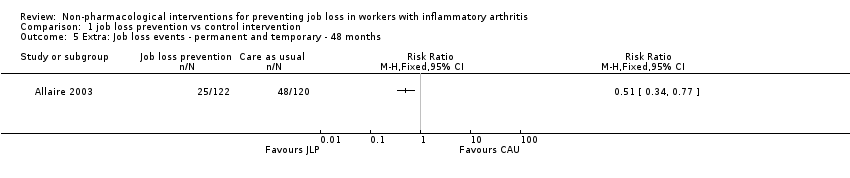
Comparison 1 job loss prevention vs control intervention, Outcome 5 Extra: Job loss events ‐ permanent and temporary ‐ 48 months.
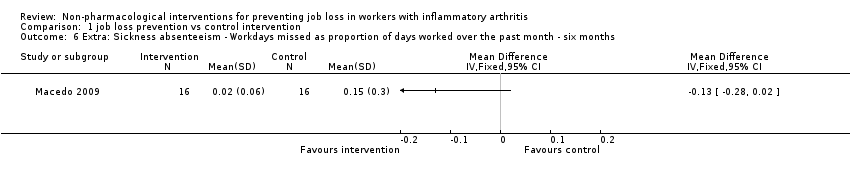
Comparison 1 job loss prevention vs control intervention, Outcome 6 Extra: Sickness absenteeism ‐ Workdays missed as proportion of days worked over the past month ‐ six months.
| Job loss prevention compared to control intervention in people with IA | ||||||
| Patient or population: people with IA | ||||||
| Outcomes | Illustrative comparative risks* (95% CI) | Relative effect | No of participants | Quality of the evidence | Comments | |
| Assumed risk | Corresponding risk | |||||
| Control intervention 7 | Job loss prevention | |||||
| Job loss | See comment | See comment | Not estimable | 340 | ⊕⊝⊝⊝ | Due to inconsistency in the trials we did not pool these two trials |
| Sickness absenteeism | The mean sickness absenteeism in the control groups was | The mean sickness absenteeism in the intervention groups was | ‐ | 32 | ⊕⊝⊝⊝ | ‐ |
| Work functioning | The mean work functioning in the control groups was | The mean work functioning in the intervention groups was | ‐ | 32 | ⊕⊝⊝⊝ | ‐ |
| *The basis for the assumed risk (e.g. the median control group risk across studies) is provided in footnotes. The corresponding risk (and its 95% CI) is based on the assumed risk in the comparison group and the relative effect of the intervention (and its 95% CI). | ||||||
| GRADE Working Group grades of evidence | ||||||
| 1 We judged the RCTs by de Buck 2005 and Macedo 2009 to have an overall high risk of bias and the RCT by Allaire 2003 to have an overall low risk of bias. Overall, we judged serious risk of bias to be present and therefore we downgraded the quality of the evidence by one level (‐1). 7 All control groups received either usual care or a minimal intervention such as written information in Allaire 2003. | ||||||
| Outcome measures | Follow‐up times | Trials | Extra analyses |
| Combined job loss or increase of disability pension | 24 months | ||
| Job loss events | 48 months | ||
| Sickness absenteeism defined as workdays missed in proportion to days worked | |||
| In this table we present other supporting job loss outcome data reported in the trials for informative purposes only. These data do not contribute to our conclusions. | |||
| Outcome or subgroup title | No. of studies | No. of participants | Statistical method | Effect size |
| 1 Job loss counts (workers) cumulative 12, 24, 30, 48 months Show forest plot | 2 | Risk Ratio (M‐H, Random, 95% CI) | Totals not selected | |
| 1.1 Follow‐up 12 months | 2 | Risk Ratio (M‐H, Random, 95% CI) | 0.0 [0.0, 0.0] | |
| 1.2 Follow‐up 24 months | 2 | Risk Ratio (M‐H, Random, 95% CI) | 0.0 [0.0, 0.0] | |
| 1.3 Follow‐up 30 months | 1 | Risk Ratio (M‐H, Random, 95% CI) | 0.0 [0.0, 0.0] | |
| 1.4 Follow‐up 48 months | 1 | Risk Ratio (M‐H, Random, 95% CI) | 0.0 [0.0, 0.0] | |
| 2 Sickness absenteeism ‐ work days missed per month ‐ six months Show forest plot | 1 | Mean Difference (IV, Fixed, 95% CI) | Totals not selected | |
| 3 Work functioning ‐ RA WIS ‐ six months Show forest plot | 1 | Mean Difference (IV, Fixed, 95% CI) | Totals not selected | |
| 4 Extra: Job loss or increase in disability pension: counts (participants) ‐ 24 months Show forest plot | 1 | Risk Ratio (M‐H, Fixed, 95% CI) | Totals not selected | |
| 5 Extra: Job loss events ‐ permanent and temporary ‐ 48 months Show forest plot | 1 | Risk Ratio (M‐H, Fixed, 95% CI) | Totals not selected | |
| 6 Extra: Sickness absenteeism ‐ Workdays missed as proportion of days worked over the past month ‐ six months Show forest plot | 1 | Mean Difference (IV, Fixed, 95% CI) | Totals not selected | |