| Study | Exercise components | n | Meets Rock et al guidelines? | Adherence summary | At least 75% adherence? | High risk of bias? | Change in AET reported? | Adverse effects |
| Cadmus 2009 | Aerobic | 37, 38 (intervention vs control) | 33% reported 150 minutes/wk of moderate intensity aerobic exercise at an average of 76% HR, for six months | 75% of women were doing between 90 and 119 minutes of moderate intensity aerobic activity per week at six months | Yes; for up to 119 minutes per week | No | No | Five of the 37 women randomly assigned to exercise experienced an adverse effect; two were related to the study (plantar fasciitis) |
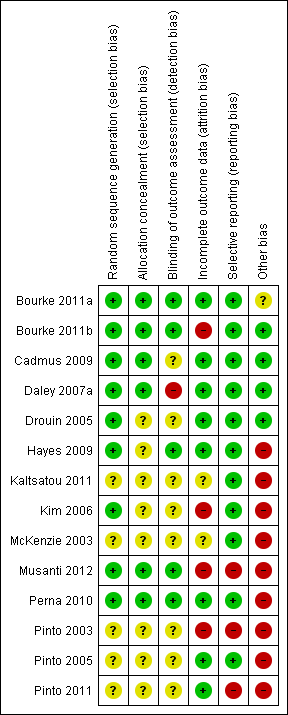
| Daley 2007a | Aerobic | 34, 36, 38 (intervention, sham, control, respectively) | No | 77% of the exercise therapy; attended 70% (at least 17 of 24 sessions) or more of sessions | Unclear | Yes; outcome assessors were not blinded to participants’ group allocation | Yes | Three withdrawals in the intervention group: unclear as to why this occurred. Some withdrawals because of medical complications in placebo and control arms but unclear whether study related |
| Drouin 2005 | Aerobic | 13 intervention, 8 placebo stretching controls | Unclear | Participants in the intervention group averaged 3.6 days per week of aerobic exercise over an 8‐week period | Unclear | No | Yes | None reported |
| Kaltsatou 2011 | Aerobic | 14, 13 (intervention vs control) | Unclear | Not reported | Not reported | Yes; method of measuring exercise and adherence not reported | No | None reported |
| Kim 2006 | Aerobic | 22,19 (intervention vs control). | No | Average weekly frequency of exercise was 2.4 ± 0.6 sessions, and average duration of exercise within prescribed target HR was 27.8 ± 8.1 minutes per session. Overall adherence was 78.3% ± 20.1% | Yes | Yes; data missing for 45% of the cohort | Yes | Reasons for withdrawal included personal problems (n = 2), problems at home (n = 2), problems related to chemotherapy (n = 3), thrombophlebitis in the lower leg (n = 2), non-exercise‐related injuries (n = 1), and death (n = 1). Unclear to which arm of the trial these date relate |
| Pinto 2003 | Aerobic | 12, 12 (intervention vs control) | Unclear | Participants attended a mean of 88% of the 36‐session supervised exercise programme | Yes | Yes; 38% lost to follow‐up. Exercise tolerance test was performed but no control group comparison data were reported | Yes | None reported; however, it is unclear why the six controls dropped out |
| Pinto 2005 | Aerobic | 43, 43 (intervention vs control) | Unclear | At week 12, intervention participants reported a mean of 128.53 minutes/wk of moderate intensity exercise. However, no changes were reported in the accelerometer data in the intervention group (change score = ‐0.33 kcal/h) | Less than 75% of the intervention group was meeting the prescribed goal after week 4 | Yes; significantly more control group participants were receiving hormone treatment. Accelerometer data do not support the self‐reported physical activity behaviour | Yes | Not clear whether chest pain was related to exercise in dropout whose participation was terminated |
| Pinto 2011 | Aerobic | 20, 26 (intervention vs control) | Three‐day PAR questionnaire indicates that 64.7% of the intervention group and 40.9% of the control group were achieving the guidelines at three months | Correlation between self‐reported moderate intensity exercise and accelerometer data at three‐month follow‐up, when the only significant between‐group change is reported: r = 0.32 | No | Yes; accelerometer data were not reported; also, cited correlation is weak (0.32). Further, substantial contamination was noted in the control group | Yes | One cancer recurrence in the control group at three months |
| Bourke 2011a | Aerobic and resistance | 9, 9 (intervention vs control) | Six weeks of resistance exercise twice a week | 90% attendance at the supervised sessions. 94% of independent exercise sessions were completed | Yes | No | Yes | One stroke in the intervention group, unrelated to the exercise programme |
| Bourke 2011b | Aerobic and resistance | 25, 25 (intervention vs control) | Six weeks of resistance exercise twice a week | 95% attendance at supervised exercise sessions. Compliance with self‐directed exercise aspect of the lifestyle intervention was 87% | Yes | Yes; high dropout rate at postintervention six‐month follow‐up assessment | Yes | Two men in the intervention arm were discontinued because of cardiac complications before the 12‐week assessments. Two more reported musculoskeletal complaints before the six‐month assessment. Five men reported various health problems in the control group that prohibited them from attending the six‐month assessment |
| Hayes 2009 | Aerobic and resistance | 16, 16 (intervention vs control) | Unclear | Most women (88%) allocated to the intervention group participated in 70% or more of scheduled supervised exercise sessions | Unclear | Yes; adherence data on unsupervised aspect of the intervention are not clear | No | None reported |
| McKenzie 2003 | Aerobic and resistance | 7,7 (intervention vs control) | No | Unclear | Unclear | Yes; adherence to exercise not reported | No | None reported |
| Musanti 2012 | Aerobic and resistance | Flexibility group (n = 13), aerobic group (n = 12), resistance group (n = 17), aerobic and resistance group (n = 13) | 12 weeks of resistance exercise two or three times per week | Mean percentages of adherence were as follows: flexibility = 85%, aerobic = 81%, resistance = 91% and aerobic plus resistance = 86% | Unclear | Yes; a significant number of dropouts belonged to the resistance exercise group (n = 8/13). Only 50% of activity logs were returned | Yes | Adverse effects were reported in two women during the study. In both cases, the women developed tendonitis: one in the shoulder and the other in the foot. Both had a history of tendonitis, and both received standard treatment |
| Perna 2010 | Aerobic and resistance | 51 participants in total. Numbers randomly assigned to each arm are unclear | Three months of resistance exercise three times per week | Women assigned to the structured intervention completed an average of 83% of their scheduled hospital‐based exercise sessions (only 4 weeks in duration), and 76.9% completed all 12 sessions. Home‐based component (8 weeks in duration) | Unclear | Yes; numbers randomly assigned to intervention and control groups are unclear, as are numbers completing in each arm | No | Unclear |