Scolaris Content Display Scolaris Content Display

Flow diagram of the trial selection process.
Figuras y tablas -
Figure 1

Flow diagram of the trial selection process.

Risk of bias graph: review authors' judgements about each risk of bias item presented as percentages across all included trials.
Figuras y tablas -
Figure 2

Risk of bias graph: review authors' judgements about each risk of bias item presented as percentages across all included trials.

Risk of bias summary: review authors' judgements about each risk of bias item for each included trial.
Figuras y tablas -
Figure 3

Risk of bias summary: review authors' judgements about each risk of bias item for each included trial.

Forest plot of comparison: 2 Hydrocolloid dressings compared with alginate dressings, outcome: 2.1 Proportion of ulcers healed at 6 and 12 weeks.
Figuras y tablas -
Figure 4

Forest plot of comparison: 2 Hydrocolloid dressings compared with alginate dressings, outcome: 2.1 Proportion of ulcers healed at 6 and 12 weeks.

Comparison 1 Tegagen HG alginate dressing compared with Sorbsan alginate dressing, Outcome 1 Proportion of ulcers healed at 6 weeks.
Figuras y tablas -
Analysis 1.1

Comparison 1 Tegagen HG alginate dressing compared with Sorbsan alginate dressing, Outcome 1 Proportion of ulcers healed at 6 weeks.

Comparison 1 Tegagen HG alginate dressing compared with Sorbsan alginate dressing, Outcome 2 Score for comfort of dressing during wear time at 6 weeks.
Figuras y tablas -
Analysis 1.2

Comparison 1 Tegagen HG alginate dressing compared with Sorbsan alginate dressing, Outcome 2 Score for comfort of dressing during wear time at 6 weeks.

Comparison 1 Tegagen HG alginate dressing compared with Sorbsan alginate dressing, Outcome 3 Score for comfort during dressing removal at 6 weeks.
Figuras y tablas -
Analysis 1.3

Comparison 1 Tegagen HG alginate dressing compared with Sorbsan alginate dressing, Outcome 3 Score for comfort during dressing removal at 6 weeks.

Comparison 1 Tegagen HG alginate dressing compared with Sorbsan alginate dressing, Outcome 4 Exudate absorption score at 6 weeks.
Figuras y tablas -
Analysis 1.4

Comparison 1 Tegagen HG alginate dressing compared with Sorbsan alginate dressing, Outcome 4 Exudate absorption score at 6 weeks.

Comparison 1 Tegagen HG alginate dressing compared with Sorbsan alginate dressing, Outcome 5 Ease of dressing removal score at 6 weeks.
Figuras y tablas -
Analysis 1.5

Comparison 1 Tegagen HG alginate dressing compared with Sorbsan alginate dressing, Outcome 5 Ease of dressing removal score at 6 weeks.

Comparison 2 Hydrocolloid dressings compared with alginate dressings, Outcome 1 Proportion of ulcers healed at 6 and 12 weeks.
Figuras y tablas -
Analysis 2.1

Comparison 2 Hydrocolloid dressings compared with alginate dressings, Outcome 1 Proportion of ulcers healed at 6 and 12 weeks.

Comparison 2 Hydrocolloid dressings compared with alginate dressings, Outcome 2 Change in ulcer area in mm2 at 12 weeks.
Figuras y tablas -
Analysis 2.2

Comparison 2 Hydrocolloid dressings compared with alginate dressings, Outcome 2 Change in ulcer area in mm2 at 12 weeks.

Comparison 2 Hydrocolloid dressings compared with alginate dressings, Outcome 3 Percentage change in ulcer area at 12 weeks.
Figuras y tablas -
Analysis 2.3

Comparison 2 Hydrocolloid dressings compared with alginate dressings, Outcome 3 Percentage change in ulcer area at 12 weeks.

Comparison 2 Hydrocolloid dressings compared with alginate dressings, Outcome 4 Mean wear time (days).
Figuras y tablas -
Analysis 2.4

Comparison 2 Hydrocolloid dressings compared with alginate dressings, Outcome 4 Mean wear time (days).

Comparison 2 Hydrocolloid dressings compared with alginate dressings, Outcome 5 Proportion of participants experiencing adverse events.
Figuras y tablas -
Analysis 2.5

Comparison 2 Hydrocolloid dressings compared with alginate dressings, Outcome 5 Proportion of participants experiencing adverse events.

Comparison 3 Plain non‐adherent dressings compared with alginate dressings, Outcome 1 Proportion of ulcers healed at 12 weeks.
Figuras y tablas -
Analysis 3.1

Comparison 3 Plain non‐adherent dressings compared with alginate dressings, Outcome 1 Proportion of ulcers healed at 12 weeks.

Summary of findings for the main comparison. Alginate dressing (Sorbsan®) compared to alternative alginate dressing (Tegagen™ High Gelling) for venous leg ulceration

alginate dressing (Sorbsan®) compared to alternative alginate dressing (Tegagen ™ High Gelling) for venous leg ulceration

Patient or population: people with venous leg ulceration
Settings: outpatient clinics
Intervention: Alginate dressing (Sorbsan®)
Comparison: alternative alginate dressing (Tegagen ™ High Gelling)

Outcomes

Illustrative comparative risks* (95% CI)

Relative effect
(95% CI)

No of Participants
(studies)

Quality of the evidence
(GRADE)

Comments

Assumed risk

Corresponding risk

Alternative alginate dressing (Tegagen ™High Gelling)

Alginate dressing (Sorbsan®)

Time to healing

See comment

See comment

Not estimable

0
(0)

See comment

Outcome not reported.

Proportion of participants with healed ulcers
Follow‐up: 6 weeks

Study population1

RR 6.00
(0.32 to 111.04)

20
(1 study)

⊕⊝⊝⊝
very low2,3,4,5

Low1

91 per 1000

546 per 1000
(29 to 1000)

High1

204 per 1000

1000 per 1000
(65 to 1000)

Mean change in wound size, with adjustment for baseline size

See comment

See comment

Not estimable

0
(0)

See comment

Outcome not reported (only reported mean percentage change in ulcer area, with no variance estimate, and no adjustment for baseline area).

Adverse effects

See comment

See comment

Not estimable

0
(0)

See comment

Limited information provided.

Health‐related quality of life

See comment

See comment

Not estimable

0
(0)

See comment

Outcome not reported.

*The basis for the assumed risk (e.g. the median control group risk across studies) is provided in footnotes. The corresponding risk (and its 95% confidence interval) is based on the assumed risk in the comparison group and the relative effect of the intervention (and its 95% CI).
CI: Confidence interval; RR: Risk ratio;

GRADE Working Group grades of evidence
High quality: Further research is very unlikely to change our confidence in the estimate of effect.
Moderate quality: Further research is likely to have an important impact on our confidence in the estimate of effect and may change the estimate.
Low quality: Further research is very likely to have an important impact on our confidence in the estimate of effect and is likely to change the estimate.
Very low quality: We are very uncertain about the estimate.

1 Note: lower risk of the outcome is less favourable (i.e. lower risk of healing) than higher risk. Estimates for baseline low and high risks of healing at 30 days have been taken from a meta‐analysis of RCTs evaluating different types of compression. The low risk estimate is based on a subset of participants with larger baseline ulcer area (greater than 5 cm squared). The high risk estimate is based on a subset of participants with smaller baseline ulcer surface area (5 cm squared or smaller). Most participants received a simple, low‐adherent dressing plus four‐layer bandage (O'Meara 2007). Estimate of baseline risk could not be estimated from study population because no participants healed in the Tegagen ™ HG group.
2 Overall risk of bias was unclear.
3 Risk ratio estimate based on single RCT; unable to assess heterogeneity.
4 Risk ratio estimate based on single very small RCT (N = 20).
5 Risk ratio estimate based on single RCT; unable to formally assess presence of publication bias.

Figuras y tablas -
Summary of findings for the main comparison. Alginate dressing (Sorbsan®) compared to alternative alginate dressing (Tegagen™ High Gelling) for venous leg ulceration
Summary of findings 2. Alginate dressing compared to hydrocolloid dressing for venous leg ulceration

alginate dressing compared to hydrocolloid dressing for venous leg ulceration

Patient or population: people with venous leg ulceration
Settings: outpatient clinics or community
Intervention: Alginate dressing
Comparison: hydrocolloid dressing

Outcomes

Illustrative comparative risks* (95% CI)

Relative effect
(95% CI)

No of Participants
(studies)

Quality of the evidence
(GRADE)

Comments

Assumed risk

Corresponding risk

Hydrocolloid dressing

Alginate dressing

Time to healing

See comment

See comment

Not estimable

0
(0)

See comment

One RCT presented time to healing, but did not report a reliable estimate (not based on censored data).

Proportion of participants with healed ulcers at 6 weeks
Follow‐up: 6 weeks

Study population1

RR 0.42
(0.14 to 1.21)

84
(2 studies)

⊕⊝⊝⊝
very low2,3,4

233 per 1000

98 per 1000
(33 to 281)

Low1

91 per 1000

38 per 1000
(13 to 110)

High1

204 per 1000

86 per 1000
(29 to 247)

Proportion of participants with healed ulcers at 12 weeks
Follow‐up: 12 weeks

Study population

RR 1.02
(0.57 to 1.81)

131
(1 study)

⊕⊝⊝⊝
very low5,6,7,8

258 per 1000

263 per 1000
(147 to 466)

Low

311 per 1000

317 per 1000
(177 to 563)

High

696 per 1000

710 per 1000
(397 to 1000)

Mean change in wound size, with adjustment for baseline size

See comment

See comment

Not estimable

0
(0)

See comment

Three RCTs reported change in wound area, but not with baseline adjustment.

Proportion of participants experiencing adverse effects at 6 weeks
Follow‐up: 6 weeks

227 per 1000

334 per 1000
(120 to 916)

RR 1.47
(0.53 to 4.03)9

40
(1 study)

⊕⊝⊝⊝
very low10,11,12,13

Health‐related quality of life

See comment

See comment

Not estimable

0
(0)

See comment

One RCT assessed health‐related quality of life but did not use a validated tool, and only reported percentages of participants who had improved.

*The basis for the assumed risk (e.g. the median control group risk across studies) is provided in footnotes. The corresponding risk (and its 95% confidence interval) is based on the assumed risk in the comparison group and the relative effect of the intervention (and its 95% CI).
CI: Confidence interval; RR: Risk ratio;

GRADE Working Group grades of evidence
High quality: Further research is very unlikely to change our confidence in the estimate of effect.
Moderate quality: Further research is likely to have an important impact on our confidence in the estimate of effect and may change the estimate.
Low quality: Further research is very likely to have an important impact on our confidence in the estimate of effect and is likely to change the estimate.
Very low quality: We are very uncertain about the estimate.

1 Note: lower risk of the outcome is less favourable (i.e. lower risk of healing) than higher risk. Estimates for baseline low and high risks of healing at 30 days (and 90 days for the 12 week outcome) have been taken from a meta‐analysis of RCTs evaluating different types of compression. The low risk estimate is based on a subset of participants with larger baseline ulcer area (greater than 5 cm squared). The high risk estimate is based on a subset of participants with smaller baseline ulcer surface area (5 cm squared or smaller). Most participants received a simple, low‐adherent dressing plus four‐layer bandage (O'Meara 2007).
2 One RCT had overall unclear risk of bias and one had overall high risk of bias.
3 Underpowered comparison (N = 84).
4 Risk ratio estimate based on 2 RCTs; not possible to assess publication bias.
5 RCT had overall unclear risk of bias.
6 Risk ratio estimate based on single RCT; not possible to assess heterogeneity.
7 Underpowered comparison (N = 131).
8 Risk ratio estimate based on single RCT; not possible to assess publication bias.
9 Baseline event rate is taken from the control group in the RCT.
10 Estimate based on single RCT with overall high risk of bias.
11 Risk ratio estimate based on single RCT; not possible to assess heterogeneity.
12 Underpowered comparison (N = 40).
13 Risk ratio estimate based on single RCT; not possible to assess publication bias.

Figuras y tablas -
Summary of findings 2. Alginate dressing compared to hydrocolloid dressing for venous leg ulceration
Summary of findings 3. Alginate dressing compared to plain non‐adherent dressing for venous leg ulceration

alginate dressing compared to plain non‐adherent dressing for venous leg ulceration

Patient or population: people with venous leg ulceration
Settings: community
Intervention: Alginate dressing
Comparison: plain non‐adherent dressing

Outcomes

Illustrative comparative risks* (95% CI)

Relative effect
(95% CI)

No of Participants
(studies)

Quality of the evidence
(GRADE)

Comments

Assumed risk

Corresponding risk

Plain non‐adherent dressing

Alginate dressing

Time to healing

See comment

See comment

Not estimable

0
(0)

See comment

Assessment of time to healing mentioned in RCT report, but estimates not provided.

Proportion of participants with healed ulcers
Follow‐up: 12 weeks

Study population1

RR 1.08
(0.86 to 1.36)

60
(1 study)

⊕⊝⊝⊝
very low2,3,4,5

800 per 1000

864 per 1000
(688 to 1000)

Low1

311 per 1000

336 per 1000
(267 to 423)

High1

696 per 1000

752 per 1000
(599 to 947)

Mean change in wound size, with adjustment for baseline size

See comment

See comment

Not estimable

0
(0)

See comment

Outcome not reported.

Adverse effects

See comment

See comment

Not estimable

0
(0)

See comment

Outcome not reported.

Health‐related quality of life

See comment

See comment

Not estimable

0
(0)

See comment

Outcome not reported.

*The basis for the assumed risk (e.g. the median control group risk across studies) is provided in footnotes. The corresponding risk (and its 95% confidence interval) is based on the assumed risk in the comparison group and the relative effect of the intervention (and its 95% CI).
CI: Confidence interval; RR: Risk ratio;

GRADE Working Group grades of evidence
High quality: Further research is very unlikely to change our confidence in the estimate of effect.
Moderate quality: Further research is likely to have an important impact on our confidence in the estimate of effect and may change the estimate.
Low quality: Further research is very likely to have an important impact on our confidence in the estimate of effect and is likely to change the estimate.
Very low quality: We are very uncertain about the estimate.

1 Note: lower risk of the outcome is less favourable (i.e. lower risk of healing) than higher risk. Estimates for baseline low and high risks of healing at 90 days have been taken from a meta‐analysis of compression RCTs. The low risk estimate is based on a subset of participants with larger baseline ulcer surface area (greater than 5 cm squared). The high risk estimate is based on a subset of participants with smaller baseline ulcer surface area (5 cm squared or smaller). Most participants received a simple, low‐adherent dressing plus four‐layer bandage (O'Meara 2007).
2 RCT was at overall high risk of bias.
3 Risk ratio estimate based on single RCT; not possible to assess heterogeneity.
4 Underpowered comparison (N = 60).
5 Risk ratio estimate based on single RCT; not possible to assess publication bias.

Figuras y tablas -
Summary of findings 3. Alginate dressing compared to plain non‐adherent dressing for venous leg ulceration
Table 1. Outcome data reported by included trials: primary (healing) outcomes

Armstrong 1997

Number of ulcers healed at 6 weeks:

Group 1 (hydrocolloid dressing):  6/21 (29%)

Group 2 (alginate dressing):  2/23 (9%)

P value for between‐group difference not reported. 

Change in ulcer size – median change in area:

Group 1 (hydrocolloid dressing):  ‐205 mm2

Group 2 (alginate dressing):  ‐162 mm2

The trial authors reported that the between‐group difference was not statistically significant. P value not reported. 

Change in ulcer size – median percentage change in ulcer area:

Group 1 (hydrocolloid dressing):  ‐42%

Group 2 (alginate dressing):  ‐26%

The trial authors reported that the between‐group difference was not statistically significant. P value not reported. Review authors' comment: there was a reporting discrepancy between primary and secondary references for this outcome. The respective values in the secondary reference were ‐30.5% and ‐28.1%.

Harding 2001

Time to healing days ‐ mean (SD) [median (range)] (analysis based on healed participants only):

Group 1 (hydrocolloid dressing):  41.823 days (SD 21.302) [42 (14 to 87)]; n = 17

Group 2 (alginate dressing):  56.588 days (SD 21.569) [56 (14 to 85)]; n = 17

Reported P value for between‐group difference in means = 0.053

P = 0.05 (log rank test) for difference in Kaplan‐Meier survival curves (analysis based on all randomised patients) 

Number of ulcers healed at 12 weeks:

Group 1 (hydrocolloid dressing): 17/66 (26%)

Group 2 (alginate dressing): 17/65 (26%)

P value for between‐group difference not reported 

Change in ulcer area mm2 ‐ mean (SD) [median (range)]:

Group 1 (hydrocolloid dressing):  ‐516.86 mm2 (SD 1202.72) [‐301.13 (‐2494.84 to 5285.82)]; n = 66

Group 2 (alginate dressing):  ‐347.30 mm2 (SD 1382.69) [‐132.83 (‐5144.08 to 5946.24)]; n = 65

P value for between‐group difference in means P = 0.48, reported by trial authors.

Percentage change in ulcer area – mean (SD) [median (range)]:

Group 1 (hydrocolloid dressing):  ‐38.18% (SD 92.36) [‐67.67 (374.84 to ‐100.00)]; n = 66

Group 2 (alginate dressing):  ‐30.54% (SD 84.08) [‐43.33 (411.74 to ‐100.00)]; n = 65

P value for between‐group difference in means = 0.64, reported by trial authors

Límová 2003

Number of ulcers healed at 6 weeks:

Group 1 (alginate dressing, Tegagen ™ HG): 0/11 (0%)

Group 2 (alginate dressing, Sorbsan®): 2/9 (22%)

P value for between‐group difference not reported.

Mean percentage change in wound area at 6 weeks:

Group 1 (alginate dressing, Tegagen ™ HG):  ‐33.7%, n = 10

Group 2 (alginate dressing, Sorbsan®):  ‐29.6%, n = 9

The trial authors reported a P value of 0.88 for between‐group difference

Moffatt 1992

Time to healing/number of ulcers healed at 12 weeks:

Group 1 (plain non‐adherent dressing): 24/30 (80%)

Group 2 (alginate dressing): 26/30 (87%)

P value for between‐group difference not reported

The trial authors reported that results were similar for cumulative proportions healed estimated using life table analysis (no data or P value for between‐group difference presented)

Smith 1994

Number of ulcers healed at 6 weeks:

Group 1 (hydrocolloid dressing): 4/22 (18%)

Group 2 (alginate dressing): 2/18 (11%)

P value for between‐group difference not reported 

Mean percentage change in ulcer area:

Group 1 (hydrocolloid dressing):  ‐57.1

Group 2 (alginate dressing): ‐34.9

The trial authors reported that the between‐group difference was not statistically different. P value not reported

Figuras y tablas -
Table 1. Outcome data reported by included trials: primary (healing) outcomes
Table 2. Outcome data reported by included trials ‐ secondary outcomes

Armstrong 1997

Mean wear time days:

Group 1 (hydrocolloid dressing):  4.112 days

Group 2 (alginate dressing):  3.051 days

The trial authors reported a between‐group difference of 1.029 days (95% CI 0.385 to 1.672), and that the difference was statistically significant in favour of Group 1 but the P value was not reported. Reviewer authors' comment: the difference in means reported by the trial authors does not follow from the mean values for each group 

Number participants achieving a 7‐day wear time on at least one occasion:

Group 1 (hydrocolloid dressing):  9/21 (43%)

Group 2 (alginate dressing):  3/23 (13%)

The trial authors reported that the between‐group difference (30%, 95% CI 5% to 55%) was statistically significant but P value not reported 

Cost to heal one ulcer:

Group 1 (hydrocolloid dressing):  GBP 237.66 (total direct and indirect costs = GBP 1425.97 for total of 6 wounds healed)

Group 2 (alginate dressing):  GBP 687.31 (total direct and indirect costs = GBP 1374.61 for total of 2 wounds healed)

Cost per wound healed calculated by review authors.

Taking into account the number of participants completely healed in each group, the trial authors reported that the cost to achieve a healed wound using the Group 1 dressing was approximately one‐third of the cost of Group 2. 

Number dressing changes with no pain, mild pain, moderate pain, severe pain, excruciating pain, unable to respond, missing data:

Group 1 (hydrocolloid dressing):  (total of 192 dressing changes) 144 (75%), 38 (20%), 6 (3%), 2 (1%), 0 (0%), 0 (0%), 2 (1%)

Group 2 (alginate dressing):  (total of 224 dressing changes) 186 (83%), 29 (13%), 8 (3.5%), 0 (0%), 0 (0)%, 0 (0%), 1 (0.5%) 

Number of adverse events during the trial:

Group 1 (hydrocolloid dressing): 32 adverse events reported during the trial. 4 were related to the primary dressing and 28 to the secondary dressing, of which 8 were attributed to maceration.

Group 2 (alginate dressing): 32 adverse events reported during the trial. 3 were related to the primary dressing and 29 to the secondary dressing, of which 9 were attributed to maceration.

Harding 2001

Total number of dressing changes:

Group 1 (hydrocolloid dressing): 1093

Group 2 (alginate dressing): 1186

Mean wear time days (SD) [median (range)]:

Group 1 (hydrocolloid dressing):  3.632 days (1.878) [3 (1 to 13)]; n = 66

Group 2 (alginate dressing):  3.271 days (1.944) [3 (1 to 9)]; n = 65

The trial authors reported that the between‐group difference in means was P value < 0.001

Mean number of dressing changes per healed ulcer:

Group 1 (hydrocolloid dressing):  7.4

Group 2 (alginate dressing):  12.1

P value for between‐group difference not reported

Mean cost to achieve ulcer healing (based on patients healed):

Group 1 (hydrocolloid dressing):  GBP 1184.09 (USD 1699.71)

Group 2 (alginate dressing):  GBP 1200.73 (USD 1723.59)

Mean cost per 1cm2 reduction in ulcer size (all patients randomised):

Group 1 (hydrocolloid dressing):  GBP 59.22 (USD 85.01)

Group 2 (alginate dressing):  GBP 92.27 (USD 132.46)

Mean cost per 10% reduction in ulcer area:

Group 1 (hydrocolloid dressing):  GBP 80.15 (USD 115.06)

Group 2 (alginate dressing):  GBP 104.92 (USD 150.62)

Percentage of dressing changes associated with no pain:

Group 1 (hydrocolloid dressing): 82%

Group 2 (alginate dressing): 62%

The trial authors reported that the between‐group difference was statistically significant ( P value < 0.001). Numbers of dressings not reported 

Dressing performance – percentage recording “excellent” for overall ability to contain exudate:

Group 1 (hydrocolloid dressing): 44%

Group 2 (alginate dressing): 20%

Unclear whether denominator was the number of participants or the number of dressing changes.

Reported P value for between‐group difference = 0.002 

Dressing performance – percentage recording “excellent” for overall ease of dressing removal:

Group 1 (hydrocolloid dressing): 51%

Group 2 (alginate dressing): 24%

Unclear whether denominator was the number of participants or the number of dressing changes.

Reported P value for between‐group difference = 0.006

 Percentage of dressing changes with some adhesion to the wound bed:

Group 1 (hydrocolloid dressing): 38%

Group 2 (alginate dressing): 74%

The trial authors reported that the between‐group difference was statistically significant (P value < 0.001)

Number of dressing changes not reported

Review authors' comments: there were some minor discrepancies between numbers in main text and tables for cost information (data from main text were recorded here); discrepancies between primary and secondary references for outcomes of ease of removal and exudate handling (data from primary reference recorded here); unclear whether reported outcomes relating to pain at dressing change, exudate handling, ease of dressing removal and adhesion were rated by participants or investigators (or both).

Límová 2003

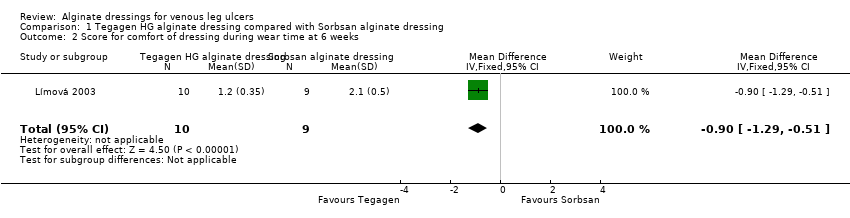
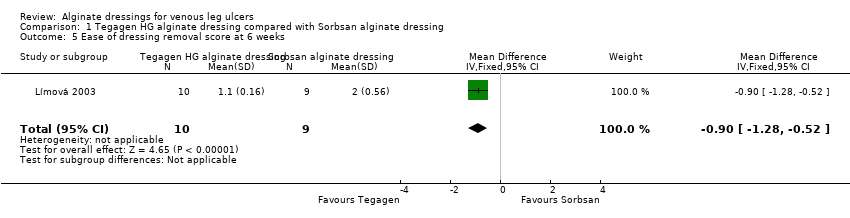
Total number of dressing changes over the course of the trial:

Group 1 (alginate dressing, Tegagen ™ HG): 69 (65 scheduled and 4 unscheduled)

Group 2 (alginate dressing, Sorbsan®): 61 (60 scheduled and 1 unscheduled) 

Mean (SD) comfort score during wear over number of visits:

Group 1 (alginate dressing, Tegagen ™ HG): 1.2 (SD 0.35) over 55 visits; n = 10

Group 2 (alginate dressing, Sorbsan®): 2.1 (SD 0.50) over 51 visits; n = 9

The trial authors reported a P value of 0.0005 for the between‐group difference 

Mean (SD) comfort score during dressing removal over number of visits:

Group 1 (alginate dressing, Tegagen ™ HG): 1.2 (SD 0.22) over 55 visits; n = 10

Group 2 (alginate dressing, Sorbsan®): 1.9 (SD 0.19) over 51 visits; n = 9

The trial authors reported a P value of 0.003 for the between‐group difference 

Percentage of visits where necrotic tissue was observed:

Group 1 (alginate dressing, Tegagen ™ HG): 59.7% of 55 visits; n = 10

Group 2 (alginate dressing, Sorbsan®): 68.9% of 51 visits; n = 9

The trial authors reported a P value of 0.57 for the between‐group difference 

Percentage of visits where debridement was required:

Group 1 (alginate dressing, Tegagen ™ HG): 18.7% of 55 visits; n = 10

Group 2 (alginate dressing, Sorbsan®): 40.7% of 51 visits; n = 9

The trial authors reported a P value of 0.18 for the between‐group difference 

Mean improvement in amount of necrotic tissue (lower score is better):

Group 1 (alginate dressing, Tegagen ™ HG): 2.5 over 55 visits; n = 10

Group 2 (alginate dressing, Sorbsan®): 1.5 over 51 visits; n = 9

The trial authors reported a P value of 0.38 for the between‐group difference 

Mean (SD) exudate absorption score over number of visits (lower score better):

Group 1 (alginate dressing, Tegagen ™ HG): 1.3 (SD 0.45) over 55 visits; n = 10

Group 2 (alginate dressing, Sorbsan®): 2.1 (SD 0.48) over 51 visits; n = 9

The trial authors reported a P value of 0.002 for the between‐group difference 

Percentage of clinic visits with medium or large amount of exudate observed:

Group 1 (alginate dressing, Tegagen ™ HG):  71.7% of 55 visits; n = 10

Group 2 (alginate dressing, Sorbsan®):  86.3% of 51 visits; n = 9

The trial authors reported a P value of 0.25 for the between‐group difference 

Mean (SD) ease of removal score over number of visits (lower is better):

Group 1 (alginate dressing, Tegagen ™ HG): 1.1 (SD 0.16) over 55 visits; n = 10

Group 2 (alginate dressing, Sorbsan®): 2.0 (SD 0.56) over 51 visits; n = 9

The trial authors reported a P value of 0.002 for the between‐group difference 

Proportion of participants reporting dressing adherence to the wound bed:

Group 1 (alginate dressing, Tegagen ™ HG): 0%

Group 2 (alginate dressing, Sorbsan®): 27.8%

The trial authors reported that the average percentage of dressing changes with adherence to the wound bed was significantly less in Group 1 (P value < 0.05).

Percentage of clinic visits with observation of peri‐wound skin as macerated, denuded, requiring medication:

Group 1 (alginate dressing, Tegagen ™ HG): 36.0%, 9.0%, 31.3%

Group 2 (alginate dressing, Sorbsan®): 54.4%, 31.9%, 65.2%

Reported P values for between‐group difference: macerated skin P value 0.30; denuded skin P value 0.04, medication required P value 0.07

Moffatt 1992

None reported

Smith 1994

Proportion of participants “improved remarkably” in quality of life at week 6:

Group 1 (hydrocolloid dressing): 42.9%

Group 2 (alginate dressing): 40.0%

The trial authors did not report the number of participants completing the quality of life assessment. P value for between‐group difference not reported. There was a reporting discrepancy between “improved remarkably” and the pre‐defined categories for this outcome (deteriorated markedly, deteriorated somewhat, no change, improved somewhat or improved markedly)

Number of dressings used per week:

Group 1 (hydrocolloid dressing): 1‐3

Group 2 (alginate dressing): 1‐2

Wear time:

The trial authors reported that both dressings were equivalent in terms of wear time, but no data by group or P value for between‐group difference were reported.

Mean total approximate cost of materials:

Group 1 (hydrocolloid dressing): GBP 431.73

Group 2 (alginate dressing): GBP 364.08

P value for between‐group difference not reported 

Mean ulcer pain score over past 2 weeks at 6 weeks:

Group 1 (hydrocolloid dressing): 1.46

Group 2 (alginate dressing): 2.15

The trial authors reported that the between‐group difference was not statistically significant. P value not reported 

Change from baseline in mean ulcer pain score over past 2 weeks at 6 weeks:

Group 1 (hydrocolloid dressing): ‐3.28

Group 2 (alginate dressing): ‐2.71

Estimated by review authors 

Mean pain score at dressing change at week 6:

Group 1 (hydrocolloid dressing):  1.73

Group 2 (alginate dressing): 2.16

P value for between‐group difference not reported 

Change from baseline in mean pain score at dressing change at 6 weeks:

Not reported and reviewer unable to estimate as data at week 6 only reported (no baseline) 

Proportion of participants reporting no sleep disturbance due to pain at week 2 and week 6:

Group 1 (hydrocolloid dressing):  31.25%, 78.6%

Group 2 (alginate dressing): 8.8%, 40.0%

The trial authors did not report whether the proportions were for all participants enrolled or only those completing the trial. Reported P value for between‐group difference = 0.0721, but unclear to which time point this refers or if it is for the test across time points 

Dressing performance (exudate handling):

The trial authors reported that the Group 2 dressing was “slightly superior” in terms of ability to contain exudate. However,  no data by group or P value for between‐group difference were reported 

Proportion of participants reporting ‘excellent’ for ease of dressing removal:

Group 1 (hydrocolloid dressing): 56.3%

Group 2 (alginate dressing): 8.3%

The trial authors did not report raw numbers and the denominator was not clear. Reported P value for between‐group difference was < 0.001. The trial authors reported that the Group 2 dressing often needed to be soaked off the ulcer. 

Number participants experiencing adverse events:

Group 1 (hydrocolloid dressing): 5/22 (23%) (withdrawals: pain, 1; ulcer infection, 1; possible allergy, 1; not thought to warrant withdrawal ‐ wound infection, 1; pain and erythema at the final visit, 1)

Group 2 (alginate dressing): 6/18 (33%) (withdrawals: pain, 4; ulcer infection, 2) 

Figuras y tablas -
Table 2. Outcome data reported by included trials ‐ secondary outcomes
Comparison 1. Tegagen HG alginate dressing compared with Sorbsan alginate dressing

Outcome or subgroup title

No. of studies

No. of participants

Statistical method

Effect size

1 Proportion of ulcers healed at 6 weeks Show forest plot

1

20

Risk Ratio (M‐H, Fixed, 95% CI)

6.0 [0.32, 111.04]

2 Score for comfort of dressing during wear time at 6 weeks Show forest plot

1

19

Mean Difference (IV, Fixed, 95% CI)

‐0.90 [‐1.29, ‐0.51]

3 Score for comfort during dressing removal at 6 weeks Show forest plot

1

19

Mean Difference (IV, Fixed, 95% CI)

‐0.7 [‐0.88, ‐0.52]

4 Exudate absorption score at 6 weeks Show forest plot

1

19

Mean Difference (IV, Fixed, 95% CI)

‐0.80 [‐1.22, ‐0.38]

5 Ease of dressing removal score at 6 weeks Show forest plot

1

19

Mean Difference (IV, Fixed, 95% CI)

‐0.90 [‐1.28, ‐0.52]

Figuras y tablas -
Comparison 1. Tegagen HG alginate dressing compared with Sorbsan alginate dressing
Comparison 2. Hydrocolloid dressings compared with alginate dressings

Outcome or subgroup title

No. of studies

No. of participants

Statistical method

Effect size

1 Proportion of ulcers healed at 6 and 12 weeks Show forest plot

3

215

Risk Ratio (M‐H, Fixed, 95% CI)

0.79 [0.48, 1.31]

1.1 Healed at 6 weeks

2

84

Risk Ratio (M‐H, Fixed, 95% CI)

0.42 [0.14, 1.21]

1.2 Healed at 12 weeks

1

131

Risk Ratio (M‐H, Fixed, 95% CI)

1.02 [0.57, 1.81]

2 Change in ulcer area in mm2 at 12 weeks Show forest plot

1

131

Mean Difference (IV, Fixed, 95% CI)

‐169.56 [‐613.61, 274.49]

3 Percentage change in ulcer area at 12 weeks Show forest plot

1

131

Mean Difference (IV, Fixed, 95% CI)

‐7.64 [‐37.88, 22.60]

4 Mean wear time (days) Show forest plot

1

131

Mean Difference (IV, Fixed, 95% CI)

0.36 [‐0.29, 1.02]

5 Proportion of participants experiencing adverse events Show forest plot

1

40

Risk Ratio (M‐H, Fixed, 95% CI)

1.47 [0.53, 4.03]

Figuras y tablas -
Comparison 2. Hydrocolloid dressings compared with alginate dressings
Comparison 3. Plain non‐adherent dressings compared with alginate dressings

Outcome or subgroup title

No. of studies

No. of participants

Statistical method

Effect size

1 Proportion of ulcers healed at 12 weeks Show forest plot

1

60

Risk Ratio (M‐H, Fixed, 95% CI)

1.08 [0.86, 1.36]

Figuras y tablas -
Comparison 3. Plain non‐adherent dressings compared with alginate dressings