Stosowanie opatrunków alginianowych w owrzodzeniach żylnych podudzi
Abstract
Background
Venous leg ulcers are a common and recurring type of chronic, complex wound associated with considerable cost to patients and healthcare providers. To aid healing, primary wound contact dressings are usually applied to ulcers beneath compression devices. Alginate dressings are used frequently and there is a variety of alginate products on the market, however, the evidence base to guide dressing choice is sparse.
Objectives
To determine the effects of alginate dressings compared with alternative dressings, non‐dressing treatments or no dressing, with or without concurrent compression therapy, on the healing of venous leg ulcers.
Search methods
For this first update, in March 2015, we searched the following databases: The Cochrane Wounds Group Specialised Register; The Cochrane Central Register of Controlled Trials (CENTRAL); Ovid MEDLINE; Ovid MEDLINE (In‐Process & Other Non‐Indexed Citations); Ovid EMBASE; and EBSCO CINAHL. There were no restrictions based on language or date of publication.
Selection criteria
Published or unpublished randomised controlled trials (RCTs) that evaluated the effects of any type of alginate dressing in the treatment of venous ulcers were included.
Data collection and analysis
Two review authors independently performed study selection, data extraction and risk of bias assessment. Meta‐analysis was undertaken when deemed feasible and appropriate.
Main results
Five RCTs (295 participants) were included in this review. All were identified during the original review. The overall risk of bias was high for two RCTs and unclear for three. One RCT compared different proprietary alginate dressings (20 participants), three compared alginate and hydrocolloid dressings (215 participants), and one compared alginate and plain non‐adherent dressings (60 participants). Follow‐up periods were six weeks in three RCTs and 12 weeks in two. No statistically significant between‐group differences were detected for any comparison, for any healing outcome. Meta‐analysis was feasible for one comparison (alginate and hydrocolloid dressings), with data from two RCTs (84 participants) pooled for complete healing at six weeks: risk ratio 0.42 (95% confidence interval 0.14 to 1.21). Adverse event profiles were generally similar between groups (not assessed for alginate versus plain non‐adherent dressings).
Authors' conclusions
The current evidence base does not suggest that alginate dressings are more or less effective in the healing of venous leg ulcers than hydrocolloid or plain non‐adherent dressings, and there is no evidence to indicate a difference between different proprietary alginate dressings. However, the RCTs in this area are considered to be of low or unclear methodological quality. Further, good quality evidence is required from well designed and rigorously conducted RCTs that employ ‐ and clearly report on ‐ methods to minimise bias, prior to any definitive conclusions being made regarding the efficacy of alginate dressings in the management of venous leg ulcers.
PICO
Streszczenie prostym językiem
Stosowanie opatrunków alginianowych w owrzodzeniach żylnych podudzi
Owrzodzenia żylne podudzi to częsty i nawracający typ rany przewlekłej lub zespołu ran, który może być niepokojący dla pacjenta oraz kosztowny z punktu widzenia świadczeniodawcy. Kompresjoterapia za pomocą wyrobów uciskowych takich jak bandaże lub pończochy, jest uważana za podstawową metodę leczenia owrzodzeń żylnych podudzi. Opatrunki stosuje się pod bandaże lub pończochy w celu ochrony rany i zapewnienia wilgotnych warunków, które sprzyjają gojeniu. Opatrunki alginianowe zawierają w swoim składzie substancje pochodzące z wodorostów i są jednym z wielu rodzajów dostępnych opatrunków. Oceniliśmy dane pochodzące z pięciu badań klinicznych z randomizacją, w których porównywano różne marki opatrunków alginianowych lub opatrunki alginianowe z innymi typami opatrunków. Nie odnaleźliśmy dobrych danych naukowych, które wykazałyby różnicę co do gojenia ran pomiędzy różnymi markami opatrunków alginianowych, jak i pomiędzy opatrunkami alginianowymi a hydrokoloidowymi lub zwykłymi opatrunkami nieprzylegającymi. Działania niepożądane były na ogół podobne w poszczególnych grupach (nie oceniano efektów ubocznych u stosujących opatrunki alginianowe w porównaniu do opatrunków nieprzylegających). Ogólna jakość dostępnych obecnie danych jest niska. Konieczne są dodatkowe dobrej jakości dane, aby móc sformułować ostateczne wnioski dotyczące stosowania opatrunków alginianowych w leczeniu owrzodzeń żylnych podudzi.
Authors' conclusions
Summary of findings
| alginate dressing (Sorbsan®) compared to alternative alginate dressing (Tegagen ™ High Gelling) for venous leg ulceration | ||||||
| Patient or population: people with venous leg ulceration | ||||||
| Outcomes | Illustrative comparative risks* (95% CI) | Relative effect | No of Participants | Quality of the evidence | Comments | |
| Assumed risk | Corresponding risk | |||||
| Alternative alginate dressing (Tegagen ™High Gelling) | Alginate dressing (Sorbsan®) | |||||
| Time to healing | See comment | See comment | Not estimable | 0 | See comment | Outcome not reported. |
| Proportion of participants with healed ulcers | Study population1 | RR 6.00 | 20 | ⊕⊝⊝⊝ | ||
| Low1 | ||||||
| 91 per 1000 | 546 per 1000 | |||||
| High1 | ||||||
| 204 per 1000 | 1000 per 1000 | |||||
| Mean change in wound size, with adjustment for baseline size | See comment | See comment | Not estimable | 0 | See comment | Outcome not reported (only reported mean percentage change in ulcer area, with no variance estimate, and no adjustment for baseline area). |
| Adverse effects | See comment | See comment | Not estimable | 0 | See comment | Limited information provided. |
| Health‐related quality of life | See comment | See comment | Not estimable | 0 | See comment | Outcome not reported. |
| *The basis for the assumed risk (e.g. the median control group risk across studies) is provided in footnotes. The corresponding risk (and its 95% confidence interval) is based on the assumed risk in the comparison group and the relative effect of the intervention (and its 95% CI). | ||||||
| GRADE Working Group grades of evidence | ||||||
| 1 Note: lower risk of the outcome is less favourable (i.e. lower risk of healing) than higher risk. Estimates for baseline low and high risks of healing at 30 days have been taken from a meta‐analysis of RCTs evaluating different types of compression. The low risk estimate is based on a subset of participants with larger baseline ulcer area (greater than 5 cm squared). The high risk estimate is based on a subset of participants with smaller baseline ulcer surface area (5 cm squared or smaller). Most participants received a simple, low‐adherent dressing plus four‐layer bandage (O'Meara 2007). Estimate of baseline risk could not be estimated from study population because no participants healed in the Tegagen ™ HG group. | ||||||
| alginate dressing compared to hydrocolloid dressing for venous leg ulceration | ||||||
| Patient or population: people with venous leg ulceration | ||||||
| Outcomes | Illustrative comparative risks* (95% CI) | Relative effect | No of Participants | Quality of the evidence | Comments | |
| Assumed risk | Corresponding risk | |||||
| Hydrocolloid dressing | Alginate dressing | |||||
| Time to healing | See comment | See comment | Not estimable | 0 | See comment | One RCT presented time to healing, but did not report a reliable estimate (not based on censored data). |
| Proportion of participants with healed ulcers at 6 weeks | Study population1 | RR 0.42 | 84 | ⊕⊝⊝⊝ | ||
| 233 per 1000 | 98 per 1000 | |||||
| Low1 | ||||||
| 91 per 1000 | 38 per 1000 | |||||
| High1 | ||||||
| 204 per 1000 | 86 per 1000 | |||||
| Proportion of participants with healed ulcers at 12 weeks | Study population | RR 1.02 | 131 | ⊕⊝⊝⊝ | ||
| 258 per 1000 | 263 per 1000 | |||||
| Low | ||||||
| 311 per 1000 | 317 per 1000 | |||||
| High | ||||||
| 696 per 1000 | 710 per 1000 | |||||
| Mean change in wound size, with adjustment for baseline size | See comment | See comment | Not estimable | 0 | See comment | Three RCTs reported change in wound area, but not with baseline adjustment. |
| Proportion of participants experiencing adverse effects at 6 weeks | 227 per 1000 | 334 per 1000 | RR 1.47 | 40 | ⊕⊝⊝⊝ | |
| Health‐related quality of life | See comment | See comment | Not estimable | 0 | See comment | One RCT assessed health‐related quality of life but did not use a validated tool, and only reported percentages of participants who had improved. |
| *The basis for the assumed risk (e.g. the median control group risk across studies) is provided in footnotes. The corresponding risk (and its 95% confidence interval) is based on the assumed risk in the comparison group and the relative effect of the intervention (and its 95% CI). | ||||||
| GRADE Working Group grades of evidence | ||||||
| 1 Note: lower risk of the outcome is less favourable (i.e. lower risk of healing) than higher risk. Estimates for baseline low and high risks of healing at 30 days (and 90 days for the 12 week outcome) have been taken from a meta‐analysis of RCTs evaluating different types of compression. The low risk estimate is based on a subset of participants with larger baseline ulcer area (greater than 5 cm squared). The high risk estimate is based on a subset of participants with smaller baseline ulcer surface area (5 cm squared or smaller). Most participants received a simple, low‐adherent dressing plus four‐layer bandage (O'Meara 2007). | ||||||
| alginate dressing compared to plain non‐adherent dressing for venous leg ulceration | ||||||
| Patient or population: people with venous leg ulceration | ||||||
| Outcomes | Illustrative comparative risks* (95% CI) | Relative effect | No of Participants | Quality of the evidence | Comments | |
| Assumed risk | Corresponding risk | |||||
| Plain non‐adherent dressing | Alginate dressing | |||||
| Time to healing | See comment | See comment | Not estimable | 0 | See comment | Assessment of time to healing mentioned in RCT report, but estimates not provided. |
| Proportion of participants with healed ulcers | Study population1 | RR 1.08 | 60 | ⊕⊝⊝⊝ | ||
| 800 per 1000 | 864 per 1000 | |||||
| Low1 | ||||||
| 311 per 1000 | 336 per 1000 | |||||
| High1 | ||||||
| 696 per 1000 | 752 per 1000 | |||||
| Mean change in wound size, with adjustment for baseline size | See comment | See comment | Not estimable | 0 | See comment | Outcome not reported. |
| Adverse effects | See comment | See comment | Not estimable | 0 | See comment | Outcome not reported. |
| Health‐related quality of life | See comment | See comment | Not estimable | 0 | See comment | Outcome not reported. |
| *The basis for the assumed risk (e.g. the median control group risk across studies) is provided in footnotes. The corresponding risk (and its 95% confidence interval) is based on the assumed risk in the comparison group and the relative effect of the intervention (and its 95% CI). | ||||||
| GRADE Working Group grades of evidence | ||||||
| 1 Note: lower risk of the outcome is less favourable (i.e. lower risk of healing) than higher risk. Estimates for baseline low and high risks of healing at 90 days have been taken from a meta‐analysis of compression RCTs. The low risk estimate is based on a subset of participants with larger baseline ulcer surface area (greater than 5 cm squared). The high risk estimate is based on a subset of participants with smaller baseline ulcer surface area (5 cm squared or smaller). Most participants received a simple, low‐adherent dressing plus four‐layer bandage (O'Meara 2007). | ||||||
Background
For definitions of terminology see Glossary (Appendix 1).
Description of the condition
Venous leg ulcers are a common and recurring type of chronic or complex wound. They are usually caused by venous insufficiency (impaired venous blood flow) brought about by venous hypertension. Predisposing factors for venous hypertension include a history of deep vein thrombosis (DVT), thrombophlebitis, leg trauma, arthritis, obesity, pregnancy and a sedentary lifestyle. These factors can result in damage to the valves in the leg veins allowing pathological two‐way blood flow instead of the normal one‐way movement. A related issue is diminished calf muscle pump action. Both valvular and calf muscle pump impairment can result in reduced venous blood flow leading to venous hypertension. This causes distension of the leg veins, oedema (swelling due to fluid accumulation) of the lower limb and leakage of circulatory fluids from the capillaries into the surrounding tissues. This in turn induces irritation and increased fragility of the epidermis (the outer layer of skin) leading to ulceration (Doughty 2007). The duration of venous leg ulceration ranges from a matter of weeks to more than 10 years, and some people never heal (Moffatt 1995; Ruckley 1998; Vowden 2009a). Older patient age, longer wound duration and larger ulcer surface area have been reported as independent risk factors for delayed ulcer healing (Gohel 2005; Margolis 2004).
A review of 11 venous leg ulceration prevalence studies conducted in Australia and Europe estimated point prevalence as 0.1% to 0.3% (Nelzen 2008). Surveys undertaken in the UK estimated prevalence of venous leg ulceration as 0.023% in Wandsworth, London (Moffatt 2004), 0.044% in Hull and East Yorkshire (Srinivasaiah 2007), 0.039% in Bradford and Airedale (Vowden 2009a; Vowden 2009b), and 0.029% in Leeds (Hall 2014). The lower estimates reported in the UK surveys relative to the worldwide literature might be explained by differences in disease management or case definition, or both. The epidemiological data have consistently suggested that prevalence increases with age and is higher among women (Graham 2003; Lorimer 2003; Margolis 2002; Moffatt 2004; Vowden 2009a). We were unable to identify contemporary prevalence data for non‐western countries.
Diagnosis of venous leg ulceration can be made according to the appearance and location of the ulcer. Clinical practice guidelines recommend the use of clinical history, physical examination and haemodynamic assessment (SIGN 2010; O'Donnell 2014). The latter typically includes an assessment of arterial supply to the leg using the ankle brachial pressure index (ABPI), measured using a hand‐held Doppler ultrasound scanner. Measuring ABPI in addition to visual inspection, clinical history and physical assessment can aid confirmation of ulcer aetiology (cause). In arterial disease, Doppler might be used to assess the extent of the arterial disease or to confirm the diagnosis. Venous and arterial disease can co‐exist in the same person (SIGN 2010; O'Donnell 2014). An ABPI measurement of greater than 0.8 at rest is generally used to rule out the co‐existence of clinically significant peripheral arterial disease in a leg ulcer that has been diagnosed as being due to venous insufficiency (Moffatt 2007); some sources suggest a more stringent threshold for this purpose (greater than 0.9) (SIGN 2010; O'Donnell 2014).
Leg ulcers are associated with considerable cost to patients and to healthcare providers. Two systematic reviews summarised the literature on health‐related quality of life in patients with leg ulcers (Herber 2007; Persoon 2004). Both included qualitative and quantitative evaluations and reported that presence of leg ulceration was associated with pain, restriction of work and leisure activities, impaired mobility, sleep disturbance, reduced psychological well‐being and social isolation.
The cost of treating an unhealed leg ulcer in the UK has been estimated to be around GBP 1300 per year at 2001 prices (Iglesias 2004). Another evaluation estimated the average cost of treating a venous leg ulcer (based on cost of dressings) as varying between EUR 814 and EUR 1994 in the UK and EUR 1332 and EUR 2585 in Sweden (price year 2002), with higher costs associated with larger and more chronic wounds (Ragnarson Tennvall 2005). This reflected findings from a more recent evaluation conducted in Hamburg, Germany, recruiting 502 community based adult patients with any type of leg ulcer. The total mean annual cost of illness for leg ulcers was estimated as EUR 9060 per patient (price year 2006), taking account of direct, indirect and intangible costs from a societal perspective. Direct costs included all expenses directly related to leg ulcer care (dressings, bandages, topical agents, systemic treatment, diagnostic procedures, clinician fees, in‐patient treatment costs and transport); indirect costs related to loss of productivity; and intangible costs included impact on health‐related quality of life. Estimates ranged from zero cost (i.e. no treatment) to EUR 44,462, with higher costs associated with ulcers with arterial aetiology, larger wound size and no history of wound closure (Augustin 2012). A large part of ulcer treatment cost comprises nursing time. For the financial year 2006‐2007 in Bradford, UK, GBP 1.69 million was spent on dressings and compression bandages and GBP 3.08 million on nursing time (estimates derived from resource use data for all wound types, not just venous leg ulcers) (Vowden 2009c). We were unable to identify additional, contemporary, international cost data.
Description of the intervention
Compression therapy (bandages or stockings) is now considered to be the cornerstone of venous leg ulcer management (Moffatt 2007; O'Meara 2012). Primary wound contact dressings (i.e. dressings in direct contact with the wound bed) are usually applied underneath compression devices. A range of other interventions may be used concurrently with compression, including debriding agents (Davies 2005), vasoactive drugs (Robson 2006), fibrinolytic therapy (Robson 2006), physical therapies (Cullum 2010; Aziz 2015), and topical applications (Robson 2006).
Primary wound contact dressings are applied beneath compression devices with the aim of aiding healing, providing comfort, controlling exudate (the fluid produced by wounds) and helping to prevent bandages and stockings from adhering to the wound bed. The ideal conditions required for wound healing in terms of dressing application are proposed as follows: maintenance of a moist wound environment without risk of maceration (excessive softening of skin because of being constantly wet); avoidance of toxic chemicals, particles or fibres in the dressing fabric; minimisation of number of dressing changes; and maintenance of an optimum pH level (balanced acidity and alkalinity) (BNF 2015).
Several types of wound dressing are available and costs vary (Appendix 2). For example, there can be a six‐fold difference in the UK unit price of a 9.5 cm x 9.5 cm non‐adherent (knitted viscose) dressing compared with a 10 cm x 10 cm calcium alginate dressing (BNF 2015).
Alginate dressings are available as flat, freeze‐dried porous sheets, or as flexible fibre dressings (e.g. packing tape), designed for packing cavity wounds. The base constituents include calcium alginate or calcium sodium alginate, derived from brown seaweed. Alginate dressings are designed to form a soft gel once in contact with wound exudate. Purported benefits of alginate dressings include high absorbency of fluid from moderately to heavily exuding wounds and the ability to maintain a moist wound environment, thereby promoting autolytic debridement (the body's own process of breaking down dead tissue lying on top of the wound bed). Calcium ions present in the dressings help to control bleeding by aiding blood clotting; a potential disadvantage is that blood clots may cause the dressing to adhere to the wound surface. Alginate dressings are designed to function most effectively in a moist environment, and are not suitable for use with dry wounds, or those covered with hard, necrotic tissue; heavy bleeding is a contraindication to use (BNF 2015; Boateng 2008). In the UK, alginate dressings are common to many wound care formularies, where they are often recommended for the management of wounds with moderate to high amounts of exudate.
Examples of alginate dressings currently available in the UK include Algosteril® (Smith and Nephew) and Tegaderm® Alginate (3M). Appendix 2 provides a description of all wound dressings categorised by the British National Formulary (BNF 2015).
How the intervention might work
Findings from research based on animal models suggest that acute wounds heal more quickly if the wound surface is kept moist in order to prevent the formation of a hard scab or eschar. A moist environment is also thought to provide optimal conditions for promoting autolytic debridement, which is sometimes considered to be an important part of the healing pathway (König 2005). It has been suggested that alginate dressings may control bleeding, manage exudate, promote autolytic debridement, provide a moist wound healing environment and promote healing (BNF 2015; Boateng 2008).
Why it is important to do this review
Wound dressings are a key part of the treatment pathway when caring for venous leg ulcers. Most will be used in combination with compression systems and guidelines are necessary to help make decisions regarding the value and best use of available dressings. Several types of wound dressing are available, and costs vary considerably. However, the evidence base to guide dressing choice is sparse. A previous systematic review evaluating different wound dressings for venous leg ulcers concluded that the type of dressing applied beneath compression did not influence ulcer healing (Palfreyman 2007). The authors concluded that there was insufficient evidence to permit firm recommendations for the use of alginate dressings compared with other dressings.
This review updates part of the previous systematic review by Palfreyman 2007 and is one of several Cochrane reviews investigating the use of dressings in the treatment of venous leg ulcers (O'Meara 2013; Ribeiro 2013; Ribeiro 2014).
Objectives
The primary objective of this review was to determine the effects of alginate dressings compared with alternative dressings, non‐dressing treatments or no dressing, with or without concurrent compression therapy, on the healing of venous leg ulcers. Secondary objectives were to determine the effects of alginate dressings compared with alternatives on: health‐related quality of life, costs (e.g. cost‐effectiveness estimations), pain (e.g. at dressing change), debridement, haemostasis (control of bleeding), dressing performance (management of wound exudate and ease of removal) and adverse effects (e.g. infection, eczema, maceration).
Methods
Criteria for considering studies for this review
Types of studies
We included randomised controlled trials (RCTs), either published or unpublished, that evaluated the effects of any type of alginate dressing in the treatment of venous ulcers, irrespective of language of report. RCTs reported in abstract form only were eligible for inclusion, provided adequate information was either presented in the abstract or available from the trial author. Studies using quasi‐randomisation were excluded.
Types of participants
We considered RCTs recruiting people described in the primary report as having venous leg ulcers, managed in any care setting, to be eligible for inclusion. As the method of diagnosis of venous ulceration may vary, we accepted definitions as used in the RCTs. We included RCTs recruiting samples that comprised people with venous leg ulcers and people with other types of wounds (e.g. arterial ulcers, diabetic foot ulcers) if the results for people with venous ulcers were presented separately (or available from the trial authors), or if the majority of participants (75% or more in each arm) had leg ulcers of venous aetiology.
Types of interventions
The primary intervention of interest was alginate wound dressings. For ease of comparison, we grouped included RCTs according to the comparator intervention using categories presented in the British National Formulary (BNF 2015). We have reported generic names for all products where possible, also providing trade names and manufacturers, where available. However, it is important to note that manufacturers and distributors of dressings may vary from country to country, and dressing names may also differ. We have not included RCTs assessing alginate dressings impregnated with antibiotic, antiseptic or analgesic agents as these interventions are evaluated in other Cochrane reviews (Briggs 2012; O'Meara 2014). RCTs evaluating foam dressings, hydrocolloid dressings and hydrogels are covered in other Cochrane reviews (O'Meara 2013; Ribeiro 2013; Ribeiro 2014) and were included in this review only if they involved a comparison with an alginate dressing.
We included any RCT in which the presence or absence of an alginate dressing was the only systematic difference between treatment groups; and in which an alginate dressing was compared with other wound dressings (including alternative alginate dressings), non‐dressing treatments (for example, topical applications) or no dressing. We included RCTs of alginate dressings, irrespective of whether compression was reported as a concurrent therapy.
Types of outcome measures
Primary outcomes
The primary outcome for the review was wound healing. Wound healing is measured and reported by trial authors in many different ways, including time to complete wound healing, the proportion of wounds healed during follow‐up, change in wound size and rate of change in wound size. For this review, we regarded RCTs that reported one or more of the following as providing the best measures of outcome in terms of relevance and rigour:
-
time to complete wound healing (correctly analysed using censored data and preferably with adjustment for prognostic covariates such as baseline size);
-
the proportion of ulcers healed during follow‐up (frequency of complete healing);
-
and change (and rate of change) in wound size, with adjustment for baseline size.
We considered evidence from RCTs that reported mean or median time to healing without survival analysis (i.e. they regarded time to healing as a continuous measure without censoring), and those that reported change or rate of change in wound size without adjustment for baseline size, as less rigorous assessments of these outcomes. Data reported in this manner have not been used to populate the 'Summary of findings' tables.
Secondary outcomes
The secondary outcomes for the review were:
-
health‐related quality of life (measured using a validated standardised generic questionnaire such as EQ‐5D, SF‐36, SF‐12 or SF‐6 or validated disease‐specific questionnaire) preferably with follow‐up estimates adjusted for baseline scores;
-
costs (including cost or cost‐effectiveness estimations as well as measurements of resource use such as number of dressing changes, dressing wear time and nurse time);
-
pain (e.g. at dressing change, in between dressing changes or over the course of treatment);
-
debridement (e.g. measured as percentage of sloughy or necrotic material remaining on the wound bed);
-
haemostasis (control of bleeding);
-
dressing performance (exudate management and ease of removal/adherence to the wound bed); and
-
rates of adverse events together with descriptions (e.g. infection, eczema, maceration).
Search methods for identification of studies
Electronic searches
In March 2015, for this first update, we searched the following electronic databases for potentially relevant RCTs:
-
The Cochrane Wounds Group Specialised Register (searched 4 March 2015);
-
The Cochrane Central Register of Controlled Trials (CENTRAL) (The Cochrane Library 2015, Issue 2);
-
Ovid MEDLINE (1946 to 3 March 2015);
-
Ovid MEDLINE (In‐Process & Other Non‐Indexed Citations searched 3 March 2015);
-
Ovid EMBASE (1980 to 3 March 2015);
-
EBSCO CINAHL (1982 to 4 March 2015)
We used the following search strategy in the Cochrane Central Register of Controlled Trials (CENTRAL):
#1 MeSH descriptor Alginates explode all trees
#2 (alginate* or activheal or algisite or algosteril or curasorb or kaltostat or melgisorb or seasorb or sorbalgon or sorbsan or suprasorb a or tegaderm or tegagel or urgosorb):ti,ab,kw
#3 (#1 OR #2)
#4 MeSH descriptor Leg Ulcer explode all trees
#5 ((varicose NEXT ulcer*) or (venous NEXT ulcer*) or (leg NEXT ulcer*) or (stasis NEXT ulcer*) or (crural NEXT ulcer*) or "ulcus cruris" or "ulcer cruris"):ti,ab,kw
#6 (#4 OR #5)
#7 (#3 AND #6)
We adapted this strategy to search Ovid MEDLINE, Ovid EMBASE and EBSCO CINAHL (Appendix 3). We combined the Ovid MEDLINE search with the Cochrane Highly Sensitive Search Strategy for identifying randomised trials in MEDLINE: sensitivity‐ and precision‐maximising version (2008 revision) (Lefebvre 2011). We combined the EMBASE search with the Ovid EMBASE filter developed by the UK Cochrane Centre (Lefebvre 2011). We combined the CINAHL searches with the trial filters developed by the Scottish Intercollegiate Guidelines Network (SIGN 2014). We did not restrict searches with respect to language or date of publication.
We searched for ongoing RCTs in the following clinical trial registries using the search term 'leg ulcer':
-
World Health Organization International Trial Registry Platform (http://www.who.int/ictrp/en/);
-
ISRCTN (International Standard Randomised Controlled Trial Number) register (http://www.controlled‐trials.com/);
-
ClinicalTrials.gov (http://www.clinicaltrials.gov).
All registries were accessed on 1st August 2012 for the original review and on 17th July 2015 for this update.
Searching other resources
We attempted to contact trial authors to obtain unpublished data and other information as required. For the first version of this review, we contacted manufacturers to request information about ongoing or unpublished RCTs (for a list of manufacturers see Appendix 4). We also examined the reference lists of eligible RCTs and relevant review articles.
Data collection and analysis
Selection of studies
Two review authors independently assessed the titles and abstracts for relevance. After this initial assessment, we obtained the full text of all RCT reports felt to be potentially relevant. Two review authors then independently checked the full papers for eligibility, with all disagreements resolved by discussion. We recorded all reasons for exclusion.
We have presented our study selection process as a PRISMA (Preferred Reporting Items for Systematic Reviews and Meta‐Analyses) flow diagram (Liberati 2009) (Figure 1).

Flow diagram of the trial selection process.
Data extraction and management
We extracted and summarised details of the eligible RCTs using a standardised data extraction form (Appendix 5). We extracted the data from RCT reports using an Excel spreadsheet designed to capture the RCT information detailed below. Initially, we piloted the spreadsheet with a sample of eligible RCTs, to explore any issues that might arise in relation to the data extraction process. We expanded and amended the spreadsheet as necessary after the piloting process. Two review authors performed independent data extraction of all included RCTs after which both data extractions were compared for agreement. We resolved any disagreements by discussion. If data were missing from reports we attempted to contact the trial authors to obtain the missing information. We included RCTs published as duplicate reports (parallel publications) once, using all associated RCT reports to extract the maximum amount of information, but ensuring that data were not duplicated in the review. We extracted the following information:
-
trial authors;
-
year of publication;
-
country where trial was undertaken;
-
setting of care;
-
trial design details (e.g. pragmatic, pilot);
-
ethical approval;
-
participant consent;
-
unit of investigation – participant, leg or ulcer;
-
overall sample size and methods used to estimate statistical power (relates to the target number of participants to be recruited, the clinical difference to be detected and the ability of the RCT to detect this difference);
-
participant selection criteria;
-
number of participants randomised to each treatment arm;
-
baseline characteristics of participants per treatment arm (gender, age, baseline ulcer area, ulcer duration, prevalence of co‐morbidities such as diabetes, prevalence of clinically infected wounds or colonised wounds, previous history of ulceration, baseline levels of wound exudate, and participant mobility);
-
details of the dressing/treatment regimen prescribed for each arm including details of any concomitant therapy, for example, compression;
-
duration of treatment;
-
duration of follow‐up;
-
statistical methods used for data analysis;
-
primary and secondary outcomes measured;
-
primary and secondary outcome data by treatment arm;
-
adverse effects of treatment (per treatment arm with numbers and type);
-
withdrawals (per treatment arm with numbers and reasons); and
-
source of trial funding.
Assessment of risk of bias in included studies
Two review authors independently assessed each included RCT report using The Cochrane Collaboration tool for assessing risk of bias (Higgins 2011). This tool addresses specific domains, namely: sequence generation, allocation concealment, blinding of participants and personnel, blinding of outcome assessment, incomplete outcome data and selective outcome reporting (see Appendix 6 for details of the criteria on which judgements were based). For blinded outcome assessment we made separate judgements for primary and secondary outcomes. As assessment of healing (the primary outcome) is likely to be subject to potential observer/measurement bias, blinding of outcome assessment is important. Similarly we made separate judgements for primary and secondary outcomes for the domain of incomplete outcome data. In order to assess selective outcome reporting, we sought protocols for all included RCTs. Where protocols were unavailable, we made a judgement based on congruence of information in methods and results sections of reports of RCTs. We classified RCTs as being at overall high risk of bias if they were rated as 'high' for any one of three key domains (allocation concealment, blinding of outcome assessors and completeness of outcome data).
We have presented our assessment of risk of bias findings using 'Risk of bias' figures (Figure 2 is a summary of information across all included RCTs and Figure 3 shows a cross‐tabulation of each individual RCT with each risk of bias item). This display of internal validity indicates the weight the reader may give the results of each RCT.

Risk of bias graph: review authors' judgements about each risk of bias item presented as percentages across all included trials.
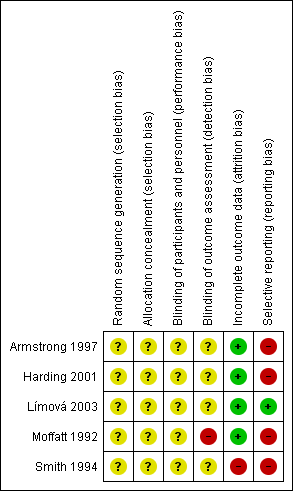
Risk of bias summary: review authors' judgements about each risk of bias item for each included trial.
Measures of treatment effect
We reported estimates for dichotomous outcomes (e.g. number of ulcers healed) as risk ratio (RR) with associated 95% confidence interval (CI). We reported estimates for continuous data outcomes (e.g. absolute or relative change in ulcer area and healing rate) as mean difference (MD) with 95% CI. We planned to report estimates of time to healing and hazard ratios where available. Where RCTs reported adverse events in sufficient detail (e.g. the number of participants who experienced at least one adverse event) we analysed these data as dichotomous. Where adverse events were reported as dressing‐related we planned to analyse these data separately. We calculated measures of effect using Cochrane RevMan software (version 5.1) (RevMan 2014). We reported data narratively as provided in the RCT reports, without additional estimation of treatment effect, in the following instances:
-
where time to healing estimates were based on non‐censored data;
-
where count data were provided (e.g. where the denominator was the total number of adverse events or total number of dressing changes per group);
-
and where it was unclear whether the denominator was the total number of events (such adverse events or dressing changes) or the number of participants.
Unit of analysis issues
We recorded whether RCT reports specified participants, limbs or ulcers as the units of allocation and analysis. In cases where multiple limbs or ulcers on the same individual were studied, we planned to note whether the trial authors' analysis was appropriate (i.e. correctly taking account of highly correlated data) or inappropriate (i.e. considering outcomes for multiple ulcers on the same participant as independent). Where the number of wounds appeared to be equal to the number of participants, we have assumed that the ulcer was the unit of analysis, unless otherwise stated.
Dealing with missing data
Missing data are a common problem in RCTs. Excluding randomised participants from the analysis, or ignoring those lost to follow‐up, can compromise the process of randomisation and introduce bias. Where RCTs reported the outcome of complete healing only for participants who completed the RCT (i.e. participants withdrawing and lost to follow‐up were excluded from the analysis), we treated the excluded participants as if their wound did not heal (that is, they were included in the denominator but not the numerator). Where results were reported for participants who completed the RCT without specifying the numbers initially randomised per group, we presented complete case data. For other outcomes we presented data for all participants randomised where reported; otherwise we based our estimates on complete case data.
Assessment of heterogeneity
We considered clinical heterogeneity (that is the degree to which RCTs vary in terms of participant, intervention and outcome characteristics) and statistical heterogeneity. We assessed statistical heterogeneity using the Chi² test (a significance level of P < 0.10 was considered to indicate statistically significant heterogeneity) in conjunction with the I² statistic (Higgins 2003). The I² statistic examines the percentage of total variation across RCTs that is due to heterogeneity rather than chance (Higgins 2003). We considered that I² values of 40%, or less, indicated a low level of heterogeneity, and values of 75%, or more, indicated very high heterogeneity (Deeks 2011).
Assessment of reporting biases
Reporting biases arise when the dissemination of research findings is influenced by the nature and direction of results. Publication bias is one of a number of possible causes of 'small study effects', that is, a tendency for estimates of the intervention effect to be more beneficial in smaller RCTs. Funnel plots allow a visual assessment of whether small study effects may be present in a meta‐analysis. A funnel plot is a simple scatter plot of the intervention effect estimates from individual RCTs against some measure of each trial’s size or precision (Sterne 2011). We planned to present funnel plots for meta‐analyses comprising 10 RCTs or more using RevMan 5.1.
Data synthesis
We have presented a narrative synthesis of all included RCTs, with results grouped according to type of comparator (e.g. foam dressings compared with alginates, hydrocolloids compared with alginates). We undertook statistical pooling of outcome data on groups of RCTs with available data and considered to be sufficiently similar in terms of design and characteristics of participants, interventions and outcomes. The decision to undertake meta‐analysis depended on the availability of outcome data and assessment of heterogeneity. For comparisons where there was no apparent clinical heterogeneity and the I² value was 40%, or less, we applied a fixed‐effect model. Where there was no apparent clinical heterogeneity and the I² value was over 40%, we planned to apply a random‐effects model. However, we planned not to pool data where heterogeneity was very high (I² values of 75% or above).
For dichotomous outcomes we have presented the summary estimate as a risk ratio (RR) with 95% CI. Where continuous outcomes were measured in the same way across RCTs, we planned to present a pooled mean difference (MD) with 95% CI; we planned to pool standardised mean difference (SMD) estimates where RCTs measured the same outcome using different methods. For time to event data, we planned to plot (and, if appropriate, pool) estimates of hazard ratios and 95% CIs as presented in the RCT reports using the generic inverse variance method in RevMan 5.1. Where hazard ratios were not reported we planned to extrapolate estimates, where possible, using other reported data (Parmar 1998). Pooled estimates of treatment effect were obtained using Cochrane RevMan software (version 5.1) (RevMan 2014).
'Summary of findings' tables
We have presented the main results of the review in 'Summary of findings' tables. These tables present key information concerning the quality of the evidence, the magnitude of the effects of the interventions examined, and the sum of the available data for the main outcomes (Schünemann 2011a). The 'Summary of findings' tables also include an overall grading of the evidence related to each of the main outcomes using the GRADE (Grades of Recommendation, Assessment, Development and Evaluation) approach. The GRADE approach defines the quality of a body of evidence as the extent to which one can be confident that an estimate of effect or association is close to the true quantity of specific interest. The quality of a body of evidence involves consideration of within‐trial risk of bias (methodological quality), directness of evidence, heterogeneity, precision of effect estimates and risk of publication bias (Schünemann 2011b). We planned to present the following outcomes in the 'Summary of findings' tables:
-
time to complete ulcer healing where analysed using appropriate survival analysis methods;
-
proportion of ulcers completely healing during the trial period;
-
change in wound size, when adjusted for baseline size;
-
adverse events; and
-
health‐related quality of life.
Subgroup analysis and investigation of heterogeneity
We planned to conduct a subgroup analysis for complete healing according to whether compression was used as a concurrent treatment, excluding any RCTs in which use of compression was unclear.
Sensitivity analysis
We planned two sensitivity analyses for the outcome of complete healing: one where RCTs classified as being at overall high risk of bias were excluded; and one where RCTs that possibly, or definitely, reported outcomes only for participants who completed the trial were excluded.
Results
Description of studies
See Characteristics of included studies; Characteristics of excluded studies.
Results of the search
The total number of records identified from the search strategy is 569; the breakdown in relation to the original review and this update is as follows. For the original review, the search strategy generated 293 records in total. Of these, 114 were retrieved from electronic bibliographic databases, 174 from registers of ongoing trials, and five from examination of reference lists. No references were obtained as a result of contact with wound dressing manufacturers (Appendix 4). Two manufacturers out of 11 contacted confirmed that there were no ongoing or recently completed RCTs of alginate dressings; no replies were received from the remainder. Two hundred and fifty‐three records were excluded because of irrelevance on the basis of information in titles and abstracts or records of ongoing trials (all records of ongoing trials were deemed irrelevant). Forty records were retrieved as full text reports (all were published). Following assessment of full text reports against the review's study selection criteria, 31 were excluded that reported 21 unique studies. Five RCTs (described in nine full text reports) were included in the review (see next section for further details). No studies were classified as awaiting assessment, or ongoing.
Reasons for exclusion of full text reports (21 unique studies) were as follows:
-
seven did not undertake a relevant comparison (Capillas Pérez 2000; de la Brassinne 2006; Límová 2002; Romanelli 2008; Romero‐Cerecero 2012; Sibbald 2005; Wild 2010);
-
five indicated that the dressing was not the only systematic difference between the treatment groups (Bull 1996; Dmochowska 1999; Schulze 2001; Scurr 1994; Stacey 1997);
-
four were reported as abstracts with limited information, and the full RCT report was not available (Chaloner 1992; Kammerlander 2000; Mulder 1995; Petres 1994);
-
four studies were not RCTs (Anonoymous 1997; Kordestani 2008; Moody 1991; Thomas 1989);
-
and one was an animal study (Barnett 1987).
See Characteristics of excluded studies for further information.
For this first review update, database searching generated 13 records. All were excluded after screening titles and abstracts. Two hundred and sixty three records were identified from registers of ongoing trials; all were irrelevant to the review.
The study selection process in shown in Figure 1.
Included studies
Five RCTs (295 participants) were included (Armstrong 1997; Harding 2001; Límová 2003; Moffatt 1992; Smith 1994). One was undertaken in the USA (Límová 2003), one in France and the UK (Armstrong 1997), and the remaining three solely in the UK (Harding 2001; Moffatt 1992; Smith 1994). Three were multicentre RCTs (Armstrong 1997; Harding 2001; Límová 2003). One RCT was described as a pilot study (Moffatt 1992). The included RCTs were reported between 1992 and 2003.
Sample sizes ranged from 20 participants to 131 participants. Only one RCT reported performing a sample size calculation (Harding 2001). The participant was the unit of randomisation and analysis in all five RCTs.
Where reported, the mean age of participants ranged from 73.1 years to 76.6 years. One RCT did not report on the age of the participants (Smith 1994). The proportion of female participants ranged from 47% to 71%. Only one RCT reported on participant mobility, stating that 55% of participants recruited had limited mobility or were immobile (Armstrong 1997).
With the exception of two RCTs that recruited participants with ulcers of venous, mixed or other aetiology (Armstrong 1997; Harding 2001), all participants had leg ulcers that were of venous aetiology. An ABPI of less than 0.8 was an exclusion criterion in two RCTs (Límová 2003; Moffatt 1992). Where reported, ulcer aetiology was assessed using Doppler or patient history, or both.
The dressing comparisons evaluated by the included RCTs were as follows:
-
one RCT compared one alginate dressing (Tegagen ™ HG) with another (Sorbsan®) (Límová 2003);
-
three RCTs compared hydrocolloid dressings with alginate dressings (Armstrong 1997; Harding 2001; Smith 1994);
-
and one RCT compared a plain non‐adherent dressing with an alginate dressing (Moffatt 1992).
All RCTs reported that all participants received compression therapy as part of the intervention, and so the planned subgroup analysis according to use versus non use of compression as a concurrent treatment with dressings could not be undertaken. Length of treatment was six weeks in three RCTs (Armstrong 1997; Límová 2003; Smith 1994), and twelve weeks in two (Harding 2001; Moffatt 1992). Treatment settings were outpatient clinics, dermatology departments and the community.
All RCTs reported the proportion of ulcers completely healed at the end of treatment. Time to complete ulcer healing was assessed by two RCTs (Harding 2001; Moffatt 1992), and change in ulcer size was assessed by four RCTs (Armstrong 1997; Harding 2001; Límová 2003; Smith 1994).
See Characteristics of included studies for further details.
Risk of bias in included studies
A summary of the risk of bias assessment is presented in Figure 2 and Figure 3.
Allocation
Generation of the randomisation sequence
None of the included RCTs reported a method for generation of the randomisation sequence, and were, therefore, all judged as being at unclear risk of bias for this domain.
Concealment of the allocation process
Two RCTs reported the use of sealed envelopes, but did not report whether these were opaque and sequentially numbered, and were, therefore, judged as being at unclear risk of bias for this domain (Armstrong 1997; Harding 2001). The remaining RCTs did not report on the method of allocation concealment at all, and were also considered as being at unclear risk of bias.
Blinding
Blinding of participants and personnel
Four of the included RCTs were described as ‘open’ but did not provide any statements regarding blinding of participants or study personnel, and were, therefore, judged as being at unclear risk of bias for this domain (Armstrong 1997; Harding 2001; Límová 2003; Smith 1994). The RCT by Moffatt 1992 provided no statement regarding blinding of participants or study personnel, and was also judged at being unclear risk of bias.
Blinding of outcome assessment
Four of the included RCTs did not provide any statement regarding blinding of outcome assessment, and were, therefore, judged as being at unclear risk of bias for this domain (Armstrong 1997; Harding 2001; Límová 2003; Smith 1994). The RCT report by Moffatt 1992 indicated that the outcome assessment was not blinded and was judged to be at a high risk of bias for this domain.
Incomplete outcome data
Three of the included RCTs described analysis on an intention‐to‐treat basis and were considered to be at a low risk of bias for this domain (Armstrong 1997; Harding 2001; Moffatt 1992). One RCT reported that only one participant who left the trial in the first week was not included in the analysis, and was also considered to be at a low risk of bias (Límová 2003). The RCT by Smith 1994 stated that the analyses excluded 12 participants who withdrew from the trial, so was judged to be at a high risk of bias.
Selective reporting
We were unable to obtain any RCT protocols, and so judgements were based on agreement between the methods and results sections of RCT reports. One RCT presented results for all of the outcomes described in the methods section of the report and was classified as being at a low risk of bias (Límová 2003). The remaining RCTs were classified as being at high risk of bias for this domain, for the following reasons.
Armstrong 1997 reported an outcome that was not described in the methods section (seven‐day wear time). Conversely, there were no data reported for two outcomes relating to dressing performance (exudate handling and ease of removal) that were mentioned in the methods section of the secondary reference.
Harding 2001 mentioned that secondary outcomes were assessed by both participants and investigators, but only presented one set of results for which the assessor was not specified. The full range of data were not provided for the outcome of ease of dressing removal, which used a four‐point scale for assessments; only the proportion recorded as 'excellent' was presented.
Moffatt 1992 indicated that time to healing was assessed, but minimal information was presented (no data and no P value).
Smith 1994 described assessing the mean number of dressing changes, but did not report the results as mean values (ranges were provided). Health‐related quality of life was assessed using a five‐point scale but only the proportion of participants reporting the most favourable outcome category was presented at the end of the trial. Similarly, the full range of data for dressing performance outcomes (exudate handling and ease of removal) were not provided.
Overall risk of bias
Two RCTs were considered as being at high risk of bias overall (Moffatt 1992; Smith 1994), and the other three were classified as unclear (Armstrong 1997; Harding 2001; Límová 2003).
Effects of interventions
See: Summary of findings for the main comparison Alginate dressing (Sorbsan®) compared to alternative alginate dressing (Tegagen™ High Gelling) for venous leg ulceration; Summary of findings 2 Alginate dressing compared to hydrocolloid dressing for venous leg ulceration; Summary of findings 3 Alginate dressing compared to plain non‐adherent dressing for venous leg ulceration
Five RCTs that evaluated alginate dressings were included in this review (Armstrong 1997; Harding 2001; Límová 2003; Moffatt 1992; Smith 1994). The results are grouped according to the comparator dressing, starting with alginate dressings compared with alternative alginate dressings (Límová 2003). This is followed by comparisons with hydrocolloid (Armstrong 1997; Harding 2001; Smith 1994), and plain non‐adherent dressings (Moffatt 1992). Details of primary and secondary outcome data are presented in Table 1 and Table 2. Reporting of secondary outcomes was often inadequate, with no presentation of variance estimates or results of tests of statistical significance between treatment groups; where available, we have reported these values below.
| Number of ulcers healed at 6 weeks: Group 1 (hydrocolloid dressing): 6/21 (29%) Group 2 (alginate dressing): 2/23 (9%) P value for between‐group difference not reported. Change in ulcer size – median change in area: Group 1 (hydrocolloid dressing): ‐205 mm2 Group 2 (alginate dressing): ‐162 mm2 The trial authors reported that the between‐group difference was not statistically significant. P value not reported. Change in ulcer size – median percentage change in ulcer area: Group 1 (hydrocolloid dressing): ‐42% Group 2 (alginate dressing): ‐26% The trial authors reported that the between‐group difference was not statistically significant. P value not reported. Review authors' comment: there was a reporting discrepancy between primary and secondary references for this outcome. The respective values in the secondary reference were ‐30.5% and ‐28.1%. | |
| Time to healing days ‐ mean (SD) [median (range)] (analysis based on healed participants only): Group 1 (hydrocolloid dressing): 41.823 days (SD 21.302) [42 (14 to 87)]; n = 17 Group 2 (alginate dressing): 56.588 days (SD 21.569) [56 (14 to 85)]; n = 17 Reported P value for between‐group difference in means = 0.053 P = 0.05 (log rank test) for difference in Kaplan‐Meier survival curves (analysis based on all randomised patients) Number of ulcers healed at 12 weeks: Group 1 (hydrocolloid dressing): 17/66 (26%) Group 2 (alginate dressing): 17/65 (26%) P value for between‐group difference not reported Change in ulcer area mm2 ‐ mean (SD) [median (range)]: Group 1 (hydrocolloid dressing): ‐516.86 mm2 (SD 1202.72) [‐301.13 (‐2494.84 to 5285.82)]; n = 66 Group 2 (alginate dressing): ‐347.30 mm2 (SD 1382.69) [‐132.83 (‐5144.08 to 5946.24)]; n = 65 P value for between‐group difference in means P = 0.48, reported by trial authors. Percentage change in ulcer area – mean (SD) [median (range)]: Group 1 (hydrocolloid dressing): ‐38.18% (SD 92.36) [‐67.67 (374.84 to ‐100.00)]; n = 66 Group 2 (alginate dressing): ‐30.54% (SD 84.08) [‐43.33 (411.74 to ‐100.00)]; n = 65 P value for between‐group difference in means = 0.64, reported by trial authors | |
| Number of ulcers healed at 6 weeks: Group 1 (alginate dressing, Tegagen ™ HG): 0/11 (0%) Group 2 (alginate dressing, Sorbsan®): 2/9 (22%) P value for between‐group difference not reported. Mean percentage change in wound area at 6 weeks: Group 1 (alginate dressing, Tegagen ™ HG): ‐33.7%, n = 10 Group 2 (alginate dressing, Sorbsan®): ‐29.6%, n = 9 The trial authors reported a P value of 0.88 for between‐group difference | |
| Time to healing/number of ulcers healed at 12 weeks: Group 1 (plain non‐adherent dressing): 24/30 (80%) Group 2 (alginate dressing): 26/30 (87%) P value for between‐group difference not reported The trial authors reported that results were similar for cumulative proportions healed estimated using life table analysis (no data or P value for between‐group difference presented) | |
| Number of ulcers healed at 6 weeks: Group 1 (hydrocolloid dressing): 4/22 (18%) Group 2 (alginate dressing): 2/18 (11%) P value for between‐group difference not reported Mean percentage change in ulcer area: Group 1 (hydrocolloid dressing): ‐57.1 Group 2 (alginate dressing): ‐34.9 The trial authors reported that the between‐group difference was not statistically different. P value not reported |
| Mean wear time days: Group 1 (hydrocolloid dressing): 4.112 days Group 2 (alginate dressing): 3.051 days The trial authors reported a between‐group difference of 1.029 days (95% CI 0.385 to 1.672), and that the difference was statistically significant in favour of Group 1 but the P value was not reported. Reviewer authors' comment: the difference in means reported by the trial authors does not follow from the mean values for each group Number participants achieving a 7‐day wear time on at least one occasion: Group 1 (hydrocolloid dressing): 9/21 (43%) Group 2 (alginate dressing): 3/23 (13%) The trial authors reported that the between‐group difference (30%, 95% CI 5% to 55%) was statistically significant but P value not reported Cost to heal one ulcer: Group 1 (hydrocolloid dressing): GBP 237.66 (total direct and indirect costs = GBP 1425.97 for total of 6 wounds healed) Group 2 (alginate dressing): GBP 687.31 (total direct and indirect costs = GBP 1374.61 for total of 2 wounds healed) Cost per wound healed calculated by review authors. Taking into account the number of participants completely healed in each group, the trial authors reported that the cost to achieve a healed wound using the Group 1 dressing was approximately one‐third of the cost of Group 2. Number dressing changes with no pain, mild pain, moderate pain, severe pain, excruciating pain, unable to respond, missing data: Group 1 (hydrocolloid dressing): (total of 192 dressing changes) 144 (75%), 38 (20%), 6 (3%), 2 (1%), 0 (0%), 0 (0%), 2 (1%) Group 2 (alginate dressing): (total of 224 dressing changes) 186 (83%), 29 (13%), 8 (3.5%), 0 (0%), 0 (0)%, 0 (0%), 1 (0.5%) Number of adverse events during the trial: Group 1 (hydrocolloid dressing): 32 adverse events reported during the trial. 4 were related to the primary dressing and 28 to the secondary dressing, of which 8 were attributed to maceration. Group 2 (alginate dressing): 32 adverse events reported during the trial. 3 were related to the primary dressing and 29 to the secondary dressing, of which 9 were attributed to maceration. | |
| Total number of dressing changes: Group 1 (hydrocolloid dressing): 1093 Group 2 (alginate dressing): 1186 Mean wear time days (SD) [median (range)]: Group 1 (hydrocolloid dressing): 3.632 days (1.878) [3 (1 to 13)]; n = 66 Group 2 (alginate dressing): 3.271 days (1.944) [3 (1 to 9)]; n = 65 The trial authors reported that the between‐group difference in means was P value < 0.001 Mean number of dressing changes per healed ulcer: Group 1 (hydrocolloid dressing): 7.4 Group 2 (alginate dressing): 12.1 P value for between‐group difference not reported Mean cost to achieve ulcer healing (based on patients healed): Group 1 (hydrocolloid dressing): GBP 1184.09 (USD 1699.71) Group 2 (alginate dressing): GBP 1200.73 (USD 1723.59) Mean cost per 1cm2 reduction in ulcer size (all patients randomised): Group 1 (hydrocolloid dressing): GBP 59.22 (USD 85.01) Group 2 (alginate dressing): GBP 92.27 (USD 132.46) Mean cost per 10% reduction in ulcer area: Group 1 (hydrocolloid dressing): GBP 80.15 (USD 115.06) Group 2 (alginate dressing): GBP 104.92 (USD 150.62) Percentage of dressing changes associated with no pain: Group 1 (hydrocolloid dressing): 82% Group 2 (alginate dressing): 62% The trial authors reported that the between‐group difference was statistically significant ( P value < 0.001). Numbers of dressings not reported Dressing performance – percentage recording “excellent” for overall ability to contain exudate: Group 1 (hydrocolloid dressing): 44% Group 2 (alginate dressing): 20% Unclear whether denominator was the number of participants or the number of dressing changes. Reported P value for between‐group difference = 0.002 Dressing performance – percentage recording “excellent” for overall ease of dressing removal: Group 1 (hydrocolloid dressing): 51% Group 2 (alginate dressing): 24% Unclear whether denominator was the number of participants or the number of dressing changes. Reported P value for between‐group difference = 0.006 Percentage of dressing changes with some adhesion to the wound bed: Group 1 (hydrocolloid dressing): 38% Group 2 (alginate dressing): 74% The trial authors reported that the between‐group difference was statistically significant (P value < 0.001) Number of dressing changes not reported Review authors' comments: there were some minor discrepancies between numbers in main text and tables for cost information (data from main text were recorded here); discrepancies between primary and secondary references for outcomes of ease of removal and exudate handling (data from primary reference recorded here); unclear whether reported outcomes relating to pain at dressing change, exudate handling, ease of dressing removal and adhesion were rated by participants or investigators (or both). | |
| Total number of dressing changes over the course of the trial: Group 1 (alginate dressing, Tegagen ™ HG): 69 (65 scheduled and 4 unscheduled) Group 2 (alginate dressing, Sorbsan®): 61 (60 scheduled and 1 unscheduled) Mean (SD) comfort score during wear over number of visits: Group 1 (alginate dressing, Tegagen ™ HG): 1.2 (SD 0.35) over 55 visits; n = 10 Group 2 (alginate dressing, Sorbsan®): 2.1 (SD 0.50) over 51 visits; n = 9 The trial authors reported a P value of 0.0005 for the between‐group difference Mean (SD) comfort score during dressing removal over number of visits: Group 1 (alginate dressing, Tegagen ™ HG): 1.2 (SD 0.22) over 55 visits; n = 10 Group 2 (alginate dressing, Sorbsan®): 1.9 (SD 0.19) over 51 visits; n = 9 The trial authors reported a P value of 0.003 for the between‐group difference Percentage of visits where necrotic tissue was observed: Group 1 (alginate dressing, Tegagen ™ HG): 59.7% of 55 visits; n = 10 Group 2 (alginate dressing, Sorbsan®): 68.9% of 51 visits; n = 9 The trial authors reported a P value of 0.57 for the between‐group difference Percentage of visits where debridement was required: Group 1 (alginate dressing, Tegagen ™ HG): 18.7% of 55 visits; n = 10 Group 2 (alginate dressing, Sorbsan®): 40.7% of 51 visits; n = 9 The trial authors reported a P value of 0.18 for the between‐group difference Mean improvement in amount of necrotic tissue (lower score is better): Group 1 (alginate dressing, Tegagen ™ HG): 2.5 over 55 visits; n = 10 Group 2 (alginate dressing, Sorbsan®): 1.5 over 51 visits; n = 9 The trial authors reported a P value of 0.38 for the between‐group difference Mean (SD) exudate absorption score over number of visits (lower score better): Group 1 (alginate dressing, Tegagen ™ HG): 1.3 (SD 0.45) over 55 visits; n = 10 Group 2 (alginate dressing, Sorbsan®): 2.1 (SD 0.48) over 51 visits; n = 9 The trial authors reported a P value of 0.002 for the between‐group difference Percentage of clinic visits with medium or large amount of exudate observed: Group 1 (alginate dressing, Tegagen ™ HG): 71.7% of 55 visits; n = 10 Group 2 (alginate dressing, Sorbsan®): 86.3% of 51 visits; n = 9 The trial authors reported a P value of 0.25 for the between‐group difference Mean (SD) ease of removal score over number of visits (lower is better): Group 1 (alginate dressing, Tegagen ™ HG): 1.1 (SD 0.16) over 55 visits; n = 10 Group 2 (alginate dressing, Sorbsan®): 2.0 (SD 0.56) over 51 visits; n = 9 The trial authors reported a P value of 0.002 for the between‐group difference Proportion of participants reporting dressing adherence to the wound bed: Group 1 (alginate dressing, Tegagen ™ HG): 0% Group 2 (alginate dressing, Sorbsan®): 27.8% The trial authors reported that the average percentage of dressing changes with adherence to the wound bed was significantly less in Group 1 (P value < 0.05). Percentage of clinic visits with observation of peri‐wound skin as macerated, denuded, requiring medication: Group 1 (alginate dressing, Tegagen ™ HG): 36.0%, 9.0%, 31.3% Group 2 (alginate dressing, Sorbsan®): 54.4%, 31.9%, 65.2% Reported P values for between‐group difference: macerated skin P value 0.30; denuded skin P value 0.04, medication required P value 0.07 | |
| None reported | |
| Proportion of participants “improved remarkably” in quality of life at week 6: Group 1 (hydrocolloid dressing): 42.9% Group 2 (alginate dressing): 40.0% The trial authors did not report the number of participants completing the quality of life assessment. P value for between‐group difference not reported. There was a reporting discrepancy between “improved remarkably” and the pre‐defined categories for this outcome (deteriorated markedly, deteriorated somewhat, no change, improved somewhat or improved markedly) Number of dressings used per week: Group 1 (hydrocolloid dressing): 1‐3 Group 2 (alginate dressing): 1‐2 Wear time: The trial authors reported that both dressings were equivalent in terms of wear time, but no data by group or P value for between‐group difference were reported. Mean total approximate cost of materials: Group 1 (hydrocolloid dressing): GBP 431.73 Group 2 (alginate dressing): GBP 364.08 P value for between‐group difference not reported Mean ulcer pain score over past 2 weeks at 6 weeks: Group 1 (hydrocolloid dressing): 1.46 Group 2 (alginate dressing): 2.15 The trial authors reported that the between‐group difference was not statistically significant. P value not reported Change from baseline in mean ulcer pain score over past 2 weeks at 6 weeks: Group 1 (hydrocolloid dressing): ‐3.28 Group 2 (alginate dressing): ‐2.71 Estimated by review authors Mean pain score at dressing change at week 6: Group 1 (hydrocolloid dressing): 1.73 Group 2 (alginate dressing): 2.16 P value for between‐group difference not reported Change from baseline in mean pain score at dressing change at 6 weeks: Not reported and reviewer unable to estimate as data at week 6 only reported (no baseline) Proportion of participants reporting no sleep disturbance due to pain at week 2 and week 6: Group 1 (hydrocolloid dressing): 31.25%, 78.6% Group 2 (alginate dressing): 8.8%, 40.0% The trial authors did not report whether the proportions were for all participants enrolled or only those completing the trial. Reported P value for between‐group difference = 0.0721, but unclear to which time point this refers or if it is for the test across time points Dressing performance (exudate handling): The trial authors reported that the Group 2 dressing was “slightly superior” in terms of ability to contain exudate. However, no data by group or P value for between‐group difference were reported Proportion of participants reporting ‘excellent’ for ease of dressing removal: Group 1 (hydrocolloid dressing): 56.3% Group 2 (alginate dressing): 8.3% The trial authors did not report raw numbers and the denominator was not clear. Reported P value for between‐group difference was < 0.001. The trial authors reported that the Group 2 dressing often needed to be soaked off the ulcer. Number participants experiencing adverse events: Group 1 (hydrocolloid dressing): 5/22 (23%) (withdrawals: pain, 1; ulcer infection, 1; possible allergy, 1; not thought to warrant withdrawal ‐ wound infection, 1; pain and erythema at the final visit, 1) Group 2 (alginate dressing): 6/18 (33%) (withdrawals: pain, 4; ulcer infection, 2) |
We were unable to undertake several of our planned analyses because of a lack of data available. These analyses included plotting and pooling hazard ratio estimates, separate analyses for dressing‐ and non‐dressing‐related adverse events, and assessment of publication bias using funnel plots. Meta‐analyses of continuous data and the planned sensitivity analyses could not be performed for the same reason.
Comparison between different alginate dressings
One RCT that compared different alginate dressings was identified (Límová 2003), and classified as having an unclear overall risk of bias.
Primary outcomes
Proportion of ulcers completely healed
Límová 2003 randomised 20 participants: 11 received a Tegagen ™ high‐gelling (HG) alginate dressing and nine received a Sorbsan® alginate dressing. The potential difference between these dressings was not clear from the RCT report, and there was no stated rationale for comparing them. Product information does not draw attention to any obvious differences (3M Healthcare 2010; SMTL 2002). All participants received a secondary dressing (hydrocolloid), and compression consisting of a paste bandage covered by an elastic cohesive bandage. Participants were assessed every seven days for six weeks, or until the ulcer no longer required the use of an alginate dressing. It should be noted that some participants were recruited with ulcer areas smaller than the size described as eligible for inclusion to the trial (the specified eligible range was 3 cm2 to 100 cm2). The number of ulcers healed at six weeks was 0/11 (0%) in the Tegagen ™ HG group compared with 2/9 (22%) in the Sorbsan® group. The between‐group difference in the proportion of ulcers healed at six weeks was not statistically significant (RR 6.00, 95% CI 0.32 to 111.04) (Analysis 1.1).
Change in ulcer size
The mean percentage change in ulcer area at six weeks was ‐33.7% in the Tegagen ™ HG alginate dressing group compared with ‐29.6% in the Sorbsan® alginate dressing group (Límová 2003).
Secondary outcomes
Costs (resource use): number of dressing changes
Límová 2003 reported that 69 (65 scheduled and four unscheduled) dressing changes occurred in the Tegagen ™ HG alginate dressing group compared with 61 (60 scheduled and one unscheduled) in the Sorbsan® alginate dressing group.
Pain
The between‐group differences in comfort score, both during dressing wear time and at dressing removal, were both statistically significant in favour of the Tegagen ™ HG alginate dressing (score range 1 to 5, lower score better). The respective differences in means were: ‐0.90 (95% CI ‐1.29 to ‐0.51), P value < 0.00001 (Analysis 1.2); and ‐0.70 (‐0.88 to ‐0.52), P value < 0.00001 (Analysis 1.3) (Límová 2003).
Debridement
There were no statistically significant between‐group differences in the percentage of visits where necrotic tissue was observed (Tegagen ™ HG 60%, Sorbsan® 69%, P value 0.57), or in the percentage of visits where debridement was required (19% and 41% respectively, P value 0.18). Improvement in necrotic tissue was measured using a scale of 0 (none) to 5 (100%); mean scores were 2.5 and 1.5 respectively, again with no statistically significant difference observed between treatment groups (P value 0.38) (all P values as reported by trial author) (Límová 2003).
Dressing performance
Límová 2003 reported a statistically significant between‐group difference in favour of Tegagen ™ HG for exudate absorption score (score range 1 to 5, lower score better): difference in means ‐0.80 (95% CI ‐1.22 to ‐0.38), P value 0.0002 (Analysis 1.4). However, the difference between groups for percentage of clinic visits with medium or large amounts of exudate observed was not statistically significant (72% for Tegagen ™ HG, 86% for Sorbsan® (P value 0.25, reported by trial author).
The between‐group difference for ease of dressing removal was in also favour of Tegagen ™ HG (score range 1 to 5, lower score better): difference in means ‐0.90 (95% CI ‐1.28 to ‐0.52), P value < 0.00001 (Analysis 1.5). No participants in the Tegagen ™ HG dressing group reported dressing adherence to the wound, but 28% in the Sorbsan® group did (P value < 0.05, reported by trial author).
Adverse events
There was a statistically significantly lower percentage of clinic visits with observations of denuded peri‐wound skin in the Tegagen ™ HG group than in the Sorbsan® group (9% versus 32%, P value 0.04). However, no statistically significant between‐group differences were observed for visits with observation of maceration or peri‐wound skin requiring medication, respective values being: 36% versus 54% (P value 0.30); and 31% versus 65% (P value 0.07 ‐ all P values as reported by trial author) (Límová 2003).
Comparison between different alginate dressings: summary of results
Evidence from one RCT of overall unclear risk of bias suggested no statistically significant difference between Tegagen ™ HG and Sorbsan® alginate dressings in the proportion of ulcers completely healed at six weeks (Límová 2003). In terms of secondary outcomes, Tegagen ™ HG appeared to be statistically significantly better than Sorbsan® for pain/comfort scores, exudate absorption score, ease of removal, adherence to the wound bed and instances of denuded peri‐wound skin. Groups did not differ for other adverse effects (maceration and requirement for medication for peri‐wound skin) or for outcomes relating to debridement. Costs (in terms of resource use, i.e. number of dressing changes) also appeared to be similar between groups, but data were difficult to interpret because no variance estimate or P value were provided. All data should be interpreted with caution because of the small number of participants recruited (n = 20).
Hydrocolloid dressings compared with alginate dressings
We identified three RCTs that compared hydrocolloid dressings with alginate dressings, one judged to be at high overall risk of bias (Smith 1994), and the other two classified as unclear (Armstrong 1997; Harding 2001).
Primary outcomes
Time to healing
Harding 2001 recruited participants with various types of leg ulcers, but the majority (79%) had venous ulceration. After randomisation, 66 participants received a fibrous hydrocolloid dressing, and 65 an alginate dressing. All participants had an absorbent pad as a secondary dressing and those eligible for compression received orthopaedic padding and a high‐compression elastic bandage. Participants were assessed every seven days for a maximum of 12 weeks, or until the ulcer healed. Time to healing estimates based on healed participants only, generated the following values: mean days to healing were 41.8 (standard deviation (SD) 21.3) for hydrocolloid and 56.6 (SD 21.6) for alginate dressings (P value 0.053); respective median values (ranges) were 42 (14 to 87) and 56 (14 to 85) days. The trial authors mentioned undertaking an analysis of Kaplan‐Meier survival curves based on all randomised participants. The results of this analysis were not presented in full; the log rank test for the difference between curves generated a P value of 0.05.
Proportion of ulcers completely healed
Smith 1994 randomised 40 participants; 22 received a hydrocolloid dressing and 18 an alginate dressing. Compression bandaging was applied to each participant, but no details of the type used were reported. Treatment continued for six weeks, or until the ulcer healed. The number of ulcers healed at six weeks was 4/22 (18%) in the hydrocolloid dressing group compared with 2/18 (11%) in the alginate dressing group.
Armstrong 1997 recruited 44 participants with leg ulcers of different aetiologies, the majority being venous (82%). Twenty‐one participants were randomised to receive a fibrous hydrocolloid dressing and 23 to receive an alginate dressing. All participants received an occlusive hydrocolloid dressing as a secondary dressing and compression (orthopaedic padding followed by a high compression elastic bandage). Participants were assessed on days 14 and 28, and on completion of the trial period. Treatment was for six weeks, or until healing if sooner. At six weeks the number of ulcers healed in the hydrocolloid dressing group was 6/21 (29%) compared with 2/23 (9%) in the alginate dressing group.
When these two RCTs were pooled, no statistically significant between‐group difference was detected: RR 0.42 (95% CI 0.14 to 1.21), Chi2 test for heterogeneity P value 0.53, I2 = 0% (Analysis 2.1, Figure 4).

Forest plot of comparison: 2 Hydrocolloid dressings compared with alginate dressings, outcome: 2.1 Proportion of ulcers healed at 6 and 12 weeks.
In the RCT by Harding 2001, 17 participants (26%) had healed in both groups at 12 weeks: RR 1.02 (95% CI 0.57 to 1.81) (Analysis 2.1, Figure 4).
Change in ulcer size
At six weeks Smith 1994 reported a mean percentage change in ulcer area of ‐57.1% in the hydrocolloid dressing group compared with ‐34.9% in the alginate dressing group. The trial authors reported that the between‐group difference was not statistically different, but the P value was not provided.
At six weeks Armstrong 1997 reported a median change in ulcer area of ‐205 mm2 in the hydrocolloid dressing group compared with ‐162 mm2 in the alginate dressing group. In terms of percentage change in area from baseline, the respective values were ‐42% and ‐26%. The trial authors reported that the between‐group difference was not statistically significant for either outcome, but P values were not provided.
At 12 weeks Harding 2001 reported a mean change in ulcer area of ‐516.86 (SD 1202.72) mm2 in the hydrocolloid dressing group compared with ‐347.30 (SD 1382.69) mm2 in the alginate dressing group. The between group difference in means was not statistically significant: MD ‐169.56 (95% CI ‐613.61 to 274.49) (Analysis 2.2). In terms of percentage change in area from baseline, the finding was similar with mean respective values being ‐38.18% (SD 92.36) and ‐30.54 (SD 84.08), generating MD ‐7.64% (95% CI ‐37.88 to 22.60) (Analysis 2.3).
Secondary outcomes
Health‐related quality of life
In one RCT, 42.9% of participants in the hydrocolloid dressing group improved markedly (to the fifth category of a five‐point scale) compared with 40.0% of participants in the alginate dressing group. The trial authors did not report the number of participants completing the quality of life assessment, and the measurement instrument was not specified (Smith 1994).
Costs (resource use): mean wear time/number of dressing changes
Smith 1994 reported that both dressings were equivalent in terms of mean wear time, but no data by group, or P value for the between‐group difference, were reported.
Armstrong 1997 reported a mean wear time of four days in the hydrocolloid group compared with three days in the alginate group, and the number of participants achieving a seven‐day wear time on at least one occasion was 9/21 (43%) and 3/23 (13%) respectively. The between‐group differences for both outcomes were described as statistically significant in the RCT report, but P values were not presented.
During the Harding 2001 trial, the total number of dressing changes was 1093 in the hydrocolloid dressing group compared with 1186 in the alginate group. Respective values for mean number of dressing changes per healed ulcer were 7.4 and 12.1, whilst mean wear times for all ulcers (healed and unhealed) were 3.632 (SD 1.878) and 3.271 (SD 1.944) days. Although the RCT report presented the latter between‐group difference as statistically significant, this was not confirmed by the review authors' calculation in RevMan: (MD 0.36, 95% CI ‐0.29 to 1.02) (Analysis 2.4).
Cost: material costs
Smith 1994 reported on cost of materials used at each dressing change, but did not include nursing time. The mean cost in the hydrocolloid group was GBP 431.73 compared with GBP 364.08 in the alginate group (price year/tariff not provided).
Armstrong 1997 reported a total cost per treatment group to achieve ulcer healing based on material costs (1995 Drug Tariff) and nursing time. The estimated cost to heal one ulcer was GBP 237.66 in the hydrocolloid dressing group compared with GBP 687.31 in the alginate dressing group (values calculated by review authors from information in the RCT report).
Harding 2001 reported a mean cost to achieve ulcer healing based on material costs (2000 Drug Tariff) and nursing time of GBP 1184.09 (USD 1699.71) in the hydrocolloid dressing group compared with GBP 1200.73 (USD 1723.59) in the alginate dressing group.
Pain
Smith 1994 used an 11‐point visual analogue scale, that ranged from 0 (no pain) to 10 (worst possible pain), to assess pain at baseline and at six weeks; both assessments were based on pain experienced during the previous two weeks. In addition, the trial evaluated pain during dressing change. Mean scores at baseline appeared comparable: 4.74 for hydrocolloid and 4.86 for alginate dressing. The changes from baseline at six weeks were ‐3.28 and ‐2.71 respectively (calculated by review authors). The mean scores at dressing change assessed at week six were 1.73 and 2.16, respectively.
In the Armstrong 1997 trial, pain at dressing change was recorded as one of seven categories (i.e. no pain, mild pain, moderate pain, severe pain, excruciating pain, unable to respond, missing data). The proportion of dressing changes across these categories appeared to be similar between treatment groups, the majority of dressing changes were associated with no pain (79%) or mild pain (16%) (Table 2).
Harding 2001 used a four‐point scale, that ranged from 'no pain' to 'severe pain', to assess pain during dressing removal. The percentage of dressing changes associated with no pain was 82% in the hydrocolloid dressing group compared with 62% in the alginate dressing group (trial authors reported P value < 0.001 for the between‐group difference). The trial authors did not provide full data from all parts of the scale, or present raw data (so denominators for calculations were unclear).
Dressing performance: exudate handling
Harding 2001 used a four‐point scale, that ranged from 'poor' to 'excellent', to assess exudate handling. A rating of 'excellent' was given in 44% of instances in the hydrocolloid dressing group compared with 20% in the alginate dressing group, however, it was unclear whether the denominator was the number of participants or the number of dressing changes (P value 0.002 reported by RCT authors for the between‐group difference).
Smith 1994 provided minimal details of assessment of exudate handling performance, and mentioned only that the alginate dressing was 'slightly superior' in terms of ability to contain exudate.
Dressing performance: sticking/adherence
In the Smith 1994 RCT, ease of dressing removal was assessed using a six‐point scale that ranged from 'excellent' to 'awful'. The proportion of participants reporting 'excellent' for ease of dressing removal was 56.3% in the hydrocolloid dressing group compared with 8.3% in the alginate dressing group (trial authors' reported P value for between‐group difference < 0.001). The RCT authors did not report raw numbers, and so it was not clear whether the denominator was the number of participants or number of dressing changes, they also did not provide the findings from the full assessment scale.
Harding 2001 reported a percentage recording of 'excellent' for overall ease of dressing removal of 51% in the hydrocolloid dressing group compared with 24% in the alginate dressing group but did not report if the denominator was the number of participants or the number of dressing changes (reported P value for between‐group difference 0.006). The percentage of dressing changes with some adhesion to the wound bed was 38% in the hydrocolloid dressing group compared with 74% in the alginate dressing group (reported P value for between‐group difference < 0.001).
Adverse events
Smith 1994 reported that the number of participants who experienced the adverse events of pain, allergy, wound infection or erythema was 5/22 (23%) in the hydrocolloid dressing group compared with 6/18 (33%) in the alginate dressing group. The between‐group difference was not statistically significant (RR 1.47, 95% CI 0.53 to 4.03) (Analysis 2.5).
Armstrong 1997 reported 32 adverse events in the hydrocolloid dressing group, four of which were attributed to the primary dressing; 32 adverse events were recorded in the alginates dressing group, with three attributed to the primary dressing. The number of participants experiencing adverse events was not reported.
Hydrocolloid dressings compared with alginate dressings: summary of results
Evidence from one RCT with an overall high risk of bias (Smith 1994), and two with unclear risk of bias (Armstrong 1997; Harding 2001), suggested no difference between hydrocolloid and alginate dressings for any healing outcomes (maximum follow‐up 12 weeks). In terms of secondary outcomes, removal of hydrocolloid dressings was easier, whilst rates of adverse events appeared to be similar between treatment groups. Findings were difficult to interpret for exudate handling and pain (results were conflicting), health‐related quality of life (used unspecified measurement instrument) and costs (no rigorously conducted economic evaluations reported). Interpretation of all secondary outcomes was hampered further by lack of data in terms of variance estimates and P values for tests of between‐group differences. In addition, findings were not always presented across all parts of the various assessment scales used (e.g. pain, exudate handling and ease of removal) and denominators were unclear for some dichotomous outcomes ‐ often because of ambiguity concerning whether the rating was based on numbers of participants, or numbers of events such as dressing changes.
Plain non‐adherent dressings compared with alginate dressings
We identified one RCT that compared plain non‐adherent dressings with alginate dressings; it had an overall high risk of bias (Moffatt 1992).
Primary outcomes
Time to healing and proportion of ulcers completely healed
Moffatt 1992 randomised 60 participants: 30 received a plain non‐adherent dressing and 30 an alginate dressing. All participants were fitted with a graduated compression bandaging system designed to provide 40 mmHg ankle pressure; treatment duration was 12 weeks. The number of ulcers healed at 12 weeks was 24/30 (80%) in the plain non‐adherent dressing group compared with 26/30 (87%) in the alginate dressing group. The between‐group difference was not statistically significant (RR 1.08, 95% CI 0.86 to 1.36) (Analysis 3.1). Analyses relating to time to healing were mentioned briefly, with trial authors stating that the cumulative proportions healed (estimated from life table analysis) were similar to those in the above analysis. This could not be verified from the trial report since no data or P value for the between‐group difference were presented.
Secondary outcomes
None reported.
Plain non‐adherent dressings compared with alginate dressings: summary of results
Evidence from one RCT, with an overall high risk of bias, suggested no statistically significant difference between plain non‐adherent dressings compared with alginate dressings in the proportion of ulcers completely healed at 12 weeks (Moffatt 1992). No secondary outcomes were reported.
'Summary of findings' tables
In order to provide a concise overview and synthesis of the volume and quality of the evidence, we have included a 'Summary of findings' table for each of the dressing comparisons: comparison between different alginate dressings (summary of findings Table for the main comparison); alginate compared with hydrocolloid dressing (summary of findings Table 2); and alginate compared with non‐adherent dressing (summary of findings Table 3). We had planned to include estimates of time to healing, complete healing, change in wound size, adverse events, and change in health‐related quality of life in the 'Summary of findings' tables. Due to limitations of reported data, we were only able to include estimates of complete healing (for all comparisons) and adverse events (for alginate compared with hydrocolloid). Data in the 'Summary of findings' tables suggest that the evidence for all comparisons is of very low quality, meaning that there is much uncertainty around all estimates included. On balance, there is no strong evidence of a benefit of using alginate dressings compared with hydrocolloid or plain low‐adherent dressings for treating venous leg ulcers, and there is no evidence to suggest that one brand of alginate dressing may be better than another.
Discussion
Summary of main results
In this review we included five RCTs that recruited participants with venous leg ulceration (all identified during the original review): one compared different proprietary alginate dressings (Límová 2003), three compared alginate and hydrocolloid dressings (Armstrong 1997; Harding 2001; Smith 1994), and one compared alginate and plain non‐adherent dressings (Moffatt 1992). The primary outcome for the review was wound healing, which could be reported as time to healing, proportion of participants with complete healing, change in wound size and rate of healing. All the included RCTs assessed complete healing, three at six weeks (Armstrong 1997; Límová 2003; Smith 1994), and two at 12 weeks (Harding 2001; Moffatt 1992). Reporting of other healing outcomes varied across RCTs. No statistically significant between‐group differences were detected for any comparison for any healing outcome. Meta‐analysis was feasible for one comparison (alginate and hydrocolloid dressings), with data from two RCTs pooled for complete healing at six weeks: RR 0.42 (95% CI 0.14 to 1.21) (Analysis 2.1; Figure 4).
We included a range of secondary outcomes of potential importance in clinical decision making. These included costs, health‐related quality of life, pain, debridement, haemostasis, dressing performance (management of wound exudate and adherence to the wound bed) and adverse events. Assessment and reporting varied across RCTs; one RCT did not report any secondary outcomes (Moffatt 1992), and there were no evaluations of haemostasis. Interpretation of data was often hindered because of poor reporting of methods and findings. It is possible, however, that hydrocolloid dressings are better than alginate dressings for ease of dressing removal, whereas adverse event profiles and dressing wear times appeared to be similar between groups for the same comparison (Armstrong 1997; Harding 2001; Smith 1994). The rationale for the comparison between two proprietary alginate dressings (Tegagen ™ HG and Sorbsan®) was not stated, and the information available suggests little difference between the two devices. However, Tegagen ™ HG appeared to be superior in terms of some secondary outcomes (pain/comfort, exudate handling, ease of removal and incidence of denuded peri‐wound skin). The two dressings appeared to be similar for other types of adverse effects (including maceration) and debridement. These findings should be viewed with caution because this RCT was very small (20 participants) and so there is much uncertainty around the estimates (Límová 2003).
Overall completeness and applicability of evidence
Participant and intervention characteristics
With regard to confirmation of venous ulcer diagnosis, two RCTs provided no information about methods of ascertainment (Armstrong 1997; Smith 1994), one described using patient history and Doppler (Harding 2001), and the remaining two stated a participant exclusion criterion of ABPI less than 0.8, but did not describe methods of obtaining the measurement (Límová 2003; Moffatt 1992). Three RCTs mentioned presence of moderate or high wound exudate as a participant inclusion criterion (Armstrong 1997; Harding 2001; Límová 2003). Only one RCT reported participant mobility, in which around half of the participants had limited mobility or were immobile (Armstrong 1997). Presence of ulcer infection was an exclusion criterion in two RCTs (Límová 2003; Smith 1994), but was not mentioned in the remaining three RCTs (Armstrong 1997; Harding 2001; Moffatt 1992). The majority of RCTs imposed a limit to the baseline wound size of 10 cm2 or less, to ensure that wound sizes would not exceed the study dressing dimensions (Harding 2001). These factors may limit applicability to clinical practice, where patients with infected wounds ‐ and a wide range of wound sizes ‐ are likely to be encountered. Imbalance of prognostic baseline covariates may have confounded the treatment effect in two RCTs, both comparing alginate and hydrocolloid dressings: Armstrong 1997 reported participants having larger and more chronic ulcers in the alginate group, whilst Smith 1994 indicated larger ulcers in the hydrocolloid group (ulcer duration at baseline not reported). No imbalances were apparent in two other RCTs (Límová 2003; Moffatt 1992), and another did not present any data on ulcer area or duration (Harding 2001).
All of the RCTs included reported the use of compression therapy as part of the intervention, and we were unable to undertake our planned subgroup analysis for the concurrent presence or absence of compression. The type of compression therapy differed across trials, and included orthopaedic padding covered by a high‐compression elastic bandage (Armstrong 1997; Harding 2001), paste bandage plus an elastic cohesive bandage (Límová 2003), and an unspecified bandage system designed to provide graduated compression exerting 40 mmHg at the ankle (Moffatt 1992). The remaining RCT indicated the use of compression, but presented no details about the specific device used (Smith 1994).
It is important to note that this review only identified evidence on alginate dressings compared with alternative alginates, hydrocolloids and non‐adherent dressings: no comparisons were identified with other dressings, for example foam or hydrogel, therefore, some potential data are lacking. In addition, the most recent of the included RCTs was published in 2003 (Límová 2003), which may limit the external validity of this review, if manufacturers have made changes to alginate and comparator dressings in the interim period. No new RCTs were identified during this first review update.
Primary outcomes
Time to healing was assessed in only two of the five included RCTs (Harding 2001; Moffatt 1992), one employed a log rank test to compare survival curves (Harding 2001), and the other analysed this outcome by life table (Moffatt 1992). However, whilst both RCTs suggested that the results for time to healing were similar across groups, Moffatt 1992 reported no outcome data by group, and neither RCT reported the associated P value. One of these RCTs also evaluated this outcome as a mean time to healing (Harding 2001). This analysis approach would only account for those participants whose ulcers healed. Participants whose ulcers did not heal during the trial (censored data) would not have been accounted for by this analysis method, which could result in a biased effect estimate (Deeks 2011). The limited way in which this outcome was analysed and reported impedes any inference regarding the efficacy of alginate dressings in terms of time to healing.
All included RCTs reported the proportion of ulcers healed, enabling us to estimate between‐group differences. The comparison between hydrocolloid dressings and alginate dressings comprised three RCTs (Armstrong 1997; Harding 2001; Smith 1994). For the other two comparisons, estimates were based on a single RCT: Tegagen ™ HG versus Sorbsab alginate dressings (Límová 2003); and alginate versus plain non‐adherent dressings (Moffatt 1992). The follow‐up period was short in all included RCTs (six or 12 weeks).
Four RCTs reported change in wound size; interpretation of this outcome was often hampered by incomplete presentation of data (i.e. lack of variance estimates or P values, or both) (Armstrong 1997; Límová 2003; Smith 1994). One RCT provided sufficient information on absolute and percentage area changes for us to calculate mean differences with associated 95% CIs (Harding 2001). None of the included RCTs reported rate of healing over time.
Secondary outcomes
One RCT reported a health‐related quality of life assessment, but did not clarify the number of participants on which it was based, and presented only the proportion that had achieved the most favourable outcome category of its five‐point scale (Smith 1994). The scale used was an unspecified instrument that was unlikely to be valid and reliable. Whilst outcomes appeared to be similar between groups, no variance estimates or P value for the between‐group differences were reported.
One RCT reported mean cost to heal one ulcer (material costs and nursing costs), but lacked the necessary variance data to estimate a between‐group difference (Harding 2001). The same RCT reported mean wear time with a variance estimate, and we were able to calculate a between‐group difference that indicated no statistically significant difference between alginate and hydrocolloid dressings.
Across the RCTs that reported pain as an outcome, the mode and timing of the assessment was very varied, as was the reporting of data. Estimation of difference in means was feasible for one small RCT (Límová 2003), that indicated that Tegagen ™ HG alginate dressing was statistically significantly better than Sorbsan® alginate dressing in terms of comfort during wear time and dressing removal.
One RCT reported the percentage of visits at which debridement was required and where necrotic tissue was observed, but did not report the numbers of participants concerned (Límová 2003). Haemostasis was not reported by any of the included RCTs.
The included RCTs assessed and reported dressing performance (exudate management and ease of removal/adherence to the wound bed) in a variety of ways. These outcomes were often assessed subjectively and were sometimes reported as count data. Estimation of difference in means was undertaken for one small RCT (Límová 2003), that suggested that Tegagen ™ HG alginate dressing was statistically significantly better than Sorbsan® alginate dressing in terms of exudate absorption and ease of dressing removal.
The reporting of adverse events across the three RCTs that assessed this outcome was disparate (Armstrong 1997; Límová 2003; Smith 1994). In two RCTs it was unclear how many participants experienced adverse events because the denominators were events and assessments (Armstrong 1997; Límová 2003, respectively). Only one report of this outcome permitted an assessment of between‐group difference, which indicated no statistically significant difference between alginate and hydrocolloid dressings (Smith 1994).
Cautious interpretation of secondary outcome data is required because of the subjective nature of many of the assessments. Most of the scales used appear to have been designed solely for the use of the trial and were unlikely to have been demonstrated to be valid and reliable instruments. In addition, poor reporting was common with a lack of data for variance estimates, P values for between group differences, and failure to present the complete set of data for some assessment scales (in some cases only the most favourable outcome category was presented).
Quality of the evidence
Two of the five included RCTs were considered to be at overall high risk of bias, one because some randomised participants had not been accounted for in the analysis (Smith 1994), and the other because the outcome assessment was not blinded (Moffatt 1992). Missing outcome data, due to attrition (drop‐out) during the trial or exclusion of participants from the analysis, can bias the effect estimate, and lack of blinding of participants or healthcare providers can bias the results by influencing outcomes (Higgins 2011). The other three RCTs were classified as having an unclear overall risk of bias (Armstrong 1997; Harding 2001; Límová 2003).
All five included RCTs were published prior to the current CONSORT (Consolidated Standards of Reporting Trials) guidelines (Schulz 2010). Key aspects of best practice in RCT design to minimise bias include a robust randomisation method, concealment of treatment group allocation, blinding of participants and trial personnel, and blinded outcome assessment, all of which should be clearly stated in the RCT report. None of the included RCTs in this review reported the method of generation of the random sequence, or an adequate method of allocation concealment, and there was evidence of selective outcome reporting in four of the five included RCTs.
The 'Summary of findings' tables indicate that the current evidence base for the effects of alginate dressings compared with alternatives on the healing of venous leg ulcers is of very low quality (summary of findings Table for the main comparison; summary of findings Table 2; summary of findings Table 3).
Potential biases in the review process
In addition to the electronic searches of bibliographic databases, the search for evidence for the original review and this first update included: examination of reference lists of eligible RCTs and review articles; contact with trial authors; and ongoing trials registers. During the original review we also contacted manufacturers of alginate dressings. Although this search strategy was comprehensive, the possibility of publication bias cannot be discounted. However, given the low quality of the RCTs identified for inclusion (all were published reports), coupled with the absence of any observed statistically significant treatment effects on ulcer healing, it is unlikely that any additional unpublished data would contribute substantially to the overall findings of this review.
Agreements and disagreements with other studies or reviews
The evidence base to guide dressing choice suggests that there is no evidence to support alginate dressings as being better or worse than other dressing treatments for the healing of venous leg ulcers. This observation is in agreement with the Palfreyman 2007 systematic review, which reported that there was insufficient data available to conclude that any one dressing type was more effective than any other in healing venous leg ulcers. There is some overlap between our review and the Palfreyman 2007 review, with three RCTs common to both (Límová 2003; Moffatt 1992; Smith 1994).

Flow diagram of the trial selection process.

Risk of bias graph: review authors' judgements about each risk of bias item presented as percentages across all included trials.

Risk of bias summary: review authors' judgements about each risk of bias item for each included trial.

Forest plot of comparison: 2 Hydrocolloid dressings compared with alginate dressings, outcome: 2.1 Proportion of ulcers healed at 6 and 12 weeks.

Comparison 1 Tegagen HG alginate dressing compared with Sorbsan alginate dressing, Outcome 1 Proportion of ulcers healed at 6 weeks.
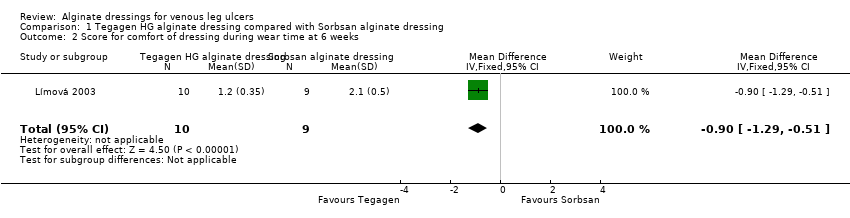
Comparison 1 Tegagen HG alginate dressing compared with Sorbsan alginate dressing, Outcome 2 Score for comfort of dressing during wear time at 6 weeks.

Comparison 1 Tegagen HG alginate dressing compared with Sorbsan alginate dressing, Outcome 3 Score for comfort during dressing removal at 6 weeks.

Comparison 1 Tegagen HG alginate dressing compared with Sorbsan alginate dressing, Outcome 4 Exudate absorption score at 6 weeks.
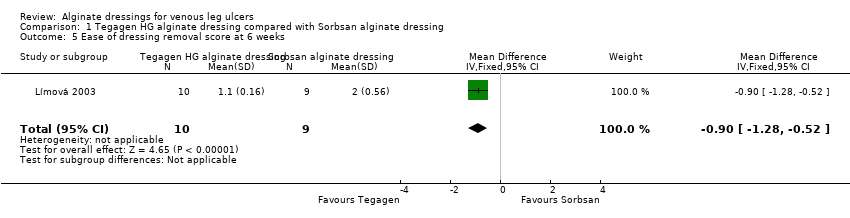
Comparison 1 Tegagen HG alginate dressing compared with Sorbsan alginate dressing, Outcome 5 Ease of dressing removal score at 6 weeks.

Comparison 2 Hydrocolloid dressings compared with alginate dressings, Outcome 1 Proportion of ulcers healed at 6 and 12 weeks.
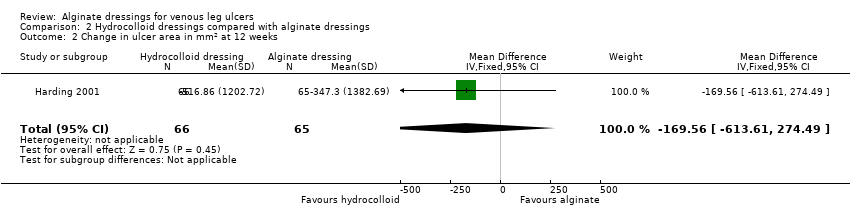
Comparison 2 Hydrocolloid dressings compared with alginate dressings, Outcome 2 Change in ulcer area in mm2 at 12 weeks.
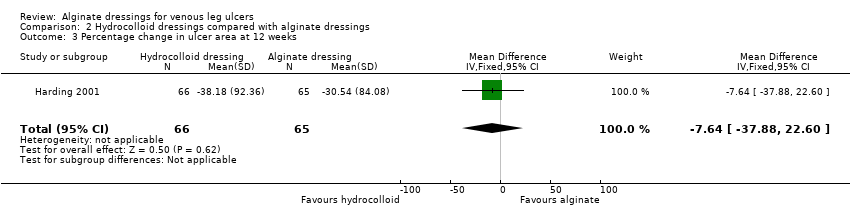
Comparison 2 Hydrocolloid dressings compared with alginate dressings, Outcome 3 Percentage change in ulcer area at 12 weeks.

Comparison 2 Hydrocolloid dressings compared with alginate dressings, Outcome 4 Mean wear time (days).

Comparison 2 Hydrocolloid dressings compared with alginate dressings, Outcome 5 Proportion of participants experiencing adverse events.

Comparison 3 Plain non‐adherent dressings compared with alginate dressings, Outcome 1 Proportion of ulcers healed at 12 weeks.
| alginate dressing (Sorbsan®) compared to alternative alginate dressing (Tegagen ™ High Gelling) for venous leg ulceration | ||||||
| Patient or population: people with venous leg ulceration | ||||||
| Outcomes | Illustrative comparative risks* (95% CI) | Relative effect | No of Participants | Quality of the evidence | Comments | |
| Assumed risk | Corresponding risk | |||||
| Alternative alginate dressing (Tegagen ™High Gelling) | Alginate dressing (Sorbsan®) | |||||
| Time to healing | See comment | See comment | Not estimable | 0 | See comment | Outcome not reported. |
| Proportion of participants with healed ulcers | Study population1 | RR 6.00 | 20 | ⊕⊝⊝⊝ | ||
| Low1 | ||||||
| 91 per 1000 | 546 per 1000 | |||||
| High1 | ||||||
| 204 per 1000 | 1000 per 1000 | |||||
| Mean change in wound size, with adjustment for baseline size | See comment | See comment | Not estimable | 0 | See comment | Outcome not reported (only reported mean percentage change in ulcer area, with no variance estimate, and no adjustment for baseline area). |
| Adverse effects | See comment | See comment | Not estimable | 0 | See comment | Limited information provided. |
| Health‐related quality of life | See comment | See comment | Not estimable | 0 | See comment | Outcome not reported. |
| *The basis for the assumed risk (e.g. the median control group risk across studies) is provided in footnotes. The corresponding risk (and its 95% confidence interval) is based on the assumed risk in the comparison group and the relative effect of the intervention (and its 95% CI). | ||||||
| GRADE Working Group grades of evidence | ||||||
| 1 Note: lower risk of the outcome is less favourable (i.e. lower risk of healing) than higher risk. Estimates for baseline low and high risks of healing at 30 days have been taken from a meta‐analysis of RCTs evaluating different types of compression. The low risk estimate is based on a subset of participants with larger baseline ulcer area (greater than 5 cm squared). The high risk estimate is based on a subset of participants with smaller baseline ulcer surface area (5 cm squared or smaller). Most participants received a simple, low‐adherent dressing plus four‐layer bandage (O'Meara 2007). Estimate of baseline risk could not be estimated from study population because no participants healed in the Tegagen ™ HG group. | ||||||
| alginate dressing compared to hydrocolloid dressing for venous leg ulceration | ||||||
| Patient or population: people with venous leg ulceration | ||||||
| Outcomes | Illustrative comparative risks* (95% CI) | Relative effect | No of Participants | Quality of the evidence | Comments | |
| Assumed risk | Corresponding risk | |||||
| Hydrocolloid dressing | Alginate dressing | |||||
| Time to healing | See comment | See comment | Not estimable | 0 | See comment | One RCT presented time to healing, but did not report a reliable estimate (not based on censored data). |
| Proportion of participants with healed ulcers at 6 weeks | Study population1 | RR 0.42 | 84 | ⊕⊝⊝⊝ | ||
| 233 per 1000 | 98 per 1000 | |||||
| Low1 | ||||||
| 91 per 1000 | 38 per 1000 | |||||
| High1 | ||||||
| 204 per 1000 | 86 per 1000 | |||||
| Proportion of participants with healed ulcers at 12 weeks | Study population | RR 1.02 | 131 | ⊕⊝⊝⊝ | ||
| 258 per 1000 | 263 per 1000 | |||||
| Low | ||||||
| 311 per 1000 | 317 per 1000 | |||||
| High | ||||||
| 696 per 1000 | 710 per 1000 | |||||
| Mean change in wound size, with adjustment for baseline size | See comment | See comment | Not estimable | 0 | See comment | Three RCTs reported change in wound area, but not with baseline adjustment. |
| Proportion of participants experiencing adverse effects at 6 weeks | 227 per 1000 | 334 per 1000 | RR 1.47 | 40 | ⊕⊝⊝⊝ | |
| Health‐related quality of life | See comment | See comment | Not estimable | 0 | See comment | One RCT assessed health‐related quality of life but did not use a validated tool, and only reported percentages of participants who had improved. |
| *The basis for the assumed risk (e.g. the median control group risk across studies) is provided in footnotes. The corresponding risk (and its 95% confidence interval) is based on the assumed risk in the comparison group and the relative effect of the intervention (and its 95% CI). | ||||||
| GRADE Working Group grades of evidence | ||||||
| 1 Note: lower risk of the outcome is less favourable (i.e. lower risk of healing) than higher risk. Estimates for baseline low and high risks of healing at 30 days (and 90 days for the 12 week outcome) have been taken from a meta‐analysis of RCTs evaluating different types of compression. The low risk estimate is based on a subset of participants with larger baseline ulcer area (greater than 5 cm squared). The high risk estimate is based on a subset of participants with smaller baseline ulcer surface area (5 cm squared or smaller). Most participants received a simple, low‐adherent dressing plus four‐layer bandage (O'Meara 2007). | ||||||
| alginate dressing compared to plain non‐adherent dressing for venous leg ulceration | ||||||
| Patient or population: people with venous leg ulceration | ||||||
| Outcomes | Illustrative comparative risks* (95% CI) | Relative effect | No of Participants | Quality of the evidence | Comments | |
| Assumed risk | Corresponding risk | |||||
| Plain non‐adherent dressing | Alginate dressing | |||||
| Time to healing | See comment | See comment | Not estimable | 0 | See comment | Assessment of time to healing mentioned in RCT report, but estimates not provided. |
| Proportion of participants with healed ulcers | Study population1 | RR 1.08 | 60 | ⊕⊝⊝⊝ | ||
| 800 per 1000 | 864 per 1000 | |||||
| Low1 | ||||||
| 311 per 1000 | 336 per 1000 | |||||
| High1 | ||||||
| 696 per 1000 | 752 per 1000 | |||||
| Mean change in wound size, with adjustment for baseline size | See comment | See comment | Not estimable | 0 | See comment | Outcome not reported. |
| Adverse effects | See comment | See comment | Not estimable | 0 | See comment | Outcome not reported. |
| Health‐related quality of life | See comment | See comment | Not estimable | 0 | See comment | Outcome not reported. |
| *The basis for the assumed risk (e.g. the median control group risk across studies) is provided in footnotes. The corresponding risk (and its 95% confidence interval) is based on the assumed risk in the comparison group and the relative effect of the intervention (and its 95% CI). | ||||||
| GRADE Working Group grades of evidence | ||||||
| 1 Note: lower risk of the outcome is less favourable (i.e. lower risk of healing) than higher risk. Estimates for baseline low and high risks of healing at 90 days have been taken from a meta‐analysis of compression RCTs. The low risk estimate is based on a subset of participants with larger baseline ulcer surface area (greater than 5 cm squared). The high risk estimate is based on a subset of participants with smaller baseline ulcer surface area (5 cm squared or smaller). Most participants received a simple, low‐adherent dressing plus four‐layer bandage (O'Meara 2007). | ||||||
| Number of ulcers healed at 6 weeks: Group 1 (hydrocolloid dressing): 6/21 (29%) Group 2 (alginate dressing): 2/23 (9%) P value for between‐group difference not reported. Change in ulcer size – median change in area: Group 1 (hydrocolloid dressing): ‐205 mm2 Group 2 (alginate dressing): ‐162 mm2 The trial authors reported that the between‐group difference was not statistically significant. P value not reported. Change in ulcer size – median percentage change in ulcer area: Group 1 (hydrocolloid dressing): ‐42% Group 2 (alginate dressing): ‐26% The trial authors reported that the between‐group difference was not statistically significant. P value not reported. Review authors' comment: there was a reporting discrepancy between primary and secondary references for this outcome. The respective values in the secondary reference were ‐30.5% and ‐28.1%. | |
| Time to healing days ‐ mean (SD) [median (range)] (analysis based on healed participants only): Group 1 (hydrocolloid dressing): 41.823 days (SD 21.302) [42 (14 to 87)]; n = 17 Group 2 (alginate dressing): 56.588 days (SD 21.569) [56 (14 to 85)]; n = 17 Reported P value for between‐group difference in means = 0.053 P = 0.05 (log rank test) for difference in Kaplan‐Meier survival curves (analysis based on all randomised patients) Number of ulcers healed at 12 weeks: Group 1 (hydrocolloid dressing): 17/66 (26%) Group 2 (alginate dressing): 17/65 (26%) P value for between‐group difference not reported Change in ulcer area mm2 ‐ mean (SD) [median (range)]: Group 1 (hydrocolloid dressing): ‐516.86 mm2 (SD 1202.72) [‐301.13 (‐2494.84 to 5285.82)]; n = 66 Group 2 (alginate dressing): ‐347.30 mm2 (SD 1382.69) [‐132.83 (‐5144.08 to 5946.24)]; n = 65 P value for between‐group difference in means P = 0.48, reported by trial authors. Percentage change in ulcer area – mean (SD) [median (range)]: Group 1 (hydrocolloid dressing): ‐38.18% (SD 92.36) [‐67.67 (374.84 to ‐100.00)]; n = 66 Group 2 (alginate dressing): ‐30.54% (SD 84.08) [‐43.33 (411.74 to ‐100.00)]; n = 65 P value for between‐group difference in means = 0.64, reported by trial authors | |
| Number of ulcers healed at 6 weeks: Group 1 (alginate dressing, Tegagen ™ HG): 0/11 (0%) Group 2 (alginate dressing, Sorbsan®): 2/9 (22%) P value for between‐group difference not reported. Mean percentage change in wound area at 6 weeks: Group 1 (alginate dressing, Tegagen ™ HG): ‐33.7%, n = 10 Group 2 (alginate dressing, Sorbsan®): ‐29.6%, n = 9 The trial authors reported a P value of 0.88 for between‐group difference | |
| Time to healing/number of ulcers healed at 12 weeks: Group 1 (plain non‐adherent dressing): 24/30 (80%) Group 2 (alginate dressing): 26/30 (87%) P value for between‐group difference not reported The trial authors reported that results were similar for cumulative proportions healed estimated using life table analysis (no data or P value for between‐group difference presented) | |
| Number of ulcers healed at 6 weeks: Group 1 (hydrocolloid dressing): 4/22 (18%) Group 2 (alginate dressing): 2/18 (11%) P value for between‐group difference not reported Mean percentage change in ulcer area: Group 1 (hydrocolloid dressing): ‐57.1 Group 2 (alginate dressing): ‐34.9 The trial authors reported that the between‐group difference was not statistically different. P value not reported |
| Mean wear time days: Group 1 (hydrocolloid dressing): 4.112 days Group 2 (alginate dressing): 3.051 days The trial authors reported a between‐group difference of 1.029 days (95% CI 0.385 to 1.672), and that the difference was statistically significant in favour of Group 1 but the P value was not reported. Reviewer authors' comment: the difference in means reported by the trial authors does not follow from the mean values for each group Number participants achieving a 7‐day wear time on at least one occasion: Group 1 (hydrocolloid dressing): 9/21 (43%) Group 2 (alginate dressing): 3/23 (13%) The trial authors reported that the between‐group difference (30%, 95% CI 5% to 55%) was statistically significant but P value not reported Cost to heal one ulcer: Group 1 (hydrocolloid dressing): GBP 237.66 (total direct and indirect costs = GBP 1425.97 for total of 6 wounds healed) Group 2 (alginate dressing): GBP 687.31 (total direct and indirect costs = GBP 1374.61 for total of 2 wounds healed) Cost per wound healed calculated by review authors. Taking into account the number of participants completely healed in each group, the trial authors reported that the cost to achieve a healed wound using the Group 1 dressing was approximately one‐third of the cost of Group 2. Number dressing changes with no pain, mild pain, moderate pain, severe pain, excruciating pain, unable to respond, missing data: Group 1 (hydrocolloid dressing): (total of 192 dressing changes) 144 (75%), 38 (20%), 6 (3%), 2 (1%), 0 (0%), 0 (0%), 2 (1%) Group 2 (alginate dressing): (total of 224 dressing changes) 186 (83%), 29 (13%), 8 (3.5%), 0 (0%), 0 (0)%, 0 (0%), 1 (0.5%) Number of adverse events during the trial: Group 1 (hydrocolloid dressing): 32 adverse events reported during the trial. 4 were related to the primary dressing and 28 to the secondary dressing, of which 8 were attributed to maceration. Group 2 (alginate dressing): 32 adverse events reported during the trial. 3 were related to the primary dressing and 29 to the secondary dressing, of which 9 were attributed to maceration. | |
| Total number of dressing changes: Group 1 (hydrocolloid dressing): 1093 Group 2 (alginate dressing): 1186 Mean wear time days (SD) [median (range)]: Group 1 (hydrocolloid dressing): 3.632 days (1.878) [3 (1 to 13)]; n = 66 Group 2 (alginate dressing): 3.271 days (1.944) [3 (1 to 9)]; n = 65 The trial authors reported that the between‐group difference in means was P value < 0.001 Mean number of dressing changes per healed ulcer: Group 1 (hydrocolloid dressing): 7.4 Group 2 (alginate dressing): 12.1 P value for between‐group difference not reported Mean cost to achieve ulcer healing (based on patients healed): Group 1 (hydrocolloid dressing): GBP 1184.09 (USD 1699.71) Group 2 (alginate dressing): GBP 1200.73 (USD 1723.59) Mean cost per 1cm2 reduction in ulcer size (all patients randomised): Group 1 (hydrocolloid dressing): GBP 59.22 (USD 85.01) Group 2 (alginate dressing): GBP 92.27 (USD 132.46) Mean cost per 10% reduction in ulcer area: Group 1 (hydrocolloid dressing): GBP 80.15 (USD 115.06) Group 2 (alginate dressing): GBP 104.92 (USD 150.62) Percentage of dressing changes associated with no pain: Group 1 (hydrocolloid dressing): 82% Group 2 (alginate dressing): 62% The trial authors reported that the between‐group difference was statistically significant ( P value < 0.001). Numbers of dressings not reported Dressing performance – percentage recording “excellent” for overall ability to contain exudate: Group 1 (hydrocolloid dressing): 44% Group 2 (alginate dressing): 20% Unclear whether denominator was the number of participants or the number of dressing changes. Reported P value for between‐group difference = 0.002 Dressing performance – percentage recording “excellent” for overall ease of dressing removal: Group 1 (hydrocolloid dressing): 51% Group 2 (alginate dressing): 24% Unclear whether denominator was the number of participants or the number of dressing changes. Reported P value for between‐group difference = 0.006 Percentage of dressing changes with some adhesion to the wound bed: Group 1 (hydrocolloid dressing): 38% Group 2 (alginate dressing): 74% The trial authors reported that the between‐group difference was statistically significant (P value < 0.001) Number of dressing changes not reported Review authors' comments: there were some minor discrepancies between numbers in main text and tables for cost information (data from main text were recorded here); discrepancies between primary and secondary references for outcomes of ease of removal and exudate handling (data from primary reference recorded here); unclear whether reported outcomes relating to pain at dressing change, exudate handling, ease of dressing removal and adhesion were rated by participants or investigators (or both). | |
| Total number of dressing changes over the course of the trial: Group 1 (alginate dressing, Tegagen ™ HG): 69 (65 scheduled and 4 unscheduled) Group 2 (alginate dressing, Sorbsan®): 61 (60 scheduled and 1 unscheduled) Mean (SD) comfort score during wear over number of visits: Group 1 (alginate dressing, Tegagen ™ HG): 1.2 (SD 0.35) over 55 visits; n = 10 Group 2 (alginate dressing, Sorbsan®): 2.1 (SD 0.50) over 51 visits; n = 9 The trial authors reported a P value of 0.0005 for the between‐group difference Mean (SD) comfort score during dressing removal over number of visits: Group 1 (alginate dressing, Tegagen ™ HG): 1.2 (SD 0.22) over 55 visits; n = 10 Group 2 (alginate dressing, Sorbsan®): 1.9 (SD 0.19) over 51 visits; n = 9 The trial authors reported a P value of 0.003 for the between‐group difference Percentage of visits where necrotic tissue was observed: Group 1 (alginate dressing, Tegagen ™ HG): 59.7% of 55 visits; n = 10 Group 2 (alginate dressing, Sorbsan®): 68.9% of 51 visits; n = 9 The trial authors reported a P value of 0.57 for the between‐group difference Percentage of visits where debridement was required: Group 1 (alginate dressing, Tegagen ™ HG): 18.7% of 55 visits; n = 10 Group 2 (alginate dressing, Sorbsan®): 40.7% of 51 visits; n = 9 The trial authors reported a P value of 0.18 for the between‐group difference Mean improvement in amount of necrotic tissue (lower score is better): Group 1 (alginate dressing, Tegagen ™ HG): 2.5 over 55 visits; n = 10 Group 2 (alginate dressing, Sorbsan®): 1.5 over 51 visits; n = 9 The trial authors reported a P value of 0.38 for the between‐group difference Mean (SD) exudate absorption score over number of visits (lower score better): Group 1 (alginate dressing, Tegagen ™ HG): 1.3 (SD 0.45) over 55 visits; n = 10 Group 2 (alginate dressing, Sorbsan®): 2.1 (SD 0.48) over 51 visits; n = 9 The trial authors reported a P value of 0.002 for the between‐group difference Percentage of clinic visits with medium or large amount of exudate observed: Group 1 (alginate dressing, Tegagen ™ HG): 71.7% of 55 visits; n = 10 Group 2 (alginate dressing, Sorbsan®): 86.3% of 51 visits; n = 9 The trial authors reported a P value of 0.25 for the between‐group difference Mean (SD) ease of removal score over number of visits (lower is better): Group 1 (alginate dressing, Tegagen ™ HG): 1.1 (SD 0.16) over 55 visits; n = 10 Group 2 (alginate dressing, Sorbsan®): 2.0 (SD 0.56) over 51 visits; n = 9 The trial authors reported a P value of 0.002 for the between‐group difference Proportion of participants reporting dressing adherence to the wound bed: Group 1 (alginate dressing, Tegagen ™ HG): 0% Group 2 (alginate dressing, Sorbsan®): 27.8% The trial authors reported that the average percentage of dressing changes with adherence to the wound bed was significantly less in Group 1 (P value < 0.05). Percentage of clinic visits with observation of peri‐wound skin as macerated, denuded, requiring medication: Group 1 (alginate dressing, Tegagen ™ HG): 36.0%, 9.0%, 31.3% Group 2 (alginate dressing, Sorbsan®): 54.4%, 31.9%, 65.2% Reported P values for between‐group difference: macerated skin P value 0.30; denuded skin P value 0.04, medication required P value 0.07 | |
| None reported | |
| Proportion of participants “improved remarkably” in quality of life at week 6: Group 1 (hydrocolloid dressing): 42.9% Group 2 (alginate dressing): 40.0% The trial authors did not report the number of participants completing the quality of life assessment. P value for between‐group difference not reported. There was a reporting discrepancy between “improved remarkably” and the pre‐defined categories for this outcome (deteriorated markedly, deteriorated somewhat, no change, improved somewhat or improved markedly) Number of dressings used per week: Group 1 (hydrocolloid dressing): 1‐3 Group 2 (alginate dressing): 1‐2 Wear time: The trial authors reported that both dressings were equivalent in terms of wear time, but no data by group or P value for between‐group difference were reported. Mean total approximate cost of materials: Group 1 (hydrocolloid dressing): GBP 431.73 Group 2 (alginate dressing): GBP 364.08 P value for between‐group difference not reported Mean ulcer pain score over past 2 weeks at 6 weeks: Group 1 (hydrocolloid dressing): 1.46 Group 2 (alginate dressing): 2.15 The trial authors reported that the between‐group difference was not statistically significant. P value not reported Change from baseline in mean ulcer pain score over past 2 weeks at 6 weeks: Group 1 (hydrocolloid dressing): ‐3.28 Group 2 (alginate dressing): ‐2.71 Estimated by review authors Mean pain score at dressing change at week 6: Group 1 (hydrocolloid dressing): 1.73 Group 2 (alginate dressing): 2.16 P value for between‐group difference not reported Change from baseline in mean pain score at dressing change at 6 weeks: Not reported and reviewer unable to estimate as data at week 6 only reported (no baseline) Proportion of participants reporting no sleep disturbance due to pain at week 2 and week 6: Group 1 (hydrocolloid dressing): 31.25%, 78.6% Group 2 (alginate dressing): 8.8%, 40.0% The trial authors did not report whether the proportions were for all participants enrolled or only those completing the trial. Reported P value for between‐group difference = 0.0721, but unclear to which time point this refers or if it is for the test across time points Dressing performance (exudate handling): The trial authors reported that the Group 2 dressing was “slightly superior” in terms of ability to contain exudate. However, no data by group or P value for between‐group difference were reported Proportion of participants reporting ‘excellent’ for ease of dressing removal: Group 1 (hydrocolloid dressing): 56.3% Group 2 (alginate dressing): 8.3% The trial authors did not report raw numbers and the denominator was not clear. Reported P value for between‐group difference was < 0.001. The trial authors reported that the Group 2 dressing often needed to be soaked off the ulcer. Number participants experiencing adverse events: Group 1 (hydrocolloid dressing): 5/22 (23%) (withdrawals: pain, 1; ulcer infection, 1; possible allergy, 1; not thought to warrant withdrawal ‐ wound infection, 1; pain and erythema at the final visit, 1) Group 2 (alginate dressing): 6/18 (33%) (withdrawals: pain, 4; ulcer infection, 2) |
| Outcome or subgroup title | No. of studies | No. of participants | Statistical method | Effect size |
| 1 Proportion of ulcers healed at 6 weeks Show forest plot | 1 | 20 | Risk Ratio (M‐H, Fixed, 95% CI) | 6.0 [0.32, 111.04] |
| 2 Score for comfort of dressing during wear time at 6 weeks Show forest plot | 1 | 19 | Mean Difference (IV, Fixed, 95% CI) | ‐0.90 [‐1.29, ‐0.51] |
| 3 Score for comfort during dressing removal at 6 weeks Show forest plot | 1 | 19 | Mean Difference (IV, Fixed, 95% CI) | ‐0.7 [‐0.88, ‐0.52] |
| 4 Exudate absorption score at 6 weeks Show forest plot | 1 | 19 | Mean Difference (IV, Fixed, 95% CI) | ‐0.80 [‐1.22, ‐0.38] |
| 5 Ease of dressing removal score at 6 weeks Show forest plot | 1 | 19 | Mean Difference (IV, Fixed, 95% CI) | ‐0.90 [‐1.28, ‐0.52] |
| Outcome or subgroup title | No. of studies | No. of participants | Statistical method | Effect size |
| 1 Proportion of ulcers healed at 6 and 12 weeks Show forest plot | 3 | 215 | Risk Ratio (M‐H, Fixed, 95% CI) | 0.79 [0.48, 1.31] |
| 1.1 Healed at 6 weeks | 2 | 84 | Risk Ratio (M‐H, Fixed, 95% CI) | 0.42 [0.14, 1.21] |
| 1.2 Healed at 12 weeks | 1 | 131 | Risk Ratio (M‐H, Fixed, 95% CI) | 1.02 [0.57, 1.81] |
| 2 Change in ulcer area in mm2 at 12 weeks Show forest plot | 1 | 131 | Mean Difference (IV, Fixed, 95% CI) | ‐169.56 [‐613.61, 274.49] |
| 3 Percentage change in ulcer area at 12 weeks Show forest plot | 1 | 131 | Mean Difference (IV, Fixed, 95% CI) | ‐7.64 [‐37.88, 22.60] |
| 4 Mean wear time (days) Show forest plot | 1 | 131 | Mean Difference (IV, Fixed, 95% CI) | 0.36 [‐0.29, 1.02] |
| 5 Proportion of participants experiencing adverse events Show forest plot | 1 | 40 | Risk Ratio (M‐H, Fixed, 95% CI) | 1.47 [0.53, 4.03] |
| Outcome or subgroup title | No. of studies | No. of participants | Statistical method | Effect size |
| 1 Proportion of ulcers healed at 12 weeks Show forest plot | 1 | 60 | Risk Ratio (M‐H, Fixed, 95% CI) | 1.08 [0.86, 1.36] |