Cánulas nasales de alto flujo para la asistencia respiratoria de pacientes adultos en cuidados intensivos
Información
- DOI:
- https://doi.org/10.1002/14651858.CD010172.pub2Copiar DOI

- Base de datos:
-
- Cochrane Database of Systematic Reviews
- Versión publicada:
-
- 30 mayo 2017see what's new
- Tipo:
-
- Intervention
- Etapa:
-
- Review
- Grupo Editorial Cochrane:
-
Grupo Cochrane de Atención crítica y de emergencia
- Copyright:
-
- Copyright © 2017 The Cochrane Collaboration. Published by John Wiley & Sons, Ltd.
Cifras del artículo
Altmetric:
Citado por:
Autores
Contributions of authors
Contributions made by authors in the previous version of the review can be found in Corley 2017.
Sharon R Lewis (SRL), Philip E Baker (PEB), Roses Parker (RP), Andrew F Smith (AFS).
Co‐ordinating the review update, undertaking manual searches, organizing retrieval of papers, screening retrieved papers against inclusion criteria, extracting data from papers, conducting 'Risk of bias' assessments, entering data in RevMan Web 2019, analysing and interpreting data: PEB and SRL
Writing the review: PEB, RP and SRL
Contacting study authors for additional information: PEB
Taking responsibility for reading and checking the review before submission: PEB, SRL, RP, AFS.
Declarations of interest
Sharon R Lewis (SRL), Philip E Baker (PEB), Roses Parker (RP), Andrew F Smith (AFS).
Review authors SRL, PEB, RP and AFS have no conflicts of interest to declare.
Acknowledgements
We would like to thank Jasmin Arrich (Content Editor); Nathan Pace (Statistical Editor); Kevin Dysart and Ravi Tiruvoipati (Peer Reviewers); Stella O'Brien (Consumer Referee); Janne Vendt (Information Specialist); Liz Bickerdike (Network Associate Editor, Acute and Emergency Care Network); Teo Quay and Vernon Hedge (Managing Editors); and Harald Herkner (Co‐ordinating Editor) for their help and editorial advice during the preparation of the present update of this systematic review.
We would like to thank the previous review authors (Amanda Corley, Claire M Rickard, Leanne M Aitken, Amy Johnston, Adrian Barnett, and John F Fraser) for their contribution to the protocol and the earlier version of this review (Corley 2017).
We would like to thank Harald Herkner (Content Editor); Cathal Walsh (Statistical Editor); Georgina Imberger, Kevin Dysart, Ravi Tiruvoipati, and Samir Jaber (Peer Reviewers), and Shunjie Chua (Consumer Referee) for help and editorial advice provided during preparation of the earlier version of this review (Corley 2017).
We would also like to thank Karen Hovhannisyan (Former Trials Search Co‐ordinator for the Cochrane Anaesthesia, Critical and Emergency Care (ACE) Group) for developing the search strategy, Jane Cracknell (Managing Editor, ACE) for assisting with protocol and review development; and Joan Webster for providing additional advice on the analytical approach for the earlier version of this review (Corley 2017).
Version history
| Published | Title | Stage | Authors | Version |
| 2021 Mar 04 | High‐flow nasal cannulae for respiratory support in adult intensive care patients | Review | Sharon R Lewis, Philip E Baker, Roses Parker, Andrew F Smith | |
| 2017 May 30 | High‐flow nasal cannulae for respiratory support in adult intensive care patients | Review | Sharon R Lewis, Philip E Baker, Roses Parker, Andrew F Smith | |
| 2012 Nov 14 | High flow nasal cannulae for respiratory support in adult intensive care patients | Protocol | Amanda Corley, Claire M Rickard, Leanne M Aitken, Amy Johnston, Adrian Barnett, John F Fraser | |
Differences between protocol and review
Changes between protocol and review made in the previous publication are reported in Corley 2017.
Differences between the current and previous version of the review
We made the following changes to Corley 2017.
-
Authors: we added two new authors to the review team (Philip Baker and Roses Parker) and we removed six authors from the review team who were no longer able to contribute to the review owing to time constraints: Amanda Corley, Claire M Rickard, Leanne M Aitken, Amy Johnston, Adrian Barnett, John F Fraser.
-
Objectives: we re‐worded the review objectives, using a single sentence, following current Cochrane guidance.
-
Types of studies: we excluded cluster‐ and quasi‐randomized studies. Quasi‐randomized studies were originally included as it was expected that limited data would be available for this review. However, as sufficient high‐quality studies are now published for this topic, we believed that it was appropriate to exclude both these study designs from this update.
-
Types of interventions: we made a greater distinction between the different types of respiratory support in the review. We separated the interventions into two comparison groups (standard oxygen therapy; and NIV or NIPPV). We made edits to other sections of the text in order to specify the separate management of these two comparison groups. For consistency, we used the term 'standard oxygen therapy' throughout the review to refer to low‐flow oxygen, conventional oxygen therapy and standard oxygen therapy; we had previously used these terms interchangeably throughout the review. We clarified that we included standard oxygen therapy with or without humidification and heating.
-
Types of outcomes: we removed the term 'primary outcome', instead splitting the outcomes into 'important' and 'additional' outcomes, where the 'important outcomes' appear in the 'Summary of findings' tables. For the outcome 'treatment failure', we clarified that this was escalation of respiratory support that included NIV, as well as NIPPV or invasive ventilation depending on the initial respiratory therapy. For the outcome 'adverse events', we specified and collected data only on specific outcomes. We found that study authors varied in whether or not they defined outcomes as 'adverse events'. We, therefore, collected data on: respiratory infections (pneumonia, and tracheobronchitis), abdominal distension, and nasal mucosa or skin trauma. Data for other adverse events that were previously reported can be found in Corley 2017. We also clarified in this section, that we separated data for respiratory effects and participant‐reported outcomes according to short‐term and longer‐term effects. We removed PCO2 as an outcome; this is a predictor of PaCO2 which is commonly reported in studies.
-
Search methods: we updated the search strategies following the advice and support of the Information Specialist for the Cochrane Emergency and Critical Care Group. In this review update, we did not separately search for abstracts from conference proceedings (for the European Society of Intensive Care Medicine, the Australia and New Zealand Intensive Care Society, the Society of Critical Care Medicine, and the American Thoracic Society); we expected that publications from these conference proceedings would be included in the comprehensive database search strategies.
-
Data extraction and management: we edited the data extraction forms, in order to use a template that was more consistent with the tables in Characteristics of included studies. In addition, we added detail about the information collected during data extraction.
-
Measures of treatment effect: when dealing with continuous data presented on different scales, we added that we would aim to scale and invert the outcome data to allow calculation of a mean difference before calculating standardized mean difference.
-
Assessment of risk of bias: we reduced the text in this section. Rather than making 'Risk of bias' judgements on all studies, we only made judgements on studies for which we reported outcome data; we specified this in this Methods section. We made judgements separately for detection bias according to whether outcomes were subjective (participant‐reported) or objective (all other outcomes).
-
Sensitivity analysis: we provided additional clarity to the sensitivity analyses. We added sensitivity analysis to explore the effects of high risk of bias in domains other than selection bias (as we performed a separate sensitivity analysis for this domain). In addition, we performed further sensitivity analyses to exclude studies that were commercially funded with a potential conflict of interest on advice from the Cochrane Emergency and Critical Care Group editorial team. We also used sensitivity analysis on all of the outcomes in the 'Summary of findings' tables, because we used this information when assessing the certainty of the evidence with GRADE.
-
Summary of findings: we conducted GRADE assessments for the two comparison groups introduced in this latest update.
Notes
We would like to thank Harald Herkner (Content Editor); Cathal Walsh (Statistical Editor); and Georgine Imberger, Jean‐Damien Ricard, and Kevin Dysart (Peer Reviewers) for help and editorial advice provided during preparation of the protocol (Corley 2012) for this systematic review.
Keywords
MeSH
Medical Subject Headings (MeSH) Keywords
- Acute Disease;
- Barotrauma [epidemiology];
- Bias;
- Critical Care [*methods];
- Hospital Mortality;
- Intubation [adverse effects, instrumentation, *methods];
- Length of Stay;
- Masks;
- Nasal Mucosa [injuries];
- Noninvasive Ventilation [methods];
- Oxygen Inhalation Therapy [adverse effects, instrumentation, *methods];
- Patient Reported Outcome Measures;
- Pneumonia [epidemiology];
- Randomized Controlled Trials as Topic;
- Respiration, Artificial [adverse effects];
- Respiratory Insufficiency [*therapy];
- Treatment Failure;
Medical Subject Headings Check Words
Adult; Humans;
PICO
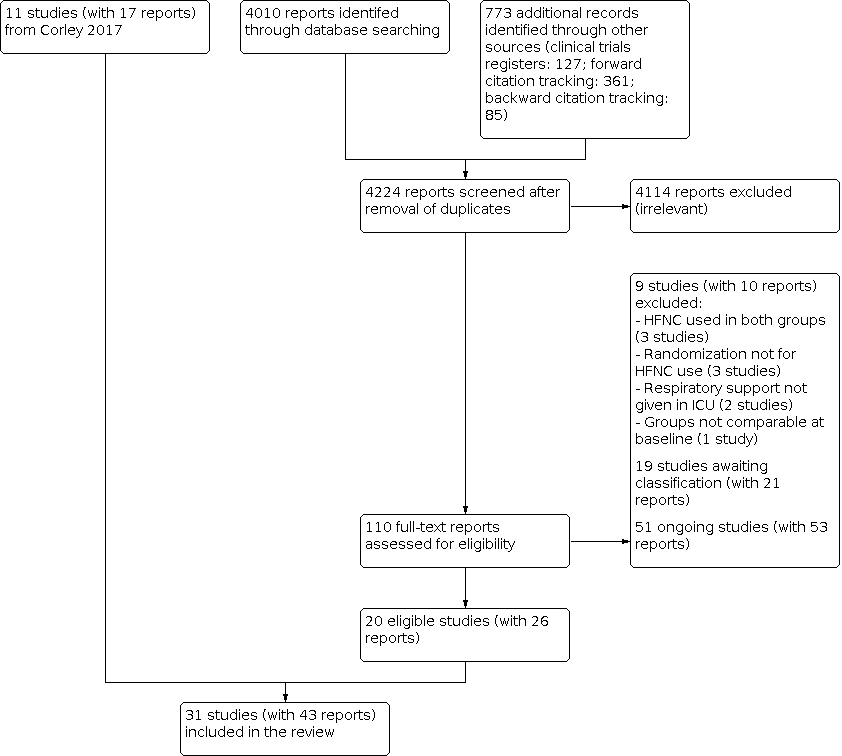
Flow diagram. Search conducted in April 2020

Risk of bias summary: review authors' judgements about each risk of bias item for each included study. We only conducted 'Risk of bias' assessments in studies for which we reported outcome data, and for domains that were relevant to reported outcomes (in particular, for detection bias of objective and subjective measures); blank spaces, therefore, indicate that 'Risk of bias' assessment was not conducted for the outcome, or for a particular domain.

Funnel plot for outcome 1.1 Treatment failure.

Funnel plot for outcome 1.2 In‐hospital mortality

Comparison 1: HFNC versus standard oxygen therapy, Outcome 1: Treatment failure (escalation of respiratory support to NIV, NIPPV or invasive ventilation)

Comparison 1: HFNC versus standard oxygen therapy, Outcome 2: In‐hospital mortality

Comparison 1: HFNC versus standard oxygen therapy, Outcome 3: Important adverse events

Comparison 1: HFNC versus standard oxygen therapy, Outcome 4: Length of ICU stay (days)

Comparison 1: HFNC versus standard oxygen therapy, Outcome 5: Short‐term respiratory effects: PaO 2/FiO 2 (mmHg)

Comparison 1: HFNC versus standard oxygen therapy, Outcome 6: Comfort

Comparison 1: HFNC versus standard oxygen therapy, Outcome 7: Long‐term respiratory effects: PaO 2/FiO 2 (mmHg)

Comparison 1: HFNC versus standard oxygen therapy, Outcome 8: Short‐term and long‐term respiratory effects: PaO 2 (mmHg)

Comparison 1: HFNC versus standard oxygen therapy, Outcome 9: Short‐term and long‐term respiratory effects: SpO 2 (%)

Comparison 1: HFNC versus standard oxygen therapy, Outcome 10: Short‐term respiratory effects: PaCO 2 (mmHg)

Comparison 1: HFNC versus standard oxygen therapy, Outcome 11: Short‐term and long‐term respiratory rate (breaths/min)

Comparison 1: HFNC versus standard oxygen therapy, Outcome 12: Length of hospital stay (days)

Comparison 1: HFNC versus standard oxygen therapy, Outcome 13: Refusal to continue with treatment

Comparison 2: HFNC versus NIPPV or NIV, Outcome 1: Treatment failure (escalation of respiratory support to NIV, NIPPV or invasive ventilation)

Comparison 2: HFNC versus NIPPV or NIV, Outcome 2: In‐hospital mortality

Comparison 2: HFNC versus NIPPV or NIV, Outcome 3: Important adverse events: pneumonia

Comparison 2: HFNC versus NIPPV or NIV, Outcome 4: Short‐term respiratory effects: PaO 2/FiO 2 (mmHg)

Comparison 2: HFNC versus NIPPV or NIV, Outcome 5: Length of ICU stay (days)

Comparison 2: HFNC versus NIPPV or NIV, Outcome 6: Short‐term comfort (continuous data)

Comparison 2: HFNC versus NIPPV or NIV, Outcome 7: Duration of respiratory support (hours)

Comparison 2: HFNC versus NIPPV or NIV, Outcome 8: Long‐term respiratory effects: PaO 2/FiO 2 (mmHg)

Comparison 2: HFNC versus NIPPV or NIV, Outcome 9: Short‐term respiratory effects: PaO 2 (mmHg)

Comparison 2: HFNC versus NIPPV or NIV, Outcome 10: Short‐term and long‐term respiratory effects: PaCO 2 (mmHg)

Comparison 2: HFNC versus NIPPV or NIV, Outcome 11: Short‐term respiratory effects: breaths/min

Comparison 2: HFNC versus NIPPV or NIV, Outcome 12: Dyspnoea (any improvement)
| High‐flow nasal cannulae compared to standard oxygen therapy for respiratory support in adult intensive care patients | ||||||
| Population: adults in the ICU, requiring respiratory support | ||||||
| Outcomes | Anticipated absolute effects* (95% CI) | Relative effect | Number of participants | Certainty of the evidence | Comments | |
|---|---|---|---|---|---|---|
| Risk with standard oxygen therapy | Risk with HFNC | |||||
| Treatment failure (escalation of respiratory therapy to NIV, NIPPV or invasive ventilation) Measured up to 28 days | Study population | RR 0.62 | 3044 | ⊕⊕⊝⊝ Lowa | ||
| 261 per 1000 | 162 per 1000 | |||||
| In‐hospital mortality (up to 90 days; included studies reported in‐hospital mortality, and mortality up to 28 days, up to ICU discharge, and at unspecified time points) | Study population | RR 0.96 | 2673 | ⊕⊕⊕⊝ Moderateb | ‐ | |
| 163 per 1000 | 156 per 1000 | |||||
| Adverse events Respiratory infection (pneumonia) Nasal mucosa or skin trauma | Study population for pneumonia | RR 0.72 | 1057 | ⊕⊕⊕⊝ Moderatec | ‐ ‐ | |
| 84 per 1000 | 61 per 1000 | |||||
| Study population for nasal mucosa or skin trauma | RR 3.66 | 617 | ⊕⊝⊝⊝ Verylowd | |||
| 3 per 1000 | 12 per 1000 | |||||
| Length of ICU stay | 1.88 days | MD 0.12 days higher | ‐ | 1014 | ⊕⊕⊝⊝ Lowe | In addition, 5 studies reported median lengths of ICU stay which we did not combine in analysis; these studies all reported little or no difference in median lengths of ICU stay |
| Respiratory effects: PaO2/FiO2 ratio up to 24 hours after initiation of therapy | 188.5 mmHg | MD 10.34 mmHg higher (17.31 mmHg lower to 38 mmHg higher) | ‐ | 600 | ⊕⊝⊝⊝ Verylowf | In addition, 1 study reported median values which we did not combine in analysis; this study reported higher PaO2/FiO2 when HFNC was used |
| Comfort (short‐term effect) Measured up to 24 hours, scales were standardised to allow comparison; higher numbers indicate more comfort | 6.81 | MD 0.31 higher | ‐ | 662 | ⊕⊝⊝⊝ Verylowg | In addition, 2 studies reported median values which we did not combine in analysis; 1 of these studies reported little or no difference in comfort according to type of respiratory support used, and 1 study reported improved comfort when HFNC was used |
| Comfort (long‐term effect) Measured at more than 24 hours, scales were standardized to allow comparison; higher numbers indicate more comfort | 7.10 | MD 0.59 higher | ‐ | 445 | ⊕⊝⊝⊝ Verylowg | In addition, 1 study reported data in a figure and we did not combine these data in analysis; this study reported little or no difference in comfort according to the type of respiratory support used |
| *The risk in the intervention group (and its 95% confidence interval) is based on the assumed risk in the comparison group and the relative effect of the intervention (and its 95% CI). For length of stay, PaO2/FiO2 and comfort, we present baseline risk values for standard oxygen therapy as the weighted mean values reported in included studies for each outcome. For comfort, these values are scores on a scale from 0 (least comfort) to 10 (most comfort). | ||||||
| GRADE Working Group grades of evidence | ||||||
| aWe downgraded by one level for inconsistency because we noted a moderate level of statistical heterogeneity; we also noted more variation in the data from studies in which respiratory support was given post‐extubation which we could not explain. We also downgraded by one level for study limitations because we judged some studies to have an unclear risk of selection bias; excluding these studies in sensitivity analysis no longer indicated an improvement with HFNC use. | ||||||
| High‐flow nasal cannulae compared to NIPPV or NIV for respiratory support in adult intensive care patients | ||||||
| Population: adults in the ICU, requiring respiratory support | ||||||
| Outcomes | Anticipated absolute effects* (95% CI) | Relative effect | Number of participants | Certainty of the evidence | Comments | |
|---|---|---|---|---|---|---|
| Risk with NIPPV or NIV | Risk with HFNC | |||||
| Treatment failure (escalation of respiratory therapy to NIV, NIPPV or invasive ventilation) Measured up to 28 days | Study population | RR 0.98 | 1758 | ⊕⊕⊝⊝ Lowa | We conducted subgroup analysis and found no evidence of a difference in treatment failure when used post‐extubation (RR 1.12, 95% CI 0.89 to 1.41; 3 studies, 1472 participants) and without prior use of mechanical ventilation (RR 0.77, 95% CI 0.58 to 1.03; 2 studies, 286 participants) | |
| 202 per 1000 | 198 per 1000 | |||||
| In‐hospital mortality (up to 90 days; included studies reported in‐hospital mortality, and mortality up to 28 days and up to ICU discharge) | Study population | RR 0.92 | 1758 | ⊕⊕⊝⊝ Lowa | ‐ | |
| 136 per 1000 | 126 per 1000 | |||||
| Adverse events Respiratory infection (pneumonia) | Study population for pneumonia | RR 0.51 | 1750 | ⊕⊝⊝⊝ Verylowb | ‐ | |
| 159 per 1000 | 81 per 1000 | |||||
| Barotrauma (pneumothorax) | Study population for barotrauma | RR 1.15 | 830 | ⊕⊝⊝⊝ Lowc | ‐ | |
| 17 per 1000 | 19 per 1000 | |||||
| Nasal mucosa or skin trauma | Study population for nasal mucosa or skin trauma | ‐ | ‐ | ‐ | No studies reported this outcome | |
| ‐ | ‐ | |||||
| Length of ICU stay | 9.9 days | MD 0.72 days lower | ‐ | 246 | ⊕⊕⊝⊝ Lowd | In addition, 2 studies reported median lengths of ICU stay which we did not combine in analysis; these studies reported little or no difference in median lengths of ICU stay |
| Respiratory effects: PaO2/FiO2 ratio up to 24 hours after initiation of therapy | 228.9 mmHg | MD 58.1 mmHg lower | ‐ | 1086 | ⊕⊕⊝⊝ Lowe | ‐ |
| Comfort (short‐term effect) Measured up to 24 hours, scales were standardized to allow comparison; higher numbers indicate more comfort | 6.06 | MD 1.33 higher | ‐ | 258 | ⊕⊝⊝⊝ Verylowf | In addition, 1 study reported improved comfort with HFNC (RR 1.30, 95% CI 1.10 to 1.53; 1 study, 168 participants), and 1 study (830 participants) reported little or no difference between types of respiratory support, with comfort rated as 'poor', 'acceptable' or 'good'. |
| Comfort (long‐term effect) Measured at more than 24 hours | ‐ | ‐ | ‐ | ‐ | ⊕⊝⊝⊝ Verylowg | 1 study (304 participants) reported little or no difference between types of respiratory support, with comfort rated as 'poor', 'acceptable' or 'good'. |
| *The risk in the intervention group (and its 95% confidence interval) is based on the assumed risk in the comparison group and the relative effect of the intervention (and its 95% CI). We present baseline risk values for NIPPV/NIV as the weighted mean values reported in included studies for each outcome. For comfort, these values are a score from 0 (least comfort) to 10 (most comfort). | ||||||
| GRADE Working Group grades of evidence | ||||||
| aWe downgraded by two levels: we downgraded by one level for inconsistency because we noted some variation in the results which we could not explain. We also downgraded by one level for study limitations because we judged one study to have a high risk of bias owing to the use of alternative treatment between intermittent HFNC use. | ||||||
| Important outcomes | HFNC | Standard oxygen therapy | Effect estimatea | P valuesb | Study ID |
|---|---|---|---|---|---|
| Length of ICU stay (days) | Median (IQR): 8 (4 to 14) | Median (IQR): 6 (4 to 13) | 0.07 | ||
| Length of ICU stay (days) | Median (IQR): 6 (4 to 16) | Median (IQR): 5 (3 to 13) | 0.53 | ||
| Length of ICU stay (days) | Median (IQR): 6 (2 to 8) | Median (IQR): 6 (2 to 9) | Not reported | ||
| Length of ICU stay (days) | Median (IQR): 10 (7 to 13) | Median (IQR): 9 (6 to 12) | 0.453 | ||
| Length of ICU stay (days) | Median (IQR): 1 (1 to 2) | Median (IQR): 1 (1 to 2) | 0.949 | ||
| Short‐term oxygenation (PaO2/FiO2) | Median (IQR):150 (104 to 230) | Median (IQR):119 (86 to 165) | P value not reported. Study authors described difference as significantly higher in the HFNC group | ||
| Short‐term comfort (at 120 minutes) Scale of 0 to 10 (0 = absence of discomfort, 10 = worst possible discomfort) | Median (IQR): 3 (1 to 5) | Median (IQR): 3 (0 to 5) | 0.88 | ||
| Long‐term comfort (at 24 hours) Scale of 0 to 10 (0 = no discomfort, 10 = maximum discomfort) | Median (IQR): 3 (3 to 4.5) | Median (IQR): 7 (6 to 8) | < 0.001 | ||
| Additional outcomes | HFNC | Standard oxygen therapy | Effect estimatea | P valuesb | Study ID |
| Duration of respiratory support (hours) | Mean (SD): 59.0 (± 30.8) | Mean (SD): 65.0 (± 41.6) | MD (95% CI) ‐6.00 (‐13.77 to 1.77) | 0.13 | |
| Atelectasis (radiological atelectasis score) | Day 1: median (IQR): 2 (1.5 to 2.5) Day 5: median (IQR): 2 (1.5 to 2.5) | Day 1: median (IQR): 2 (1.5 to 3) Day 5: median (IQR:) 2 (1 to 2.5) | Day 1: 0.70 Day 5: 0.15 | ||
| Atelectasis (chest X‐ray) | Day 1: mean (SD): 4.8 (± 1.9) Day 3: mean (SD): 4.8 (± 1.9) | Day 1: mean (SD) 4.9 (± 1.8) Day 3 mean (SD) 4.7 (± 2.1) | Day 1: 0.63 Day 3: 0.69 | ||
| Long‐term PaCO2 (at 48 hours; mmHg) | Mean (SD): 41.3 (± 7.5) | Mean (SD): 37.2 (± 9.6) | MD 4.10, 95% CI ‐0.43 to 8.63 | ||
| Short‐term respiratory rate (at 6 hours; breaths per minute) | Median (IQR): 25 (20 to 30) | Median (IQR): 26 (21 to 31) | Not reported | ||
| Long‐term respiratory rate (at 120 minutes; breaths per minute) | Median (IQR): 25 (22 to 29) | Median (IQR) 25 (21 to 31) | Not reported | ||
| Length of hospital stay (days) | Median (IQR): 24 (14 to 40) | Median (IQR): 27 (15 to 42) | 0.60 | ||
| Length of hospital stay (days) | Median (IQR): 12 (7 to 20) | Median (IQR): 11 (7 to 18) | 0.58 | ||
| Length of hospital stay (days) | Median (IQR): 11(6 to 15) | Median (IQR): 12 (6 to 16) | 0.76 | ||
| Length of hospital stay (days) | Median (IQR): 7 (6 to 9) | Median (IQR): 9 (7 to 6) | 0.012 | ||
| Participant‐reported outcomes Dyspnoea Modified Borg scale (0 = no dyspnoea, 10 = maximal dyspnoea | Median (IQR): 1 (0 to 3) | Median (IQR): 0 (0 to 1) | 0.008 | ||
| Participant‐reported outcomes Dyspnoea Scale of 0 to 10 (0 = absence of dyspnoea, 10 = worst possible dyspnoea) | Median (IQR): 3 (2 to 6) | Median (IQR): 3 (5 to 9) | 0.40 | ||
| Participant‐reported outcomes Dyspnoea Scale of 0 to 10 (0 = no dyspnoea, 10 = maximal dyspnoea). Authors reported proportion of patients with improvement | Mean (SD): 1.6 (1.2) | Mean (SD): 2.9 (1.5) | MD ‐1.3, 95% CI ‐2.60 to 0.00 | 0.04 | |
| Participant‐reported outcomes Dry mouth Scale of 0 to 10 (0 = no dryness, 10 = maximum dryness) | Mean (SD) 3.6 (2.5) | Mean (SD) 5 (3.1) | MD ‐1.40, 95% CI ‐2.68 to ‐0.12 | 0.016 | |
| Cost comparison of treatment Total hospitalization expenditure, $ | Mean (SD): 11522.65 (762.45) | Mean (SD): 12219.73 (1028.66) | 0.001 | ||
| acalculated using RevMan Web 2019 | |||||
| CI: confidence interval | |||||
| Additional outcomes | HFNC n/N | Standard oxygen therapy n/N | Effect estimatea | Study |
|---|---|---|---|---|
| Atelectasis | 2/56 | 5/54 | RR 0.39, 95% CI 0.08 to 1.90 | |
| Adverse events Ventilator‐acquired tracheobronchitis | 3/264 | 7/263 | RR 0.43, 95% CI 0.11 to 1.63 | |
| Adverse events Abdominal distension | 3/56 | 0/54 | RR 6.75, 95% CI 0.36 to 127.76 | |
| Participant‐reported outcomes Dyspnoea (any improvement; using categorical data reported as marked improvement, slight improvement, no change, slight deterioration, marked deterioration) | 65/106 | 31/94 | RR 1.86, 95% CI 1.34 to 2.57 | |
| Participant‐reported outcomes Dry mouth (data included dry mouth, nose, or throat) | 18/47 | 30/43 | RR 0.55, 95% CI 0.36 to 0.83 | |
| Participant‐reported outcomes Throat and nasal pain | 1/56 | 7/54 | RR 0.14, 95% CI 0.02 to 1.08 | |
| acalculated using RevMan Web 2019 | ||||
| CI: confidence interval | ||||
| Outcome | Study IDs | Effect estimate (short‐term) | Effect estimate (long‐term) | Comment |
|---|---|---|---|---|
| Duration of respiratory support | MD ‐6.00 hours, 95% CI ‐13.77 to 1.77; 1 study, 340 participants; Table 1 | ‐ | ||
| Long‐term PaO2/FiO2 | ‐ | MD 27.97, 95% CI 5.60 to 50.33; 2 studies, 195 participants; I2 = 81%; Analysis 1.7 | ||
| Atelectasis | RR 0.39, 95% CI 0.08 to 1.90; 1 study; 99 participants; Table 2 | ‐ | Additional data available from 2 studies (Corley 2014; Parke 2013a)a; see Table 1 | |
| PaO2 | MD 4.92 mmHg, 95% CI ‐1.24 to 11.07; 4 studies, 415 participants; I2 = 47%; Analysis 1.8 | MD 12.27 mmHg, 95% CI 7.51 to 17.04; 2 studies, 644 participants; I2 = 0%; Analysis 1.8 | ||
| SpO2 | Maggiore 2014; Parke 2011; Parke 2013a; Rittayamai 2014; Song 2017 | MD 0.79 %, 95% CI ‐0.29 to 1.88; 5 studies, 572 participants; I2 = 88%; Analysis 1.9 | MD 1.28 %, 95% CI 0.02 to 2.55; 2 studies, 445 participants; I2 = 81%; Analysis 1.9 | Long‐term effect estimate was significant (P = 0.05), however, the high number of comparisons in this review limits our interpretation of this result. |
| PaCO2 | Frat 2015Frat 2015; Hernandez 2016b; Hu 2020; Maggiore 2014; Parke 2011; Parke 2013a; Song 2017 | MD ‐1.05 mmHg, 95% CI ‐2.24 to ‐0.13; 5 studies, 755 participants; I2 = 28%; Analysis 1.10 | MD 4.10 mmHg, 95% CI ‐0.43 to 8.63; 1 study, 56 participants; Table 1 | |
| Respiratory rate | Corley 2014; Frat 2015; Hu 2020; Maggiore 2014; Parke 2011; Parke 2013a; Rittayamai 2014; Song 2017; Vourc'h 2020 | MD ‐2.02 breaths/min, 95% CI ‐3.66 to ‐0.37; 7 studies, 1017 participants; I2 = 87%; Analysis 1.11 | MD ‐2.01 breaths/min, 95% CI ‐4.39 to 0.37; 4 studies, 591 participants; I2 = 92%; Analysis 1.11 | Additional data available from 2 studies (Azoulay 2018; Lemiale 2015)a; see Table 1 |
| Additional adverse events: ventilator‐acquired tracheobronchitis | RR 0.43, 95% CI 0.11 to 1.63; 1 study, 527 participants; Table 2 | ‐ | ||
| Additional adverse events: abdominal distension | RR 6.75, 95% CI 0.36 to 127.76; 1 study, 110 participants; Table 2 | ‐ | ||
| Length of hospital stay | MD ‐0.32 days, 95% CI ‐1.32 to 0.68; 3 studies, 494 participants; I2 = 47%; Analysis 1.12 | ‐ | Additional data available from 4 studies (Azoulay 2018; Futier 2016; Hernandez 2016b; Zochios 2018)ab; see Table 1. | |
| Other participant‐reported outcomes Dyspnoea | MD ‐1.30, 95% CI ‐2.60 to 0.00; 1 study, 17 participants; Table 1 RR 1.86, 95% CI 1.34 to 2.57; 1 study, 200 participant; Table 2 | Additional data available from 3 studies (Corley 2014; Lemiale 2015; Rittayamai 2014)a; see Table 1. Azoulay 2018 data reported in figures from which numerical data could not be extracted. Study authors reported no significant difference between groups. | ||
| Other participant‐reported outcomes Dry mouth | RR 0.55, 95% CI 0.36 to 0.83; 1 study, 90 participants; Table 2 MD ‐1.40, 95% CI ‐2.68 to ‐0.12; 1 study, 80 participants; Table 1 | ‐ | Additional data available from Maggiore 2014 reported in Table 1. Additional data from Vourc'h 2020 reported in Table 2. Cuquemelle 2012 effect size was not reported but the authors stated there was no evidence of a difference between groups. | |
| Other participant‐reported outcomes Throat or nasal pain | RR 0.14, 95% CI 0.02 to 1.08; 1 study, 110 participants; Table 2 | ‐ | ||
| Other participant‐reported outcomes Treatment withdrawn due to discomfort | RR 17.62, 95% CI 1.03 to 301.65; 1 study, 220 participants; Table 2 | ‐ | ||
| Other participant‐reported outcomes Refusal to continue treatment | RR 26.89, 95% CI 3.67 to 197.32; 2 studies, 560 participants; Analysis 1.13 | ‐ | Azoulay 2018 reported participant discontinuation in HFNC group due to discomfort, but it was unclear whether any participants in the control group discontinued due to discomfort. | |
| Cost comparison of treatment | ‐ | ‐ | Mean costs reported for HFNC group only. See Table 1 | |
| aWe did not combine data from these studies in analyses because data were reported as median values, or did not include relevant distribution variables for meta‐analysis with other studies bFrom visual inspection, we noted that these data were likely to be right skewed due to the comparable magnitudes of the mean and standard deviation. This is expected for outcomes such a length of hospital stay due to most participants being discharged in a short time period with some outliers staying significantly longer. However, right skew introduces artefact into calculation of the effect estimate, limiting the interpretation of the result. | ||||
| CI: confidence interval | ||||
| Risk of selection: studies excluded from primary analysis owing to high or unclear risk of selection bias for random sequence generation or allocation concealment | ||
|---|---|---|
| Important outcomes | Excluded studies | Effect of sensitivity analysis |
| Failure of treatment | Frat 2015; Hu 2020; Lemiale 2015; Maggiore 2014; Song 2017; Yu 2017 | Effect estimate no longer indicated improvement with HFNC use (RR 0.85, 95% CI 0.62 to 1.17; 9 studies, 2457 participants; I2 = 55%) |
| In‐hospital mortality | Interpretation of the effect estimate remained the same | |
| Important adverse events: pneumonia | Interpretation of the effect estimate remained the same | |
| Important adverse events: nasal mucosa or skin trauma | ‐ | ‐ |
| Length of ICU stay | Interpretation of the effect estimate remained the same | |
| PaO2/FiO2 up to 24 hours | Effect estimate indicated higher PaO2/FiO2 when standard oxygen therapy was used (MD 25.28 mmHg, 95% CI 7.23 to 43.32; 2 studies, 245 participants; I2 = 0%) | |
| Comfort (short‐term) | Interpretation of the effect estimate remained the same | |
| Comfort (long‐term) | Interpretation of the effect estimate remained the same | |
| High risks of other bias: studies excluded from primary analysis owing to high risks of other bias | ||
| Outcome | Excluded studies | Effect of sensitivity analysis |
| Failure of treatment | Fernandez 2017; Hu 2020; Parke 2011; Parke 2013a; Zochios 2018 (selective reporting bias) Frat 2015 (selective reporting bias, and differences in treatment in the HFNC group) | Interpretation of the effect estimate remained the same |
| In‐hospital mortality | Fernandez 2017; Frat 2015; Hu 2020; Parke 2013a; Zochios 2018 (selective reporting bias) Frat 2015 (differences in treatment in the HFNC group) | Interpretation of the effect estimate remained the same |
| Important adverse events: pneumonia | Frat 2015 (selective reporting bias, and differences in treatment in the HFNC group) | Interpretation of the effect estimate remained the same |
| Important adverse events: nasal mucosa or skin trauma | ‐ | ‐ |
| Length of ICU stay | Brainard 2017 (attrition bias) Frat 2015 (selective reporting bias, and differences in treatment in the HFNC group) Parke 2013a (selective reporting bias) | Interpretation of the effect estimate remained the same |
| PaO2/FiO2 up to 24 hours | Frat 2015 (selective reporting bias, and differences in treatment in the HFNC group) Parke 2011 (selective reporting bias) | Effect estimate indicated higher PaO2/FiO2 when standard oxygen therapy was used (MD 29.28 mmHg, 95% CI 13.86 to 44.70; 3 studies, 350 participants; I2 = 0%) |
| Comfort (short‐term) | Frat 2015 (selective reporting bias, and differences in treatment in the HFNC group) Parke 2013a (selective reporting bias) | Interpretation of the effect estimate remained the same |
| Comfort (long‐term) | Parke 2013a (selective reporting bias) | Effect estimate indicated improved comfort when HFNC was used (MD ‐2.10, 95% CI ‐3.16 to ‐1.04; 1 study, 105 participants) |
| Fixed effect versus random effects: we re‐analysed the data using a fixed‐effect model | ||
| Outcomes | Effect of sensitivity analysis | |
| Failure of treatment In‐hospital mortality Important adverse events: pneumonia Important adverse events: nasal mucosa or skin trauma Length of ICU stay PaO2/FiO2 up to 24 hours Comfort (short‐term) Comfort (long‐term) | Interpretation of the effect estimate for all outcomes remained the same | |
| Funding: studies excluded from analysis in which funding was from commercial sources | ||
| Outcome | Excluded studies | Effect of sensitivity analysis |
| Failure of treatment | Azoulay 2018; Corley 2014; Frat 2015; Hernandez 2016b; Lemiale 2015; Maggiore 2014; Parke 2011; Parke 2013a; Zochios 2018 | Interpretation of the effect estimate remained the same |
| In‐hospital mortality | Azoulay 2018; Hernandez 2016b; Maggiore 2014; Parke 2013a; Zochios 2018 | Interpretation of the effect estimate remained the same |
| Important adverse events: pneumonia | Interpretation of the effect estimate remained the same | |
| Important adverse events: nasal mucosa or skin trauma | Interpretation of the effect estimate remained the same | |
| Length of ICU stay | Interpretation of the effect estimate remained the same | |
| PaO2/FiO2 up to 24 hours | Interpretation of the effect estimate remained the same (only one study remaining in analysis) | |
| Comfort (short‐term) | Interpretation of the effect estimate remained the same (only one study remaining in analysis) | |
| Comfort (long‐term) | No studies remaining in analysis | |
| CI: confidence interval | ||
| Important outcomes | HFNC n/N | NIV or NIPPV n/N | Effect estimatea | Study ID |
|---|---|---|---|---|
| Participant‐reported outcomes Comfort | 74/84 | 57/84 | RR 1.30, 95% CI 1.10 to 1.53 | |
| Adverse events Pneumothorax | 8/414 | 7/416 | RR 1.15, 95% CI 0.42 to 3.14 | |
| Additional outcomes | HFNC n/N | NIV or NIPPV n/N | Effect estimatea | Study ID |
| Adverse events Ventilator‐acquired tracheobronchitis | 11/290 | 18/314 | RR 0.66, 95% CI 0.32 to 1.38 | |
| acalculated using RevMan Web 2019 | ||||
| CI: confidence interval | ||||
| Important outcomes | HFNC | NIV or NIPPV | Effect estimatea | P valueb | Study ID |
|---|---|---|---|---|---|
| Length of ICU stay (days) | Median (IQR): 9 (4 to 19) | Median (IQR): 10.5 (5 to 19) | Not reported | ||
| Length of ICU stay (days) | Median (IQR) 6 (4 to 10) | Median (IQR) 6 (4 to 10) | 0.77 | ||
| Short‐term comfort (1 hour) 5‐point scale of 'poor', 'acceptable', or 'good' | Poor: 16.7% Acceptable: 31.0% Good: 51.0% | Poor: 17.8% Acceptable: 29.3% Good: 53.0% | 0.32 | ||
| Long‐term comfort (day 3) 5‐point scale of 'poor', 'acceptable', or 'good' | Poor: 21% Acceptable: 32.4% Good: 47% | Poor: 21% Acceptable: 31% Good: 48.3% | > 0.99 | ||
| Additional outcomes | HFNC | NIV or NIPPV | Effect estimatea | P valueb | Study ID |
| Long‐term PaO2 (mmHg) | Mean (SD): 81.87 (15.27) | Mean (SD): 82.22 (15.64) | MD ‐0.35, 95% CI ‐5.02 to 4.32 | ||
| Long‐term SpO2 (%) | Mean (SD): 87.83 (8.16%) | Mean (SD): 88.65 (7.15) | MD ‐0.82, 95% CI ‐3.14 to 1.50 | ||
| Long‐term SpO2 (%) | Mean (SD): 91.93 (4.35) | Mean (SD): 92.75 (4.07) | MD ‐0.82, 95% CI ‐2.09 to 0.45 | ||
| Short‐term PaCO2 (mmHg) | Mean (95% CI) 38.2 (37.6 to 38.9) | Mean (95% CI) 39.3 (38.6 to 40.0) | 0.19 | ||
| Long‐term PaCO2 (mmHg) | Mean (SD) 81.87 (15.27) | Mean (SD) 82.22 (15.64) | MD ‐0.35, 95% CI ‐5.02 to 4.32 | ||
| Long‐term respiratory rate (breaths/min) | Mean (SD) 22.4 (4.4) | Mean (SD) 21 (4.5) | MD 1.40, 95% CI ‐1.36 to 4.16 | ||
| Length of hospital stay (days) | Median (IQR): 23 (14 to 46) | Median (IQR): 26 (16 to 37) | Not reported | ||
| Length of hospital stay (days) | Median (IQR) 13 (9 to 22) | Median (IQR) 14 (9 to 20) | 0.59 | ||
| Length of hospital stay (days) | Mean (SD): 18.04 (6.15) | Mean (SD): 18.31 | MD ‐0.27 days, 95% CI ‐2.26 to 1.72 | ||
| acalculated using RevMan Web 2019 | |||||
| CI: confidence interval | |||||
| Additional outcomes | Study IDs | Effect estimate (short‐term) | Effect estimate (long‐term) | Comment |
|---|---|---|---|---|
| Duration of respiratory support | MD ‐6.12 hours, 95% CI ‐54.61 to 42.37; 2 studies, 210 participants; I2 = 60%; Analysis 2.7 | ‐ | We noted a wide variation in results between these studies; this variation may be caused by differences in illness severity in the included participants in each study. | |
| Long‐term PaO2/FiO2 | ‐ | MD ‐31.67 mmHg, 95% CI ‐49.37 to ‐13.97; 2 studies, 344 participants; I2 = 0%; Analysis 2.8 | ||
| PaO2 | MD ‐9.57 mmHg, 95% CI ‐30.25 to 11.11; 2 studies, 384 participants; I2 = 89%; Analysis 2.9 | MD ‐0.35 mmHg, 95% CI ‐5.02 to 4.32; 1 study, 168 participants; Table 6 | ||
| SpO2 | MD ‐0.82%, 95% CI ‐3.14 to 1.50; 1 study, 168 participants; Table 6 | MD ‐0.82%, 95% CI ‐2.09 to 0.45; 1 study, 168 participants; Table 6 | ||
| PaCO2 | MD ‐0.46 mmHg, 95% CI ‐2.08 to 1.16; 4 studies, 1254 participants; I2 = 49%; Analysis 2.10 | MD ‐1.80 mmHg, 95% CI ‐5.57 to 1.98; 2 studies, 208 participants; I2 = 0%; Analysis 2.10 | ||
| Respiratory rate | MD ‐1.06 breaths/min, 95% CI ‐1.80 to ‐0.32; 4 studies, 1090 participants; I2 = 0%; Analysis 2.11 | MD 1.40 breaths/min, 95% CI ‐1.36 to 4.16; 1 study, 40 participants; Table 6 | ||
| Other adverse events Ventilator‐acquired tracheobronchitis | RR 0.66, 95% CI 0.32 to 1.38; 1 study, 604 participants; Table 5 | ‐ | ||
| Length of hospital stay | MD ‐0.27 days, 95% CI ‐2.26 to 1.72; 1 study, 168 participants; Table 6 | ‐ | Additional data available from 2 studies (Hernandez 2016a; Stephan 2015)ab; see Table 6 | |
| Other participant‐reported outcomes Dyspnoea | RR 1.05, 95% CI 0.74 to 1.48; 2 studies, 1023 participants; I2 = 85 %; Analysis 2.12 | ‐ | ||
| aWe did not combine data from these studies in analyses because data were reported as median values bFrom visual inspection, we noted that these data were likely to be right skewed due to the comparable magnitudes of the mean and standard deviation. This is expected for outcomes such as length of hospital stay due to most participants being discharged in a short time period with some outliers staying significantly longer. However, right skew introduces artefact into calculation of the effect estimate, limiting the interpretation of the result. | ||||
| CI: confidence interval | ||||
| Risk of selection: studies excluded from primary analysis owing to high or unclear risk of selection bias for random sequence generation or allocation concealment | ||
|---|---|---|
| Important outcomes | Excluded studies | Effect of sensitivity analysis |
| Failure of treatment | Interpretation of the effect estimate remained the same | |
| In‐hospital mortality | Interpretation of the effect estimate remained the same | |
| Important adverse events: pneumonia, or barotrauma | NA | NA. Only one study included in primary analyses for these outcomes |
| Length of ICU stay | Interpretation of the effect estimate remained the same (only one study remaining in analysis) | |
| PaO2/FiO2 up to 24 hours | Effect estimate indicated no evidence of a difference between types of respiratory support used (MD ‐9.30 mmHg, 95% CI ‐80.37 to 61.77; 1 study, 40 participants) | |
| Comfort (short‐term) | Interpretation of the effect estimate remained the same (only one study remaining in analysis) | |
| Comfort (long‐term) | NA | NA. Only one study included in primary analysis for this outcome |
| High risks of other bias: studies excluded from primary analysis owing to high risks of other bias | ||
| Outcome | Excluded studies | Effect of sensitivity analysis |
| Failure of treatment | Frat 2015 (selective reporting bias, and differences in treatment in the HFNC group) | Interpretation of the effect estimate remained the same |
| In‐hospital mortality | Frat 2015 (selective reporting bias, and differences in treatment in the HFNC group) | Interpretation of the effect estimate remained the same |
| Important adverse events: pneumonia | Frat 2015 (selective reporting bias, and differences in treatment in the HFNC group) | Interpretation of the effect estimate remained the same |
| Important adverse events: barotrauma | NA | NA. Only one study included in primary analysis for this outcome |
| Length of ICU stay | Frat 2015 (selective reporting bias, and differences in treatment in the HFNC group) | Interpretation of the effect estimate remained the same (only one study remaining in analysis) |
| PaO2/FiO2 up to 24 hours | Frat 2015 (selective reporting bias, and differences in treatment in the HFNC group) | Interpretation of the effect estimate remained the same |
| Comfort (short‐term) | Frat 2015 (selective reporting bias, and differences in treatment in the HFNC group) | Interpretation of the effect estimate remained the same (only one study remaining in analysis) |
| Comfort (long‐term) | NA | NA. Only one study included in primary analysis for this outcome |
| Fixed effect versus random effects: we re‐analysed the data using a fixed‐effect model | ||
| Outcomes | Effect of sensitivity analysis | |
| Failure of treatment In‐hospital mortality Important adverse events: pneumonia or barotrauma Length of ICU stay PaO2/FiO2 up to 24 hours Comfort (short‐term) Comfort (long‐term) | Interpretation of the effect estimate for all outcomes remained the same | |
| Funding: studies excluded from analysis in which funding was from commercial sources | ||
| Outcome | Excluded studies | Effect of sensitivity analysis |
| Failure of treatment | Interpretation of the effect estimate remained the same | |
| In‐hospital mortality | Interpretation of the effect estimate remained the same | |
| Important adverse events: pneumonia | Interpretation of the effect estimate remained the same | |
| Important adverse events: barotrauma | NA. Only one study included in primary analysis for this outcome | |
| Length of ICU stay | Interpretation of the effect estimate remained the same (only one study remaining in analysis) | |
| PaO2/FiO2 up to 24 hours | Interpretation of the effect estimate remained the same | |
| Comfort (short‐term) | Interpretation of the effect estimate remained the same (only one study remaining in analysis) | |
| Comfort (long‐term) | NA. Only one study included in primary analysis for this outcome | |
| CI: confidence interval | ||
| Outcome or subgroup title | No. of studies | No. of participants | Statistical method | Effect size |
| 1.1 Treatment failure (escalation of respiratory support to NIV, NIPPV or invasive ventilation) Show forest plot | 15 | 3044 | Risk Ratio (M‐H, Random, 95% CI) | 0.62 [0.45, 0.86] |
| 1.1.1 Post‐extubation respiratory support | 11 | 1912 | Risk Ratio (M‐H, Random, 95% CI) | 0.50 [0.30, 0.86] |
| 1.1.2 Respiratory support without prior use of mechanical ventilation | 4 | 1132 | Risk Ratio (M‐H, Random, 95% CI) | 0.85 [0.68, 1.08] |
| 1.2 In‐hospital mortality Show forest plot | 11 | 2673 | Risk Ratio (M‐H, Random, 95% CI) | 0.96 [0.82, 1.11] |
| 1.3 Important adverse events Show forest plot | 5 | Risk Ratio (M‐H, Random, 95% CI) | Subtotals only | |
| 1.3.1 Pneumonia | 4 | 1057 | Risk Ratio (M‐H, Random, 95% CI) | 0.72 [0.48, 1.09] |
| 1.3.2 Nasal mucosa or skin trauma | 2 | 617 | Risk Ratio (M‐H, Random, 95% CI) | 3.66 [0.43, 31.48] |
| 1.4 Length of ICU stay (days) Show forest plot | 6 | 970 | Mean Difference (IV, Random, 95% CI) | 0.13 [‐0.02, 0.28] |
| 1.5 Short‐term respiratory effects: PaO 2/FiO 2 (mmHg) Show forest plot | 5 | 600 | Mean Difference (IV, Random, 95% CI) | 10.34 [‐17.31, 38.00] |
| 1.6 Comfort Show forest plot | 4 | Mean Difference (IV, Random, 95% CI) | Subtotals only | |
| 1.6.1 Short‐term effect | 4 | 662 | Mean Difference (IV, Random, 95% CI) | 0.31 [‐0.60, 1.22] |
| 1.6.2 Long‐term effect | 2 | 445 | Mean Difference (IV, Random, 95% CI) | 0.59 [‐2.29, 3.47] |
| 1.7 Long‐term respiratory effects: PaO 2/FiO 2 (mmHg) Show forest plot | 2 | 195 | Mean Difference (IV, Random, 95% CI) | 34.28 [‐19.25, 87.80] |
| 1.8 Short‐term and long‐term respiratory effects: PaO 2 (mmHg) Show forest plot | 5 | Mean Difference (IV, Random, 95% CI) | Subtotals only | |
| 1.8.1 Short‐term effects | 4 | 415 | Mean Difference (IV, Random, 95% CI) | 4.92 [‐1.24, 11.07] |
| 1.8.2 Long‐term effects | 2 | 644 | Mean Difference (IV, Random, 95% CI) | 12.27 [7.51, 17.04] |
| 1.9 Short‐term and long‐term respiratory effects: SpO 2 (%) Show forest plot | 5 | Mean Difference (IV, Random, 95% CI) | Subtotals only | |
| 1.9.1 Short‐term effects | 5 | 572 | Mean Difference (IV, Random, 95% CI) | 0.79 [‐0.29, 1.88] |
| 1.9.2 Long‐term effects | 2 | 445 | Mean Difference (IV, Random, 95% CI) | 1.28 [0.02, 2.55] |
| 1.10 Short‐term respiratory effects: PaCO 2 (mmHg) Show forest plot | 5 | 755 | Mean Difference (IV, Random, 95% CI) | ‐1.05 [‐2.24, 0.13] |
| 1.11 Short‐term and long‐term respiratory rate (breaths/min) Show forest plot | 9 | 1608 | Mean Difference (IV, Random, 95% CI) | ‐2.01 [‐3.19, ‐0.83] |
| 1.11.1 Short‐term effects | 8 | 1017 | Mean Difference (IV, Random, 95% CI) | ‐2.02 [‐3.66, ‐0.37] |
| 1.11.2 Long‐term effects | 4 | 591 | Mean Difference (IV, Random, 95% CI) | ‐2.01 [‐4.39, 0.37] |
| 1.12 Length of hospital stay (days) Show forest plot | 2 | 450 | Mean Difference (IV, Random, 95% CI) | ‐0.11 [‐0.43, 0.20] |
| 1.13 Refusal to continue with treatment Show forest plot | 2 | 560 | Risk Ratio (M‐H, Random, 95% CI) | 26.89 [3.67, 197.32] |
| Outcome or subgroup title | No. of studies | No. of participants | Statistical method | Effect size |
| 2.1 Treatment failure (escalation of respiratory support to NIV, NIPPV or invasive ventilation) Show forest plot | 5 | 1758 | Risk Ratio (M‐H, Random, 95% CI) | 0.98 [0.78, 1.22] |
| 2.1.1 Post‐extubation respiratory support | 3 | 1472 | Risk Ratio (M‐H, Random, 95% CI) | 1.12 [0.89, 1.41] |
| 2.1.2 Respiratory support without prior use of mechanical ventilation | 2 | 286 | Risk Ratio (M‐H, Random, 95% CI) | 0.77 [0.58, 1.03] |
| 2.2 In‐hospital mortality Show forest plot | 5 | 1758 | Risk Ratio (M‐H, Random, 95% CI) | 0.92 [0.64, 1.31] |
| 2.3 Important adverse events: pneumonia Show forest plot | 3 | 1750 | Risk Ratio (M‐H, Random, 95% CI) | 0.51 [0.17, 1.52] |
| 2.4 Short‐term respiratory effects: PaO 2/FiO 2 (mmHg) Show forest plot | 3 | 1086 | Mean Difference (IV, Random, 95% CI) | ‐58.10 [‐71.68, ‐44.51] |
| 2.5 Length of ICU stay (days) Show forest plot | 2 | 246 | Mean Difference (IV, Random, 95% CI) | ‐0.72 [‐2.85, 1.42] |
| 2.6 Short‐term comfort (continuous data) Show forest plot | 2 | 258 | Mean Difference (IV, Random, 95% CI) | 1.33 [0.74, 1.92] |
| 2.7 Duration of respiratory support (hours) Show forest plot | 2 | 210 | Mean Difference (IV, Random, 95% CI) | ‐6.12 [‐54.61, 42.37] |
| 2.8 Long‐term respiratory effects: PaO 2/FiO 2 (mmHg) Show forest plot | 2 | 344 | Mean Difference (IV, Random, 95% CI) | ‐31.67 [‐49.37, ‐13.97] |
| 2.9 Short‐term respiratory effects: PaO 2 (mmHg) Show forest plot | 2 | 384 | Mean Difference (IV, Random, 95% CI) | ‐9.57 [‐30.25, 11.11] |
| 2.10 Short‐term and long‐term respiratory effects: PaCO 2 (mmHg) Show forest plot | 4 | Mean Difference (IV, Random, 95% CI) | Subtotals only | |
| 2.10.1 Short‐term effects | 4 | 1254 | Mean Difference (IV, Random, 95% CI) | ‐0.46 [‐2.08, 1.16] |
| 2.10.2 Long‐term effects | 2 | 208 | Mean Difference (IV, Random, 95% CI) | ‐1.80 [‐5.57, 1.98] |
| 2.11 Short‐term respiratory effects: breaths/min Show forest plot | 4 | 1090 | Mean Difference (IV, Random, 95% CI) | ‐1.06 [‐1.80, ‐0.32] |
| 2.12 Dyspnoea (any improvement) Show forest plot | 2 | 1023 | Risk Ratio (M‐H, Random, 95% CI) | 1.05 [0.74, 1.48] |