Cirugía por la contractura de Dupuytren de los dedos
Información
- DOI:
- https://doi.org/10.1002/14651858.CD010143.pub2Copiar DOI

- Base de datos:
-
- Cochrane Database of Systematic Reviews
- Versión publicada:
-
- 09 diciembre 2015see what's new
- Tipo:
-
- Intervention
- Etapa:
-
- Review
- Grupo Editorial Cochrane:
-
Grupo Cochrane de Salud musculoesquelética
- Copyright:
-
- Copyright © 2015 The Cochrane Collaboration. Published by John Wiley & Sons, Ltd.
Cifras del artículo
Altmetric:
Citado por:
Autores
Contributions of authors
Jeremy Rodrigues
Contributed to authoring of the protocol. Referenced the protocol. Contributed to the design of the search strategy. Screened abstracts. Assessed risks of bias. Extracted data. Performed meta‐analysis. Co‐authored the main text. Read and approved the final version.
Giles Becker
Contributed to the design of the review. Contributed to the design of the statistical analysis. Screened abstracts. Read and approved the final version.
Cathy Ball
Contributed to the design of the protocol. Contributed to the search strategy. Assessed risks of bias. Extracted data. Read and approved the final version.
Weiya Zhang
Re‐designed the methodology and statistics components of the protocol, following review. Read and approved the final version.
Henk Giele
Contributed to the design of the review. Tested different search strategies to compare effectiveness and appropriateness. Read and approved the final version.
Jonathan Hobby
Contributed to the design of the protocol. In particular, contributed to the design of the statistical analysis. Read and approved the final version.
Anna L. Pratt
Contributed to the interpretation of results, particularly of the meta‐analysis. Read and approved the final version.
Tim Davis
Conceived of the review. Acted as guarantor of the review. Served as primary author of the protocol. Resolved conflicts in study selection, risk of bias assessment and data extraction. Contributed to the authorship of the review. Read and approved the final version.
Sources of support
Internal sources
-
No sources of support supplied
External sources
-
British Society for Surgery of the Hand (BSSH), UK.
Contributed to funding Mr Rodrigues' Research Fellowship
-
Nottingham Hospitals Charity, UK.
Contributed to funding Mr Rodrigues' Research Fellowship
-
Nottingham Orthopaedic Walk, UK.
Contributed to funding Mr Rodrigues' Research Fellowship
-
National Institute for Health and Care Excellence (NICE) Fellows & Scholars Programme, UK.
A scholarship has provided analytical and educational support during Mr Rodrigues' period of full‐time research, and a fellowship has provided further support since.
-
Kennedy Institute Trust for Rheumatology Research and Health Innovation Challenge Fund (Wellcome Trust + Department of Health), UK.
Contributed to funding Catherine Ball
Declarations of interest
None to declare.
Acknowledgements
The authors would like to thank the Cochrane Musculoskeletal Group for support provided, and Tamara Rader and Louise Falzon for assistance in developing the search strategy.
Version history
| Published | Title | Stage | Authors | Version |
| 2015 Dec 09 | Surgery for Dupuytren's contracture of the fingers | Review | Jeremy N Rodrigues, Giles W Becker, Cathy Ball, Weiya Zhang, Henk Giele, Jonathan Hobby, Anna L Pratt, Tim Davis | |
| 2012 Oct 17 | Surgery for Dupuytren's contractures of the fingers | Protocol | Tim Davis, Giles W Becker, Jeremy N Rodrigues, Cathy Ball, Henk Giele, Jonathan Hobby, Weiya Zhang | |
Differences between protocol and review
As the result of difficulty gaining access, the following resources were not searched.
-
Cochrane Wounds Group Specialised Register BNI (British Nursing Index and Archive).
-
Sciverse.
-
Zetoc.
As the journals listed for handsearching are currently indexed in databases searched electronically, we deemed handsearching to be redundant and we did not perform a handsearch.
Two additional resources were searched: ISI Web of Science was chosen as a source of conference abstracts, and clinicaltrials.gov was searched.
Given the comprehensive and inclusive nature of the search strategies listed in Appendix 1 and Appendix 2, and the large number of references retrieved (2464), we believe that this search was comprehensive.
The primary outcomes studied have been reordered to reflect the increasing importance of patient‐reported outcomes among clinical studies since the time the protocol was first written.
Keywords
MeSH
Medical Subject Headings (MeSH) Keywords
Medical Subject Headings Check Words
Humans;
PICO

Study flow diagram.

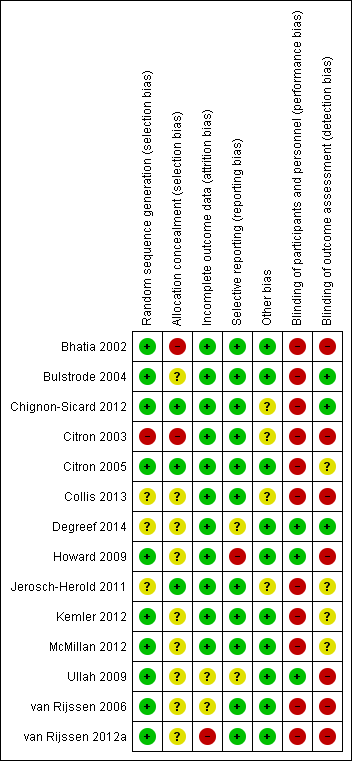
Risk of bias graph: review authors' judgements about each risk of bias item presented as percentages across all included studies.
Risk of bias summary: review authors' judgements about each risk of bias item for each included study.
Forest plot of comparison: 2 Effects of 3 months of postoperative night splinting (intention‐to‐treat), outcome: 2.1 DASH score at 3 months.
![Forest plot of comparison: 2 Effects of 3 months of postoperative night splinting (intention‐to‐treat), outcome: 2.2 Total active extension at 3 months [degrees].](/es/cdsr/doi/10.1002/14651858.CD010143.pub2/media/CDSR/CD010143/image_n/nCD010143-AFig-FIG05.png)
Forest plot of comparison: 2 Effects of 3 months of postoperative night splinting (intention‐to‐treat), outcome: 2.2 Total active extension at 3 months [degrees].
![Forest plot of comparison: 2 Effects of 3 months of postoperative night splinting (intention‐to‐treat), outcome: 2.3 Total active flexion at 3 months [degrees].](/es/cdsr/doi/10.1002/14651858.CD010143.pub2/media/CDSR/CD010143/image_n/nCD010143-AFig-FIG06.png)
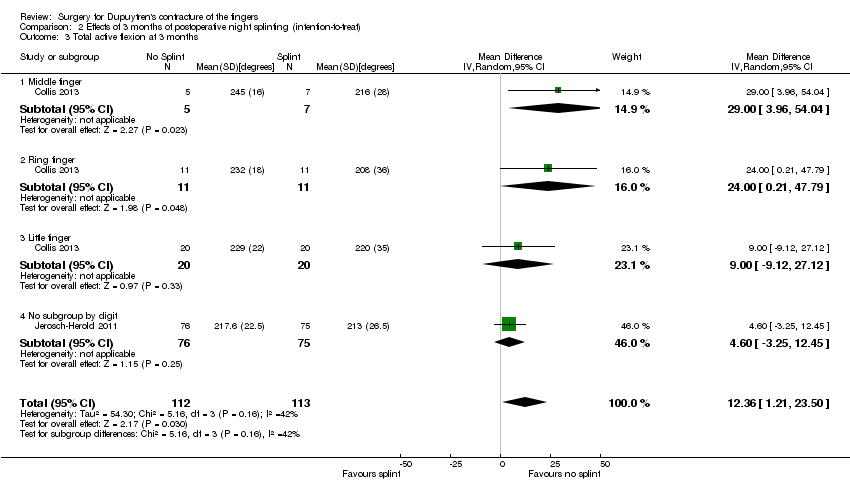
Forest plot of comparison: 2 Effects of 3 months of postoperative night splinting (intention‐to‐treat), outcome: 2.3 Total active flexion at 3 months [degrees].

Comparison 1 Preoperative measurements, Outcome 1 DASH.

Comparison 1 Preoperative measurements, Outcome 2 Total active extension.
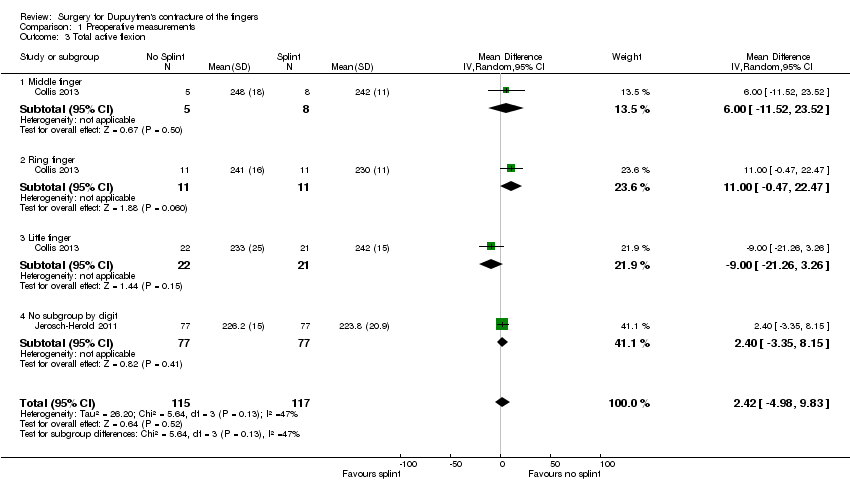
Comparison 1 Preoperative measurements, Outcome 3 Total active flexion.

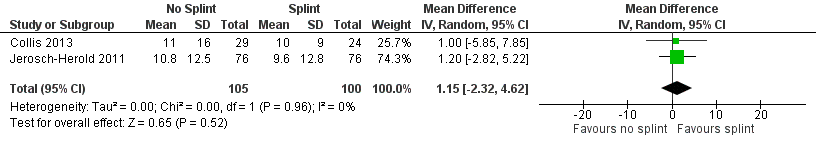
Comparison 2 Effects of 3 months of postoperative night splinting (intention‐to‐treat), Outcome 1 DASH score at 3 months.
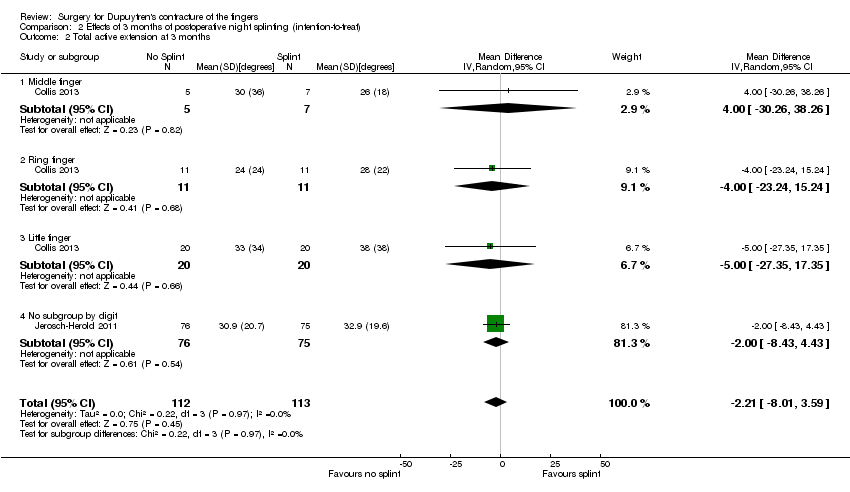
Comparison 2 Effects of 3 months of postoperative night splinting (intention‐to‐treat), Outcome 2 Total active extension at 3 months.
Comparison 2 Effects of 3 months of postoperative night splinting (intention‐to‐treat), Outcome 3 Total active flexion at 3 months.

Comparison 3 Effects of 3 months of postoperative night splinting (per‐protocol), Outcome 1 DASH score at 3 months.
![Comparison 3 Effects of 3 months of postoperative night splinting (per‐protocol), Outcome 2 Total active extension at 3 months [degrees].](/es/cdsr/doi/10.1002/14651858.CD010143.pub2/media/CDSR/CD010143/image_n/nCD010143-CMP-003-02.png)
Comparison 3 Effects of 3 months of postoperative night splinting (per‐protocol), Outcome 2 Total active extension at 3 months [degrees].
![Comparison 3 Effects of 3 months of postoperative night splinting (per‐protocol), Outcome 3 Total active flexion at 3 months [degrees].](/es/cdsr/doi/10.1002/14651858.CD010143.pub2/media/CDSR/CD010143/image_n/nCD010143-CMP-003-03.png)
Comparison 3 Effects of 3 months of postoperative night splinting (per‐protocol), Outcome 3 Total active flexion at 3 months [degrees].
| Comparison of operation types: early results of needle fasciotomy vs limited fasciectomy for Dupuytren's disease | |||||
| Patient or population: 125 hands in 121 participants with Dupuytren's disease of the fingers for early outcomes (van Rijssen 2006) Settings: single‐centre Dutch study Intervention: needle fasciotomy Comparison: limited fasciectomy | |||||
| Outcomesa | Illustrative comparative risks* (95% CI) | Number of participants | Quality of the evidence | Comments | |
| Assumed riskb | Corresponding risk | ||||
| Limited fasciectomy | Needle fasciotomy | ||||
| DASH hand function score at 5 weeks Major outcome group 1 (hand function) (scores between 0 and 100, where 0 represents no impairment in hand function and 100 represents maximum impairment in hand function) | Mean DASH hand function score in the fasciectomy group was 16 | DASH hand function score in the fasciotomy group was 5 lower than in the fasciectomy group | 97 | ⊕⊕⊝⊝ | P value = 0.017 as quoted in van Rijssen 2006 24/121 participants in the study did not adequately complete the DASH PROM tools Insufficient detail in article to allow calculation of 95% CI (standard deviations not provided) Unclear whether this is the most appropriate time point for study of 'early' outcome |
| Patient satisfaction at 6 weeks Major outcome group 2 (other PROM) (scores from "0 (no/very negative) to 10 (yes/very positive)") | See comment | See comment | 121 | ⊕⊕⊝⊝ | Data not described in van Rijssen 2006. Only level of significance provided P value = 0.002 as quoted in van Rijssen 2006 |
| Early angular outcome at 6 weeks for Tubiana grade I disease (total passive extension deficit (TPED) of the MCPJ, PIPJ and DIPJ for preoperative contractures with a TPED of 0 to 45 degrees) Early angular outcome at 6 weeks for Tubiana grade II disease (total passive extension deficit (TPED) of the MCPJ, PIPJ and DIPJ for preoperative contractures with a TPED of 45 to 90 degrees) Early angular outcome at 6 weeks for Tubiana grade III disease (total passive extension deficit (TPED) of the MCPJ, PIPJ and DIPJ for preoperative contractures with a TPED of 90 to 135 degrees) Early angular outcome at 6 weeks for Tubiana grade IV disease (total passive extension deficit (TPED) of the MCPJ, PIPJ and DIPJ for preoperative contractures with a TPED > 135 degrees) Major outcome group 3 (early objective measurement) | For Tubiana grade I disease, mean percentage reduction in TPED in the fasciectomy group was 82% For Tubiana grade II disease, mean percentage reduction in TPED in the fasciectomy group was 78% For Tubiana grade III disease, mean percentage reduction in TPED in the fasciectomy group was 75% For Tubiana grade IV disease, mean percentage reduction in TPED in the fasciectomy group was 79% | For Tubiana grade I disease, mean percentage reduction in TPED in the fasciotomy group was 11% lower than in the fasciectomy group For Tubiana grade II disease, mean percentage reduction in TPED in the fasciotomy group was 11% lower than in the fasciectomy group For Tubiana grade III disease, mean percentage reduction in TPED in the fasciotomy group was 29% lower than in the fasciectomy group For Tubiana grade IV disease, mean percentage reduction in TPED in the fasciotomy group was 32% lower than in the fasciectomy group | For grade I disease, 57 (1 study) For grade II disease, 70 (1 study) For grade III disease, 27 (1 study) For grade IV disease, 10 (1 study) | ⊕⊕⊝⊝ | For grade I disease, P value = 0.329 in van Rijssen 2006 For grade II disease, P value = 0.071 in van Rijssen 2006 For grade III disease, P value = 0.000 in van Rijssen 2006 For grade IV disease, P value = 0.004 in van Rijssen 2006 |
| Major outcome group 4 (recurrence) | See comment | See comment | See comment | See comment | Not studied in van Rijssen 2006 |
| Paraesthesia at 1 week Major outcome group 5 (adverse effects) Defined as "tingling sensations at any part of the treated digit without objective disturbance of sensation at the tip of the digit" per hand | 228 per 1000 | 67 per 1000 | 117 | ⊕⊕⊝⊝ | P value = 0.013 in van Rijssen 2006 Relative effect not calculated as only study available |
| *The basis for the assumed risk (e.g. median control group risk across studies) is provided in footnotes. The corresponding risk (and its 95% confidence interval) is based on the assumed risk in the comparison group and the relative effect of the intervention (and its 95% CI). | |||||
| GRADE Working Group grades of evidence. | |||||
| aRecurrence was not studied in van Rijssen 2006, as this article considered early outcomes only. Recurrence is a late effect, and recurrence in this trial is considered in the next 'Summary of findings' table. bAll assumed risks are based on mean values for limited fasciectomy as reported in van Rijssen 2006. cEvidence downgraded from high to low for DASH at 5 weeks because of significant attrition. van Rijssen 2006 had significant risk of performance and detection biases, and imprecision. dEvidence downgraded from high to low for patient satisfaction at 6 weeks, as scale used was not validated. van Rijssen 2006 had significant risk of performance and detection biases, and imprecision. eEvidence downgraded from high to low for early angular outcomes in grade I disease at 6 weeks, as van Rijssen 2006 had significant risk of performance and detection biases, and imprecision. fParaesthesia at 6 weeks downgraded from high to low, as scale was not validated. van Rijssen 2006 had significant risk of performance and detection biases, and imprecision. | |||||
| Comparison of operation types: late results of needle fasciotomy vs limited fasciectomy for Dupuytren's disease | |||||
| Patient or population: 93 participants (van Rijssen 2012a) Settings: single‐centre Dutch study Intervention: needle fasciotomy Comparison: limited fasciectomy | |||||
| Outcomes | Illustrative comparative risks* (95% CI) | Number of participants | Quality of the evidence | Comments | |
| Assumed risk | Corresponding risk | ||||
| Limited fasciectomy | Needle fasciotomy | ||||
| DASH hand function score at 5 years Major outcome group 1 (hand function) (scores between 0 and 100, where 0 represents no impairment in hand function and 100 represents maximum impairment in hand function) | See comment | See comment | See comment | See comment | Not studied in van Rijssen 2012a |
| Patient satisfaction at 5 years Major outcome group 2 (other PROM) (scores between "1 (not at all), 10 (excellent)") | Mean satisfaction score in fasciectomy group was 8.3 | Mean satisfaction score in fasciotomy group was 2.1 lower than in fasciectomy group | 93 | ⊕⊕⊝⊝ | P value < 0.001 as quoted in van Rijssen 2012a Likelihood of selecting treatment again significantly higher after fasciectomy (P value = 0.008) Insufficient detail in article to allow calculation of 95% CI (standard deviations not provided) |
| Major outcome group 3 (early angular outcome)b | See comment | See comment | See comment | See comment | This major outcome group is not relevant to a late outcome comparison |
| Recurrence at 5 years Major outcome group 4 (recurrence) Defined as reoperation or progressive angular deformity of 20 degrees in a successfully treated joint | 209 per 1000 | 849 per 1000 | 93 | ⊕⊕⊝⊝ | Progressive angular deformity defined in van Rijssen 2006 as an increase in TPED ≥ 30 degrees. In van Rijssen 2012a, different definitions used (increase of 20 degrees in a successfully treated joint) in other studies of Dupuytren's disease, such as Hurst 2009, acknowledged and applied P value < 0.001 in van Rijssen 2012a Relative effect not calculated, as only study available Recurrence rate influenced by the definition of recurrence used, and by length of follow‐up period |
| Major outcome group 5 (adverse effects)d | see comment | see comment | see comment | see comment | Not discussed in van Rijssen 2012a; analysed in van Rijssen 2006 |
| *The basis for the assumed risk (e.g. median control group risk across studies) is provided in footnotes. The corresponding risk (and its 95% confidence interval) is based on the assumed risk in the comparison group and the relative effect of the intervention (and its 95% CI). | |||||
| GRADE Working Group grades of evidence. | |||||
| aQuality of evidence for patient satisfaction at 5 years downgraded from high to low because of significant risks of bias in van Rijssen 2012a, and as the result of imprecision. cQuality of evidence for recurrence at 5 years downgraded from high to low because of significant risks of bias in van Rijssen 2012a, and as the result of imprecision. | |||||
| Comparison of operation types: firebreak skin grafting vs z‐plasty closure of fasciectomy for Dupuytren's disease | |||||
| Patient or population: 79 participants (Ullah 2009) Settings: single‐centre UK study Intervention: firebreak skin grafting to close incision Comparison: z‐plasty closure of incision | |||||
| Outcomes | Illustrative comparative risks* (95% CI) | Number of participants | Quality of the evidence | Comments | |
| Assumed risk | Corresponding risk | ||||
| z‐plasty | Firebreak skin grafting | ||||
| PEM hand function score at 3 years Major outcome group 1 (hand function) (scores between 0 and 77, where 0 represents no impairment in hand function and 77 represents maximum impairment in hand function) | See comment | See comment | 79 (1 study) | ⊕⊕⊝⊝ | Data represented graphically only; differences between groups described as not statistically significant; no P value provided |
| Major outcome group 2 (patient satisfaction and other PROM) | See comment | See comment | See comment | See comment | Not studied in Ullah 2009 |
| Correction of MCPJ and PIPJ deformities at Major outcome group 3 (early angular outcomes) | All MCPJs fully corrected Mean PIPJ correction 6 degrees in the z‐plasty group | All MCPJs also fully corrected Mean PIPJ correction no different (also 6 degrees) in the skin graft group from the z‐plasty group | 79 (1 study) | ⊕⊕⊝⊝ | |
| Progressive contracture by 3 years Major outcome group 4 (recurrence) | 109 per 1000 | 136 per 1000 | 79 (1 study) | ⊕⊕⊝⊝ | P value = 0.17 in Ullah 2009 Rates assessed per finger (90 fingers treated among 79 participants) |
| Hypoaesthesia Major outcome group 5 (adverse effects) | Radial digital nerve territory: 217 per 1000 Ulnar digital nerve territory: 217 per 1000 | Radial digital nerve territory: 341 per 1000 Ulnar digital nerve territory: 455 per 1000 | 79 (1 study) | ⊕⊕⊝⊝ | P value = 0.2 for radial digital nerve territory in Ullah 2009 P value = 0.03 for ulnar digital nerve territory in Ullah 2009 |
| *The basis for the assumed risk (e.g. median control group risk across studies) is provided in footnotes. The corresponding risk (and its 95% confidence interval) is based on the assumed risk in the comparison group and the relative effect of the intervention (and its 95% CI). | |||||
| GRADE Working Group grades of evidence. | |||||
| aQuality of evidence for PEM hand function score at 3 years downgraded from high to low, as neither data nor P value was provided to support statement, and as the result of imprecision. b,c,dQuality of evidence downgraded from high to low because of risks of bias and imprecision. | |||||
| Refining rehabilitation: three months of postoperative night splinting with hand therapy vs hand therapy alone for rehabilitation following surgery for Dupuytren's disease | |||||
| Patient or population: 210 participants with Dupuytren's disease of the fingers in 2 studies (225 digits reported across all studies) (Collis 2013; Jerosch‐Herold 2011) Settings: multi‐centre UK RCT and single‐centre New Zealand RCT Intervention: three months of night splinting in extension in addition to hand therapy ("splint") Comparison: hand therapy alone ("no splint") | |||||
| Outcomes | Illustrative comparative risks* (95% CI) | Number of participants | Quality of the evidence | Comments | |
| Assumed risk | Corresponding risk | ||||
| No splint | Splint | ||||
| DASH hand function score at 3 months Major outcome group 1 (hand function) (scores between 0 and 100, where 0 represents no impairment in hand function and 100 represents maximum impairment in hand function) | Mean DASH ranged across 'no splint' groups from | Mean DASH in 'splint' groups was 1.15 lower (95% CI ‐2.32 to 4.62) than in 'no splint' groups | 205 participants | ⊕⊕⊝⊝ | Unclear whether this is the most appropriate time point for study of 'early' outcome |
| Major outcome group 2 (patient satisfaction) | See comment | See comment | See comment | See comment | Not assessed in these studies |
| Total active extension at 3 months Major outcome group 3 (early objective measurement) Total active extension (TAE) of MCPJ, PIPJ and DIPJ; higher value indicates loss of extension and a worse outcome | Mean TAE ranged across 'no splint' groups from | Mean TAE in 'splint' groups was 2.21 degrees higher (95% CI ‐3.59 to 8.01) than in 'no splint' groups | 225 digits | ⊕⊕⊝⊝ | Unclear whether this is the most appropriate time point for study of 'early' outcome |
| Major outcome group 4 (recurrence) | See comment | See comment | See comment | See comment | Not assessed in these studies |
| Total active flexion at three months Major outcome group 5 (adverse effects) Total active flexion (TAF) of MCPJ, PIPJ and DIPJ; lower value indicates loss of flexion and a worse outcome | Mean TAF ranged across 'no splint' groups from | Mean TAF in 'splint' groups was 8.42 degrees lower (95% CI 1.78 to 15.07) than in 'no splint' groups | 225 digits | ⊕⊕⊝⊝ | Conflicting findings from subgroups Unclear whether this is the most appropriate time point for study of 'early' outcome |
| *The basis for the assumed risk (e.g. median control group risk across studies) is provided in footnotes. The corresponding risk (and its 95% confidence interval) is based on the assumed risk in the comparison group and the relative effect of the intervention (and its 95% CI). | |||||
| GRADE Working Group grades of evidence. | |||||
| a,b,cQuality of evidence was downgraded from high to low because of risks of bias and imprecision. | |||||
| Article | Aspect of care studied | Length of follow‐up, months | Outcomes measured | ||||||||
| Recurrence | Extension deficit | Flexion deficit | Total motion | PROM | Time | Complications as an outcome measure | Hand volume | Other | |||
| Technical refinement | 0.5 | ‐ | ‐ | ‐ | ‐ | + | + | ‐ | ‐ | Wound appearance | |
| Technical refinement | 18 | ‐ | + | ‐ | + | ‐ | + | ‐ | ‐ | ‐ | |
| Rehabilitation adjunct | 2 | ‐ | ‐ | ‐ | ‐ | ‐ | + | + | ‐ | ‐ | |
| Technical refinement | 24 | + | ‐ | + | ‐ | ‐ | ‐ | ‐ | ‐ | ‐ | |
| Technical refinement | 24 | + | + | ‐ | ‐ | ‐ | ‐ | ‐ | ‐ | ‐ | |
| Rehabilitation adjunct | 3 | ‐ | + | + | ‐ | + | ‐ | ‐ | ‐ | Grip strength, composite flexion | |
| Technical refinement | 24 | + | + | ‐ | ‐ | + | ‐ | + | ‐ | ‐ | |
| Technical refinement | 0.5 | ‐ | ‐ | ‐ | ‐ | + | + | ‐ | ‐ | ‐ | |
| Rehabilitation adjunct | 12 | ‐ | + | + | + | + | ‐ | ‐ | ‐ | ‐ | |
| Rehabilitation adjunct | 12 | ‐ | + | ‐ | ‐ | + | ‐ | + | ‐ | ‐ | |
| Technical refinement | 6 | ‐ | + | ‐ | ‐ | ‐ | ‐ | ‐ | ‐ | ‐ | |
| Procedure type | 36 | + | + | ‐ | + | + | + | ‐ | ‐ | Grip strength | |
| Procedure type | 1.5 | ‐ | + | + | ‐ | + | ‐ | + | ‐ | ‐ | |
| Procedure type | 60 | + | + | ‐ | ‐ | + | ‐ | ‐ | ‐ | ‐ |
| Tubiana stage preop | % improvement in TPED for needle fasciotomy | % improvement in TPED for fasciectomy | Significance of differences between procedures |
| I | 71 | 82 | 0.329 |
| II | 67 | 78 | 0.071 |
| III | 46 | 75 | 0.000 |
| IV | 47 | 79 | 0.004 |
| Outcome or subgroup title | No. of studies | No. of participants | Statistical method | Effect size |
| 1 DASH Show forest plot | 2 | 210 | Mean Difference (IV, Random, 95% CI) | 1.00 [‐2.74, 4.74] |
| 2 Total active extension Show forest plot | 2 | 240 | Mean Difference (IV, Random, 95% CI) | ‐1.89 [‐7.72, 3.94] |
| 2.1 Middle finger | 1 | 13 | Mean Difference (IV, Random, 95% CI) | ‐12.0 [‐33.20, 9.20] |
| 2.2 Ring finger | 1 | 22 | Mean Difference (IV, Random, 95% CI) | 9.0 [‐21.50, 39.50] |
| 2.3 Little finger | 1 | 51 | Mean Difference (IV, Random, 95% CI) | ‐12.0 [‐32.31, 8.31] |
| 2.4 No subgroup by digit | 1 | 154 | Mean Difference (IV, Random, 95% CI) | ‐0.40 [‐6.90, 6.10] |
| 3 Total active flexion Show forest plot | 2 | 232 | Mean Difference (IV, Random, 95% CI) | 2.42 [‐4.98, 9.83] |
| 3.1 Middle finger | 1 | 13 | Mean Difference (IV, Random, 95% CI) | 6.0 [‐11.52, 23.52] |
| 3.2 Ring finger | 1 | 22 | Mean Difference (IV, Random, 95% CI) | 11.00 [‐0.47, 22.47] |
| 3.3 Little finger | 1 | 43 | Mean Difference (IV, Random, 95% CI) | ‐9.0 [‐21.26, 3.26] |
| 3.4 No subgroup by digit | 1 | 154 | Mean Difference (IV, Random, 95% CI) | 2.40 [‐3.35, 8.15] |
| Outcome or subgroup title | No. of studies | No. of participants | Statistical method | Effect size |
| 1 DASH score at 3 months Show forest plot | 2 | 205 | Mean Difference (IV, Random, 95% CI) | 1.15 [‐2.32, 4.62] |
| 2 Total active extension at 3 months Show forest plot | 2 | 225 | Mean Difference (IV, Random, 95% CI) | ‐2.21 [‐8.01, 3.59] |
| 2.1 Middle finger | 1 | 12 | Mean Difference (IV, Random, 95% CI) | 4.0 [‐30.26, 38.26] |
| 2.2 Ring finger | 1 | 22 | Mean Difference (IV, Random, 95% CI) | ‐4.0 [‐23.24, 15.24] |
| 2.3 Little finger | 1 | 40 | Mean Difference (IV, Random, 95% CI) | ‐5.0 [‐27.35, 17.35] |
| 2.4 No subgroup by digit | 1 | 151 | Mean Difference (IV, Random, 95% CI) | ‐2.0 [‐8.43, 4.43] |
| 3 Total active flexion at 3 months Show forest plot | 2 | 225 | Mean Difference (IV, Random, 95% CI) | 12.36 [1.21, 23.50] |
| 3.1 Middle finger | 1 | 12 | Mean Difference (IV, Random, 95% CI) | 29.00 [3.96, 54.04] |
| 3.2 Ring finger | 1 | 22 | Mean Difference (IV, Random, 95% CI) | 24.0 [0.21, 47.79] |
| 3.3 Little finger | 1 | 40 | Mean Difference (IV, Random, 95% CI) | 9.0 [‐9.12, 27.12] |
| 3.4 No subgroup by digit | 1 | 151 | Mean Difference (IV, Random, 95% CI) | 4.60 [‐3.25, 12.45] |
| Outcome or subgroup title | No. of studies | No. of participants | Statistical method | Effect size |
| 1 DASH score at 3 months Show forest plot | 2 | 184 | Mean Difference (IV, Random, 95% CI) | 1.01 [‐2.85, 4.86] |
| 2 Total active extension at 3 months [degrees] Show forest plot | 2 | 206 | Mean Difference (IV, Random, 95% CI) | ‐9.50 [‐21.14, 2.15] |
| 2.1 Middle finger | 1 | 12 | Mean Difference (IV, Random, 95% CI) | 3.90 [‐29.81, 37.61] |
| 2.2 Ring finger | 1 | 22 | Mean Difference (IV, Random, 95% CI) | ‐16.9 [‐33.79, ‐0.01] |
| 2.3 Little finger | 1 | 39 | Mean Difference (IV, Random, 95% CI) | ‐22.20 [‐41.05, ‐3.35] |
| 2.4 No subgroup by digit | 1 | 133 | Mean Difference (IV, Random, 95% CI) | ‐1.90 [‐8.77, 4.97] |
| 3 Total active flexion at 3 months [degrees] Show forest plot | 2 | 206 | Mean Difference (IV, Random, 95% CI) | 12.64 [3.68, 21.60] |
| 3.1 Middle finger | 1 | 12 | Mean Difference (IV, Random, 95% CI) | 28.60 [3.79, 53.41] |
| 3.2 Ring finger | 1 | 22 | Mean Difference (IV, Random, 95% CI) | 21.70 [‐0.80, 44.20] |
| 3.3 Little finger | 1 | 39 | Mean Difference (IV, Random, 95% CI) | 13.10 [‐4.61, 30.81] |
| 3.4 No subgroup by digit | 1 | 133 | Mean Difference (IV, Random, 95% CI) | 6.80 [‐1.42, 15.02] |