Paracetamol (acetaminofeno) para el conducto arterioso persistente en lactantes prematuros o de bajo peso al nacer
Información
- DOI:
- https://doi.org/10.1002/14651858.CD010061.pub3Copiar DOI

- Base de datos:
-
- Cochrane Database of Systematic Reviews
- Versión publicada:
-
- 06 abril 2018see what's new
- Tipo:
-
- Intervention
- Etapa:
-
- Review
- Grupo Editorial Cochrane:
-
Grupo Cochrane de Neonatología
- Copyright:
-
- Copyright © 2018 The Cochrane Collaboration. Published by John Wiley & Sons, Ltd.
Cifras del artículo
Altmetric:
Citado por:
Autores
Contributions of authors
Both authors (AO, PS) contributed to all sections of this review.
Sources of support
Internal sources
-
Department of Pediatrics, Mount Sinai Hospital, Toronto, Ontario, Canada, Other.
External sources
-
National Institute for Health Research, UK.
Editorial support for Cochrane Neonatal has been funded with funds from a UK National Institute of Health Research (NIHR) Cochrane Programme Grant (16/114/03). The views expressed in this publication are those of the authors and not necessarily those of the National Health Service, the NIHR or the UK Department of Health.
Declarations of interest
Arne Ohlsson ‒ no conflict of interest to declare.
Prakeshkumar Shah ‒ no conflict of interest to declare.
Acknowledgements
We are grateful to Ms Jennifer Spano, Trials Search Co‐ordinator, Cochrane Neonatal Review Group, who conducted the literature searches in 2017. We are thankful to Dr Mehmet Yekta Oncel, who provided us with unpublished data from their study (Oncel 2014). We are thankful to Dr Hui Wu, who provided us with unpublished information form their study (Dang 2013). Dr Hamid Hakak translated the article by Asbagh 2015 from Farsi to English. Dr Kabra provided us with clarifying information regarding the trial by Dash 2015.
The Methods section of this review is based on a standard template used by Cochrane Neonatal.
Version history
| Published | Title | Stage | Authors | Version |
| 2022 Dec 15 | Paracetamol (acetaminophen) for patent ductus arteriosus in preterm or low birth weight infants | Review | Bonny Jasani, Souvik Mitra, Prakeshkumar S Shah | |
| 2020 Jan 27 | Paracetamol (acetaminophen) for patent ductus arteriosus in preterm or low birth weight infants | Review | Arne Ohlsson, Prakeshkumar S Shah | |
| 2018 Apr 06 | Paracetamol (acetaminophen) for patent ductus arteriosus in preterm or low birth weight infants | Review | Arne Ohlsson, Prakeshkumar S Shah | |
| 2015 Mar 11 | Paracetamol (acetaminophen) for patent ductus arteriosus in preterm or low‐birth‐weight infants | Review | Arne Ohlsson, Prakeshkumar S Shah | |
| 2012 Sep 12 | Paracetamol (acetaminophen) for patent ductus arteriosus in preterm and/or low‐birth‐weight infants | Protocol | Arne Ohlsson, Prakeshkumar S Shah | |
Differences between protocol and review
We made some minor wording changes to the primary outcome. We changed from 'Failure of PDA closure within a week of administration of the first dose of paracetamol (closure and failure of closure confirmed by echocardiographic criteria)' to 'Failure of PDA closure after the first course of paracetamol (closure and failure of closure confirmed by echocardiographic criteria)'. We have added a few outcomes that the authors of the included studies reported on but that we had not anticipated. We have indicated this for the specific outcomes that were not pre‐determined.
Keywords
MeSH
Medical Subject Headings (MeSH) Keywords
Medical Subject Headings Check Words
Humans; Infant, Newborn;
PICO

Study flow diagram: review update

Risk of bias graph: review authors' judgements about each risk of bias item presented as percentages across all included studies.

Risk of bias summary: review authors' judgements about each risk of bias item for each included study.

Forest plot of comparison: 1 Paracetamol (oral or IV) versus ibuprofen (oral or IV), outcome: 1.1 Failure of ductal closure after the first course of treatment.

Comparison 1 Paracetamol (oral or IV) versus ibuprofen (oral or IV), Outcome 1 Failure of ductal closure after the first course of treatment.

Comparison 1 Paracetamol (oral or IV) versus ibuprofen (oral or IV), Outcome 2 Neurodevelopmental impairment.
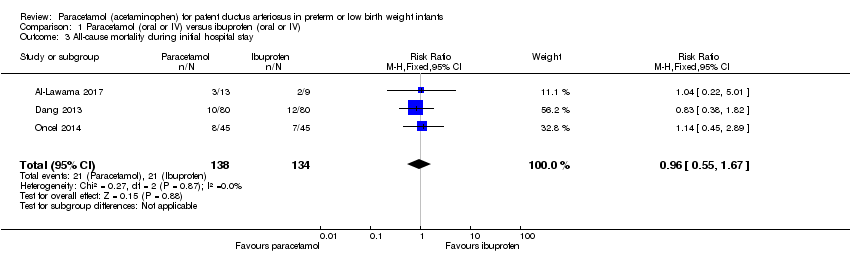
Comparison 1 Paracetamol (oral or IV) versus ibuprofen (oral or IV), Outcome 3 All‐cause mortality during initial hospital stay.
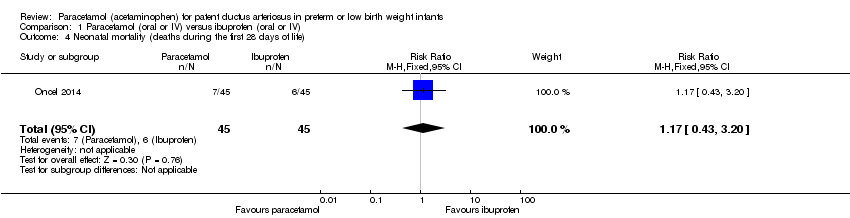
Comparison 1 Paracetamol (oral or IV) versus ibuprofen (oral or IV), Outcome 4 Neonatal mortality (deaths during the first 28 days of life).

Comparison 1 Paracetamol (oral or IV) versus ibuprofen (oral or IV), Outcome 5 Infant mortality (death during the first year of life).

Comparison 1 Paracetamol (oral or IV) versus ibuprofen (oral or IV), Outcome 6 Re‐opening of the ductus arteriosus.

Comparison 1 Paracetamol (oral or IV) versus ibuprofen (oral or IV), Outcome 7 Surgical closure of the PDA following treatment failure with paracetamol or ibuprofen.
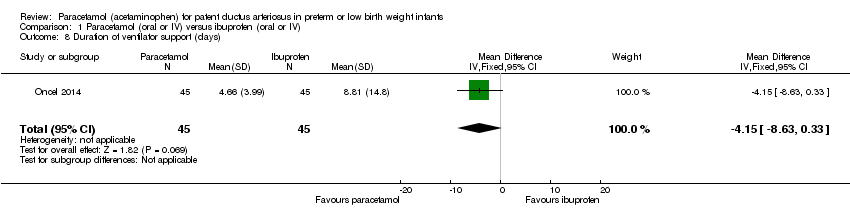
Comparison 1 Paracetamol (oral or IV) versus ibuprofen (oral or IV), Outcome 8 Duration of ventilator support (days).

Comparison 1 Paracetamol (oral or IV) versus ibuprofen (oral or IV), Outcome 9 Pulmonary haemorrhage.
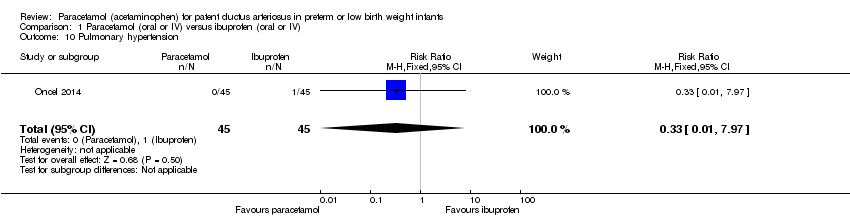
Comparison 1 Paracetamol (oral or IV) versus ibuprofen (oral or IV), Outcome 10 Pulmonary hypertension.

Comparison 1 Paracetamol (oral or IV) versus ibuprofen (oral or IV), Outcome 11 Duration for need of supplementary oxygen (days).

Comparison 1 Paracetamol (oral or IV) versus ibuprofen (oral or IV), Outcome 12 BPD at 28 days.
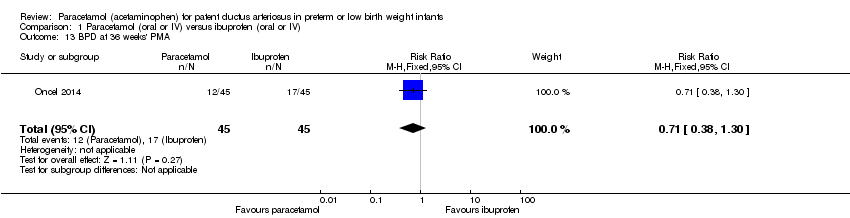
Comparison 1 Paracetamol (oral or IV) versus ibuprofen (oral or IV), Outcome 13 BPD at 36 weeks' PMA.

Comparison 1 Paracetamol (oral or IV) versus ibuprofen (oral or IV), Outcome 14 Moderate to severe BPD (according to the new criteria).
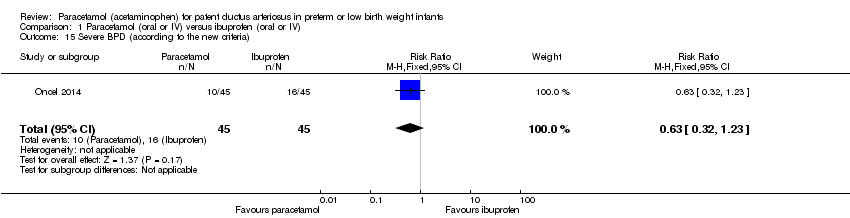
Comparison 1 Paracetamol (oral or IV) versus ibuprofen (oral or IV), Outcome 15 Severe BPD (according to the new criteria).

Comparison 1 Paracetamol (oral or IV) versus ibuprofen (oral or IV), Outcome 16 Intraventricular haemorrhage (grade I‐IV).

Comparison 1 Paracetamol (oral or IV) versus ibuprofen (oral or IV), Outcome 17 Severe IVH (Grade III‐IV).
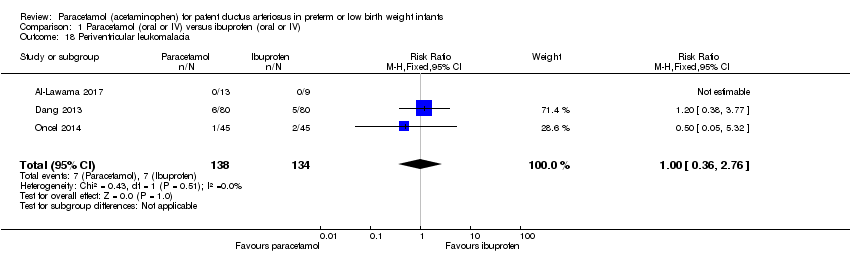
Comparison 1 Paracetamol (oral or IV) versus ibuprofen (oral or IV), Outcome 18 Periventricular leukomalacia.
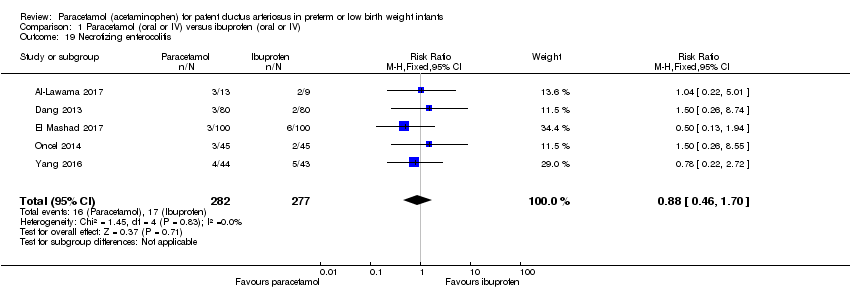
Comparison 1 Paracetamol (oral or IV) versus ibuprofen (oral or IV), Outcome 19 Necrotizing enterocolitis.

Comparison 1 Paracetamol (oral or IV) versus ibuprofen (oral or IV), Outcome 20 Intestinal perforation.
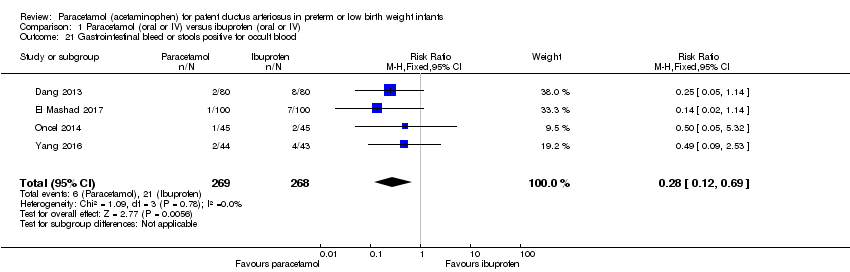
Comparison 1 Paracetamol (oral or IV) versus ibuprofen (oral or IV), Outcome 21 Gastrointestinal bleed or stools positive for occult blood.

Comparison 1 Paracetamol (oral or IV) versus ibuprofen (oral or IV), Outcome 22 Retinopathy of prematurity ‐ any stage.

Comparison 1 Paracetamol (oral or IV) versus ibuprofen (oral or IV), Outcome 23 Retinopathy of prematurity stage ≥ 3.
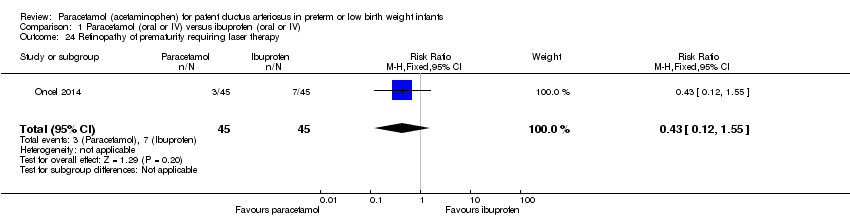
Comparison 1 Paracetamol (oral or IV) versus ibuprofen (oral or IV), Outcome 24 Retinopathy of prematurity requiring laser therapy.
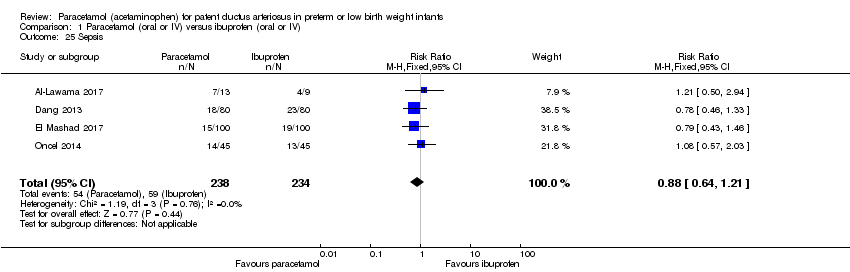
Comparison 1 Paracetamol (oral or IV) versus ibuprofen (oral or IV), Outcome 25 Sepsis.

Comparison 1 Paracetamol (oral or IV) versus ibuprofen (oral or IV), Outcome 26 Oliguria (< 1 mL/kg/h).

Comparison 1 Paracetamol (oral or IV) versus ibuprofen (oral or IV), Outcome 27 Serum levels of creatinine after treatment µmol/L.
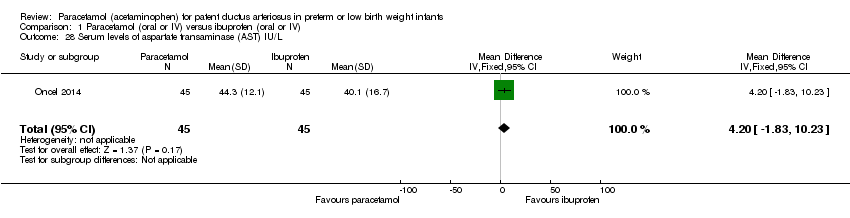
Comparison 1 Paracetamol (oral or IV) versus ibuprofen (oral or IV), Outcome 28 Serum levels of aspartate transaminase (AST) IU/L.
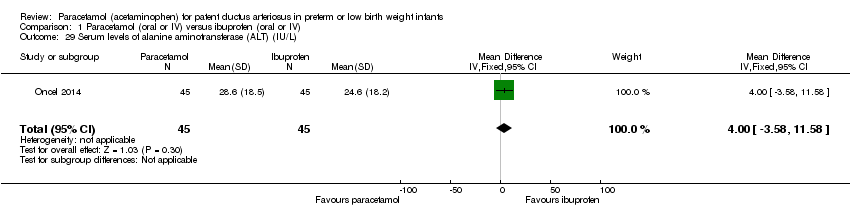
Comparison 1 Paracetamol (oral or IV) versus ibuprofen (oral or IV), Outcome 29 Serum levels of alanine aminotransferase (ALT) (IU/L).

Comparison 1 Paracetamol (oral or IV) versus ibuprofen (oral or IV), Outcome 30 Serum bilirubin following treatment (µmol/L).

Comparison 1 Paracetamol (oral or IV) versus ibuprofen (oral or IV), Outcome 31 Hyperbilirubinaemia (serum bilirubin level higher than the exchange level according to the postnatal age and BW).

Comparison 1 Paracetamol (oral or IV) versus ibuprofen (oral or IV), Outcome 32 Duration of hospitalisation (days).

Comparison 1 Paracetamol (oral or IV) versus ibuprofen (oral or IV), Outcome 33 MDI < 70.
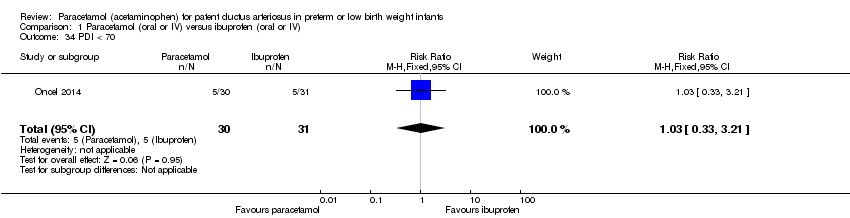
Comparison 1 Paracetamol (oral or IV) versus ibuprofen (oral or IV), Outcome 34 PDI < 70.

Comparison 1 Paracetamol (oral or IV) versus ibuprofen (oral or IV), Outcome 35 Moderate to severe cerebral palsy.
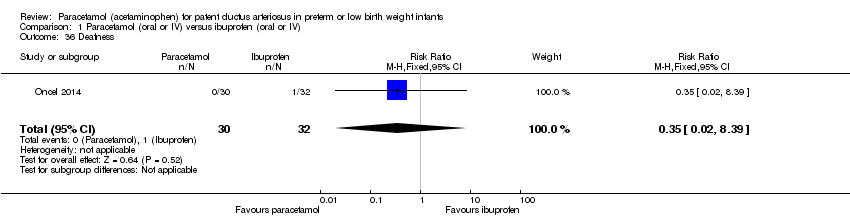
Comparison 1 Paracetamol (oral or IV) versus ibuprofen (oral or IV), Outcome 36 Deafness.

Comparison 1 Paracetamol (oral or IV) versus ibuprofen (oral or IV), Outcome 37 Blindness.

Comparison 1 Paracetamol (oral or IV) versus ibuprofen (oral or IV), Outcome 38 MDI.

Comparison 1 Paracetamol (oral or IV) versus ibuprofen (oral or IV), Outcome 39 PDI.

Comparison 1 Paracetamol (oral or IV) versus ibuprofen (oral or IV), Outcome 40 BPD (age not stated).

Comparison 1 Paracetamol (oral or IV) versus ibuprofen (oral or IV), Outcome 41 Plasma PGE2 (ng/L).
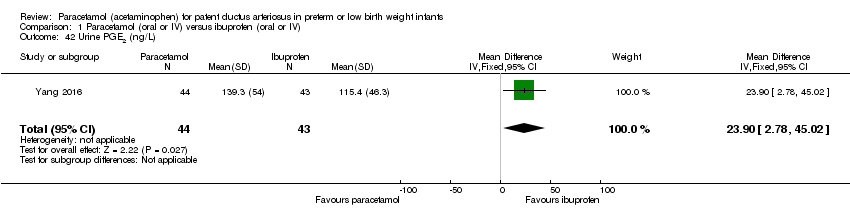
Comparison 1 Paracetamol (oral or IV) versus ibuprofen (oral or IV), Outcome 42 Urine PGE2 (ng/L).
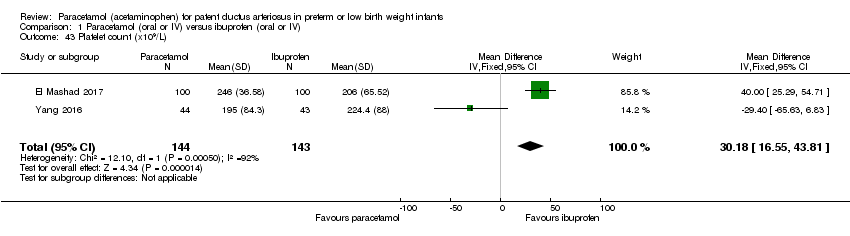
Comparison 1 Paracetamol (oral or IV) versus ibuprofen (oral or IV), Outcome 43 Platelet count (x109/L).

Comparison 1 Paracetamol (oral or IV) versus ibuprofen (oral or IV), Outcome 44 Glutamic‐pyruvic transaminase (U/L).
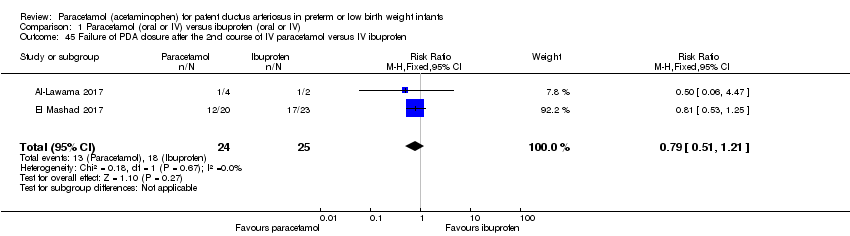
Comparison 1 Paracetamol (oral or IV) versus ibuprofen (oral or IV), Outcome 45 Failure of PDA closure after the 2nd course of IV paracetamol versus IV ibuprofen.

Comparison 1 Paracetamol (oral or IV) versus ibuprofen (oral or IV), Outcome 46 Daily urine output (mL/kg/hour).

Comparison 2 Prophylactic administration of paracetamol (oral or IV) versus placebo (IV) or no intervention, Outcome 1 Failure of ductal closure after 4 to 5 days of treatment.

Comparison 2 Prophylactic administration of paracetamol (oral or IV) versus placebo (IV) or no intervention, Outcome 2 Death.

Comparison 2 Prophylactic administration of paracetamol (oral or IV) versus placebo (IV) or no intervention, Outcome 3 Oliguria (< 1 mL/kg/h).
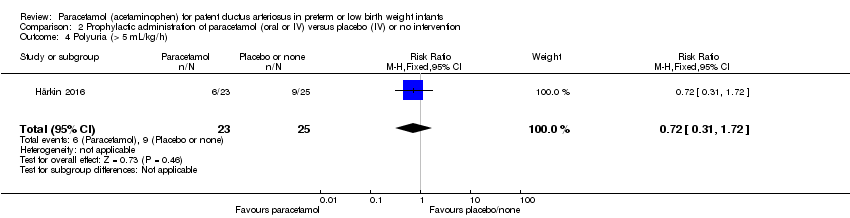
Comparison 2 Prophylactic administration of paracetamol (oral or IV) versus placebo (IV) or no intervention, Outcome 4 Polyuria (> 5 mL/kg/h).

Comparison 2 Prophylactic administration of paracetamol (oral or IV) versus placebo (IV) or no intervention, Outcome 5 Hypernatraemia (> 150 µmol/L).

Comparison 2 Prophylactic administration of paracetamol (oral or IV) versus placebo (IV) or no intervention, Outcome 6 Sepsis.
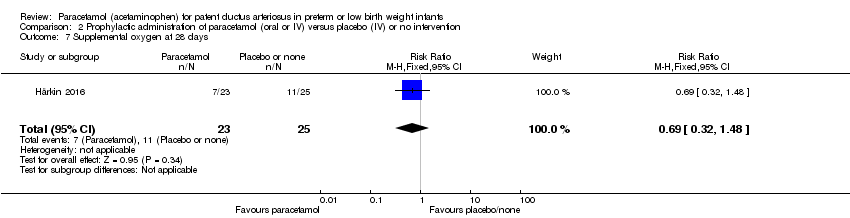
Comparison 2 Prophylactic administration of paracetamol (oral or IV) versus placebo (IV) or no intervention, Outcome 7 Supplemental oxygen at 28 days.
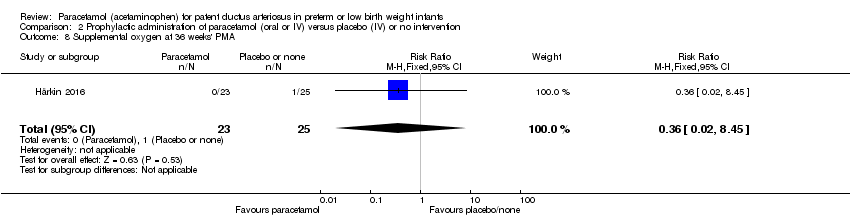
Comparison 2 Prophylactic administration of paracetamol (oral or IV) versus placebo (IV) or no intervention, Outcome 8 Supplemental oxygen at 36 weeks' PMA.

Comparison 2 Prophylactic administration of paracetamol (oral or IV) versus placebo (IV) or no intervention, Outcome 9 ROP (treated).
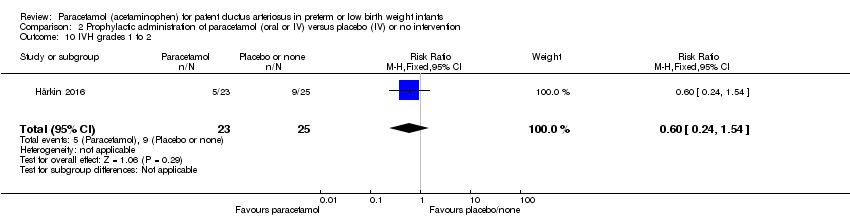
Comparison 2 Prophylactic administration of paracetamol (oral or IV) versus placebo (IV) or no intervention, Outcome 10 IVH grades 1 to 2.

Comparison 2 Prophylactic administration of paracetamol (oral or IV) versus placebo (IV) or no intervention, Outcome 11 IVH grades 3 to 4.

Comparison 2 Prophylactic administration of paracetamol (oral or IV) versus placebo (IV) or no intervention, Outcome 12 NEC stage 3.

Comparison 2 Prophylactic administration of paracetamol (oral or IV) versus placebo (IV) or no intervention, Outcome 13 Days of supplemental oxygen.

Comparison 2 Prophylactic administration of paracetamol (oral or IV) versus placebo (IV) or no intervention, Outcome 14 Highest serum bilirubin µmol/L.

Comparison 3 Paracetamol (oral or IV) versus indomethacin (IV), Outcome 1 Failure to close a PDA.

Comparison 3 Paracetamol (oral or IV) versus indomethacin (IV), Outcome 2 Renal impairment.

Comparison 3 Paracetamol (oral or IV) versus indomethacin (IV), Outcome 3 GI bleed.

Comparison 3 Paracetamol (oral or IV) versus indomethacin (IV), Outcome 4 NEC (all grades).

Comparison 3 Paracetamol (oral or IV) versus indomethacin (IV), Outcome 5 Sepsis.

Comparison 3 Paracetamol (oral or IV) versus indomethacin (IV), Outcome 6 Pulmonary haemorrhage.
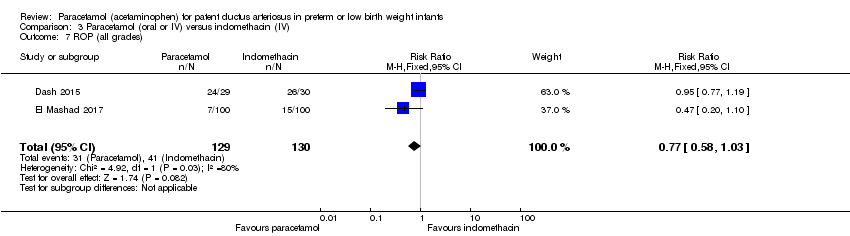
Comparison 3 Paracetamol (oral or IV) versus indomethacin (IV), Outcome 7 ROP (all grades).

Comparison 3 Paracetamol (oral or IV) versus indomethacin (IV), Outcome 8 Severe ROP needing treatment.

Comparison 3 Paracetamol (oral or IV) versus indomethacin (IV), Outcome 9 IVH (all grades).
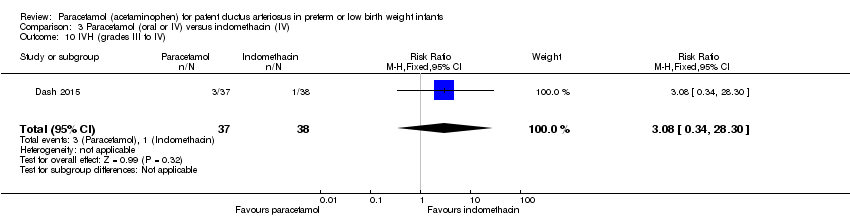
Comparison 3 Paracetamol (oral or IV) versus indomethacin (IV), Outcome 10 IVH (grades III to IV).
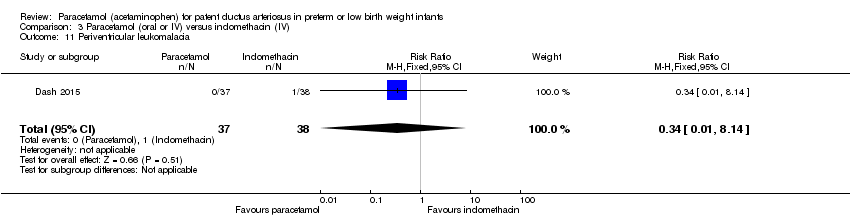
Comparison 3 Paracetamol (oral or IV) versus indomethacin (IV), Outcome 11 Periventricular leukomalacia.

Comparison 3 Paracetamol (oral or IV) versus indomethacin (IV), Outcome 12 Oxygen requirement at 28 days of age.

Comparison 3 Paracetamol (oral or IV) versus indomethacin (IV), Outcome 13 Oxygen requirement at ≥ 36 weeks' PMA.
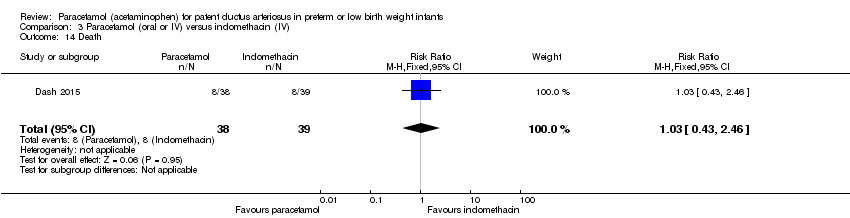
Comparison 3 Paracetamol (oral or IV) versus indomethacin (IV), Outcome 14 Death.

Comparison 3 Paracetamol (oral or IV) versus indomethacin (IV), Outcome 15 Serum creatinine (µmol/L).

Comparison 3 Paracetamol (oral or IV) versus indomethacin (IV), Outcome 16 Failure to close a PDA after a 2nd course of IV paracetamol versus IV indomethacin.
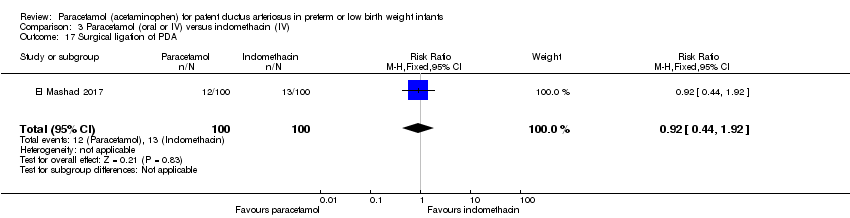
Comparison 3 Paracetamol (oral or IV) versus indomethacin (IV), Outcome 17 Surgical ligation of PDA.
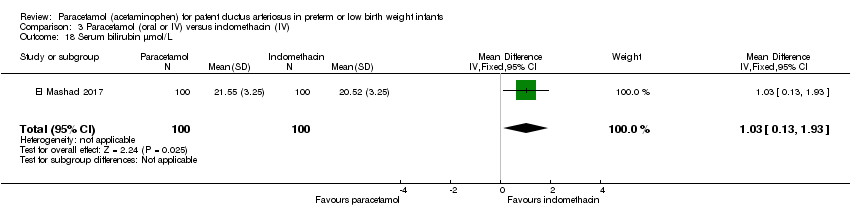
Comparison 3 Paracetamol (oral or IV) versus indomethacin (IV), Outcome 18 Serum bilirubin µmol/L.
Comparison 3 Paracetamol (oral or IV) versus indomethacin (IV), Outcome 19 Platelet count (x109/L).

Comparison 3 Paracetamol (oral or IV) versus indomethacin (IV), Outcome 20 Daily urine output (mL/kg/h).
| Paracetamol (oral or IV) compared to ibuprofen (oral or IV) for patent ductus arteriosus in preterm or low birth weight infants | ||||||
| Patient or population: preterm or low birth weight infants with patent ductus arteriosus | ||||||
| Outcomes | Illustrative comparative risks* (95% CI) | Relative effect | No of participants | Quality of the evidence | Comments | |
| Assumed risk | Corresponding risk | |||||
| Oral ibuprofen | Oral paracetamol | |||||
| Failure of ductal closure after the first course of treatment | High risk study population | RR 0.95 | 559 | ⊕⊕⊕⊝ | Bias: we had no concerns for random sequence generation in the 5 included trials but the allocation concealment was unclear in 1 of the studies. We did not downgrade the quality of evidence on this item. There were concerns about blinding of personnel and of blinding of outcome assessments. We downgraded the quality of the evidence by 1 step. Heterogeneity/Consistency: we noted no heterogeneity (I² = 0% for both RR and RD). Directness of evidence: studies were conducted in the target population. Precision: because of the relatively large sample size (559 infants), the point estimate was precise with a narrow 95% CI. Presence of publication bias: Although only 5 studies were included, the funnel plot we constructed was symmetrical. | |
| 329 per 1000 | 312 per 1000 | |||||
| All‐cause mortality during initial hospital stay | High risk study population | RR 0.96 | 272 | ⊕⊕⊕⊝ | Bias: we had no concerns regarding the assessment of mortality. Heterogeneity/Consistency: we noted no heterogeneity (I² = 0% for both RR and RD). Directness of evidence: studies were conducted in the target population. Precision: because of the relatively small sample size (272 infants), the point estimate was not precise with a wide 95% CI. We downgraded the quality of the evidence by 1 step. Presence of publication bias: as only 3 studies were included we did not perform a funnel plot. | |
| 152 per 1000 | 152 per 1000 | |||||
| Neurodevelopmental impairment Clinical assessments by assessors blinded to group assignment, no risk of bias | High risk study population | RR 0.93 | 61 | ⊕⊕⊝⊝ | Bias: of the 75 infants eligible for follow‐up at 18 to 24 months' corrected age 61 infants were evaluated (81%).The assessor was blinded to the previous assignment to paracetamol or ibuprofen groups. Heterogeneity/Consistency: as only 1 study was included in the analysis, tests for heterogeneity were not applicable. Precision: because of the small sample size of the only included study (61 infants), the point estimate was not precise with a wide 95% CI. We downgraded the quality of the evidence by 2 steps. Presence of publication bias: as only 1 study was included we did not perform a funnel plot. | |
| 323 per 1000 | 300 per 1000 | |||||
| Gastrointestinal bleed or stools positive for occult blood | High risk study population | RR 0.28 | 537 | ⊕⊕⊕⊝ | Bias: we had no concerns for random sequence generation in the 4 included trials but the allocation concealment was unclear in 1 of the studies. We did not downgrade the quality of evidence on this item. There were concerns about blinding of personnel and of blinding of outcome assessments. We downgraded the quality of the evidence by 1 step. Heterogeneity/Consistency: we noted no heterogeneity (I² = 0% for both RR and RD). Directness of evidence: studies were conducted in the target population. Precision: because of the relatively large sample size (537 infants), the point estimate was precise with a narrow 95% CI. Presence of publication bias: as only 5 studies were included we did not construct a funnel plot. | |
| 78 per 1000 | 22 per 1000 | |||||
| Serum levels of creatinine after treatment (µmol/L) | The weighted mean difference (WMD) for serum levels of creatinine after treatment mmol/L in the intervention (paracetamol) group was 8.92 µmol/L lower | 537 | ⊕⊕⊕⊝ | Bias: we had no concerns for random sequence generation in the 4 included trials but the allocation concealment was unclear in 1 of the studies. We did not downgrade the quality of evidence on this item. There were concerns about blinding of personnel and of blinding of outcome assessments. However, for an objective outcome of serum creatinine level we have not downgraded the evidence. Heterogeneity/Consistency: there was high heterogeneity (I² = 84%) for WMD. We downgraded the quality of the evidence by 1 step. Directness of evidence: studies were conducted in the target population. Precision: because of the relatively large sample size (537 infants), the point estimate was precise with a narrow 95% CI. Presence of publication bias: As only 4 studies were included we did not construct a funnel plot. | ||
| *The basis for the assumed risk (e.g. the median control group risk across studies) is provided in footnotes. The corresponding risk (and its 95% CI) is based on the assumed risk in the comparison group and the relative effect of the intervention (and its 95% CI). | ||||||
| GRADE Working Group grades of evidence | ||||||
| Prophylactic administration of paracetamol (oral or IV) versus placebo (IV) or no intervention for patent ductus arteriosus | ||||||
| Patient or population: preterm infants with patent ductus arteriosus Settings: Neonatal intensive care units Intervention: paracetamol Comparison: placebo or no intervention | ||||||
| Outcomes | Illustrative comparative risks* (95% CI) | Relative effect | No of Participants | Quality of the evidence | Comments | |
| Assumed risk | Corresponding risk | |||||
| Placebo or no intervention | Paracetamol | |||||
| Failure of ductal closure after 4 to 5 days of treatment PDA diagnosed by ECHO | High risk population | RR 0.49 (0.24 to1.00) | 80 | ⊕⊕⊝⊝ | Bias: the study by Härkin 2016 was of the highest quality and with no concerns about bias. For the study by Asbagh 2015 allocation concealment was unclear as was the blinding of personnel and outcome assessments and possible reporting bias. We downgraded the quality by 1 step. Heterogeneity/Consistency: we noted no heterogeneity (I² = 0% for both RR and RD). Directness of evidence: studies were conducted in the target population. Precision: because of the small sample size (80 infants), the point estimate although not statistically significant for RR was significant for RD. The confidence interval was wide. We downgraded the quality by 1 step. Presence of publication bias: as only 2 studies were included we did not construct a funnel plot. | |
| 415 per 1000 | 205 per 1000 | |||||
| Death Clinical assessment | High risk population | RR 0.35 (0.04 to 3.20) | 80 | ⊕⊕⊕⊝ | Bias: we had no concerns regarding the assessment of mortality. Heterogeneity/Consistency: we noted no heterogeneity (I² = 0% for both RR and RD). Directness of evidence: studies were conducted in the target population. Precision: because of the small sample size (80 infants), the point estimate was not precise with a wide 95% CI. We downgraded the quality of the evidence by 1 step. Presence of publication bias: as only 3 studies were included we did not perform a funnel plot. | |
| 49 per 1000 | 0 per 1000 | |||||
| *The basis for the assumed risk (e.g. the median control group risk across studies) is provided in footnotes. The corresponding risk (and its 95% CI) is based on the assumed risk in the comparison group and the relative effect of the intervention (and its 95% CI). | ||||||
| GRADE Working Group grades of evidence | ||||||
| Paracetamol (oral or IV) compared with indomethacin (IV) for patent ductus arteriosus | ||||||
| Patient or population: preterm infants with patent ductus arteriosus Settings: Neonatal intensive care unit Intervention: paracetamol Comparison: indomethacin | ||||||
| Outcomes | Illustrative comparative risks* (95% CI) | Relative effect | No of Participants | Quality of the evidence | Comments | |
| Assumed risk | Corresponding risk | |||||
| Indomethacin | Paracetamol | |||||
| Failure to close a PDA Assessed by ECHO | High‐risk population | RR 0.96 (0.55 to 1.65) | 273 | ⊕⊕⊕⊝ | Bias: we had no concerns for random sequence generation or allocation concealment in the 2 included studies. However we did raise concerns regarding blinding of personnel and outcome assessments and for reporting bias our judgement was unclear. We downgraded the quality of evidence on this item by 1 step. Heterogeneity/Consistency: we noted no heterogeneity (I² = 11% for RR and 17% for RD) (none). Directness of evidence: studies were conducted in the target population. Precision: because of the relatively large sample size (237 infants), the point estimate was quite precise with a narrow 95% CI. Presence of publication bias: although only 5 studies were included the funnel plot was symmetrical. | |
| 153 per 1000 | 147 per 1000 | |||||
| *The basis for the assumed risk (e.g. the median control group risk across studies) is provided in footnotes. The corresponding risk (and its 95% CI) is based on the assumed risk in the comparison group and the relative effect of the intervention (and its 95% CI). | ||||||
| GRADE Working Group grades of evidence | ||||||
| Outcome or subgroup title | No. of studies | No. of participants | Statistical method | Effect size |
| 1 Failure of ductal closure after the first course of treatment Show forest plot | 5 | 559 | Risk Ratio (M‐H, Fixed, 95% CI) | 0.95 [0.75, 1.21] |
| 2 Neurodevelopmental impairment Show forest plot | 1 | 61 | Risk Difference (M‐H, Fixed, 95% CI) | ‐0.02 [‐0.25, 0.21] |
| 3 All‐cause mortality during initial hospital stay Show forest plot | 3 | 272 | Risk Ratio (M‐H, Fixed, 95% CI) | 0.96 [0.55, 1.67] |
| 4 Neonatal mortality (deaths during the first 28 days of life) Show forest plot | 1 | 90 | Risk Ratio (M‐H, Fixed, 95% CI) | 1.17 [0.43, 3.20] |
| 5 Infant mortality (death during the first year of life) Show forest plot | 1 | 90 | Risk Ratio (M‐H, Fixed, 95% CI) | 1.14 [0.45, 2.89] |
| 6 Re‐opening of the ductus arteriosus Show forest plot | 2 | 143 | Risk Ratio (M‐H, Fixed, 95% CI) | 1.04 [0.50, 2.18] |
| 7 Surgical closure of the PDA following treatment failure with paracetamol or ibuprofen Show forest plot | 2 | 290 | Risk Ratio (M‐H, Fixed, 95% CI) | 0.68 [0.35, 1.32] |
| 8 Duration of ventilator support (days) Show forest plot | 1 | 90 | Mean Difference (IV, Fixed, 95% CI) | ‐4.15 [‐8.63, 0.33] |
| 9 Pulmonary haemorrhage Show forest plot | 3 | 312 | Risk Ratio (M‐H, Fixed, 95% CI) | 0.63 [0.23, 1.74] |
| 10 Pulmonary hypertension Show forest plot | 1 | 90 | Risk Ratio (M‐H, Fixed, 95% CI) | 0.33 [0.01, 7.97] |
| 11 Duration for need of supplementary oxygen (days) Show forest plot | 1 | 90 | Mean Difference (IV, Fixed, 95% CI) | ‐12.40 [‐22.97, ‐1.83] |
| 12 BPD at 28 days Show forest plot | 1 | 90 | Risk Ratio (M‐H, Fixed, 95% CI) | 0.79 [0.46, 1.35] |
| 13 BPD at 36 weeks' PMA Show forest plot | 1 | 90 | Risk Ratio (M‐H, Fixed, 95% CI) | 0.71 [0.38, 1.30] |
| 14 Moderate to severe BPD (according to the new criteria) Show forest plot | 1 | 160 | Risk Ratio (M‐H, Fixed, 95% CI) | 0.8 [0.22, 2.87] |
| 15 Severe BPD (according to the new criteria) Show forest plot | 1 | 90 | Risk Ratio (M‐H, Fixed, 95% CI) | 0.63 [0.32, 1.23] |
| 16 Intraventricular haemorrhage (grade I‐IV) Show forest plot | 5 | 559 | Risk Ratio (M‐H, Fixed, 95% CI) | 0.97 [0.77, 1.23] |
| 17 Severe IVH (Grade III‐IV) Show forest plot | 3 | 272 | Risk Ratio (M‐H, Fixed, 95% CI) | 1.0 [0.30, 3.37] |
| 18 Periventricular leukomalacia Show forest plot | 3 | 272 | Risk Ratio (M‐H, Fixed, 95% CI) | 1.0 [0.36, 2.76] |
| 19 Necrotizing enterocolitis Show forest plot | 5 | 559 | Risk Ratio (M‐H, Fixed, 95% CI) | 0.88 [0.46, 1.70] |
| 20 Intestinal perforation Show forest plot | 1 | 90 | Risk Ratio (M‐H, Fixed, 95% CI) | 0.0 [0.0, 0.0] |
| 21 Gastrointestinal bleed or stools positive for occult blood Show forest plot | 4 | 537 | Risk Ratio (M‐H, Fixed, 95% CI) | 0.28 [0.12, 0.69] |
| 22 Retinopathy of prematurity ‐ any stage Show forest plot | 4 | 472 | Risk Ratio (M‐H, Fixed, 95% CI) | 0.71 [0.42, 1.23] |
| 23 Retinopathy of prematurity stage ≥ 3 Show forest plot | 1 | 90 | Risk Ratio (M‐H, Fixed, 95% CI) | 0.43 [0.12, 1.55] |
| 24 Retinopathy of prematurity requiring laser therapy Show forest plot | 1 | 90 | Risk Ratio (M‐H, Fixed, 95% CI) | 0.43 [0.12, 1.55] |
| 25 Sepsis Show forest plot | 4 | 472 | Risk Ratio (M‐H, Fixed, 95% CI) | 0.88 [0.64, 1.21] |
| 26 Oliguria (< 1 mL/kg/h) Show forest plot | 3 | 337 | Risk Ratio (M‐H, Fixed, 95% CI) | 0.46 [0.20, 1.10] |
| 27 Serum levels of creatinine after treatment µmol/L Show forest plot | 4 | 537 | Mean Difference (IV, Fixed, 95% CI) | ‐8.92 [‐11.28, ‐6.55] |
| 28 Serum levels of aspartate transaminase (AST) IU/L Show forest plot | 1 | 90 | Mean Difference (IV, Fixed, 95% CI) | 4.20 [‐1.83, 10.23] |
| 29 Serum levels of alanine aminotransferase (ALT) (IU/L) Show forest plot | 1 | 90 | Mean Difference (IV, Fixed, 95% CI) | 4.0 [‐3.58, 11.58] |
| 30 Serum bilirubin following treatment (µmol/L) Show forest plot | 2 | 290 | Mean Difference (IV, Fixed, 95% CI) | ‐11.25 [‐13.88, ‐8.62] |
| 31 Hyperbilirubinaemia (serum bilirubin level higher than the exchange level according to the postnatal age and BW) Show forest plot | 1 | 160 | Risk Ratio (M‐H, Fixed, 95% CI) | 0.57 [0.34, 0.97] |
| 32 Duration of hospitalisation (days) Show forest plot | 1 | 90 | Mean Difference (IV, Fixed, 95% CI) | ‐6.5 [‐21.42, 8.42] |
| 33 MDI < 70 Show forest plot | 1 | 61 | Risk Ratio (M‐H, Fixed, 95% CI) | 1.03 [0.41, 2.59] |
| 34 PDI < 70 Show forest plot | 1 | 61 | Risk Ratio (M‐H, Fixed, 95% CI) | 1.03 [0.33, 3.21] |
| 35 Moderate to severe cerebral palsy Show forest plot | 1 | 61 | Risk Ratio (M‐H, Fixed, 95% CI) | 2.07 [0.41, 10.46] |
| 36 Deafness Show forest plot | 1 | 62 | Risk Ratio (M‐H, Fixed, 95% CI) | 0.35 [0.02, 8.39] |
| 37 Blindness Show forest plot | 1 | 62 | Risk Ratio (M‐H, Fixed, 95% CI) | 0.35 [0.02, 8.39] |
| 38 MDI Show forest plot | 1 | 61 | Mean Difference (IV, Fixed, 95% CI) | ‐0.40 [‐8.19, 7.39] |
| 39 PDI Show forest plot | 1 | 61 | Mean Difference (IV, Fixed, 95% CI) | ‐0.20 [‐7.44, 7.04] |
| 40 BPD (age not stated) Show forest plot | 3 | 269 | Risk Ratio (M‐H, Fixed, 95% CI) | 0.87 [0.39, 1.95] |
| 41 Plasma PGE2 (ng/L) Show forest plot | 1 | 87 | Mean Difference (IV, Fixed, 95% CI) | 12.60 [0.39, 24.81] |
| 42 Urine PGE2 (ng/L) Show forest plot | 1 | 87 | Mean Difference (IV, Fixed, 95% CI) | 23.90 [2.78, 45.02] |
| 43 Platelet count (x109/L) Show forest plot | 2 | 287 | Mean Difference (IV, Fixed, 95% CI) | 30.18 [16.55, 43.81] |
| 44 Glutamic‐pyruvic transaminase (U/L) Show forest plot | 1 | 87 | Mean Difference (IV, Fixed, 95% CI) | 0.60 [‐1.84, 3.04] |
| 45 Failure of PDA closure after the 2nd course of IV paracetamol versus IV ibuprofen Show forest plot | 2 | 49 | Risk Ratio (M‐H, Fixed, 95% CI) | 0.79 [0.51, 1.21] |
| 46 Daily urine output (mL/kg/hour) Show forest plot | 1 | 200 | Mean Difference (IV, Fixed, 95% CI) | 0.55 [0.41, 0.69] |
| Outcome or subgroup title | No. of studies | No. of participants | Statistical method | Effect size |
| 1 Failure of ductal closure after 4 to 5 days of treatment Show forest plot | 2 | 80 | Risk Ratio (M‐H, Fixed, 95% CI) | 0.49 [0.24, 1.00] |
| 2 Death Show forest plot | 2 | 80 | Risk Ratio (M‐H, Fixed, 95% CI) | 0.35 [0.04, 3.20] |
| 3 Oliguria (< 1 mL/kg/h) Show forest plot | 1 | 48 | Risk Ratio (M‐H, Fixed, 95% CI) | 0.78 [0.29, 2.11] |
| 4 Polyuria (> 5 mL/kg/h) Show forest plot | 1 | 48 | Risk Ratio (M‐H, Fixed, 95% CI) | 0.72 [0.31, 1.72] |
| 5 Hypernatraemia (> 150 µmol/L) Show forest plot | 1 | 48 | Risk Ratio (M‐H, Fixed, 95% CI) | 0.45 [0.19, 1.09] |
| 6 Sepsis Show forest plot | 1 | 48 | Risk Ratio (M‐H, Fixed, 95% CI) | 1.45 [0.36, 5.79] |
| 7 Supplemental oxygen at 28 days Show forest plot | 1 | 48 | Risk Ratio (M‐H, Fixed, 95% CI) | 0.69 [0.32, 1.48] |
| 8 Supplemental oxygen at 36 weeks' PMA Show forest plot | 1 | 48 | Risk Ratio (M‐H, Fixed, 95% CI) | 0.36 [0.02, 8.45] |
| 9 ROP (treated) Show forest plot | 1 | 48 | Risk Ratio (M‐H, Fixed, 95% CI) | 3.25 [0.14, 76.01] |
| 10 IVH grades 1 to 2 Show forest plot | 1 | 48 | Risk Ratio (M‐H, Fixed, 95% CI) | 0.60 [0.24, 1.54] |
| 11 IVH grades 3 to 4 Show forest plot | 1 | 48 | Risk Ratio (M‐H, Fixed, 95% CI) | 1.09 [0.07, 16.39] |
| 12 NEC stage 3 Show forest plot | 1 | 48 | Risk Ratio (M‐H, Fixed, 95% CI) | 0.36 [0.02, 8.45] |
| 13 Days of supplemental oxygen Show forest plot | 1 | 48 | Mean Difference (IV, Fixed, 95% CI) | ‐2.40 [‐16.41, 11.61] |
| 14 Highest serum bilirubin µmol/L Show forest plot | 1 | 48 | Mean Difference (IV, Fixed, 95% CI) | 1.0 [‐10.35, 12.35] |
| Outcome or subgroup title | No. of studies | No. of participants | Statistical method | Effect size |
| 1 Failure to close a PDA Show forest plot | 2 | 273 | Risk Ratio (M‐H, Fixed, 95% CI) | 0.96 [0.55, 1.65] |
| 2 Renal impairment Show forest plot | 1 | 77 | Risk Ratio (M‐H, Fixed, 95% CI) | 3.08 [0.13, 73.26] |
| 3 GI bleed Show forest plot | 2 | 277 | Risk Ratio (M‐H, Fixed, 95% CI) | 0.66 [0.33, 1.33] |
| 4 NEC (all grades) Show forest plot | 2 | 277 | Risk Ratio (M‐H, Fixed, 95% CI) | 0.39 [0.14, 1.06] |
| 5 Sepsis Show forest plot | 2 | 277 | Risk Ratio (M‐H, Fixed, 95% CI) | 1.14 [0.59, 2.19] |
| 6 Pulmonary haemorrhage Show forest plot | 2 | 277 | Risk Ratio (M‐H, Fixed, 95% CI) | 0.74 [0.25, 2.18] |
| 7 ROP (all grades) Show forest plot | 2 | 259 | Risk Ratio (M‐H, Fixed, 95% CI) | 0.77 [0.58, 1.03] |
| 8 Severe ROP needing treatment Show forest plot | 1 | 59 | Risk Ratio (M‐H, Fixed, 95% CI) | 1.18 [0.49, 2.84] |
| 9 IVH (all grades) Show forest plot | 2 | 275 | Risk Ratio (M‐H, Fixed, 95% CI) | 0.82 [0.42, 1.63] |
| 10 IVH (grades III to IV) Show forest plot | 1 | 75 | Risk Ratio (M‐H, Fixed, 95% CI) | 3.08 [0.34, 28.30] |
| 11 Periventricular leukomalacia Show forest plot | 1 | 75 | Risk Ratio (M‐H, Fixed, 95% CI) | 0.34 [0.01, 8.14] |
| 12 Oxygen requirement at 28 days of age Show forest plot | 1 | 58 | Risk Ratio (M‐H, Fixed, 95% CI) | 0.88 [0.53, 1.46] |
| 13 Oxygen requirement at ≥ 36 weeks' PMA Show forest plot | 1 | 57 | Risk Ratio (M‐H, Fixed, 95% CI) | 0.93 [0.32, 2.69] |
| 14 Death Show forest plot | 1 | 77 | Risk Ratio (M‐H, Fixed, 95% CI) | 1.03 [0.43, 2.46] |
| 15 Serum creatinine (µmol/L) Show forest plot | 1 | 200 | Mean Difference (IV, Fixed, 95% CI) | ‐30.94 [‐34.34, ‐27.54] |
| 16 Failure to close a PDA after a 2nd course of IV paracetamol versus IV indomethacin Show forest plot | 1 | 39 | Risk Ratio (M‐H, Fixed, 95% CI) | 0.88 [0.55, 1.40] |
| 17 Surgical ligation of PDA Show forest plot | 1 | 200 | Risk Ratio (M‐H, Fixed, 95% CI) | 0.92 [0.44, 1.92] |
| 18 Serum bilirubin µmol/L Show forest plot | 1 | 200 | Mean Difference (IV, Fixed, 95% CI) | 1.03 [0.13, 1.93] |
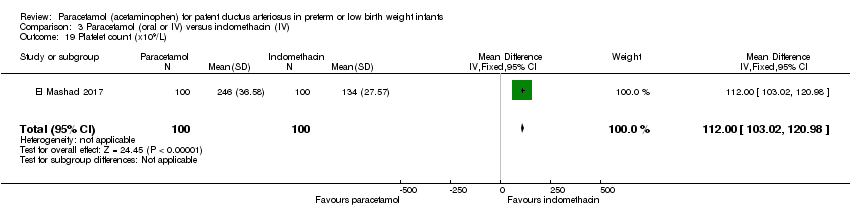
| 19 Platelet count (x109/L) Show forest plot | 1 | 200 | Mean Difference (IV, Fixed, 95% CI) | 112.0 [103.02, 120.98] |
| 20 Daily urine output (mL/kg/h) Show forest plot | 1 | 200 | Mean Difference (IV, Fixed, 95% CI) | 1.14 [1.04, 1.24] |