| Skim milk enriched with GMP/G600 compared to skim milk & lactose powder for chronic gout |
| Patient or population: patients with chronic gout
Settings: outpatient, community
Intervention: Skim milk enriched with GMP/G600
Comparison: skim milk & lactose powder |
| Acute gout attack frequency
participant self‐report using gout flare diary
Follow‐up: 3 months | The mean acute gout attack frequency in the control groups was
0.6997 Number of gout flares per month | The mean acute gout attack frequency in the intervention groups was
0.21 lower
(0.76 lower to 0.34 higher) | | 120
(1 study) | ⊕⊕⊝⊝
low1 | Not statistically significant2 |
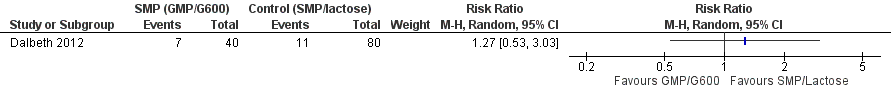
| Participant withdrawals due to adverse events
participant and study investigator reported
Follow‐up: 3 months | Study population | RR 1.27
(0.53 to 3.03) | 120
(1 study) | ⊕⊕⊝⊝
low1 | Not statistically significant3 |
| 138 per 1000 | 175 per 1000
(73 to 417) |
| Moderate |
| |
| Joint pain reduction
10‐point Likert scale (0 is no pain)
Follow‐up: 3 months | The mean joint pain reduction in the control groups was
‐0.942 | The mean joint pain reduction in the intervention groups was
1.03 lower
(1.96 to 0.1 lower) | | 120
(1 study) | ⊕⊕⊝⊝
low1 | Absolute risk difference = ‐10% (‐20% to ‐1%). Relative percentage change = ‐39% (‐74% to ‐4%). NNTB = 10 (5 to 100)2 |
| Tophus regression ‐ not measured | See comment | See comment | Not estimable | ‐ | See comment | Not measured |
| Physical function
HAQ‐II. Scale from: 0 to 3; 0 is minimal loss of function.
Follow‐up: 3 months | The mean physical function in the control groups was
0.11 | The mean physical function in the intervention groups was
0.03 lower
(0.14 lower to 0.08 higher) | | 120
(1 study) | ⊕⊕⊝⊝
low1 | Absolute risk difference = ‐1% (‐5% to 3%). Relative percentage change = ‐13% (‐58% to 33%) NNT n/a, not statistically significant2 |
| Serum urate normalisation4 ‐ not reported | See comment | See comment | Not estimable4 | ‐ | See comment | Not reported |
| Serious adverse events
participant and study investigator reported
Follow‐up: 3 months | 38 per 1000 | 50 per 1000
(9 to 287) | RR 1.33
(0.23 to 7.66) | 120
(1 study) | ⊕⊕⊝⊝
low1 | Gastrointestinal AEs (diarrhoea, nausea and flatulence) reported most commonly. SAE related to hospital admissions ‐ none were due to the study products.3 |
| *The basis for the assumed risk (e.g. the median control group risk across studies) is provided in footnotes. The corresponding risk (and its 95% confidence interval) is based on the assumed risk in the comparison group and the relative effect of the intervention (and its 95% CI).
CI: Confidence interval; RR: Risk ratio; |
| GRADE Working Group grades of evidence
High quality: Further research is very unlikely to change our confidence in the estimate of effect.
Moderate quality: Further research is likely to have an important impact on our confidence in the estimate of effect and may change the estimate.
Low quality: Further research is very likely to have an important impact on our confidence in the estimate of effect and is likely to change the estimate.
Very low quality: We are very uncertain about the estimate. |