Omega‐3‐Fettsäuren zur Vorbeugung oder Verlangsamung des Fortschreitens altersbedingter Makuladegeneration
Appendices
Appendix 1. CENTRAL search strategy
#1 MeSH descriptor Macular Degeneration
#2 MeSH descriptor Retinal Degeneration
#3 MeSH descriptor Retinal Neovascularization
#4 MeSH descriptor Choroidal Neovascularization
#5 MeSH descriptor Macula Lutea
#6 macula* near lutea*
#7 (macula* or retina* or choroid*) near/4 degenerat*
#8 (macula* or retina* or choroid*) near/4 neovascul*
#9 maculopath*
#10 AMD or ARMD or CNV
#11 (#1 OR #2 OR #3 OR #4 OR #5 OR #6 OR #7 OR #8 OR #9 OR #10)
#12 MeSH descriptor Fatty Acids, Omega‐3
#13 fatty near/2 acid*
#14 omega 3
#15 polyunsaturated
#16 LCPUFA* or PUFA*
#17 docosahexaenoic or DHA*
#18 eicosapentaenoic or EPA*
#19 (#12 OR #13 OR #14 OR #15 OR #16 OR #17 OR #18)
#20 (#11 AND #19)
Appendix 2. MEDLINE (OvidSP) search strategy
1. randomized controlled trial.pt.
2. (randomized or randomised).ab,ti.
3. placebo.ab,ti.
4. dt.fs.
5. randomly.ab,ti.
6. trial.ab,ti.
7. groups.ab,ti.
8. or/1‐7
9. exp animals/
10. exp humans/
11. 9 not (9 and 10)
12. 8 not 11
13. exp retinal degeneration/
14. retinal neovascularization/
15. choroidal neovascularization/
16. exp macula lutea/
17. maculopath$.tw.
18. ((macul$ or retina$ or choroid$) adj3 degener$).tw.
19. ((macul$ or retina$ or choroid$) adj3 neovasc$).tw.
20. (AMD or ARMD or CNV).tw.
21. or/13‐20
22. Fatty Acids, Omega‐3/
23. (fatty adj2 acid$).tw.
24. omega 3.tw.
25. polyunsaturated.tw.
26. (LCPUFA$ or PUFA$).tw.
27. (docosahexaenoic or DHA$).tw.
28. (eicosapentaenoic or EPA$).tw.
29. or/22‐28
30. 21 and 29
31. 12 and 30
The search filter for trials at the beginning of the MEDLINE strategy is from the published paper by Glanville et al (Glanville 2006).
Appendix 3. EMBASE (OvidSP) search strategy
1. exp randomized controlled trial/
2. exp randomization/
3. exp double blind procedure/
4. exp single blind procedure/
5. random$.tw.
6. or/1‐5
7. (animal or animal experiment).sh.
8. human.sh.
9. 7 and 8
10. 7 not 9
11. 6 not 10
12. exp clinical trial/
13. (clin$ adj3 trial$).tw.
14. ((singl$ or doubl$ or trebl$ or tripl$) adj3 (blind$ or mask$)).tw.
15. exp placebo/
16. placebo$.tw.
17. random$.tw.
18. exp experimental design/
19. exp crossover procedure/
20. exp control group/
21. exp latin square design/
22. or/12‐21
23. 22 not 10
24. 23 not 11
25. exp comparative study/
26. exp evaluation/
27. exp prospective study/
28. (control$ or prospectiv$ or volunteer$).tw.
29. or/25‐28
30. 29 not 10
31. 30 not (11 or 23)
32. 11 or 24 or 31
33. exp retina degeneration/
34. retina neovascularization/
35. subretinal neovascularization/
36. exp retina macula lutea/
37. maculopath$.tw.
38. ((macul$ or retina$ or choroid$) adj3 degener$).tw.
39. ((macul$ or retina$ or choroid$) adj3 neovasc$).tw.
40. (AMD or ARMD or CNV).tw.
41. or/33‐40
42. omega 3 fatty acid/
43. (fatty adj2 acid$).tw.
44. omega 3.tw.
45. polyunsaturated.tw.
46. (LCPUFA$ or PUFA$).tw.
47. docosahexaenoic acid/
48. (docosahexaenoic or DHA$).tw.
49. icosapentaenoic acid/
50. (eicosapentaenoic or EPA$).tw.
51. or/42‐50
52. 41 and 51
53. 32 and 52
Appendix 4. LILACS search strategy
macular degenerat$ or AMD or AMRD or CNV and omega or fatty acid or polyunsaturated or docosahexaenoic or eicosapentaenoic
Appendix 5. metaRegister of Controlled Trials search strategy
(macular degeneration) AND omega
Appendix 6. ClinicalTrials.gov search strategy
(Macular Degeneration) AND Omega 3
Appendix 7. ICTRP search strategy
(Macular Degeneration) AND Omega 3
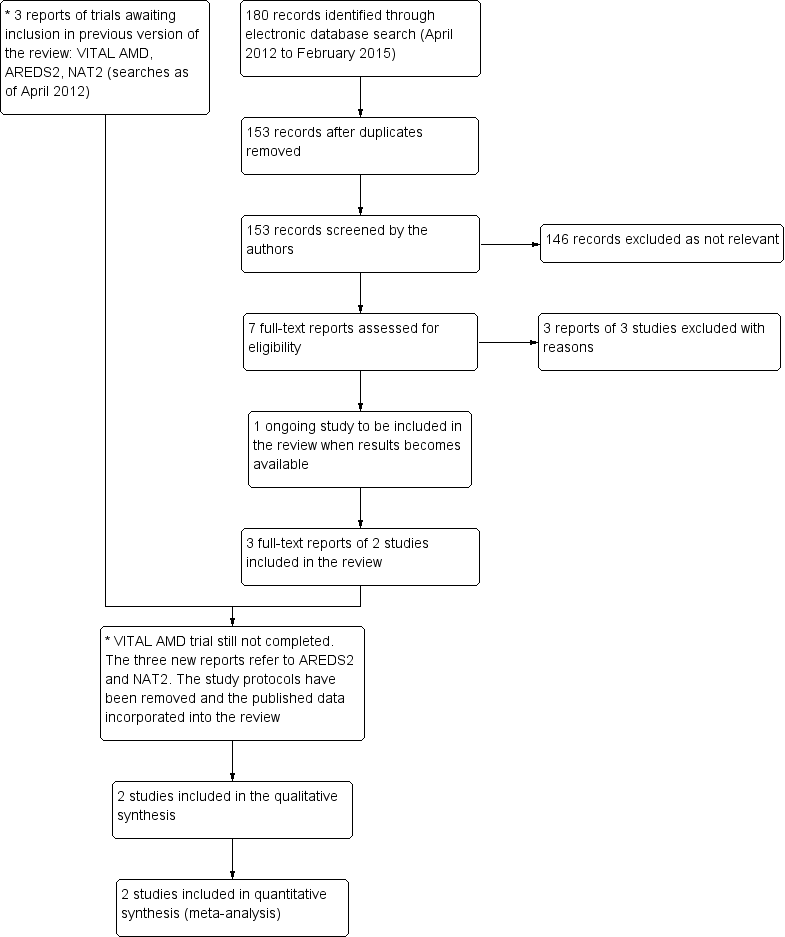
Results from searching for studies for inclusion in the review.

Risk of bias graph: review authors' judgements about each risk of bias item presented as percentages across all included studies.
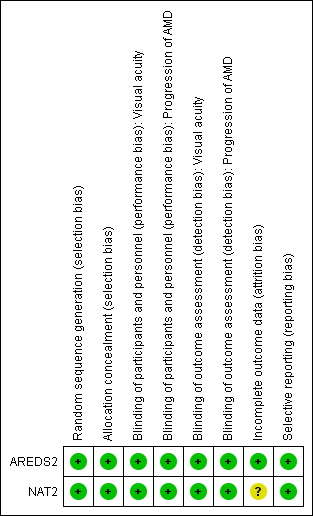
Risk of bias summary: review authors' judgements about each risk of bias item for each included study.
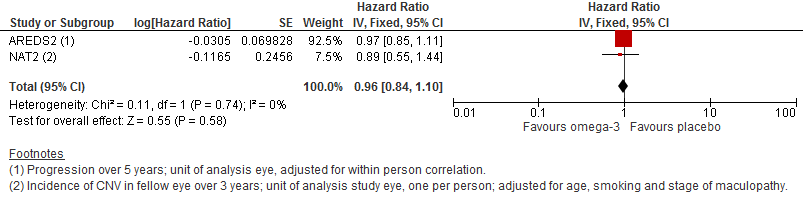
Forest plot of comparison (Analysis 1.1): 1 Omega 3 fatty acids versus control, outcome: 1.10 Progression of AMD.
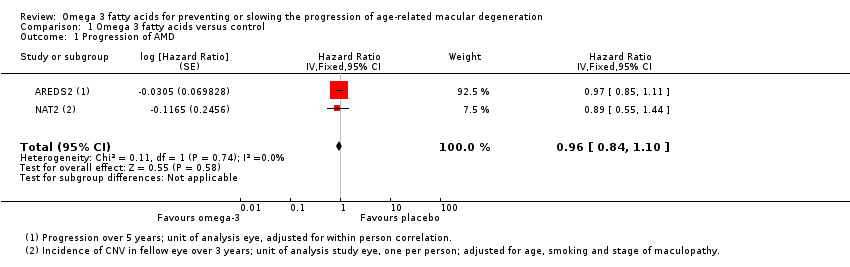
Comparison 1 Omega 3 fatty acids versus control, Outcome 1 Progression of AMD.
| Omega 3 fatty acids compared to placebo for slowing the progression of age‐related macular degeneration | ||||||
| Patient or population: people with AMD | ||||||
| Outcomes | Illustrative comparative risks* (95% CI) | Relative effect | No of Participants | Quality of the evidence | Comments | |
| Assumed risk | Corresponding risk | |||||
| No omega 3 fatty acids (placebo) | Omega 3 fatty acids | |||||
| Loss of 3 or more lines of VA at 24 months | 100 per 1000 | 114 per 1000 | RR 1.14, 95% CI 0.53 to 2.45 | 236 | ⊕⊕⊕⊝ | |
| Loss of 3 or more lines of VA at 36 months | 150 per 1000 | 187 per 1000 | RR 1.25, 95% CI 0.69 to 2.26) | 230 | ⊕⊕⊕⊝ | |
| Incidence of CNV at 24 months | 100 per 1000 | 106 per 1000 | RR 1.06, 95% CI 0.47 to 2.40 | 224 | ⊕⊕⊕⊝ | |
| Incidence of CNV at 36 months | 150 per 1000 | 168 per 1000 | RR 1.12, 95% CI 0.53 to 2.38 | 195 | ⊕⊕⊕⊝ | |
| Progression of AMD over 5 years | 300 per 1000 | 290 per 1000 | HR 0.96 | 2343 | ⊕⊕⊕⊕ | |
| Adverse effects | 500 per 1000 | 505 per 1000 | RR 1.01, 95% CI 0.94 to 1.09 | 2343 | ⊕⊕⊕⊕ | AREDS2 reported participants with one or more serious adverse events (AE). NAT‐2 reported total AE including treatment emergent and serious non‐ocular events |
| *The basis for the assumed risk (e.g. the median control group risk across studies) is provided in footnotes. The corresponding risk (and its 95% confidence interval) is based on the assumed risk in the comparison group and the relative effect of the intervention (and its 95% CI). | ||||||
| GRADE Working Group grades of evidence | ||||||
| 1 Downgraded for imprecision | ||||||
| Adverse effects | Omega 3 N (%) | Placebo N (%) |
| AREDS 2 | ||
| Total number of participants | N = 1068 | N = 1012 |
| Participants with ≥ 1 adverse event · Cardiac disorders · Gastrointestinal disorders · Infections · Neoplasms · Nervous system disorders · Respiratory and chest disorders | 505 (47.3) 119 (11.1) 58 (5.4) 103 (9.6) 83 (7.8) 72 (6.7) 37 (3.5) | 479 (47.3) 96 (9.5) 76 (7.5) 90 (8.9) 80 (7.9) 66 (6.5) 44 (4.3) |
| NAT‐2 | ||
| Total number of participants | N = 134 | N = 129 |
| Total adverse events · Treatment emergent adverse events* · Ocular · Serious non‐ocular | 125 (83.3) 5 (4.7) 88 (58.4) 31 (23.1) | 115 (77.7) 2 (1.6) 74 (50.0) 30 (23.6) |
| * As defined by the study authors (including gastrointestinal disorders, allergic dermatitis and breath odour) | ||
| Outcome or subgroup title | No. of studies | No. of participants | Statistical method | Effect size |
| 1 Progression of AMD Show forest plot | 2 | Hazard Ratio (Fixed, 95% CI) | 0.96 [0.84, 1.10] | |