Vacunación oral contra Haemophilus influenzae para la prevención de las exacerbaciones agudas de la bronquitis crónica y la enfermedad pulmonar obstructiva crónica
Información
- DOI:
- https://doi.org/10.1002/14651858.CD010010.pub3Copiar DOI

- Base de datos:
-
- Cochrane Database of Systematic Reviews
- Versión publicada:
-
- 19 junio 2017see what's new
- Tipo:
-
- Intervention
- Etapa:
-
- Review
- Grupo Editorial Cochrane:
-
Grupo Cochrane de Infecciones respiratorias agudas
- Copyright:
-
- Copyright © 2017 The Cochrane Collaboration. Published by John Wiley & Sons, Ltd.
Cifras del artículo
Altmetric:
Citado por:
Autores
Contributions of authors
All of the authors contributed to the drafting of the protocol. Professor Mieke van Driel and Professor Allan Cripps provided expert and methodological advice, including extensive help and support during the drafting of the protocol and review.
Sources of support
Internal sources
-
Bond University, Australia.
-
Griffith University, Australia.
-
University of Queensland, Australia.
-
Queensland Health Department, Australia.
-
New South Wales Health Department, Australia.
-
Cochrane Acute Respiratory Infections Group, Australia.
External sources
-
No sources of support supplied
Declarations of interest
Edward Teo has no potential conflicts of interest to declare.
Kathleen Lockhart has no potential conflicts of interest to declare.
Sai Navya Purchuri has no potential conflicts of interest to declare.
Jennifer Pushparajah has no potential conflicts of interest to declare.
Professor Allan Cripps was involved in the initial animal work and conduct of the four trials in Newcastle, Australia. The commercial product, Bronchostat, which originated from these trials, is no longer commercially available. The commercial companies Auspharm International Ltd and subsequently Cortecs International Ltd have ceased trading and were delisted from the Australian Stock Exchange (ASX) in 1991 and 1998, respectively. Prior to 1996, Professor Cripps acted as a consultant for both Auspharm International Ltd and Cortecs International Ltd. Hunter Immunology Ltd subsequently continued development of the oral whole‐cell vaccine (HI‐164). In 2004, Professor Cripps acquired a small stock holding in the company. In 2011, Hunter Immunology Ltd was acquired by Bioxyne Ltd, and Professor Cripps' shares were transferred to Bioxyne Ltd. Subsequently, in February 2014, Bioxyne Ltd sold to Mariposa Health Ltd the HI‐164 Oral Vaccine project and all associated intellectual property. Should Mariposa Health Ltd successfully commercialise the vaccine, Mariposa Health Ltd has agreed to pay Bioxyne Ltd a royalty of up to 6.5% of gross revenue. Professor Cripps retains a small residual stock holding in Bioxyne Ltd. Professor Cripps has no stock holding in Mariposa Health Ltd. He has not received any honoraria, participated in expert testimony, or received any consultancy fees from either Mariposa Health Ltd or Bioxyne Ltd. Professor Cripps' potential conflicts of interest have been assessed by the Cochrane Funding and Arbitration Panel (reference number 150514/064) and considered of low risk.
Mieke L van Driel has no potential conflicts of interest to declare.
Acknowledgements
The first publication of this review was withdrawn (Foxwell 2006); we would therefore like to acknowledge the work of the previous authors: Foxwell AR, Cripps AW, Dear KBG.
The authors would also like to acknowledge the assistance of Emeritus Professor Robert Clancy of Newcastle University and Dr Phillips Comans of Bioxyne Pty Ltd for providing unpublished data from the Clancy 2016 trial for analysis. Finally, we wish to thank the following referees for commenting on the draft review: Theresa Wrangham, Marie Kakhu, Kerry‐Ann O'Grady, An De Sutter, Teresa Neeman, and Taixiang Wu.
The authors would like to acknowledge the contribution of Ms Lesley Leong who co‐author the updated protocol of this review.
The authors would like to acknowledge the contribution of Dr Hugh House who co‐authored the previous updated version of this review.
Version history
| Published | Title | Stage | Authors | Version |
| 2017 Jun 19 | <i>Haemophilus influenzae</i> oral vaccination for preventing acute exacerbations of chronic bronchitis and chronic obstructive pulmonary disease | Review | Edward Teo, Kathleen Lockhart, Sai Navya Purchuri, Jennifer Pushparajah, Allan W Cripps, Mieke L van Driel | |
| 2014 Sep 09 | <i>Haemophilus influenzae</i> oral vaccination for preventing acute exacerbations of chronic bronchitis and chronic obstructive pulmonary disease | Review | Edward Teo, Hugh House, Kathleen Lockhart, Sai Navya Purchuri, Jennifer Pushparajah, Allan W Cripps, Mieke L van Driel | |
| 2012 Aug 15 | <i>Haemophilus influenzae</i> oral vaccination for preventing acute exacerbations of chronic bronchitis and chronic obstructive pulmonary disease | Protocol | Edward K Teo, Lesley Leong, Sai Navya Purchuri, Hugh House, Kathleen Lockhart, Jennifer Pushparajah, Allan W Cripps, Mieke L van Driel | |
Differences between protocol and review
We have included risk ratios as a method of measuring the treatment effect for dichotomous data given as rates. We have amended the Data synthesis to reflect that we have also used the fixed‐effect model to pool study data that reported events as rates.
Prescriptions of corticosteroids was not an outcome measure in any of the included studies and therefore not part of this review's analyses. However, participants were noted to have been prescribed steroids prior to commencing the trial and may have continued steroids or have been further prescribed steroids during the trial periods without clear reporting in the studies (this is discussed in the Summary of main results).
We added number of hospital admissions to Secondary outcomes as part of the assessment of the severity of exacerbations after post hoc analysis revealed that a number of studies had reported hospital admissions.
Keywords
MeSH
Medical Subject Headings (MeSH) Keywords
- Administration, Oral;
- Anti‐Bacterial Agents [administration & dosage];
- Bronchitis, Chronic [mortality, *prevention & control];
- Disease Progression;
- Haemophilus Vaccines [*administration & dosage];
- Haemophilus influenzae [*immunology];
- Pulmonary Disease, Chronic Obstructive [mortality, *prevention & control];
- Randomized Controlled Trials as Topic;
- Secondary Prevention;
- Tablets, Enteric‐Coated;
Medical Subject Headings Check Words
Adult; Aged; Aged, 80 and over; Humans; Middle Aged;
PICO
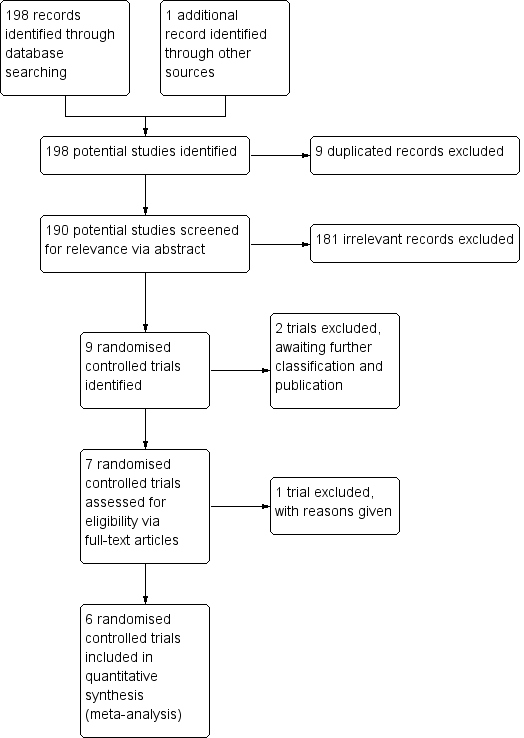
Inclusion of trials flow diagram.

Forest plot of comparison: 1 Primary outcomes, outcome: 1.1 Exacerbations (number of exacerbations/person/year).
Refer to Table 1 for Overall rate estimates of acute exacerbations across included studies.

Forest plot of comparison: 1 Primary outcomes, outcome: 1.2 Mortality (deaths during trial period).

Forest plot of comparison: 2 Secondary outcomes, outcome: 2.1 Prescriptions (number of courses/person/year).
Refer to Table 2 for Overall rate estimates of antibiotic prescriptions across included studies.
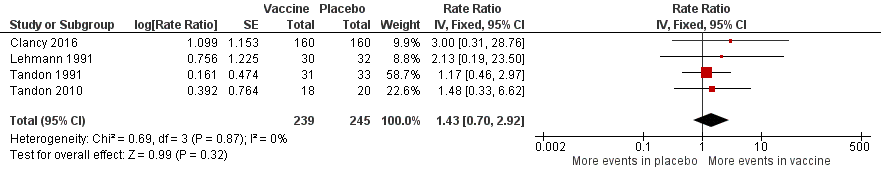
Forest plot of comparison: 2 Secondary outcomes, outcome: 2.3 Adverse events (number of adverse events/person/year).
Refer to Table 3 for Overall rate estimates of adverse events across included studies.
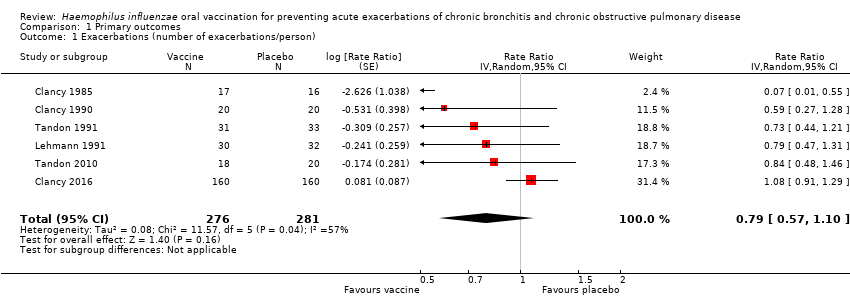
Comparison 1 Primary outcomes, Outcome 1 Exacerbations (number of exacerbations/person).
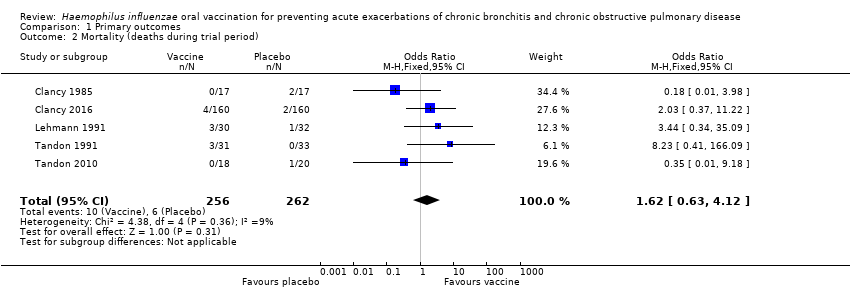
Comparison 1 Primary outcomes, Outcome 2 Mortality (deaths during trial period).

Comparison 2 Secondary outcomes, Outcome 1 Prescriptions (number of courses/person/year).

Comparison 2 Secondary outcomes, Outcome 2 Adverse events (number of adverse events/person).
| Haemophilus influenzae oral vaccination for prevention of acute exacerbations of chronic bronchitis and COPD | ||||||
| Patient or population: adults (> 18 years of age) with either COPD or recurrent acute exacerbations of chronic bronchitis Settings: community and outpatients Intervention: oral monobacterial vaccination with killed NTHi Comparison: placebo | ||||||
| Outcomes | Illustrative comparative risks* (95% CI) | Relative effect | No. of participants | Quality of the evidence | Comments | |
| Assumed risk Not vaccinated | Corresponding risk NTHi oral vaccinated | |||||
| Acute exacerbations (number of exacerbations/person/year) | 2.111 exacerbations per person/year | 1.668 exacerbations | RR 0.79 (0.57 to 1.10) | 557 | ⊕⊕⊝⊝ | Despite an absolute estimated decrease in the rate of exacerbations in the vaccinated group, the result is negligible (95% CI crosses 1.00) and not statistically significant (P = 0.16) |
| Mortality (deaths during trial period) | 23 per 1000 | 37 per 1000 | OR 1.62 (0.63 to 4.12) | 518 | ⊕⊝⊝⊝ | Despite more absolute deaths occurring in the vaccinated group, the result is negligible (95% CI crosses 1.00) and not statistically significant (P = 0.31). Deaths were not necessarily attributed to the use of the vaccine |
| Carriage of NTHi Not meta‐analysed | N/A | N/A | N/A | N/A | ⊕⊝⊝⊝ | We were unable to meta‐analyse the carriage levels of NTHi in participants as each trial reported this result using different units and tools of measurement. 4 trials showed no significant difference in carriage levels, while 2 trials showed a significant decrease in carriage levels in the vaccinated group compared with the placebo group |
| Antibiotic prescriptions (number of courses/person/year) **Corticosteroids not meta‐analysed | 5.723 | 3.162 | RR 1.81 (1.35 to 2.44) | 142 | ⊕⊕⊝⊝ | Courses of antibiotics were found to be prescribed in the placebo group at a rate approximately 80% greater than in the vaccinated group (P < 0.001) (Note that a RR > 1.0 here indicates more antibiotics being prescribed to participants in the placebo group, i.e. RR 1.81 corresponds to an approximately 80% increased rate of antibiotic prescriptions when not receiving the vaccine. The placebo group is being compared to the vaccine group in this instance to attempt to demonstrate how many more antibiotics are required in those not vaccinated) **2studies reported corticosteroid use, however due to differences in units of measurement, these results could not be meta‐analysed |
| Hospital admissions (number of participants hospitalised during trial period) | N/A | N/A | N/A | N/A | ⊕⊕⊕⊝ | Hospital admissions was not meta‐analysed due to differing units of measurement by the 2 trials that reported this finding. Notwithstanding that pooling the data for the 2 trials would have yielded high heterogeneity. Hospital admissions were not necessarily attributable to the vaccine |
| Adverse events (number of adverse events/person/year) | 0.319 | 0.456 | RR 1.43 (0.70 to 2.92) | 484 | ⊕⊕⊝⊝ | Despite an estimated absolute increased rate of adverse events in the vaccinated group, the result is negligible (95% CI crosses 1.00) and not statistically significant (P = 0.61). Adverse events were not necessarily attributable to the vaccine |
| Quality of life Not meta‐analysed | N/A | N/A | N/A | N/A | ⊕⊝⊝⊝ | Quality of life was not meta‐analysed due to differing units of measurement, but was reported in 2 trials, which showed an improvement at 6 months in the vaccine group (scoring at least 2 points better than the placebo group; significance unknown) |
| *The basis for the assumed risk (e.g. the median control group risk across studies) is provided in the footnotes. The corresponding risk (and its 95% confidence interval (CI)) is based on the assumed risk in the comparison group and the relative effect of the intervention (and its 95% CI). CI: confidence interval; N/A: not applicable; NTHi: non‐typeable Haemophilus influenzae; OR: odds ratio; RR: risk ratio | ||||||
| GRADE Working Group grades of evidence | ||||||
| 1One study had marked heterogeneity; most studies had a low number of participants; one study had significant attrition. | ||||||
| Study | Vaccinated | Placebo | *Absolute rate difference |
| Clancy 1985 | 0.256 | 0.272 | 0.016 (‐) |
| Clancy 1990 | 1.000 | 1.700 | 0.700 (‐) |
| Clancy 2016 | 0.717 | 0.767 | 0.050 (‐) |
| Lehmann 1991 | 0.800 | 1.210 | 0.410 (‐) |
| Tandon 1991 | 3.355 | 4.364 | 1.009 (‐) |
| Tandon 2010 | 3.667 | 4.350 | 0.683 (‐) |
| Overall mean | 1.633 | 2.111 | 0.478 (‐) |
| *Estimated rate of exacerbation calculated as number of exacerbations per person per year. Refer to Analysis 1.1: Forest plot comparison and rate ratios for exacerbations. | |||
| Study | Vaccinated | Placebo | *Absolute rate difference |
| Clancy 1990 | 0.500 | 1.200 | 0.700 (‐) |
| Tandon 1991 | 5.806 | 10.194 | 4.388 (‐) |
| Tandon 2010 | 3.180 | 7.200 | 4.020 (‐) |
| Overall mean | 3.162 | 6.198 | 3.036 (‐) |
| *Estimated rate of antibiotic prescriptions calculated as number of antibiotic courses per person per year. Refer to Analysis 2.1: Forest plot comparison and rate ratios for antibiotic prescriptions. | |||
| Study | Vaccinated | Placebo | *Absolute rate difference |
| Clancy 2016 | 0.008 | 0.025 | 0.017 (‐) |
| Lehmann 1991 | 0.067 | 0.031 | 0.036 (+) |
| Tandon 1991 | 1.032 | 1.212 | 0.180 (‐) |
| Tandon 2010 | 0.167 | 0.450 | 0.283 (‐) |
| Overall mean | 0.319 | 0.430 | 0.111 (‐) |
| *Estimated rate of adverse events calculated as number of adverse events per person per year. Refer to Analysis 2.2: Forest plot comparison and rate ratios for adverse events. | |||
| Outcome or subgroup title | No. of studies | No. of participants | Statistical method | Effect size |
| 1 Exacerbations (number of exacerbations/person) Show forest plot | 6 | 557 | Rate Ratio (Random, 95% CI) | 0.79 [0.57, 1.10] |
| 2 Mortality (deaths during trial period) Show forest plot | 5 | 518 | Odds Ratio (M‐H, Fixed, 95% CI) | 1.62 [0.63, 4.12] |
| Outcome or subgroup title | No. of studies | No. of participants | Statistical method | Effect size |
| 1 Prescriptions (number of courses/person/year) Show forest plot | 3 | 142 | Rate Ratio (Fixed, 95% CI) | 1.81 [1.35, 2.44] |
| 2 Adverse events (number of adverse events/person) Show forest plot | 4 | 484 | Rate Ratio (Fixed, 95% CI) | 1.43 [0.70, 2.92] |