Monotherapie mit Topiramat bei juveniler myoklonischer Epilepsie
Referencias
References to studies included in this review
References to studies excluded from this review
Additional references
References to other published versions of this review
Characteristics of studies
Characteristics of included studies [ordered by study ID]
Ir a:
| Methods | Randomized, double‐blind, placebo‐controlled study | |
| Participants | 22 participants with juvenile myoclonic epilepsy | |
| Interventions | Starting dose of topiramate 50 mg/day or equivalent placebo tablets was maintained for 4 weeks, then increased at 2‐week intervals to target dosages of 400 mg/day in adults or 6 mg/kg/day in children. Treatment was continued for an additional 12 weeks | |
| Outcomes | Reduction in PGTCS, myoclonic, absence and total generalized seizures, adverse events | |
| Notes | The baseline period was 8 weeks. The protocol can be identified from Biton 1999 | |
| Risk of bias | ||
| Bias | Authors' judgement | Support for judgement |
| Random sequence generation (selection bias) | Low risk | A computer‐generated randomization schedule was prepared by the Robert Wood Johnson Pharmaceutical Research Institute before the beginning of the trial |
| Allocation concealment (selection bias) | Unclear risk | Allocation concealment was not reported |
| Blinding of participants and personnel (performance bias) | Low risk | During the double‐blind phase, investigators, participants, study monitors and observers remained masked to codes until after the clinical database was finalized |
| Blinding of outcome assessment (detection bias) | Low risk | During the double‐blind phase, investigators, participants, study monitors and observers remained masked to codes until after the clinical database was finalized |
| Incomplete outcome data (attrition bias) | High risk | 2 participants taking topiramate (18%) and 1 (9%) participant taking placebo discontinued treatment owing to adverse events |
| Selective reporting (reporting bias) | Unclear risk | No prepublished protocol |
| Other bias | Low risk | No other bias was found |
| Methods | Pilot, randomized controlled trial | |
| Participants | 28 participants with juvenile myoclonic epilepsy | |
| Interventions | Participants were assigned as 2:1 ratio to topiramate (19 participants) or valproate (9 participants) for 26 weeks. The topiramate target dosage was 3‐4 mg/kg/day (maximum 9 mg/kg/day) for participants aged 12‐16 years and 200 mg/day (maximum 600 mg/day) for participants aged > 16 years. Valproate target dosages were 10 mg/kg/day in participants aged 12‐16 years and 750 mg/day in participants aged >16 years (overall maximum 60 mg/kg/day). Medications were titrated at 1‐ to 2‐week intervals according to clinical response and were administered in divided doses | |
| Outcomes | Seizure reduction, evaluation of improvement, systemic toxicity and neurotoxicity scores, adverse events | |
| Notes | The baseline period was 3 months before study entry. A 14‐week titration phase was followed by a 12‐week maintenance phase | |
| Risk of bias | ||
| Bias | Authors' judgement | Support for judgement |
| Random sequence generation (selection bias) | Low risk | Blinded randomization was achieved by providing study sites with individual envelopes containing medication assignments generated by computer |
| Allocation concealment (selection bias) | Low risk | Blinded randomization was achieved by providing study sites with individual envelopes containing medication assignments generated by computer |
| Blinding of participants and personnel (performance bias) | Low risk | The participant, investigator and pharmacist remained blinded to medication assignment until screening was completed and the envelope was opened |
| Blinding of outcome assessment (detection bias) | Low risk | The participant, investigator and pharmacist remained blinded to medication assignment until screening was completed and the envelope was opened |
| Incomplete outcome data (attrition bias) | High risk | 7 (37%) participants treated with topiramate and 2 (22%) participants treated with valproate discontinued before the endpoint |
| Selective reporting (reporting bias) | Unclear risk | No prepublished protocol |
| Other bias | Low risk | No other bias was found |
| Methods | Randomized open‐label observational study | |
| Participants | 33 participants with juvenile myoclonic epilepsy | |
| Interventions | Participants were assigned as 1:1 ratio to topiramate (16 participants) or valproate (17 participants) for 32 weeks. The assigned antiepileptic drug was titrated up to 1200 mg/day for valproate or 100 mg/day for topiramate. The dose of valproate was titrated up 300 mg/day for 2 weeks, whereas topiramate was increased 25 mg/day for 2 weeks. In participants with a poor response to medication during the 24‐week maintenance phase, the dose of valproate was increased 300 mg/day for 1 month to a maximum dose of 2400 mg/day, and the dose of topiramate was increased 50 mg/day for 1 month to a maximum 300 mg/day | |
| Outcomes | Number of days without myoclonic seizures during the 24‐week maintenance period, adverse events | |
| Notes | Baseline period was not clear. An 8‐week titration phase was followed by a 24‐week maintenance phase | |
| Risk of bias | ||
| Bias | Authors' judgement | Support for judgement |
| Random sequence generation (selection bias) | Low risk | Participants underwent computerized randomization in a 1 : 1 ratio to primary treatment with topiramate or valproate |
| Allocation concealment (selection bias) | Unclear risk | Not reported |
| Blinding of participants and personnel (performance bias) | Unclear risk | Not reported |
| Blinding of outcome assessment (detection bias) | Unclear risk | Not reported |
| Incomplete outcome data (attrition bias) | High risk | 1 (6%) participant who was randomized to topiramate was removed from the study due to severe anorexia. 4 (25%) participants from the topiramate group and 1 (6%) participant from the valproate group were lost to follow‐up |
| Selective reporting (reporting bias) | Unclear risk | No prepublished protocol |
| Other bias | Low risk | No other bias was found |
PGTCS: primarily generalized tonic‐clonic seizures.
Characteristics of excluded studies [ordered by study ID]
Ir a:
| Study | Reason for exclusion |
| Not a randomized controlled trial |
Data and analyses
| Outcome or subgroup title | No. of studies | No. of participants | Statistical method | Effect size |
| 1 Proportion of responders (at least 50% seizure frequency reduction in PGTCS) Show forest plot | 1 | 22 | Risk Ratio (M‐H, Fixed, 95% CI) | 4.0 [1.08, 14.75] |
| Analysis 1.1  Comparison 1 Topiramate versus placebo, Outcome 1 Proportion of responders (at least 50% seizure frequency reduction in PGTCS). | ||||
| 2 Nausea Show forest plot | 1 | 22 | Risk Ratio (M‐H, Fixed, 95% CI) | 1.67 [0.52, 5.33] |
| Analysis 1.2  Comparison 1 Topiramate versus placebo, Outcome 2 Nausea. | ||||
| 3 Upper respiratory tract infection Show forest plot | 1 | 22 | Risk Ratio (M‐H, Fixed, 95% CI) | 1.5 [0.31, 7.30] |
| Analysis 1.3 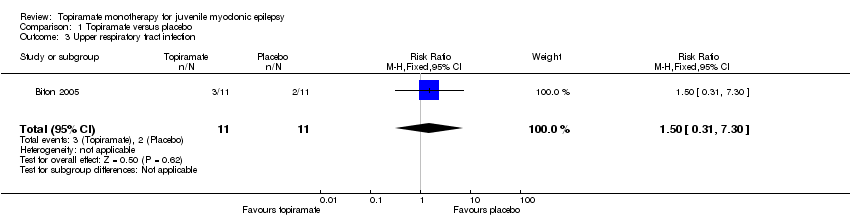 Comparison 1 Topiramate versus placebo, Outcome 3 Upper respiratory tract infection. | ||||
| 4 Abnormal vision Show forest plot | 1 | 22 | Risk Ratio (M‐H, Fixed, 95% CI) | 2.0 [0.21, 18.98] |
| Analysis 1.4  Comparison 1 Topiramate versus placebo, Outcome 4 Abnormal vision. | ||||
| 5 Diarrhoea Show forest plot | 1 | 22 | Risk Ratio (M‐H, Fixed, 95% CI) | 2.0 [0.21, 18.98] |
| Analysis 1.5  Comparison 1 Topiramate versus placebo, Outcome 5 Diarrhoea. | ||||
| Outcome or subgroup title | No. of studies | No. of participants | Statistical method | Effect size |
| 1 Proportion of responders (at least 50% seizure frequency reduction in myoclonic seizures) Show forest plot | 1 | 23 | Risk Ratio (M‐H, Fixed, 95% CI) | 0.88 [0.67, 1.15] |
| Analysis 2.1 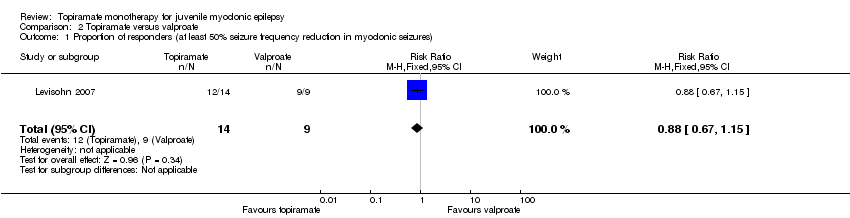 Comparison 2 Topiramate versus valproate, Outcome 1 Proportion of responders (at least 50% seizure frequency reduction in myoclonic seizures). | ||||
| 2 Proportion of responders (at least 50% seizure frequency reduction in PGTCS) Show forest plot | 1 | 16 | Risk Ratio (M‐H, Fixed, 95% CI) | 1.22 [0.68, 2.21] |
| Analysis 2.2  Comparison 2 Topiramate versus valproate, Outcome 2 Proportion of responders (at least 50% seizure frequency reduction in PGTCS). | ||||
| 3 Number of participants with seizure‐free Show forest plot | 1 | 27 | Risk Ratio (M‐H, Fixed, 95% CI) | 1.13 [0.61, 2.11] |
| Analysis 2.3 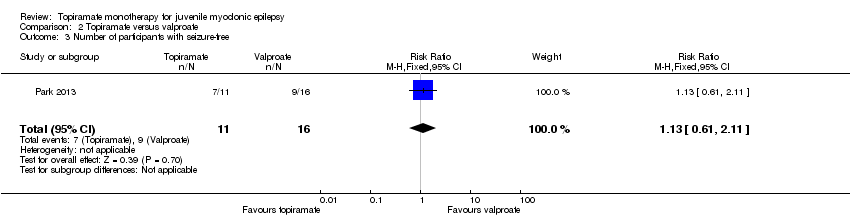 Comparison 2 Topiramate versus valproate, Outcome 3 Number of participants with seizure‐free. | ||||
| 4 Paraesthesia Show forest plot | 2 | 61 | Risk Difference (M‐H, Fixed, 95% CI) | 0.19 [0.02, 0.35] |
| Analysis 2.4 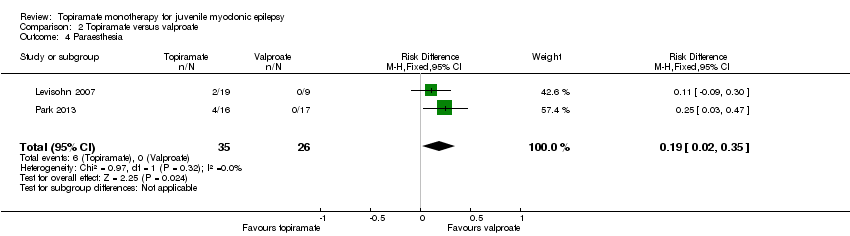 Comparison 2 Topiramate versus valproate, Outcome 4 Paraesthesia. | ||||
| 5 Weight gain Show forest plot | 2 | 61 | Risk Difference (M‐H, Fixed, 95% CI) | ‐0.30 [‐0.49, ‐0.10] |
| Analysis 2.5  Comparison 2 Topiramate versus valproate, Outcome 5 Weight gain. | ||||
| 6 Tremor Show forest plot | 1 | 33 | Risk Difference (M‐H, Fixed, 95% CI) | ‐0.24 [‐0.45, ‐0.02] |
| Analysis 2.6  Comparison 2 Topiramate versus valproate, Outcome 6 Tremor. | ||||
| 7 Headache Show forest plot | 1 | 28 | Risk Ratio (M‐H, Fixed, 95% CI) | 2.37 [0.32, 17.42] |
| Analysis 2.7 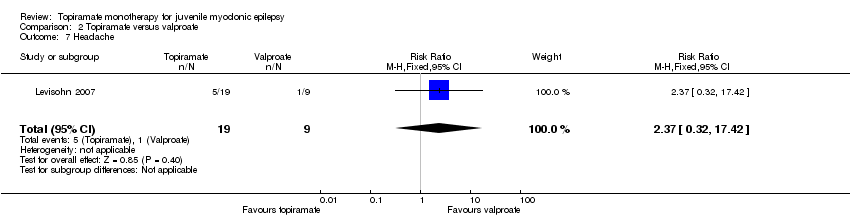 Comparison 2 Topiramate versus valproate, Outcome 7 Headache. | ||||
| 8 Concentration difficulty Show forest plot | 1 | 28 | Risk Ratio (M‐H, Fixed, 95% CI) | 1.42 [0.17, 11.83] |
| Analysis 2.8 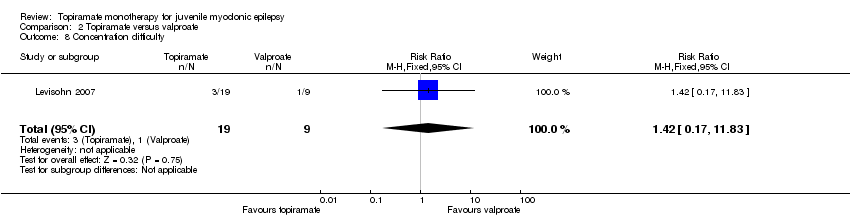 Comparison 2 Topiramate versus valproate, Outcome 8 Concentration difficulty. | ||||
| 9 Fatigue Show forest plot | 2 | 61 | Risk Ratio (M‐H, Fixed, 95% CI) | 0.62 [0.17, 2.21] |
| Analysis 2.9  Comparison 2 Topiramate versus valproate, Outcome 9 Fatigue. | ||||
| 10 Alopecia Show forest plot | 2 | 61 | Risk Ratio (M‐H, Fixed, 95% CI) | 0.24 [0.06, 1.02] |
| Analysis 2.10  Comparison 2 Topiramate versus valproate, Outcome 10 Alopecia. | ||||
| 11 Dizziness Show forest plot | 1 | 28 | Risk Ratio (M‐H, Fixed, 95% CI) | 0.95 [0.10, 9.13] |
| Analysis 2.11  Comparison 2 Topiramate versus valproate, Outcome 11 Dizziness. | ||||
| 12 Weight loss Show forest plot | 1 | 28 | Risk Difference (M‐H, Fixed, 95% CI) | 0.11 [‐0.09, 0.30] |
| Analysis 2.12  Comparison 2 Topiramate versus valproate, Outcome 12 Weight loss. | ||||
| 13 Psychomotor slowing Show forest plot | 1 | 28 | Risk Difference (M‐H, Fixed, 95% CI) | 0.11 [‐0.09, 0.30] |
| Analysis 2.13  Comparison 2 Topiramate versus valproate, Outcome 13 Psychomotor slowing. | ||||
| 14 Somnolence Show forest plot | 2 | 61 | Risk Difference (M‐H, Fixed, 95% CI) | 0.08 [‐0.05, 0.21] |
| Analysis 2.14  Comparison 2 Topiramate versus valproate, Outcome 14 Somnolence. | ||||
| 15 Nausea Show forest plot | 2 | 61 | Risk Ratio (M‐H, Fixed, 95% CI) | 0.21 [0.04, 1.18] |
| Analysis 2.15 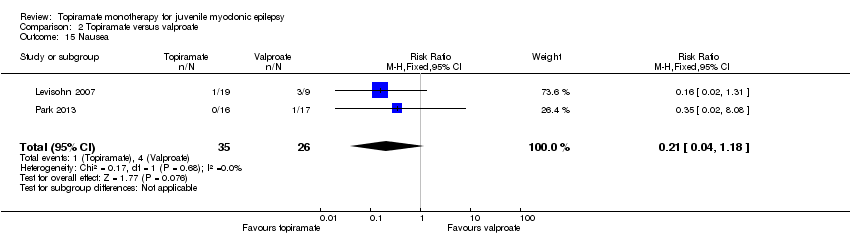 Comparison 2 Topiramate versus valproate, Outcome 15 Nausea. | ||||
| 16 Appetite increase Show forest plot | 1 | 28 | Risk Difference (M‐H, Fixed, 95% CI) | ‐0.22 [‐0.50, 0.05] |
| Analysis 2.16 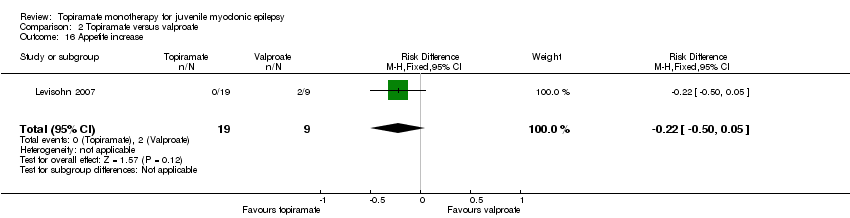 Comparison 2 Topiramate versus valproate, Outcome 16 Appetite increase. | ||||
| 17 Insomnia Show forest plot | 1 | 28 | Risk Difference (M‐H, Fixed, 95% CI) | ‐0.22 [‐0.50, 0.05] |
| Analysis 2.17  Comparison 2 Topiramate versus valproate, Outcome 17 Insomnia. | ||||
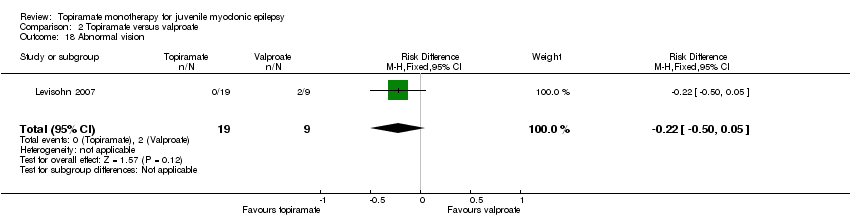
| 18 Abnormal vision Show forest plot | 1 | 28 | Risk Difference (M‐H, Fixed, 95% CI) | ‐0.22 [‐0.50, 0.05] |
| Analysis 2.18  Comparison 2 Topiramate versus valproate, Outcome 18 Abnormal vision. | ||||
| 19 Rash Show forest plot | 1 | 28 | Risk Difference (M‐H, Fixed, 95% CI) | ‐0.22 [‐0.50, 0.05] |
| Analysis 2.19 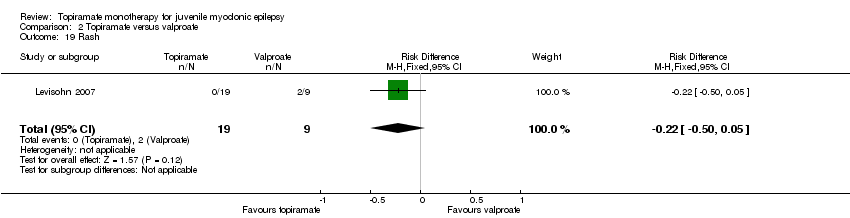 Comparison 2 Topiramate versus valproate, Outcome 19 Rash. | ||||
| 20 Anorexia Show forest plot | 1 | 33 | Risk Ratio (M‐H, Fixed, 95% CI) | 3.19 [0.37, 27.58] |
| Analysis 2.20 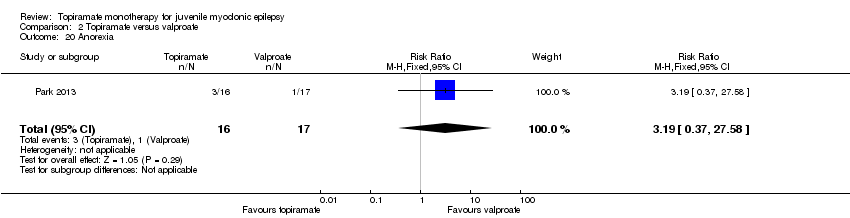 Comparison 2 Topiramate versus valproate, Outcome 20 Anorexia. | ||||
| 21 Hallucination Show forest plot | 1 | 33 | Risk Difference (M‐H, Fixed, 95% CI) | 0.06 [‐0.09, 0.22] |
| Analysis 2.21 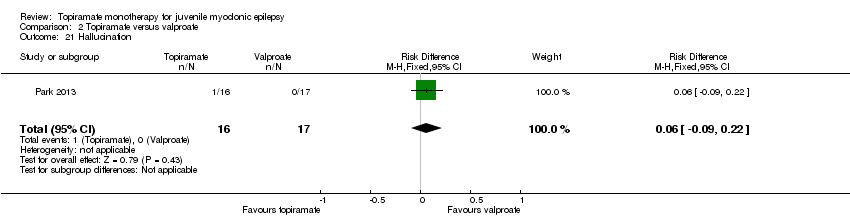 Comparison 2 Topiramate versus valproate, Outcome 21 Hallucination. | ||||
| 22 Diarrhoea Show forest plot | 1 | 33 | Risk Difference (M‐H, Fixed, 95% CI) | ‐0.12 [‐0.30, 0.06] |
| Analysis 2.22 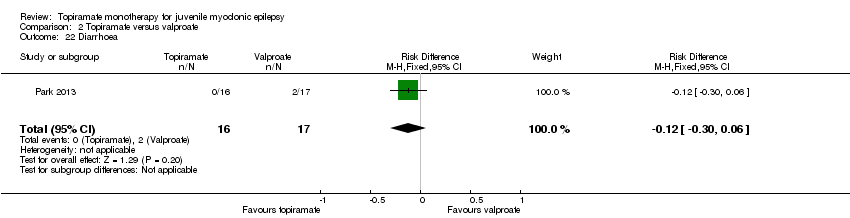 Comparison 2 Topiramate versus valproate, Outcome 22 Diarrhoea. | ||||

Study flow diagram.

Risk of bias graph: review authors' judgements about each risk of bias item presented as percentages across all included studies.

Risk of bias summary: review authors' judgements about each risk of bias item for each included study.
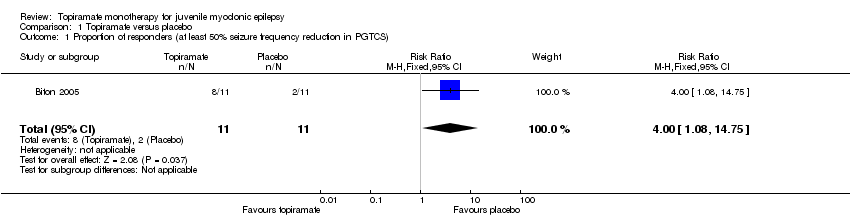
Comparison 1 Topiramate versus placebo, Outcome 1 Proportion of responders (at least 50% seizure frequency reduction in PGTCS).

Comparison 1 Topiramate versus placebo, Outcome 2 Nausea.

Comparison 1 Topiramate versus placebo, Outcome 3 Upper respiratory tract infection.

Comparison 1 Topiramate versus placebo, Outcome 4 Abnormal vision.

Comparison 1 Topiramate versus placebo, Outcome 5 Diarrhoea.

Comparison 2 Topiramate versus valproate, Outcome 1 Proportion of responders (at least 50% seizure frequency reduction in myoclonic seizures).
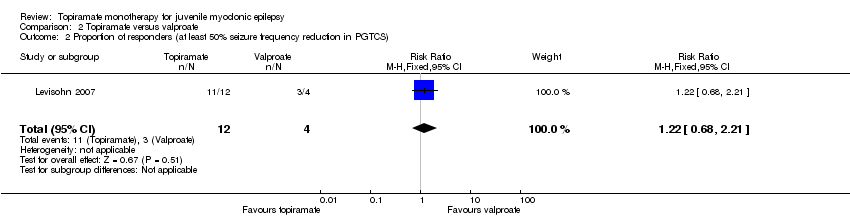
Comparison 2 Topiramate versus valproate, Outcome 2 Proportion of responders (at least 50% seizure frequency reduction in PGTCS).

Comparison 2 Topiramate versus valproate, Outcome 3 Number of participants with seizure‐free.

Comparison 2 Topiramate versus valproate, Outcome 4 Paraesthesia.

Comparison 2 Topiramate versus valproate, Outcome 5 Weight gain.

Comparison 2 Topiramate versus valproate, Outcome 6 Tremor.

Comparison 2 Topiramate versus valproate, Outcome 7 Headache.

Comparison 2 Topiramate versus valproate, Outcome 8 Concentration difficulty.
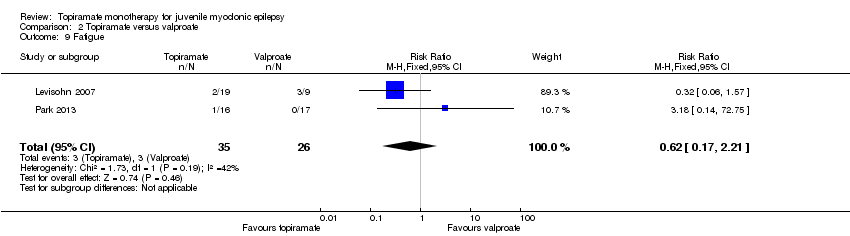
Comparison 2 Topiramate versus valproate, Outcome 9 Fatigue.

Comparison 2 Topiramate versus valproate, Outcome 10 Alopecia.

Comparison 2 Topiramate versus valproate, Outcome 11 Dizziness.

Comparison 2 Topiramate versus valproate, Outcome 12 Weight loss.

Comparison 2 Topiramate versus valproate, Outcome 13 Psychomotor slowing.
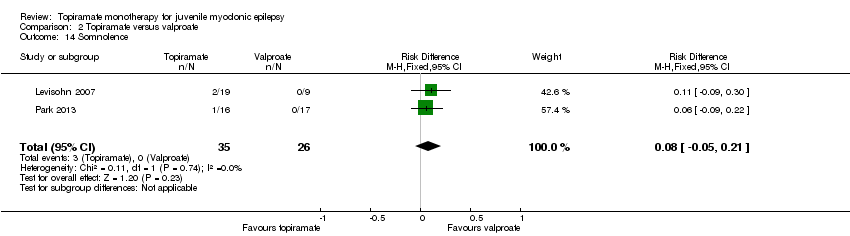
Comparison 2 Topiramate versus valproate, Outcome 14 Somnolence.

Comparison 2 Topiramate versus valproate, Outcome 15 Nausea.

Comparison 2 Topiramate versus valproate, Outcome 16 Appetite increase.

Comparison 2 Topiramate versus valproate, Outcome 17 Insomnia.
Comparison 2 Topiramate versus valproate, Outcome 18 Abnormal vision.

Comparison 2 Topiramate versus valproate, Outcome 19 Rash.

Comparison 2 Topiramate versus valproate, Outcome 20 Anorexia.

Comparison 2 Topiramate versus valproate, Outcome 21 Hallucination.

Comparison 2 Topiramate versus valproate, Outcome 22 Diarrhoea.
| Topiramate compared with placebo for juvenile myoclonic epilepsy | ||||||
| Patient or population: people with juvenile myoclonic epilepsy Settings: 18 centers in the United States; 10 centers in Europe; 1 center in Costa Rica Intervention: topiramate Comparison: placebo | ||||||
| Outcomes | Illustrative comparative risks* (95% CI) | Relative effect | No of Participants | Quality of the evidence | Comments | |
| Assumed risk | Corresponding risk | |||||
| Placebo | Topiramate | |||||
| Proportion of responders (at least 50% seizure frequency reduction in PGTCS) | 182 per 1000 | 727 per 1000 (197 to 1000) | RR 4.00 (1.08 to 14.75) | 22 (1 study) | ⊕⊝⊝⊝ | More participants taking topiramate responded with a 50% or more reduction in PGTCS compared with placebo (P = 0.03) |
| Proportion of participants who experienced at least one AE and individual AEs | See comment | See comment | NA | 22 (1 study) | ⊕⊝⊝⊝ | Number of participants experiencing at least one AE was not reported. Individual AEs: no significant differences were found in nausea, upper respiratory tract infection, abnormal vision, or diarrhoea between topiramate versus placebo |
| Number of participants who were seizure‐free | Not reported | Not reported | NA | |||
| *The basis for the assumed risk was the event rate in the control group. The corresponding risk (and its 95% confidence interval) is based on the assumed risk in the comparison group and the relative effect of the intervention (and its 95% CI). | ||||||
| GRADE Working Group grades of evidence | ||||||
| 1 The included trials were reported as randomized, double‐blind trials with insufficient methodological information | ||||||
| Topiramate compared with valproate for juvenile myoclonic epilepsy | ||||||
| Patient or population: people with juvenile myoclonic epilepsy Settings: Cincinnati Children’s Hospital Medical Center, Cincinnati, USA; Haeundae Paik Hospital, Busan, Republic of Korea Intervention: topiramate Comparison: valproate | ||||||
| Outcomes | Illustrative comparative risks* (95% CI) | Relative effect | No of Participants | Quality of the evidence | Comments | |
| Assumed risk | Corresponding risk | |||||
| Valproate | Topiramate | |||||
| Proportion of responders (at least 50% seizure frequency reduction in myoclonic seizures) | 1000 per 1000 | 857 per 1000 (670 to 1000) | RR 0.88 (0.67 to 1.15) | 28 | ⊕⊝⊝⊝ | No significant difference was found |
| Proportion of responders (at least 50% seizure frequency reduction in PGTCS) | 750 per 1000 | 917 per 1000 (510 to 1000) | RR 1.22 (0.68 to 2.21) | 28 | ⊕⊝⊝⊝ | No significant difference was found |
| Proportion of participants who experienced at least one AE and individual AEs | See comment | See comment | NA | 61 | ⊕⊝⊝⊝ | Number of participants experiencing at least one AE was not reported. In Levisohn 2007 and Park 2013, we found significant differences in the AEs of paraesthesia, weight gain and tremor. Moreover, no significant difference was found in headache, concentration difficulty, fatigue, alopecia, dizziness, weight loss, psychomotor slowing, somnolence, nausea, appetite increase, insomnia, abnormal vision, rash, anorexia, hallucination or diarrhoea. |
| Number of participants who were seizure‐free | 563 per 1000 | 636 per 1000 (343 to 1188) | RR 1.13 (0.61 to 2.11) | 33 | ⊕⊝⊝⊝ | No significant difference was found (P = 0.08) |
| *The basis for the assumed risk was the event rate in the control group. The corresponding risk (and its 95% confidence interval) is based on the assumed risk in the comparison group and the relative effect of the intervention (and its 95% CI). | ||||||
| GRADE Working Group grades of evidence | ||||||
| 1 The included trials were reported as randomized, double‐blind trials with insufficient methodological information | ||||||
| Outcome or subgroup title | No. of studies | No. of participants | Statistical method | Effect size |
| 1 Proportion of responders (at least 50% seizure frequency reduction in PGTCS) Show forest plot | 1 | 22 | Risk Ratio (M‐H, Fixed, 95% CI) | 4.0 [1.08, 14.75] |
| 2 Nausea Show forest plot | 1 | 22 | Risk Ratio (M‐H, Fixed, 95% CI) | 1.67 [0.52, 5.33] |
| 3 Upper respiratory tract infection Show forest plot | 1 | 22 | Risk Ratio (M‐H, Fixed, 95% CI) | 1.5 [0.31, 7.30] |
| 4 Abnormal vision Show forest plot | 1 | 22 | Risk Ratio (M‐H, Fixed, 95% CI) | 2.0 [0.21, 18.98] |
| 5 Diarrhoea Show forest plot | 1 | 22 | Risk Ratio (M‐H, Fixed, 95% CI) | 2.0 [0.21, 18.98] |
| Outcome or subgroup title | No. of studies | No. of participants | Statistical method | Effect size |
| 1 Proportion of responders (at least 50% seizure frequency reduction in myoclonic seizures) Show forest plot | 1 | 23 | Risk Ratio (M‐H, Fixed, 95% CI) | 0.88 [0.67, 1.15] |
| 2 Proportion of responders (at least 50% seizure frequency reduction in PGTCS) Show forest plot | 1 | 16 | Risk Ratio (M‐H, Fixed, 95% CI) | 1.22 [0.68, 2.21] |
| 3 Number of participants with seizure‐free Show forest plot | 1 | 27 | Risk Ratio (M‐H, Fixed, 95% CI) | 1.13 [0.61, 2.11] |
| 4 Paraesthesia Show forest plot | 2 | 61 | Risk Difference (M‐H, Fixed, 95% CI) | 0.19 [0.02, 0.35] |
| 5 Weight gain Show forest plot | 2 | 61 | Risk Difference (M‐H, Fixed, 95% CI) | ‐0.30 [‐0.49, ‐0.10] |
| 6 Tremor Show forest plot | 1 | 33 | Risk Difference (M‐H, Fixed, 95% CI) | ‐0.24 [‐0.45, ‐0.02] |
| 7 Headache Show forest plot | 1 | 28 | Risk Ratio (M‐H, Fixed, 95% CI) | 2.37 [0.32, 17.42] |
| 8 Concentration difficulty Show forest plot | 1 | 28 | Risk Ratio (M‐H, Fixed, 95% CI) | 1.42 [0.17, 11.83] |
| 9 Fatigue Show forest plot | 2 | 61 | Risk Ratio (M‐H, Fixed, 95% CI) | 0.62 [0.17, 2.21] |
| 10 Alopecia Show forest plot | 2 | 61 | Risk Ratio (M‐H, Fixed, 95% CI) | 0.24 [0.06, 1.02] |
| 11 Dizziness Show forest plot | 1 | 28 | Risk Ratio (M‐H, Fixed, 95% CI) | 0.95 [0.10, 9.13] |
| 12 Weight loss Show forest plot | 1 | 28 | Risk Difference (M‐H, Fixed, 95% CI) | 0.11 [‐0.09, 0.30] |
| 13 Psychomotor slowing Show forest plot | 1 | 28 | Risk Difference (M‐H, Fixed, 95% CI) | 0.11 [‐0.09, 0.30] |
| 14 Somnolence Show forest plot | 2 | 61 | Risk Difference (M‐H, Fixed, 95% CI) | 0.08 [‐0.05, 0.21] |
| 15 Nausea Show forest plot | 2 | 61 | Risk Ratio (M‐H, Fixed, 95% CI) | 0.21 [0.04, 1.18] |
| 16 Appetite increase Show forest plot | 1 | 28 | Risk Difference (M‐H, Fixed, 95% CI) | ‐0.22 [‐0.50, 0.05] |
| 17 Insomnia Show forest plot | 1 | 28 | Risk Difference (M‐H, Fixed, 95% CI) | ‐0.22 [‐0.50, 0.05] |
| 18 Abnormal vision Show forest plot | 1 | 28 | Risk Difference (M‐H, Fixed, 95% CI) | ‐0.22 [‐0.50, 0.05] |
| 19 Rash Show forest plot | 1 | 28 | Risk Difference (M‐H, Fixed, 95% CI) | ‐0.22 [‐0.50, 0.05] |
| 20 Anorexia Show forest plot | 1 | 33 | Risk Ratio (M‐H, Fixed, 95% CI) | 3.19 [0.37, 27.58] |
| 21 Hallucination Show forest plot | 1 | 33 | Risk Difference (M‐H, Fixed, 95% CI) | 0.06 [‐0.09, 0.22] |
| 22 Diarrhoea Show forest plot | 1 | 33 | Risk Difference (M‐H, Fixed, 95% CI) | ‐0.12 [‐0.30, 0.06] |