Scolaris Content Display Scolaris Content Display

'Risk of bias' graph: review authors' judgements about each risk of bias item presented as percentages across all included studies.
Figuras y tablas -
Figure 1

'Risk of bias' graph: review authors' judgements about each risk of bias item presented as percentages across all included studies.

'Risk of bias' summary: review authors' judgements about each risk of bias item for each included study.
Figuras y tablas -
Figure 2

'Risk of bias' summary: review authors' judgements about each risk of bias item for each included study.

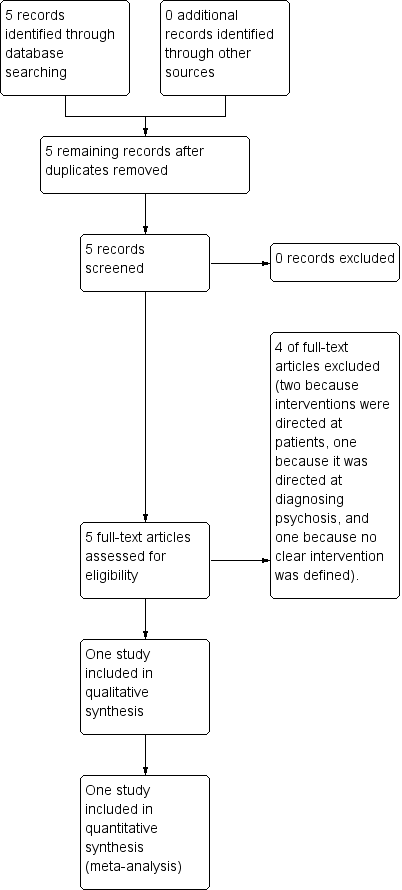
Study flow diagram.
Figuras y tablas -
Figure 3

Study flow diagram.

Comparison 1 Communication skills training versus no specific training, Outcome 1 Patient satisfaction: 1. Satisfaction with treatment: average endpoint score (CSQ‐8, high = good, medium term).
Figuras y tablas -
Analysis 1.1

Comparison 1 Communication skills training versus no specific training, Outcome 1 Patient satisfaction: 1. Satisfaction with treatment: average endpoint score (CSQ‐8, high = good, medium term).

Comparison 1 Communication skills training versus no specific training, Outcome 2 Patient satisfaction: 2. Satisfaction with therapeutic relationship: average endpoint score (STAR‐P, high = good, medium term).
Figuras y tablas -
Analysis 1.2

Comparison 1 Communication skills training versus no specific training, Outcome 2 Patient satisfaction: 2. Satisfaction with therapeutic relationship: average endpoint score (STAR‐P, high = good, medium term).

Comparison 1 Communication skills training versus no specific training, Outcome 3 Mental state: 1. General Symptom: Average endpoint score (PANSS General, high = poor, medium term).
Figuras y tablas -
Analysis 1.3

Comparison 1 Communication skills training versus no specific training, Outcome 3 Mental state: 1. General Symptom: Average endpoint score (PANSS General, high = poor, medium term).

Comparison 1 Communication skills training versus no specific training, Outcome 4 Mental state: 2. Positive Symptom; Average endpoint score (PANSS Positive, high = poor, medium term).
Figuras y tablas -
Analysis 1.4

Comparison 1 Communication skills training versus no specific training, Outcome 4 Mental state: 2. Positive Symptom; Average endpoint score (PANSS Positive, high = poor, medium term).

Comparison 1 Communication skills training versus no specific training, Outcome 5 Mental state: 3. Negative Symptom: Average endpoint score (PANSS Negative, high = poor, medium term).
Figuras y tablas -
Analysis 1.5

Comparison 1 Communication skills training versus no specific training, Outcome 5 Mental state: 3. Negative Symptom: Average endpoint score (PANSS Negative, high = poor, medium term).

Comparison 1 Communication skills training versus no specific training, Outcome 6 Leaving the study early (patient).
Figuras y tablas -
Analysis 1.6

Comparison 1 Communication skills training versus no specific training, Outcome 6 Leaving the study early (patient).

Table 1. Suggested future trial design

Method

Cluster‐randomised controlled study with the allocation clearly described

Blinding: single‐blinded, described and tested

Single‐blinding is a more realistic allocation for this type of study which should aim to blind trainees and patients to primary and secondary outcomes.

Three‐, six‐ and 12‐month follow‐ups would be desirable in order to assess whether the impact of communication skills training is enduring.

Participants

Future studies target both trainee psychiatrists and more experienced psychiatrists. Patients diagnosed with specific mental health conditions (e.g. psychosis, bipolar, anxiety), but recruit inpatients or patients near discharge from hospital. In order to avoid loss to follow‐up and increase the power of the study a larger sample needs to be recruited with multiple psychiatric hospitals/trusts.

Intervention

The interventions could be expanded to include on‐line communication skills training, written feedback, a reflective written report and a control condition. Video‐taping of face‐to‐face consultations with patients could be done before the intervention starts in order to obtain baseline data and allow post‐intervention comparisons. Text messaging and access to computerised GP records could be employed to limit loss to follow‐up and improve data quality.

Outcomes

Primary outcomes

With relation to the patients treated by the mental health professional.

1. Adherence to treatment

1.1 Taking of medication
1.2 Attendance at scheduled appointments.

With relation to the mental health professional.

2.1 Satisfaction with the training programme

2.2 Integration of key communication skills into clinical practice post‐intervention

2.3 Reason for leaving the study early

Secondary outcomes

With relation to the patients treated by the mental health professional.

1. Global state

1.1 Clinically important improvement
1.2 Any improvement
1.3 Average change or endpoint scores on global state scales

2. Service Use

2.1 Number of hospital admissions
2.2 Days spent in hospital

3. Mental state

3.1 Positive symptoms (delusions, hallucinations, disordered thinking)
3.2 Negative symptoms (avolition, poor self‐care, blunted affect)
3.3 Average change or endpoint scores on mental state scales

4. Patient satisfaction

4.1 Average change or endpoint scores on satisfaction scales

5. Social functioning

5.1 Average change or endpoint scores on social functioning scales
5.2 Employment status (employed/unemployed)
5.3 Work‐related activities
5.4 Able to live independently
5.5 Imprisonment

6. Quality of life

6.1 Clinically important change in general quality of life
6.2 Average change or endpoint scores on quality of life scales

7. Reason for leaving the study early

Notes

A future study should be powered to be able to identify a difference of ˜10% between groups for primary outcomes with adequate degree of certainty

Figuras y tablas -
Table 1. Suggested future trial design
Summary of findings for the main comparison. Communication skills training compared with no specific training

Communication skills training programme compared with no specific training programme for psychiatrists who treat patients with severe mental illness

Patient or population: psychiatrists and people with schizoaffective disorder or schizophrenia

Settings: outpatient or community

Intervention: communication skills training programme (CST)

Comparison: no specific communication skills training programme (NST)

Outcomes

Illustrative comparative risks* (SD)

Relative effect
(95% CI)

No of Participants
(studies)

Quality of the evidence
(GRADE)

Comments

Assumed risk

Corresponding risk

Control

Experimental

Adherence to Adherence to treatment: taking of medication, attending appointments

See comments

See comments

Not estimable

See comments

See comments

no data available

1. Patient satisfaction: 1. Satisfaction with treatment: average endpoint score (CSQ‐8, high = good, medium term)

The mean patient satisfaction with treatment in NST group was 26.6 ± 4.6
at 5 months

The mean patient satisfaction with treatment in the CST group was 28.3 ± 3.6
at 5 months

Adjusted mean difference

1.77 (95% CI ‐ 0.13 to 3.68)

1 RCT, n = 66/97

⊕⊕⊝⊝
low 1

This was based on unpublished data obtained from the author. Intracluster correlation coefficient was 0.65.

Patient satisfaction: 2. Satisfaction with therapeutic relationship: average endpoint score (STAR‐P, high = good, medium term)

The mean therapeutic relationship (as judged by the patient) in the NST group was 2.6 ± 0.3

The mean value for therapeutic relationship (as judged by the patient) in the CST group was 2.8 ± 0.4

Adjusted mean difference

0.21 (95% CI 0.01 to 0.41, P = 0.043)

1 RCT, n = 63/97)

⊕⊕⊝⊝
low1

Patients in the intervention group judged the therapeutic relationship to be more favourable. There was a negative intracluster correlation coefficient.

Mental state: General, Positive and Negative Symptoms: Average endpoint score (PANSS General, Positive, Negative, high = poor, medium term)

In the NST group, the mean severity scores at follow‐up were:

General symptoms 34.1 ± 7.9;

Positive symptoms 14.5 ± 5.9

Negative symptoms 14.1 ± 5.5

In the CST group, the mean severity scores at follow‐up were:

General symptoms 34.3 ± 12.3

Positive symptoms 14.9 ± 6.9

Negative symptoms 16.3 ± 7.3

Adjusted mean difference

General 4.48 (95%CI ‐ 2.10 to 11.06)

Positive ‐0.23 (95% CI ‐ 2.91 to 2.45)

Negative 3.42 ( 95% CI ‐ 0.24 to 7.09)

1 RCT, n = 59/97

⊕⊕⊝⊝
low1

No significant difference in endpoint disease severity scores between intervention and control. This was based on unpublished data obtained from the author. Intracluster correlation coefficient was zero.

Global State: clinically important improvement

See comments

See comments

Not estimable

See comments

See comments

no data available

Service Use: hospital admission, days in hospital

See comments

See comments

Not estimable

See comments

See comments

no data available

Quality of Life: clinically important improvement

See comments

See comments

Not estimable

See comments

See comments

no data available

*The basis for the assumed risk (e.g. the median control group risk across studies) is provided in footnotes. The corresponding risk (and its 95% confidence interval) is based on the assumed risk in the comparison group and the relative effect of the intervention (and its 95% CI).
CI: Confidence interval; SD: Standard deviation

GRADE Working Group grades of evidence
High quality: Further research is very unlikely to change our confidence in the estimate of effect.
Moderate quality: Further research is likely to have an important impact on our confidence in the estimate of effect and may change the estimate.
Low quality: Further research is very likely to have an important impact on our confidence in the estimate of effect and is likely to change the estimate.
Very low quality: We are very uncertain about the estimate.

1. Very serious: Downgraded by 2. The downgrading is because of the small pilot nature of the trial, imprecision and substantial losses to follow‐up amounting to >30%.

Figuras y tablas -
Summary of findings for the main comparison. Communication skills training compared with no specific training
Comparison 1. Communication skills training versus no specific training

Outcome or subgroup title

No. of studies

No. of participants

Statistical method

Effect size

1 Patient satisfaction: 1. Satisfaction with treatment: average endpoint score (CSQ‐8, high = good, medium term) Show forest plot

1

Mean Difference (Fixed, 95% CI)

1.77 [‐0.13, 3.68]

2 Patient satisfaction: 2. Satisfaction with therapeutic relationship: average endpoint score (STAR‐P, high = good, medium term) Show forest plot

1

Mean Difference (Fixed, 95% CI)

0.21 [0.01, 0.41]

3 Mental state: 1. General Symptom: Average endpoint score (PANSS General, high = poor, medium term) Show forest plot

1

Mean Difference (Fixed, 95% CI)

4.48 [‐2.10, 11.06]

4 Mental state: 2. Positive Symptom; Average endpoint score (PANSS Positive, high = poor, medium term) Show forest plot

1

Mean Difference (Fixed, 95% CI)

‐0.23 [‐2.91, 2.45]

5 Mental state: 3. Negative Symptom: Average endpoint score (PANSS Negative, high = poor, medium term) Show forest plot

1

Mean Difference (Fixed, 95% CI)

3.42 [‐0.24, 7.09]

6 Leaving the study early (patient) Show forest plot

1

97

Risk Ratio (M‐H, Fixed, 95% CI)

0.89 [0.51, 1.55]

Figuras y tablas -
Comparison 1. Communication skills training versus no specific training