Szkolenie z umiejętności komunikacji dla specjalistów z zakresu zdrowia psychicznego, pracujących z chorymi na ciężką chorobę psychiczną
Referencias
References to studies included in this review
References to studies excluded from this review
Additional references
References to other published versions of this review
Characteristics of studies
Characteristics of included studies [ordered by study ID]
Ir a:
| Methods | Allocation: random, cluster. Setting: outpatient ‐ university‐affiliated, state‐supported, outpatient psychiatric clinic in an urban area (East London, UK). Study sites were the East London NHS Foundation Trust and North East London NHS Foundation Trust. | |
| Participants | Practitioners Higher or advanced trainees working in outpatient or community settings. Patients Diagnosis: ICD‐10 criteria for a diagnosis of schizoaffective disorder or schizophrenia. N = 97. Sex: 66 M, 31F. Exclusions: patients who had organic impairment or required an interpreter. | |
| Interventions | 1. Communication skills training: A training programme:, comprised of 4 training sessions of 4 hours each, at weekly intervals to small groups of psychiatrists, followed by two refresher sessions (one at 8 weeks and the other at 12 weeks). During the training sessions, the psychiatrist and the patient were video‐recorded during the consultation; the researchers then provided feedback. N = 10 (psychiatrists), N = 47 (patients). 2. No specific communication skills training: N = 11 (psychiatrists), N = 50 (patients) | |
| Outcomes | Mental state: endpoint score PANSS (positive, negative, and general symptoms) Patient satisfaction: with treatment‐ endpoint (CSQ‐8), with therapeutic relationship ‐ endpoint score (STAR‐P) Leaving the study early | |
| Notes | ||
| Risk of bias | ||
| Bias | Authors' judgement | Support for judgement |
| Random sequence generation (selection bias) | Low risk | Computer‐generated allocation: sequence generated in Excel with the RAND function. |
| Allocation concealment (selection bias) | High risk | The trial report states "There was no allocation concealment". |
| Blinding of participants and personnel (performance bias) | Unclear risk | Participants were blinded for primary and secondary outcomes as they did not know whether the psychiatrists had undergone communication skills training or not. It was not possible to blind the psychiatrists involved in the study. |
| Blinding of outcome assessment (detection bias) | Unclear risk | Blinding of outcome assessors: primary outcome, self‐repair, was masked but for the secondary outcome, the therapeutic relationship, it was not possible to mask |
| Incomplete outcome data (attrition bias) | High risk | Only 64/97 patients were followed up as 33 had left the trial early. |
| Selective reporting (reporting bias) | Low risk | We contacted the investigators and obtained data on all the outcomes that were relevant to our review, even if the data had not been reported in the published version. We also received additional data on outcomes that were pre‐specified by the investigators, but not of relevance to our review. |
| Other bias | Unclear risk | Originally. the trial planned to have a further follow‐up point six months later, but this could not be carried out as psychiatrists had rotated away to different posts.The extent to which this could have biased the results is unclear. |
CSQ ‐ 8: Client Satisfaction Questionnaire
ICD 10: International Classification of Diseases 10th revision
N = number
PANSS: Positive and Negative Symptom Scale
STAR ‐ P: Scale To Assess the Therapeutic Relationship in community mental health care
Characteristics of excluded studies [ordered by study ID]
Ir a:
| Study | Reason for exclusion |
| Allocation; randomised Intervention: not directed at communication skills of healthcare professionals. The aim was to train general practitioners in detecting first episode of psychosis. | |
| Allocation: unclear Participants: people with schizophrenia Intervention: not reported. | |
| Allocation; randomised Participants: people with schizophrenia Intervention: Interactive Web‐based intervention featuring actors simulating a patient discussing treatment concerns. The study was not directed at healthcare professionals, but was aimed at training patients to raise concerns during consultations | |
| Allocation: randomised Participants: people with schizophrenia Intervention: Psychodrama‐based Role Re‐Training. The study was not directed at healthcare professionals but at "regressed schizophrenic inpatients" with the aim to improve their "interpersonal presentableness." |
Data and analyses
| Outcome or subgroup title | No. of studies | No. of participants | Statistical method | Effect size |
| 1 Patient satisfaction: 1. Satisfaction with treatment: average endpoint score (CSQ‐8, high = good, medium term) Show forest plot | 1 | Mean Difference (Fixed, 95% CI) | 1.77 [‐0.13, 3.68] | |
| Analysis 1.1  Comparison 1 Communication skills training versus no specific training, Outcome 1 Patient satisfaction: 1. Satisfaction with treatment: average endpoint score (CSQ‐8, high = good, medium term). | ||||
| 2 Patient satisfaction: 2. Satisfaction with therapeutic relationship: average endpoint score (STAR‐P, high = good, medium term) Show forest plot | 1 | Mean Difference (Fixed, 95% CI) | 0.21 [0.01, 0.41] | |
| Analysis 1.2  Comparison 1 Communication skills training versus no specific training, Outcome 2 Patient satisfaction: 2. Satisfaction with therapeutic relationship: average endpoint score (STAR‐P, high = good, medium term). | ||||
| 3 Mental state: 1. General Symptom: Average endpoint score (PANSS General, high = poor, medium term) Show forest plot | 1 | Mean Difference (Fixed, 95% CI) | 4.48 [‐2.10, 11.06] | |
| Analysis 1.3  Comparison 1 Communication skills training versus no specific training, Outcome 3 Mental state: 1. General Symptom: Average endpoint score (PANSS General, high = poor, medium term). | ||||
| 4 Mental state: 2. Positive Symptom; Average endpoint score (PANSS Positive, high = poor, medium term) Show forest plot | 1 | Mean Difference (Fixed, 95% CI) | ‐0.23 [‐2.91, 2.45] | |
| Analysis 1.4  Comparison 1 Communication skills training versus no specific training, Outcome 4 Mental state: 2. Positive Symptom; Average endpoint score (PANSS Positive, high = poor, medium term). | ||||
| 5 Mental state: 3. Negative Symptom: Average endpoint score (PANSS Negative, high = poor, medium term) Show forest plot | 1 | Mean Difference (Fixed, 95% CI) | 3.42 [‐0.24, 7.09] | |
| Analysis 1.5 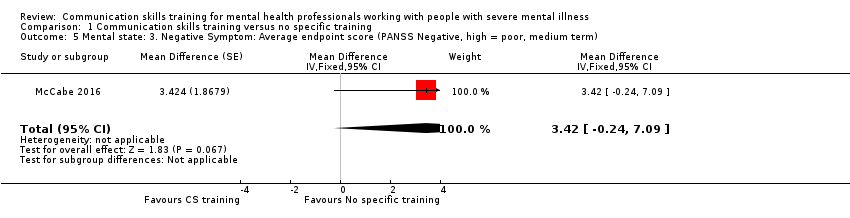 Comparison 1 Communication skills training versus no specific training, Outcome 5 Mental state: 3. Negative Symptom: Average endpoint score (PANSS Negative, high = poor, medium term). | ||||
| 6 Leaving the study early (patient) Show forest plot | 1 | 97 | Risk Ratio (M‐H, Fixed, 95% CI) | 0.89 [0.51, 1.55] |
| Analysis 1.6 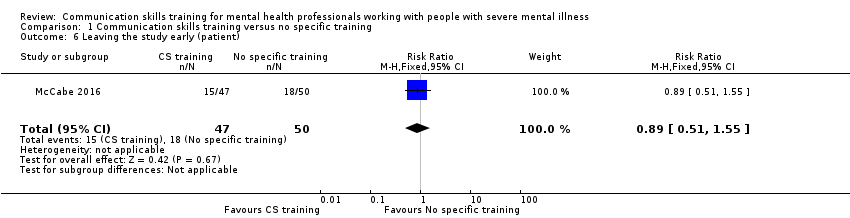 Comparison 1 Communication skills training versus no specific training, Outcome 6 Leaving the study early (patient). | ||||

'Risk of bias' graph: review authors' judgements about each risk of bias item presented as percentages across all included studies.

'Risk of bias' summary: review authors' judgements about each risk of bias item for each included study.
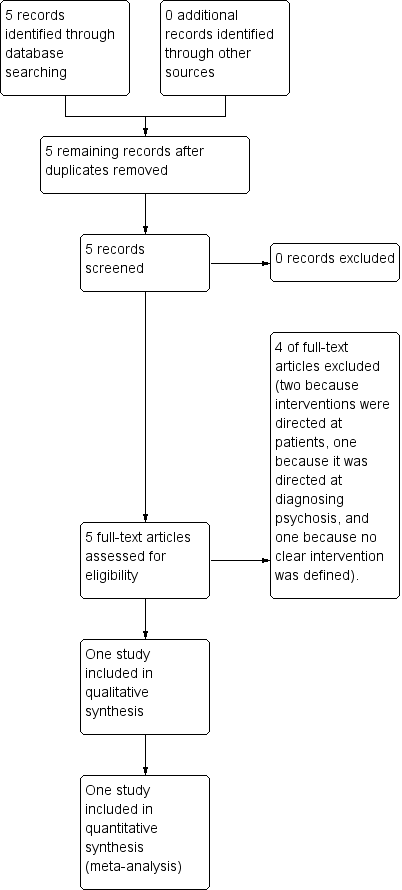
Study flow diagram.
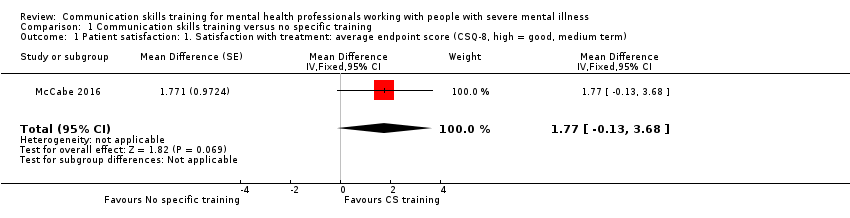
Comparison 1 Communication skills training versus no specific training, Outcome 1 Patient satisfaction: 1. Satisfaction with treatment: average endpoint score (CSQ‐8, high = good, medium term).
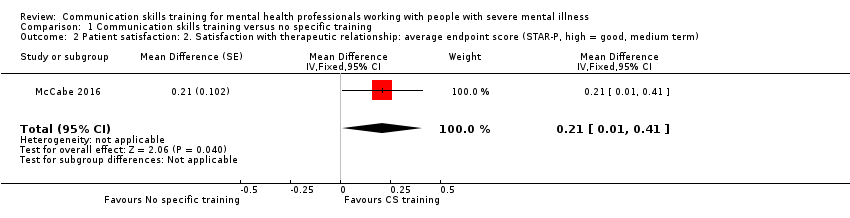
Comparison 1 Communication skills training versus no specific training, Outcome 2 Patient satisfaction: 2. Satisfaction with therapeutic relationship: average endpoint score (STAR‐P, high = good, medium term).
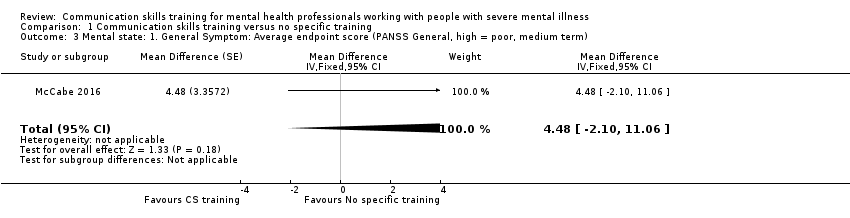
Comparison 1 Communication skills training versus no specific training, Outcome 3 Mental state: 1. General Symptom: Average endpoint score (PANSS General, high = poor, medium term).

Comparison 1 Communication skills training versus no specific training, Outcome 4 Mental state: 2. Positive Symptom; Average endpoint score (PANSS Positive, high = poor, medium term).

Comparison 1 Communication skills training versus no specific training, Outcome 5 Mental state: 3. Negative Symptom: Average endpoint score (PANSS Negative, high = poor, medium term).

Comparison 1 Communication skills training versus no specific training, Outcome 6 Leaving the study early (patient).
| Method | Cluster‐randomised controlled study with the allocation clearly described Blinding: single‐blinded, described and tested Single‐blinding is a more realistic allocation for this type of study which should aim to blind trainees and patients to primary and secondary outcomes. Three‐, six‐ and 12‐month follow‐ups would be desirable in order to assess whether the impact of communication skills training is enduring. |
| Participants | Future studies target both trainee psychiatrists and more experienced psychiatrists. Patients diagnosed with specific mental health conditions (e.g. psychosis, bipolar, anxiety), but recruit inpatients or patients near discharge from hospital. In order to avoid loss to follow‐up and increase the power of the study a larger sample needs to be recruited with multiple psychiatric hospitals/trusts. |
| Intervention | The interventions could be expanded to include on‐line communication skills training, written feedback, a reflective written report and a control condition. Video‐taping of face‐to‐face consultations with patients could be done before the intervention starts in order to obtain baseline data and allow post‐intervention comparisons. Text messaging and access to computerised GP records could be employed to limit loss to follow‐up and improve data quality. |
| Outcomes | Primary outcomes With relation to the patients treated by the mental health professional. 1. Adherence to treatment 1.1 Taking of medication With relation to the mental health professional. 2.1 Satisfaction with the training programme 2.2 Integration of key communication skills into clinical practice post‐intervention 2.3 Reason for leaving the study early Secondary outcomes With relation to the patients treated by the mental health professional. 1. Global state 1.1 Clinically important improvement 2. Service Use 2.1 Number of hospital admissions 3. Mental state 3.1 Positive symptoms (delusions, hallucinations, disordered thinking) 4. Patient satisfaction 4.1 Average change or endpoint scores on satisfaction scales 5. Social functioning 5.1 Average change or endpoint scores on social functioning scales 6. Quality of life 6.1 Clinically important change in general quality of life 7. Reason for leaving the study early |
| Notes | A future study should be powered to be able to identify a difference of ˜10% between groups for primary outcomes with adequate degree of certainty |
| Communication skills training programme compared with no specific training programme for psychiatrists who treat patients with severe mental illness | ||||||
| Patient or population: psychiatrists and people with schizoaffective disorder or schizophrenia Settings: outpatient or community Intervention: communication skills training programme (CST) Comparison: no specific communication skills training programme (NST) | ||||||
| Outcomes | Illustrative comparative risks* (SD) | Relative effect | No of Participants | Quality of the evidence | Comments | |
| Assumed risk | Corresponding risk | |||||
| Control | Experimental | |||||
| Adherence to Adherence to treatment: taking of medication, attending appointments | See comments | See comments | Not estimable | See comments | See comments | no data available |
| 1. Patient satisfaction: 1. Satisfaction with treatment: average endpoint score (CSQ‐8, high = good, medium term) | The mean patient satisfaction with treatment in NST group was 26.6 ± 4.6 | The mean patient satisfaction with treatment in the CST group was 28.3 ± 3.6 | Adjusted mean difference 1.77 (95% CI ‐ 0.13 to 3.68) | 1 RCT, n = 66/97 | ⊕⊕⊝⊝ | This was based on unpublished data obtained from the author. Intracluster correlation coefficient was 0.65. |
| Patient satisfaction: 2. Satisfaction with therapeutic relationship: average endpoint score (STAR‐P, high = good, medium term) | The mean therapeutic relationship (as judged by the patient) in the NST group was 2.6 ± 0.3 | The mean value for therapeutic relationship (as judged by the patient) in the CST group was 2.8 ± 0.4 | Adjusted mean difference 0.21 (95% CI 0.01 to 0.41, P = 0.043) | 1 RCT, n = 63/97) | ⊕⊕⊝⊝ | Patients in the intervention group judged the therapeutic relationship to be more favourable. There was a negative intracluster correlation coefficient. |
| Mental state: General, Positive and Negative Symptoms: Average endpoint score (PANSS General, Positive, Negative, high = poor, medium term) | In the NST group, the mean severity scores at follow‐up were: General symptoms 34.1 ± 7.9; Positive symptoms 14.5 ± 5.9 Negative symptoms 14.1 ± 5.5 | In the CST group, the mean severity scores at follow‐up were: General symptoms 34.3 ± 12.3 Positive symptoms 14.9 ± 6.9 Negative symptoms 16.3 ± 7.3 | Adjusted mean difference General 4.48 (95%CI ‐ 2.10 to 11.06) Positive ‐0.23 (95% CI ‐ 2.91 to 2.45) Negative 3.42 ( 95% CI ‐ 0.24 to 7.09) | 1 RCT, n = 59/97 | ⊕⊕⊝⊝ | No significant difference in endpoint disease severity scores between intervention and control. This was based on unpublished data obtained from the author. Intracluster correlation coefficient was zero. |
| Global State: clinically important improvement | See comments | See comments | Not estimable | See comments | See comments | no data available |
| Service Use: hospital admission, days in hospital | See comments | See comments | Not estimable | See comments | See comments | no data available |
| Quality of Life: clinically important improvement | See comments | See comments | Not estimable | See comments | See comments | no data available |
| *The basis for the assumed risk (e.g. the median control group risk across studies) is provided in footnotes. The corresponding risk (and its 95% confidence interval) is based on the assumed risk in the comparison group and the relative effect of the intervention (and its 95% CI). | ||||||
| GRADE Working Group grades of evidence | ||||||
| 1. Very serious: Downgraded by 2. The downgrading is because of the small pilot nature of the trial, imprecision and substantial losses to follow‐up amounting to >30%. | ||||||
| Outcome or subgroup title | No. of studies | No. of participants | Statistical method | Effect size |
| 1 Patient satisfaction: 1. Satisfaction with treatment: average endpoint score (CSQ‐8, high = good, medium term) Show forest plot | 1 | Mean Difference (Fixed, 95% CI) | 1.77 [‐0.13, 3.68] | |
| 2 Patient satisfaction: 2. Satisfaction with therapeutic relationship: average endpoint score (STAR‐P, high = good, medium term) Show forest plot | 1 | Mean Difference (Fixed, 95% CI) | 0.21 [0.01, 0.41] | |
| 3 Mental state: 1. General Symptom: Average endpoint score (PANSS General, high = poor, medium term) Show forest plot | 1 | Mean Difference (Fixed, 95% CI) | 4.48 [‐2.10, 11.06] | |
| 4 Mental state: 2. Positive Symptom; Average endpoint score (PANSS Positive, high = poor, medium term) Show forest plot | 1 | Mean Difference (Fixed, 95% CI) | ‐0.23 [‐2.91, 2.45] | |
| 5 Mental state: 3. Negative Symptom: Average endpoint score (PANSS Negative, high = poor, medium term) Show forest plot | 1 | Mean Difference (Fixed, 95% CI) | 3.42 [‐0.24, 7.09] | |
| 6 Leaving the study early (patient) Show forest plot | 1 | 97 | Risk Ratio (M‐H, Fixed, 95% CI) | 0.89 [0.51, 1.55] |