Scolaris Content Display Scolaris Content Display

Network of comparisons of serious adverse events with regular formoterol and salmeterol (with or without regular inhaled corticosteroids (ICS)). Red lines show direct comparisons between formoterol and salmeterol. Green lines show direct comparisons for each drug with placebo (Figure 1A) or ICS (Figure 1B), and can be compared (horizontally) with each other to make indirect comparisons of formoterol and salmeterol. The placebo comparison results (Figure 1A) can also be compared (vertically) to the ICS comparison results (Figure 1B) to indirectly assess the impact of ICS on the serious adverse events with formoterol and salmeterol.
Figuras y tablas -
Figure 1

Network of comparisons of serious adverse events with regular formoterol and salmeterol (with or without regular inhaled corticosteroids (ICS)). Red lines show direct comparisons between formoterol and salmeterol. Green lines show direct comparisons for each drug with placebo (Figure 1A) or ICS (Figure 1B), and can be compared (horizontally) with each other to make indirect comparisons of formoterol and salmeterol. The placebo comparison results (Figure 1A) can also be compared (vertically) to the ICS comparison results (Figure 1B) to indirectly assess the impact of ICS on the serious adverse events with formoterol and salmeterol.

Review selection flow diagram.
Figuras y tablas -
Figure 2

Review selection flow diagram.

Children with all‐cause SAEs compared using Peto ORs
Figuras y tablas -
Figure 3

Children with all‐cause SAEs compared using Peto ORs

Children with an all‐cause SAE: formoterol versus placebo subgrouped by brand and dose
Figuras y tablas -
Figure 4

Children with an all‐cause SAE: formoterol versus placebo subgrouped by brand and dose

Interaction between randomised use of ICS and children with all‐cause SAE on regular LABA using ORs
Figuras y tablas -
Figure 5

Interaction between randomised use of ICS and children with all‐cause SAE on regular LABA using ORs

Cates plot of monotherapy versus placebo trials: In the placebo group 36 people out of 1000 had non‐fatal serious adverse events of any cause over 29 weeks, compared to 57 (95% CI 40 to 81) out of 1000 for the LABA monotherapy group. The crossed‐out faces show that there were 21 additional children suffering an SAE for every 1000 treated with LABA monotherapy.
Figuras y tablas -
Figure 6

Cates plot of monotherapy versus placebo trials: In the placebo group 36 people out of 1000 had non‐fatal serious adverse events of any cause over 29 weeks, compared to 57 (95% CI 40 to 81) out of 1000 for the LABA monotherapy group. The crossed‐out faces show that there were 21 additional children suffering an SAE for every 1000 treated with LABA monotherapy.

Cates plot of combination therapy versus ICS trials: In the ICS group 7 people out of 1000 had non‐fatal serious adverse events of any cause over 14 weeks, compared to 10 (95% CI 6 to 19) out of 1000 for the combination therapy group. The crossed‐out faces show that there were 3 additional children suffering an SAE for every 1000 treated with LABA combination therapy.
Figuras y tablas -
Figure 7

Cates plot of combination therapy versus ICS trials: In the ICS group 7 people out of 1000 had non‐fatal serious adverse events of any cause over 14 weeks, compared to 10 (95% CI 6 to 19) out of 1000 for the combination therapy group. The crossed‐out faces show that there were 3 additional children suffering an SAE for every 1000 treated with LABA combination therapy.

Indirect comparison of formoterol and budesonide with salmeterol and fluticasone
Figuras y tablas -
Figure 8

Indirect comparison of formoterol and budesonide with salmeterol and fluticasone

Children with asthma‐related SAE compared using Peto OR
Figuras y tablas -
Figure 9

Children with asthma‐related SAE compared using Peto OR

Interaction between randomised use of ICS and children with asthma‐related SAE on regular LABA using ORs
Figuras y tablas -
Figure 10

Interaction between randomised use of ICS and children with asthma‐related SAE on regular LABA using ORs

Table 1. Summary of findings ‐ children with a serious adverse event

Comparison

Illustrative comparative risks* (95% CI)

Relative effect
(95% CI)

No of participants
(studies)

Quality of the evidence
(GRADE)

Comments

Assumed risk

Corresponding risk

Control

Regular LABA (salmeterol or formoterol)

Children with a fatal serious adverse event of any cause

All comparisons

see comment

see comment

see comment

see comment

see comment

There was only a single child who died in all the studies so mortality could not be assessed.

Children with a non‐fatal serious adverse event of any cause

Regular formoterol versus placeboCates 2012a
Follow‐up: mean 27 weeks

12 per 1000

30 per 1000
(15 to 56)

OR 2.48
(1.27 to 4.83)

1335
(5 studies)

⊕⊕⊕⊕
high

Regular salmeterol versus placeboCates 2008
Follow‐up: mean 31 weeks

56 per 1000

72 per 1000
(46 to 108)

OR 1.3
(0.82 to 2.05)

1333
(5 studies)

⊕⊕⊕⊝
moderate1

Regular formoterol & ICS versus ICSCates 2009b

Follow‐up: mean 13 weeks

8 per 1000

14 per 1000
(7 to 27)

OR 1.62 (0.80 to 3.28)

2788

(7 studies)

⊕⊕⊕⊝
moderate1

Regular salmeterol & ICS versus ICSCates 2009a
Follow‐up: mean 15 weeks

5 per 1000

6 per 1000
(2 to 19)

OR 1.20
(0.37 to 3.91)

1862
(5 studies)

⊕⊕⊕⊝
moderate1

Regular formoterol versus regular salmeterolCates 2012b
Follow‐up: 13 weeks

13 per 1000

(on salmeterol)

12 per 1000
(1 to 168)

(on formoterol)

OR 0.95
(0.06 to 15.33)

156
(1 study)

⊕⊕⊝⊝
low1,2

Formoterol was considered the active treatment and salmeterol the control treatment for this comparison

Children with a non‐fatal serious adverse event related to asthma

Regular formoterol versus placeboCates 2012a
Follow‐up: mean 27 weeks

2 per 1000

8 per 1000
(4 to 18)

OR 4.06
(1.78 to 9.22)

1335
(5 studies)

⊕⊕⊕⊕
high

Regular salmeterol versus placeboCates 2008
Follow‐up: mean 31 weeks

33 per 1000

55 per 1000
(33 to 92)

OR 1.72
(1 to 2.98)

1333
(5 studies)

⊕⊕⊕⊕
high

Regular formoterol & ICS versus ICSCates 2009b
Follow‐up: mean 13 weeks

4 per 1000

6 per 1000
(2 to 17)

OR 1.49
(0.48 to 4.61)

2788
(7 studies)

⊕⊕⊝⊝
low1,3

Regular salmeterol & ICS versus ICSCates 2009a
Follow‐up: mean 15 weeks

1 per 1000

1 per 1000
(0 to 17)

OR 0.99
(0.06 to 15.85)

1862
(5 studies)

⊕⊕⊝⊝
low1,3

*The basis for the assumed risk (was the mean control group risk across studies). The corresponding risk (and its 95% confidence interval) is based on the assumed risk in the comparison group and the relative effect of the intervention (and its 95% CI).
CI: Confidence interval; OR: Odds ratio; SAE: serious adverse event

GRADE Working Group grades of evidence
High quality: Further research is very unlikely to change our confidence in the estimate of effect.
Moderate quality: Further research is likely to have an important impact on our confidence in the estimate of effect and may change the estimate.
Low quality: Further research is very likely to have an important impact on our confidence in the estimate of effect and is likely to change the estimate.
Very low quality: We are very uncertain about the estimate.

1. Confidence intervals include the possibility of an increase and a decrease in SAEs on regular LABA

2. Single unblinded study

3. Considerable heterogeneity between trial results

Figuras y tablas -
Table 1. Summary of findings ‐ children with a serious adverse event
Table 2. Characteristics of included reviews

Inclusion criteria

Review title

Studies

Participants

Intervention

Comparison

Primary outcome measures

Date of search

No. included studies (all)

No. included studies (children only)

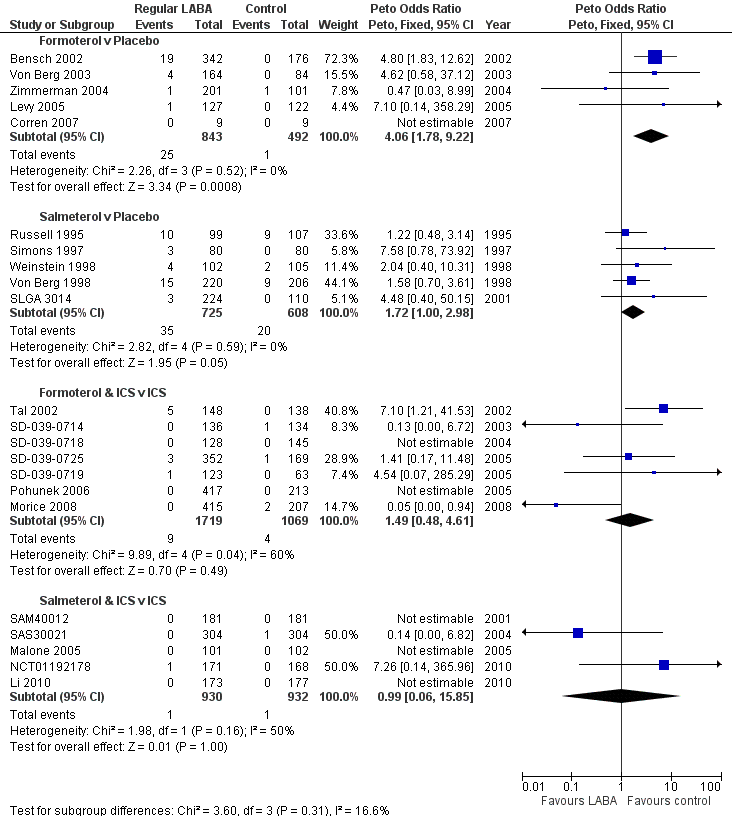
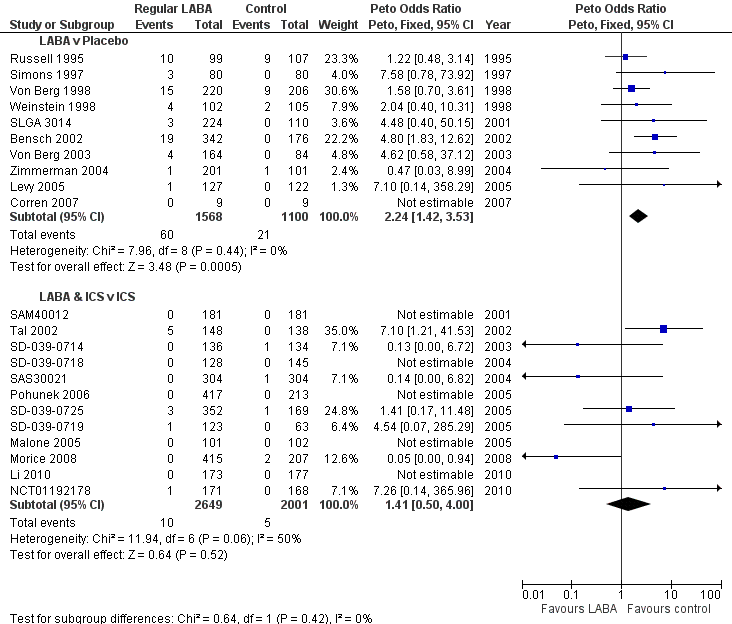
1. Regular treatment with formoterol for chronic asthma: serious adverse events

Cates 2012a

Randomised controlled trials

Diagnosis of asthma; any age group

Inhaled formoterol twice/day; at least 12 weeks duration; any dose; any delivery device

Placebo or short‐acting beta2‐agonists

All‐cause mortality

All‐cause non‐fatal SAEs

January 2012

22

5

2. Regular treatment with salmeterol for chronic asthma: serious adverse events Cates 2008

Randomised controlled trials

Diagnosis of asthma; any age group

Inhaled salmeterol twice/day; at least 12 weeks duration; any dose; any delivery device

Placebo or short‐acting beta2‐agonists

All‐cause mortality

All‐cause non‐fatal SAEs

August 2011

32

5

3. Regular treatment with formoterol and inhaled steroids for chronic asthma: serious adverse events Cates 2009b

Randomised controlled trials

Diagnosis of asthma; any age group

Inhaled corticosteroids and formoterol once or twice/day; at least least 12 weeks duration; any dose; any single or separate device

Same dose and type of inhaled corticosteroids

All‐cause mortality

All‐cause non‐fatal SAEs

October 2008

21

7

4. Regular treatment with salmeterol and inhaled steroids for chronic asthma: serious adverse events Cates 2009a

Randomised controlled trials

Diagnosis of asthma; any age group

Inhaled corticosteroids and salmeterol once or twice/day; at least least 12 weeks duration; any dose; any single or separate device

Same dose and type of inhaled corticosteroids

All‐cause mortality

All‐cause non‐fatal SAEs

October 2008

33

3 (2 additional studies identified by updated search)

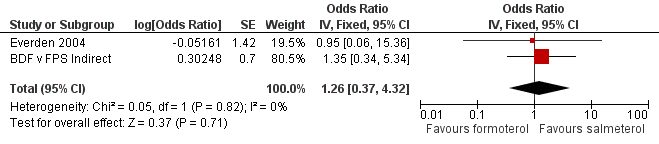
5. Regular treatment with formoterol versus regular treatment with salmeterol for chronic asthma: serious adverse events Cates 2012b

Randomised controlled trials

Diagnosis of asthma; any age group

Inhaled formoterol; at least 12 weeks duration; not randomised with inhaled corticosteroids

Inhaled salmeterol; at least 12 weeks duration; not randomised with inhaled corticosteroids

All‐cause mortality

All‐cause non‐fatal SAEs

January 2012

4

1

6. Regular treatment with formoterol and an inhaled corticosteroid versus regular treatment with salmeterol and an inhaled corticosteroid for chronic asthma: serious adverse events Cates 2010

Randomised controlled trials

Diagnosis of asthma; any age group

Inhaled formoterol with an inhaled steroid; at least 12 weeks duration; any dose; any single or separate delivery device

Inhaled salmeterol with an inhaled steroid; at least 12 weeks duration; any dose; any single or separate delivery device

All‐cause mortality

All‐cause non‐fatal SAEs

August 2011

7

0

Figuras y tablas -
Table 2. Characteristics of included reviews
Table 3. Regular formoterol v placebo trial details

Duration

(weeks)

% children on ICS background Rx

 Formoterol

48 mcg/day (N)

 Formoterol

24 mcg/day (N)

Formoterol

12 mcg/day (N)

Placebo (N)

Brand

Age Ranges

Bensch 2002

52

69

171

171

176

Foradil

5 to 12

Corren 2007

12

0

9

9

Oxis

6 to 11

Levy 2005

12

72

127

122

Foradil

5 to 13

Von Berg 2003

12

82

83

81

84

Oxis

6 to 17

Zimmerman 2004

12

100

94

105

101

Oxis

6 to 11

Total

mean = 27 weeks

171

475

186

492

All trials were sponsored by AstraZeneca or Novartis, and contributed data on all‐cause mortality and non‐fatal serious adverse events, except Levy 2005 for which mortality data was not available.

Figuras y tablas -
Table 3. Regular formoterol v placebo trial details
Table 4. Regular salmeterol v placebo trial details

Duration

(weeks)

% children on ICS background Rx

Salmeterol 100 mcg/day (N)

Salmeterol 50 mcg/day (N)

Placebo(N)

Age Ranges

Russell 1995

12

100

99

107

4 to 16

Simons 1997

52

0

80

80

6 to 14

SLGA3014

12

50

109

115

110

4 to 11

von Berg 1998

52

52

220

206

5 to 15

Weinstein 1998

12

57

102

105

4 to 11

TOTAL

mean =31 weeks

610

115

608

All trials were sponsored by GSK and contributed data on all‐cause mortality and non‐fatal serious adverse events

Figuras y tablas -
Table 4. Regular salmeterol v placebo trial details
Table 5. Regular formoterol & ICS v ICS trial details

Children and Adolescents

Duration (weeks)

Formoterol and ICS (N)

ICS Alone (N)

Daily Dose Budesonide (mcg )

Daily Dose Formoterol (mcg )

Combined Inhaler

Age Ranges

Morice 2008

12

415

207

200

24

6 to 11

Pohunek 2006

12

417

213

400

24

4 to 11

SD‐039‐0714

12

136

134

400

12

11 to 17

SD‐039‐0718

12

128

145

200

24

6 to 15

SD‐039‐0719

26

123

63

400

24

6 to 11

SD‐039‐0725

12

352

169

200

12 or 24

6 to 15

Tal 2002

12

148

138

400

24

4 to 17

Total

mean = 13 weeks

1,719

1,069

All trials were sponsored by AstraZeneca and contributed data on fatal and non‐fatal serious adverse events

Figuras y tablas -
Table 5. Regular formoterol & ICS v ICS trial details
Table 6. Regular salmeterol & ICS v ICS trial details

Duration (Weeks)

Salmeterol & ICS

ICS alone

Dose of Fluticasone mcg/day

Dose of Salmeterol mcg/day

Combined Inhaler

Age Ranges

Li 2010

12

173

177

200

100

4 to 11

Malone 2005

12

101

102

200

100

4 to 11

NCT01192178

16

171

168

200

100

4 to 11

SAM40012

24

181

181

200

100

4 to 11

SAS30021

12

304

304

100

50

4 to 11

Total

mean = 15 weeks

930

932

All trials were sponsored by GSK and contributed data on all‐cause mortality and non‐fatal serious adverse events

Figuras y tablas -
Table 6. Regular salmeterol & ICS v ICS trial details
Table 7. Regular formoterol versus regular salmeterol

Duration (Weeks)

% children on ICS background Rx

Formoterol 24 mcg/day

Salmeterol 100 mcg/day

Formoterol device

Salemterol device

Sponsors

Age Ranges

Everden 2004

12

100%

80

76

Oxis Turbohaler

Salmeterol Accuhaler

AstraZeneca

6 to 17

Figuras y tablas -
Table 7. Regular formoterol versus regular salmeterol
Table 8. AMSTAR ratings

AMSTAR Criteria

Cates 2008

Cates 2012a

Cates 2009a

Cates 2009b

Cates 2012b

Cates 2010

1. Was an 'a priori' design provided? 

Yes

Yes

Yes

Yes

Yes

Yes

2a. Was there duplicate study selection? (0.5 point)

Yes

Yes

Yes

Yes

Yes

No

2b. Was there duplicate data extraction? (0.5 point)

No

No

Yes

Yes

Yes

No

3. Was a comprehensive literature search performed?

Yes

Yes

Yes

Yes

Yes

Yes

4. Was the status of publication (i.e. grey literature) used as an inclusion criterion?

No

No

No

No

No

No

5. Was a list of studies (included and excluded) provided?

Yes

Yes

Yes

Yes

Yes

Yes

6. Were the characteristics of the included studies provided?

Yes

Yes

Yes

Yes

Yes

Yes

7. Was the scientific quality of the included studies assessed and documented?

Yes

Yes

Yes

Yes

Yes

Yes

8. Was the scientific quality of the included studies used appropriately in formulating conclusions?

Yes

Yes

Yes

Yes

Yes

Yes

9. Were the methods used to combine the findings of studies appropriate?

Yes

Yes

Yes

Yes

Yes

Yes

10. Was the likelihood of publication bias assessed?

Yes

Yes

Yes

Yes

Not applicable

Not applicable

11. Was the conflict of interest stated?

Yes

Yes

Yes

Yes

Yes

Yes

Total criteria met:

10.5

10.5

11

11

10

9


(item 4 is met with the assessment 'NO', all others 'YES')

Note: we felt that item 2 was 2 separate questions, so we split it into two parts and awarded half a point for each. This differs from the published version of the tool.

Figuras y tablas -
Table 8. AMSTAR ratings
Table 9. Risks of Bias for the included trials in each Cochrane review

Cochrane review

trial ID

sequence generation

allocation concealment

blinding

incomplete outcome data

selective reporting

"Regular tretatment with formoterol for chronic asthma: SAE" Cates 2012a

Bensh 2002

unclear

unclear

low

low

low

Levy 2005

unclear

unclear

low

low

unclear1

von Berg 2003

low

unclear

low

low

low

Zimmenman 2004

unclear

unclear

low

unclear

low

Corren 2002

low

unclear

low

unclear

low

"regular treatment with salmeterol for chronic asthma: SAE" Cates 2008

Lenny 1995a

n/a

unclear

low

n/a

low

Lenny 1995b

n/a

unclear

low

n/a

low

Russel 1995

n/a

unclear

low

n/a

low

Simons 1997

n/a

unclear

low

n/a

low

SLGA 3014

n/a

unclear

low

n/a

low

von Berg 1998

n/a

unclear

low

n/a

low

Weinstein 1998

n/a

unclear

low

n/a

low

"Regular treatment with formoterol and ICS for chronic asthma: SAE" Cates 2009b

Morice 2008

low

unclear

low

low

low

Pohunek 2006

unclear

unclear

low

low

low

SD‐039‐0714

unclear

unclear

low

low

low

SD‐039‐0718

low

unclear

low

low

low

SD‐039‐0719

unclear

unclear

high

low

low

SD‐039‐0725

unclear

unclear

low

low

low

Tal 2002

low

unclear

low

low

low


"Regular treatment with salmeterol and ICS for chronic asthma: SAE" Cates 2009a

Li 2010

unclear

unclear

low

low

low

Malone 2005

unclear

unclear

low

low

low

NCT01192178

unclear

unclear

low

low

low

SAM40012

unclear

unclear

low

low

low

SAS30021

unclear

unclear

low

low

low

"Regular treatment with formoterol versus regular treatment with satmeterol for chronic asthma: SAE" Cates 2012b

Everden 2004

low

unclear

high

low

low

1. No mortality data was available from this trial

Figuras y tablas -
Table 9. Risks of Bias for the included trials in each Cochrane review
Table 10. Risk differences for children with SAE of any cause

Children with an all‐cause SAE (pooled risk differences, M‐H Random)

Formoterol monotherapy

Placebo

Risk Difference (95% CI)

Heterogeneity (I‐squared)

Children with SAE

Total

Children with SAE

Total

34

843

6

492

0.0195 (‐0.0034, 0.0425)

55%

Salmeterol monotherapy

Placebo

Risk Difference (95% CI)

Heterogeneity (I‐squared)

Children with SAE

Total

Children with SAE

Total

46

725

34

608

0.0225 (0.0023, 0.0426)

0%

Formoterol combination therapy

ICS

Risk Difference (95% CI)

Heterogeneity (I‐squared)

Children with SAE

Total

Children with SAE

Total

25

1719

9

1069

0.0034 (‐0.0062, 0.0131)

34%

Salmeterol combination therapy

ICS

Risk Difference (95% CI)

Heterogeneity (I‐squared)

Children with SAE

Total

Children with SAE

Total

6

930

5

932

0.0008 (‐0.0067, 0.0082)

0%

Figuras y tablas -
Table 10. Risk differences for children with SAE of any cause
Table 11. Mean event rates in control arms of included trials (SAE of any cause)

 Comparison

Children with an event (n)

Total number of children (N)

SAE per 10,000 children (95% CI)

Mean duration of trials (weeks)

SAE per 10,000 children per week (95% CI)

Formoterol v Placebo

6

492

122 (56 to 263)

27

5 (2 to 10)

Salmeterol v Placebo

34

608

559 (403 to 771)

31

18 (13 to 25)

Formoterol & ICS v ICS

9

1069

84 (44 to 159)

13

6 (3 to 12)

Salmeterol & ICS v ICS

5

932

54 (23 to 125)

15

4 (2 to 8)

Figuras y tablas -
Table 11. Mean event rates in control arms of included trials (SAE of any cause)
Table 12. Monotherapy versus combination therapy risk differences for children with SAE of any cause

Children with an all‐cause SAE (pooled risk differences, M‐H Random)

LABA monotherapy

Placebo

Risk Difference (95% CI)

Heterogeneity (I‐squared)

Children with SAE

Total

Children with SAE

Total

80

1568

40

1100

0.0191 (0.0061, 0.0321)

15%

LABA combination therapy

ICS

Risk Difference (95% CI)

Heterogeneity (I‐squared)

Children with SAE

Total

Children with SAE

Total

31

2649

14

2001

0.0017 (‐0.0037, 0.0070)

2%

Figuras y tablas -
Table 12. Monotherapy versus combination therapy risk differences for children with SAE of any cause
Table 13. Risk differences for children with SAE related to asthma

Children with an asthma related SAE (pooled risk differences, M‐H Random)

Formoterol monotherapy

Placebo

Risk Difference (95% CI)

Heterogeneity (I‐squared)

Children with SAE

Total

Children with SAE

Total

25

843

1

492

0.0196 (‐0.0071, 0.0463)

75%

Salmeterol monotherapy

Placebo

Risk Difference (95% CI)

Heterogeneity (I‐squared)

Children with SAE

Total

Children with SAE

Total

35

725

20

608

0.0185 (0.0027, 0.0343)

0%

Formoterol combination therapy

ICS

Risk Difference (95% CI)

Heterogeneity (I‐squared)

Children with SAE

Total

Children with SAE

Total

9

1719

4

1069

0.0000 (‐0.0064, 0.0064)

19%

Salmeterol combination therapy

ICS

Risk Difference (95% CI)

Heterogeneity (I‐squared)

Children with SAE

Total

Children with SAE

Total

1

930

1

932

‐0.0005 (‐0.0058, 0.0048)

0%

Figuras y tablas -
Table 13. Risk differences for children with SAE related to asthma
Table 14. Monotherapy versus combination therapy risk differences for children with SAE related to asthma

Children with an asthma related SAE (pooled risk differences, M‐H Random)

LABA monotherapy

Placebo

Risk Difference (95% CI)

Heterogeneity (I‐squared)

Children with SAE

Total

Children with SAE

Total

60

1568

21

1100

0.0197 (0.0055, 0.0339)

44%

LABA combination therapy

ICS

Risk Difference (95% CI)

Heterogeneity (I‐squared)

Children with SAE

Total

Children with SAE

Total

10

2649

5

2001

‐0.0003 (‐0.0040, 0.0034)

0%

Figuras y tablas -
Table 14. Monotherapy versus combination therapy risk differences for children with SAE related to asthma
Table 15. Mean event rates in control arms of included trials (SAE related to asthma)

 Comparison

Children with an event (n)

Total number of children (N)

SAE per 10,000 children (95% CI)

Mean duration of trials (weeks)

SAE per 10,000 children per week (95% CI)

Formoterol v Placebo

1

492

20 (4 to 114)

27

1 (0 to 4)

Salmeterol v Placebo

20

608

329 (214 to 503)

31

11 (7 to 16)

Formoterol & ICS v ICS

4

1069

37 (15 to 96)

13

3 (1 to 7)

Salmeterol & ICS v ICS

1

932

11 (2 to 61)

15

1 (0 to 4)

Figuras y tablas -
Table 15. Mean event rates in control arms of included trials (SAE related to asthma)