Incentivos para aumentar o uso pré‐natal pelas mulheres, com a finalidade de melhorar os resultados maternos e neonatais
Referencias
References to studies included in this review
References to studies excluded from this review
Additional references
References to other published versions of this review
Characteristics of studies
Characteristics of included studies [ordered by study ID]
Ir a:
| Methods | Cluster‐randomized controlled trial. The duration of this study was six years. The intervention "Opportunidades" included a total of 506 low‐income communities in rural Mexico, 320 randomized to "early implementation" in 1998 and 186 randomized to "late implementation" in 2000. Reports randomly selected communities within both "early" and "late" intervention groups. Within each selected community, eligible households were randomly selected to participate in a retrospective field survey. Comparison was to pregnancies that occurred within "early" and "late" implementation periods. | |
| Participants | Low‐income women age 15‐49 living in an intervention or control community who had a live singleton birth from 1997‐2003. Each report surveyed a different number of pregnant women. It was not clear whether there was overlap within these surveys among different reports. Summary for each of the reports is as follows. ‐ Barber 2008: 892 pregnancies. 712 beneficiary and 180 non‐beneficiary. ‐ Barber 2009: 979 pregnancies. 776 beneficiary and 203 non‐beneficiary. ‐ Barber, Gertler 2009: 840 pregnancies. 666 beneficiary and 174 non‐beneficiary. ‐ Fernald 2008: 3780 pregnancies. 2273 early beneficiary and 1507 late beneficiary. ‐ Fernald 2009: 1793 pregnancies. 1093 early beneficiary and 700 late beneficiary. ‐ Leroy 2008: 432 pregnancies. 344 beneficiary and 88 non‐beneficiary. ‐ Rivera 2004: 650 pregnancies. 373 early beneficiary and 277 late beneficiary. | |
| Interventions | Intervention households received conditional cash transfer of ˜$15/month dependent on obtaining regular preventive health, attending a minimum of 5 prenatal visits and participating in monthly health education talks. Participants were eligible to receive education bonuses for ensuring regular school attendance for school‐aged children. Households could receive benefits for up to 3 years. | |
| Outcomes | Cesarean rate, delivery location. Quality of prenatal care, measured by number of "procedures", including defined measures within history‐taking and diagnostics, physical examination and prevention and case management. Birthweight, child growth, hemoglobin, cognitive development, language and behavioral problems. | |
| Notes | This study (Opportunidades) was evaluated in 7 publications included within this review. | |
| Risk of bias | ||
| Bias | Authors' judgement | Support for judgement |
| Random sequence generation (selection bias) | Low risk | Cluster‐randomization. Assignment was performed at the community level using STATA randomization commands. Low‐income households within that community were then identified using census data and offered enrollment; 97% of eligible households enrolled in the program. Less than 1% of enrolled households failed to receive benefits due to non‐compliance. Retrospective field surveys identified participants via a 2‐stage stratified sampling design using computer‐generated randomization sequences. |
| Allocation concealment (selection bias) | Low risk | Randomization was performed centrally and via computer‐generated sequence. Communities were not aware that they would be participating in the study and timing of program roll‐out was not made public. |
| Blinding of participants and personnel (performance bias) | High risk | Participants were not blinded as they knew whether they received incentives. It was unclear whether clinicians knew about participation status. |
| Blinding of outcome assessment (detection bias) | High risk | Not described. |
| Incomplete outcome data (attrition bias) | Low risk | Intention‐to‐treat analysis. |
| Selective reporting (reporting bias) | Low risk | Reporting consistent with protocol. |
| Other bias | Low risk | Mexican government implemented this intervention and commissioned an independent evaluation of program impact. This study examining that data was funded by an NIH grant. |
| Methods | Randomized controlled trial, antenatal clinic in Ohio (United States), all Medicaid patients, 205 participants. | |
| Participants | Low‐income women, prenatal care < 32 weeks and delivered at a tertiary care hospital. | |
| Interventions | 2 intervention groups. 1 received $5 store gift card for each appointment kept (n = 51). The second received $5 store gift card for each appointment kept plus a chance at a $100 raffle (n = 53). Control group received routine prenatal care without incentive, and was interviewed after the delivery (n = 101). | |
| Outcomes | Attendance of prenatal and postpartum visits, gestational age, birthweight. | |
| Notes | This study did not contribute data to the review because primary data were not available. | |
| Risk of bias | ||
| Bias | Authors' judgement | Support for judgement |
| Random sequence generation (selection bias) | Unclear risk | "Random numbers were used." Not otherwise described. |
| Allocation concealment (selection bias) | Unclear risk | "Random assignment was used to eliminate bias." Not otherwise described. |
| Blinding of participants and personnel (performance bias) | High risk | Participants were aware of allocation status. Clinicians were blinded. |
| Blinding of outcome assessment (detection bias) | High risk | Not described. |
| Incomplete outcome data (attrition bias) | Low risk | Intention‐to‐treat analysis. |
| Selective reporting (reporting bias) | High risk | The 2 incentive groups were combined for analysis after comparison revealed no significant differences in outcomes. Difficult to assess without primary data. |
| Other bias | Low risk | No other sources of bias detected. |
| Methods | Randomized controlled trial. 24 months. 5 family planning and women's health clinics in northern California (United States), 104 participants. | |
| Participants | Pregnant women who stated intent to obtain prenatal care at participating clinics. | |
| Interventions | 2 intervention groups: 1 received taxicab voucher to/from first prenatal visit; the second received baby blanket voucher to be redeemed at first prenatal visit. Control group received standard prenatal care. | |
| Outcomes | Compliance with attending first prenatal visit. | |
| Notes | The blanket intervention group had poor compliance with primary outcome and was combined with the control group for stratified analysis in the original study, although data for the primary outcome were reported accurately. Given that the 2 interventions were similar in terms of potential value to patients, we felt it was more accurate to combine data from the 2 intervention groups for the purposes of this review. | |
| Risk of bias | ||
| Bias | Authors' judgement | Support for judgement |
| Random sequence generation (selection bias) | Low risk | Blocked by clinic. Within each clinic, assignment was by computer random number table. |
| Allocation concealment (selection bias) | Low risk | Sequentially numbered, opaque, sealed envelopes. |
| Blinding of participants and personnel (performance bias) | High risk | Participants were aware of their voucher offer, but it was not clear whether they were aware of other assignment groups voucher offer. Clinician blinding was not described. |
| Blinding of outcome assessment (detection bias) | Low risk | Outcome assessor was blinded to group assignment. |
| Incomplete outcome data (attrition bias) | Low risk | Intention‐to‐treat. Loss to follow‐up was a study outcome. |
| Selective reporting (reporting bias) | High risk | Reporting differed from protocol in that 1 of the intervention groups had poor compliance with primary outcome and was combined with the control group for stratified analysis. The original data for all 3 groups were reported accurately. |
| Other bias | Low risk | No other sources of bias detected. |
| Methods | Cluster‐randomized controlled trial. 24 months. The intervention "Programa de Asginaction Familiar" identified 70 communities with highest rates of malnutrition in rural Honduras, which were randomized into 4 groups: 20 to control, 20 to household‐level package, 10 to service‐level package, and 20 to dual‐package. A randomly selected number of households within each group were administered both a pre‐ and post‐intervention survey. Comparison was to pregnancies that occurred within household‐level package and control groups. | |
| Participants | Within household‐level and dual‐level groups, the eligible households were those which had a pregnant woman, child under age 3 or child between age 6‐12 at time of 2000 census. 5545 households participated in the pre‐intervention survey, including 1605 in the control group, 1574 in the household‐level package, 786 in the service‐level package, and 1580 in the dual‐package. 5289 of these households participated in the post‐intervention survey, including 1524 in the control group, 1512 in the household‐level package, 744 in the service‐level package, and 1509 in the dual‐package. | |
| Interventions | Within household‐level package communities, eligible households could receive vouchers equal to cash for each pregnant woman, child under age 3 or child between age 6‐12 who was enrolled in school, dependent on regular prenatal and well‐child preventive care as well as regular school attendance. Service‐level package communities received quality improvement teams aimed at strengthening health centers and community‐based nutrition programs. Dual‐package communities received both household‐level and service‐level interventions. | |
| Outcomes | Primary outcomes included adequate use of prenatal care (defined as at least 5 visits), postpartum checkup within 10 days of delivery and children < 3 years taken to health center within past 30 days. Secondary outcomes included immunization rates and growth monitoring. | |
| Notes | Service‐level package was only fully implemented in 17% of selected communities due to difficulty in transferring specified resources from the government to the community‐based teams responsible for implementation. Teams were able to implement community‐based nutrition programs, but most were not able to implement the individual‐based nutrition counseling as intended. | |
| Risk of bias | ||
| Bias | Authors' judgement | Support for judgement |
| Random sequence generation (selection bias) | Low risk | Cluster‐randomization by community. Communities were stratified by degree of malnutrition. Communities within each stratum were randomized to intervention group by a child blindly drawing colored balls from a box without replacement. |
| Allocation concealment (selection bias) | Low risk | Community was aware of intervention. However, households could not become eligible for vouchers by moving into household‐level community after time of randomization. |
| Blinding of participants and personnel (performance bias) | High risk | No attempt to conceal intervention after time of randomization. |
| Blinding of outcome assessment (detection bias) | High risk | Baseline and post‐intervention surveys administered by independent data collection company which was aware of community intervention grouping. |
| Incomplete outcome data (attrition bias) | Low risk | Intention‐to‐treat. |
| Selective reporting (reporting bias) | Low risk | Reporting consistent with protocol. |
| Other bias | Low risk | Honduran government commissioned an independent evaluation of program impact, which was funded with the assistance of a loan from the Inter‐American Development Bank. |
| Methods | Randomized controlled trial, 1 prenatal clinic Colorado (United States), 240 participants. | |
| Participants | 12‐19 years, "poor", receiving prenatal care through the Colorado Adolescent Maternity Program in Denver. | |
| Interventions | Both groups received standard prenatal care throughout pregnancy with randomization at 34 weeks. Intervention group would receive a Gerry Cuddler if they returned for postpartum visit within 12 weeks of delivery. Control group was instructed to return for postpartum visit. | |
| Outcomes | Attendance of postpartum visit. | |
| Notes | ||
| Risk of bias | ||
| Bias | Authors' judgement | Support for judgement |
| Random sequence generation (selection bias) | Unclear risk | Not described. |
| Allocation concealment (selection bias) | Unclear risk | Consecutive patients randomized by receptionist blind distribution of group assignment on a sheet of paper. |
| Blinding of participants and personnel (performance bias) | High risk | Participants were aware of status. Clinician blinding not described. |
| Blinding of outcome assessment (detection bias) | High risk | Not described. |
| Incomplete outcome data (attrition bias) | Low risk | Intent‐to‐treat analysis. |
| Selective reporting (reporting bias) | Low risk | Reporting consistent with protocol. |
| Other bias | Low risk | No other sources of bias detected. |
Characteristics of excluded studies [ordered by study ID]
Ir a:
| Study | Reason for exclusion |
| Incentive (fruit juice voucher) was not explicitly linked to initiation or frequency of prenatal care, but rather to fruit juice consumption. | |
| Commentary. No data analysis. | |
| Incentive (cash or voucher) was not explicitly linked to initiation or frequency of prenatal care, but rather to response rate for a postpartum risk assessment survey. | |
| Intervention studied was augmented care, not incentives explicitly linked to initiation or frequency of prenatal care. | |
| Incentive (voucher) was not explicitly linked to initiation or frequency of prenatal care, but rather to response rate for a postpartum risk assessment survey. | |
| Intervention studied was augmented care, not incentives explicitly linked to initiation or frequency of prenatal care. |
Data and analyses
| Outcome or subgroup title | No. of studies | No. of participants | Statistical method | Effect size |
| 1 Adequacy of prenatal care Show forest plot | 1 | 892 | Mean Difference (IV, Fixed, 95% CI) | 5.84 [1.88, 9.80] |
| Analysis 1.1 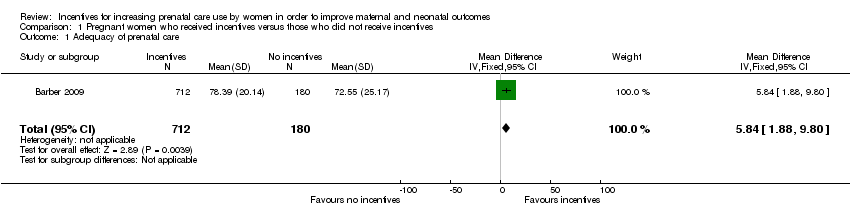 Comparison 1 Pregnant women who received incentives versus those who did not receive incentives, Outcome 1 Adequacy of prenatal care. | ||||
| 2 Frequency of prenatal care Show forest plot | 1 | 606 | Risk Ratio (M‐H, Fixed, 95% CI) | 1.18 [1.01, 1.38] |
| Analysis 1.2  Comparison 1 Pregnant women who received incentives versus those who did not receive incentives, Outcome 2 Frequency of prenatal care. | ||||
| 3 Initiation of prenatal care Show forest plot | 1 | 104 | Risk Ratio (M‐H, Fixed, 95% CI) | 1.04 [0.78, 1.38] |
| Analysis 1.3  Comparison 1 Pregnant women who received incentives versus those who did not receive incentives, Outcome 3 Initiation of prenatal care. | ||||
| 4 Return for postpartum care Show forest plot | 2 | 833 | Risk Ratio (M‐H, Random, 95% CI) | 0.75 [0.21, 2.64] |
| Analysis 1.4  Comparison 1 Pregnant women who received incentives versus those who did not receive incentives, Outcome 4 Return for postpartum care. | ||||
| 4.1 Cash incentives | 1 | 593 | Risk Ratio (M‐H, Random, 95% CI) | 0.43 [0.30, 0.62] |
| 4.2 Non‐cash incentives | 1 | 240 | Risk Ratio (M‐H, Random, 95% CI) | 1.26 [1.09, 1.47] |
| 5 Cesarean delivery rate Show forest plot | 1 | 979 | Risk Ratio (M‐H, Fixed, 95% CI) | 1.97 [1.18, 3.30] |
| Analysis 1.5  Comparison 1 Pregnant women who received incentives versus those who did not receive incentives, Outcome 5 Cesarean delivery rate. | ||||

Study flow diagram.

'Risk of bias' summary: review authors' judgements about each risk of bias item for each included study.

Comparison 1 Pregnant women who received incentives versus those who did not receive incentives, Outcome 1 Adequacy of prenatal care.

Comparison 1 Pregnant women who received incentives versus those who did not receive incentives, Outcome 2 Frequency of prenatal care.

Comparison 1 Pregnant women who received incentives versus those who did not receive incentives, Outcome 3 Initiation of prenatal care.
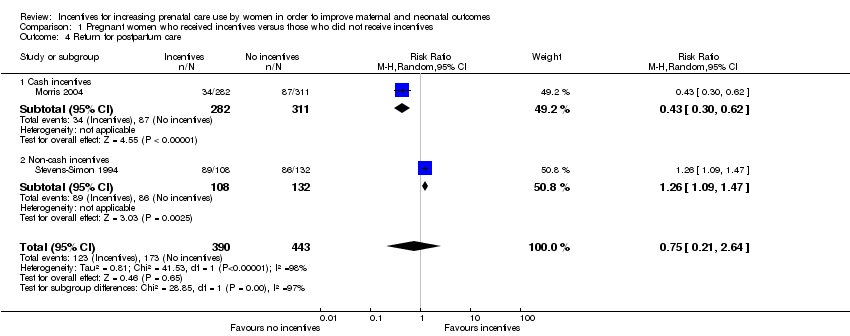
Comparison 1 Pregnant women who received incentives versus those who did not receive incentives, Outcome 4 Return for postpartum care.

Comparison 1 Pregnant women who received incentives versus those who did not receive incentives, Outcome 5 Cesarean delivery rate.
| Outcome or subgroup title | No. of studies | No. of participants | Statistical method | Effect size |
| 1 Adequacy of prenatal care Show forest plot | 1 | 892 | Mean Difference (IV, Fixed, 95% CI) | 5.84 [1.88, 9.80] |
| 2 Frequency of prenatal care Show forest plot | 1 | 606 | Risk Ratio (M‐H, Fixed, 95% CI) | 1.18 [1.01, 1.38] |
| 3 Initiation of prenatal care Show forest plot | 1 | 104 | Risk Ratio (M‐H, Fixed, 95% CI) | 1.04 [0.78, 1.38] |
| 4 Return for postpartum care Show forest plot | 2 | 833 | Risk Ratio (M‐H, Random, 95% CI) | 0.75 [0.21, 2.64] |
| 4.1 Cash incentives | 1 | 593 | Risk Ratio (M‐H, Random, 95% CI) | 0.43 [0.30, 0.62] |
| 4.2 Non‐cash incentives | 1 | 240 | Risk Ratio (M‐H, Random, 95% CI) | 1.26 [1.09, 1.47] |
| 5 Cesarean delivery rate Show forest plot | 1 | 979 | Risk Ratio (M‐H, Fixed, 95% CI) | 1.97 [1.18, 3.30] |