Modulator reseptor progesterone untuk endometriosis
Abstract
Background
Endometriosis is defined as the presence of endometrial tissue (glands and stroma) outside the uterine cavity. This condition is oestrogen‐dependent and thus is seen primarily during the reproductive years. Owing to their antiproliferative effects in the endometrium, progesterone receptor modulators (PRMs) have been advocated for treatment of endometriosis.
Objectives
To assess the effectiveness and safety of PRMs primarily in terms of pain relief as compared with other treatments or placebo or no treatment in women of reproductive age with endometriosis.
Search methods
We searched the following electronic databases, trial registers, and websites: the Cochrane Gynaecology and Fertility Group (CGFG) Specialised Register of Controlled Trials, the Central Register of Studies Online (CRSO), MEDLINE, Embase, PsycINFO, clinicaltrials.gov, and the World Health Organization (WHO) platform, from inception to 28 November 2016. We handsearched reference lists of articles retrieved by the search.
Selection criteria
We included randomised controlled trials (RCTs) published in all languages that examined effects of PRMs for treatment of symptomatic endometriosis.
Data collection and analysis
We used standard methodological procedures as expected by the Cochrane Collaboration. Primary outcomes included measures of pain and side effects.
Main results
We included 10 randomised controlled trials (RCTs) with 960 women. Two RCTs compared mifepristone versus placebo or versus a different dose of mifepristone, one RCT compared asoprisnil versus placebo, one compared ulipristal versus leuprolide acetate, and four compared gestrinone versus danazol, gonadotropin‐releasing hormone (GnRH) analogues, or a different dose of gestrinone. The quality of evidence ranged from high to very low. The main limitations were serious risk of bias (associated with poor reporting of methods and high or unclear rates of attrition in most studies), very serious imprecision (associated with low event rates and wide confidence intervals), and indirectness (outcome assessed in a select subgroup of participants).
Mifepristone versus placebo
One study made this comparison and reported rates of painful symptoms among women who reported symptoms at baseline.
At three months, the mifepristone group had lower rates of dysmenorrhoea (odds ratio (OR) 0.08, 95% confidence interval (CI) 0.04 to 0.17; one RCT, n =352; moderate‐quality evidence), suggesting that if 40% of women taking placebo experience dysmenorrhoea, then between 3% and 10% of women taking mifepristone will do so. The mifepristone group also had lower rates of dyspareunia (OR 0.23, 95% CI 0.11 to 0.51; one RCT, n = 223; low‐quality evidence). However, the mifepristone group had higher rates of side effects: Nearly 90% had amenorrhoea and 24% had hot flushes, although the placebo group reported only one event of each (1%) (high‐quality evidence). Evidence was insufficient to show differences in rates of nausea, vomiting, or fatigue, if present.
Mifepristone dose comparisons
Two studies compared doses of mifepristone and found insufficient evidence to show differences between different doses in terms of effectiveness or safety, if present. However, subgroup analysis of comparisons between mifepristone and placebo suggest that the 2.5 mg dose may be less effective than 5 mg or 10 mg for treating dysmenorrhoea or dyspareunia.
Gestrinone comparisons
Ons study compared gestrinone with danazol, and another study compared gestrinone with leuprolin.
Evidence was insufficient to show differences, if present, between gestrinone and danazol in rate of pain relief (those reporting no or mild pelvic pain) (OR 0.71, 95% CI 0.33 to 1.56; two RCTs, n = 230; very low‐quality evidence), dysmenorrhoea (OR 0.72, 95% CI 0.39 to 1.33; two RCTs, n = 214; very low‐quality evidence), or dyspareunia (OR 0.83, 95% CI 0.37 to 1.86; two RCTs, n = 222; very low‐quality evidence). The gestrinone group had a higher rate of hirsutism (OR 2.63, 95% CI 1.60 to 4.32; two RCTs, n = 302; very low‐quality evidence) and a lower rate of decreased breast size (OR 0.62, 95% CI 0.38 to 0.98; two RCTs, n = 302; low‐quality evidence). Evidence was insufficient to show differences between groups, if present, in rate of hot flushes (OR 0.79, 95% CI 0.50 to 1.26; two RCTs, n = 302; very low‐quality evidence) or acne (OR 1.45, 95% CI 0.90 to 2.33; two RCTs, n = 302; low‐quality evidence).
When researchers compared gestrinone versus leuprolin through measurements on the 1 to 3 verbal rating scale (lower score denotes benefit), the mean dysmenorrhoea score was higher in the gestrinone group (MD 0.35 points, 95% CI 0.12 to 0.58; one RCT, n = 55; low‐quality evidence), but the mean dyspareunia score was lower in this group (MD 0.33 points, 95% CI 0.62 to 0.04; low‐quality evidence). The gestrinone group had lower rates of amenorrhoea (OR 0.04, 95% CI 0.01 to 0.38; one RCT, n = 49; low‐quality evidence) and hot flushes (OR 0.20, 95% CI 0.06 to 0.63; one study, n = 55; low quality evidence) but higher rates of spotting or bleeding (OR 22.92, 95% CI 2.64 to 198.66; one RCT, n = 49; low‐quality evidence).
Evidence was insufficient to show differences in effectiveness or safety between different doses of gestrinone, if present.
Asoprisnil versus placebo
One study (n = 130) made this comparison but did not report data suitable for analysis.
Ulipristal versus leuprolide acetate
One study (n = 38) made this comparison but did not report data suitable for analysis.
Authors' conclusions
Among women with endometriosis, moderate‐quality evidence shows that mifepristone relieves dysmenorrhoea, and low‐quality evidence suggests that this agent relieves dyspareunia, although amenorrhoea and hot flushes are common side effects. Data on dosage were inconclusive, although they suggest that the 2.5 mg dose of mifepristone may be less effective than higher doses. We found insufficient evidence to permit firm conclusions about the safety and effectiveness of other progesterone receptor modulators.
PICO
Ringkasan bahasa mudah
Modulator reseptor progesterone untuk endometriosis
Soalan ulasan
Penyelidik dalam Cochrane Collaboration mengkaji bukti‐bukti tentang keberkesanan dan keselamatan modulator reseptor progesterone untuk wanita dengan endometriosis.
Latar belakang
Endometriosis adalah sejenis penyakit tisu endometrial (kelenjar dan stroma) di luar rongga rahim. Ia bergantung kepada oestrogen dan sekali gus dapat dilihat terutamanya pada tahun‐tahun reproduktif. Ia boleh menyebabkan kesakitan di bahagian abdomen, umumnya semasa haid atau berkaitan dengan hubungan seks. Modulator reseptor progesterone telah dicadangkan sebagai salah satu rawatan hormon untuk endometriosis.
Ciri‐ciri kajian
Kami mendapati terdapat 10 ujikaji rawak terkawal termasuk 960 wanita; bukti adalah sehingga November 2016.
Keputusan utama
Tiga kajian menilai mifepristone. Kualiti bukti sederhana menunjukkan bahawa mifepristone melegakan dismenorea (haid yang menyakitkan) di kalangan wanita dengan endometriosis. Bukti mencadangkan bahawa jika 40% daripada wanita yang mengambil plasebo mengalami dismenorea, maka antara 3% hingga 10% daripada wanita yang mengambil mifepristone akan berbuat demikian. Kualiti bukti yang rendah mencadangkan bahawa mifepristone juga melegakan disparunea (sakit semasa hubungan seks). Walau bagaimanapun, amenorea (ketiadaan haid) dan panas badan adalah kesan sampingan biasa mifepristone. Hampir 90% golongan mifepristone mempunyai amenorea, dan 24% mempunyai rasa Panas, walaupun penyelidik melaporkan kejadian hanya satu setiap (1%) kalangan wanita yang mengambil plasebo. Bukti tidak mencukupi untuk menunjukkan perbezaan dalam kadar rasa loya, muntah atau keletihan, jika ada.
Perbandingan dos mifepristone yang berbeza tidak menunjukkan hasil yang pasti, walaupun bukti mencadangkan bahawa dos 2.5 mg mungkin kurang berkesan berbanding dos yang lebih tinggi.
Kajian lain menilai modulator reseptor progesterone lain. Penyelidik membandingkan gestrinone dengan rawatan lain (danazol atau leuprolin), ulipristal dengan leuprolide acetate, dan asoprisnil dengan plasebo. Namun, bukti adalah tidak mencukupi bagi membolehkan kesimpulan yang kukuh mengenai keselamatan dan keberkesanan intervensi ini.
Kualiti bukti
Kualiti bukti adalah di antara sederhana ke rendah. Kelemahan utama adalah risiko kecenderungan yang serius (berkaitan dengan laporan kaedah yang teruk dan kadar keciciran dalam yang paling tinggi atau tidak jelas), ketidaktepatan yang sangat serius (berkaitan dengan kadar rendah acara dan lebar selang keyakinan) dan tidak langsung (hasil dinilai di dalam subkumpulan peserta).
Authors' conclusions
Summary of findings
| Mifepristone versus placebo for endometriosis | ||||||
| Patient or population: women with symptomatic endometriosis Settings: gynaecology clinic Intervention: progesterone receptor modulator (mifepristone) Comparison: placebo | ||||||
| Outcomes | Illustrative comparative risks* (95% CI) | Relative effect | No. of participants | Quality of the evidence | Comments | |
| Assumed risk | Corresponding risk | |||||
| Placebo | Mifepristone | |||||
| Prevalence of dysmenorrhoea Follow‐up: 3 months | 402 per 1000 | 51 per 1000 | OR 0.08 (0.04 to 0.17) | 352 | ⊕⊕⊕⊝ | |
| Prevalence of dyspareunia Follow‐up: 3 months | 288 per 1000 | 85 per 1000 | OR 0.23 (0.10 to 0.51) | 223 | ⊕⊕⊝⊝ | |
| Side effects: amenorrhoea Follow‐up: 3 months | 11 per 1000 | 884 per 1000 | OR 686.16 (92.29 to 5101.33) | 360 | ⊕⊕⊕⊝ High | 239/270 events in the mifepristone group vs 1/90 in the placebo group |
| Side effects: hot flushes Follow‐up: 3 months | 11 per 1000 | 243 per 1000 | OR 28.79 (3.93 to 210.73) | 360 | ⊕⊕⊕⊝ High | 66/270 events in the mifepristone group vs 1/90 in the placebo group |
| *The basis for the assumed risk is the mean control group risk across studies. The corresponding risk (and its 95% confidence interval) is based on the assumed risk in the comparison group and the relative effect of the intervention (and its 95% CI) | ||||||
| GRADE Working Group grades of evidence | ||||||
| aDowngraded one level for serious imprecision (wide confidence intervals and/or very few events) bOutcome applied only to women with dysmenorrhoea at baseline, but this was 352/360 women randomised, so not downgraded for indirectness cOutcome applied only to women with dyspareunia at baseline, which was 223/360 women randomised. Downgraded one level for serious indirectness | ||||||
| Gestrinone versus danazol for endometriosis | ||||||
| Patient or population: women with symptomatic endometriosis Settings: gynaecology clinic Intervention: progesterone receptor modulator (gestrinone) Comparison: danazol | ||||||
| Outcomes | Illustrative comparative risks* (95% CI) | Relative effect | No. of participants | Quality of the evidence | Comments | |
| Assumed risk | Corresponding risk | |||||
| Danazol | Gestrinone | |||||
| Pelvic pain: none or mild | 890 per 1000 | 852 per 1000 (727 to 927) | OR 0.71 (0.33 to 1.56) | 230 (2) | ⊕⊕⊝⊝ | |
| Dysmenorrhoea: none or mild Follow‐up: 6 months | 721 per 1000 | 650 per 1000 | OR 0.72 (0.39 to 1.33) | 214 | ⊕⊝⊝⊝ | |
| Dyspareunia: none or mild Follow‐up: 6 months | 889 per 1000 | 869 per 1000 | OR 0.83 (0.37 to 1.86) | 222 | ⊕⊝⊝⊝ | |
| Side effects: hirsutism Follow‐up: 6 months | 248 per 1000 | 464 per 1000 | OR 2.63 (1.60 to 4.32) | 302 | ⊕⊝⊝⊝ | I2 = 68% |
| Decreased breast size Follow‐up: 6 months | 477 per 1000 | 360 per 1000 | OR 0.62 (0.38 to 0.98) | 302 | ⊕⊕⊝⊝ | |
| Side effects: hot flushes Follow‐up: 6 months | 425 per 1000 | 368 per 1000 (270 to 482) | OR 0.79 (0.50 to 1.26) | 302 (2 studies) | ⊕⊝⊝⊝ | I2 = 72% |
| Side effects: acne Follow‐up: 6 months | 556 per 1000 | 644 per 1000 (529 to 744) | OR 1.45 (0.90 to 2.33) | 302 (2 studies) | ⊕⊕⊝⊝ | |
| *The basis for the assumed risk is the mean control group risk across studies. The corresponding risk (and its 95% confidence interval) is based on the assumed risk in the comparison group and the relative effect of the intervention (and its 95% CI) | ||||||
| GRADE Working Group grades of evidence | ||||||
| aAssessed in all randomised participants. Not all were symptomatic at baseline (although results show no significant differences in baseline symptoms between groups). Outcome therefore applies only to a select subgroup of participants: downgraded one level for serious indirectness bDowngraded one level for serious risk of bias associated with poor reporting of study methods, high attrition in one study, and high risk of other bias in both studies cImprecision of results (wide confidence intervals and/or few events), downgraded one level for serious imprecision dDowngraded one level for serious inconsistency | ||||||
| Gestrinone versus leuprolin for endometriosis | ||||||
| Patient or population: women with symptomatic endometriosis Settings: gynaecology clinic Intervention: progesterone receptor modulator (gestrinone) Comparison: leuprolin | ||||||
| Outcomes | Illustrative comparative risks* (95% CI) | Relative effect | No. of participants | Quality of the evidence | Comments | |
| Assumed risk | Corresponding risk | |||||
| Leuprolin | Gestrinone | |||||
| Dysmenorrhoea, verbal rating scale Follow‐up: 6 months | In control group, mean score for dysmenorrhoea on verbal rating scale was 0.04 points | Mean score in gestrinone group was 0.35 points higher (0.12 to 0.58 higher) | 55 | ⊕⊕⊝⊝ | Verbal rating scale defines dysmenorrhoea according to limitation of ability to work (mild = 1, moderate = 2, incapacitated = 3) | |
| Dyspareunia, verbal rating scale Follow‐up: 6 months | In control group, mean score for dyspareunia on verbal rating scale was 0.43 points | Mean score in gestrinone group was 0.33 points lower (0.62 to 0.04 lower) | 52 | ⊕⊕⊝⊝ | Verbal rating scale defines dyspareunia according to limitation of sexual activity (discomfort tolerated = 1; pain interrupts intercourse = 2, intercourse avoided owing to pain = 3) | |
| Amenorrhoea Follow‐up: 6 months | 962 per 1000 | 500 per 1000 | OR 0.04 (0.01 to 0.38) | 49 | ⊕⊕⊝⊝ | Only 55 events overall |
| Spotting or bleeding Follow‐up: 6 months | 38 per 1000 | 475 per 1000 | OR 22.92 (2.64 to 198.66) | 49 | ⊕⊕⊝⊝ | Only 12 events overall |
| Side effects: hot flushes Follow‐up: 6 months | 679 per 1000 | 297 per 1000 (112 to 571) | OR 0.20 (0.06 to 0.63) | 55 | ⊕⊕⊝⊝ | Only 27 events overall |
| *The basis for the assumed risk is the mean control group risk across studies. The corresponding risk (and its 95% confidence interval) is based on the assumed risk in the comparison group and the relative effect of the intervention (and its 95% CI). | ||||||
| GRADE Working Group grades of evidence | ||||||
| aDowngraded two levels for very serious imprecision: confidence intervals were compatible with no clinically meaningful difference between groups, or with small benefit in one group bDowngraded two levels for very serious imprecision: small overall sample size (n = 55) and low event rates | ||||||
Background
Description of the condition
Endometriosis is defined as the presence of endometrial tissue (glands and stroma) outside the uterine cavity. It is a condition that is oestrogen‐dependent and thus is seen primarily during the reproductive period (Berek 2007; Giudice 2010). The prevalence of endometriosis ranges from 6% to 10% in women of reproductive age, from 50% to 60% in women and teenage girls with pelvic pain, and has been reported as up to 50% among women with infertility (Cramer 2002; Eskenazi 1997; Goldstein 1980); endometriosis can also be found in asymptomatic women during surgical procedures such as laparoscopy or sterilisation. Endometriosis constitutes a substantial burden on the health‐related quality of life of women and on the finite healthcare resources of national health systems worldwide (Vercellini 2014).
Rokitansky reported this disease for the first time in 1860. Although considerable progress has been made, the pathogenesis remains unclear. The 'retrograde menstruation theory' proposed in the 1920s (Sampson 1927) speculated that endometriosis derives from reflux of endometrial fragments regurgitated through the fallopian tubes during menstruation, with subsequent implantation on the peritoneum and the ovary. Hormonal imbalance involved in development of endometriosis includes increased oestrogen synthesis and metabolism and progesterone resistance (Tosti 2016).
Minimally invasive surgical treatments play an important role in the diagnosis and removal of endometriosis. Unfortunately, this approach is limited by recurrences of endometriosis. Goals of management are to provide pain relief, to limit recurrences, and to restore or preserve fertility when needed. Current medical treatment (Brown 2014) has focused on blocking ovarian oestrogen secretion (with gonadotropin‐releasing hormone analogues or antagonists (GnRH‐a or GnRH antagonists)) or halting oestrogen‐induced growth of ectopic endometrium (with oral contraceptives and androgens). The downside of these approaches includes a significant decrease in bone mass, along with hot flushes, vaginal dryness, acne, and hirsutism, which impair quality of life for many women. Furthermore, the mean length of time before recurrence of pain after completion of medical therapy is between 6 and 18 months (Mahutte 2003). The ideal medical therapy for endometriosis should relieve pain and inhibit endometrial proliferation while avoiding a hypo‐oestrogenic state.
Description of the intervention
Progesterone, acting via its cognate receptors, plays a central role in regulation of uterine function, making progesterone receptor an attractive therapeutic target. Progesterone receptor modulators (PRMs) represent a class of synthetic ligands that can exert agonist, antagonist, or mixed effects on various progesterone target tissues. Mifepristone (MFP, RU486) is a progesterone and glucocorticoid receptor antagonist that was first synthesised in 1980. Since that time, numerous related compounds of progesterone receptor ligands have been synthesised, exhibiting a spectrum of activity ranging from pure progesterone receptor antagonists (PRAs) to mixed agonists/antagonists. PRAs and partial agonist antagonists ‐ selective progesterone receptor modulators (SPRMs) ‐ belong to the large progesterone receptor ligand family.
Owing to their antiproliferative effects in the endometrium, PRMs have been advocated for treatment of symptomatic endometriosis but may not provide appropriate treatment for asymptomatic endometriosis‐associated infertility. Unlike long‐acting GnRH‐a, PRMs are not associated with a decrease in bone mineral density, and their use is accompanied by an increase in oestradiol and progesterone receptors (Neulen 1996), suggesting that the endometrial antiproliferative effect is due to progesterone antagonism. This offers a new alternative: suppression of endometrial proliferation in the midst of an oestrogenic environment. To date, compared with the widely used steroidal progesterone receptor agonists, only three PRMs have been approved by the FDA as emergency contraceptives: RU486, ulipristal acetate (UPA or CDB 2914), and asoprisnil (J867) (Li 2016). Few studies of PRMs for endometriosis have been published, and some show clinical benefit (Chwalisz 2004; Kettel 1996; Kettel 1998). In an uncontrolled study, mifepristone relieved pelvic pain without producing significant side effects (Koide 1998). However, it is reported that mifepristone caused downregulation of progesterone receptors (PRs) and oestrogen receptors (ERs) and upregulation of androgen receptors (ARs) (Narvekar 2004), and in low daily doses, it inhibited ovulation and induced amenorrhoea in most women (Brown 2002). Administration of PRMs also has been found to be accompanied by morphological changes within the endometrium, described as PRM‐associated endometrial changes (PAECs) (Williams 2007). These histological changes are recognised as a distinct histological entity, and the mechanisms by which they develop are poorly understood. The clinical effectiveness of PRMs remains to be evaluated.
How the intervention might work
Progesterone receptor antagonists block the action of progesterone. Therefore, it is not surprising that they have clinical application in the medical termination of pregnancy (Brenner 2002; Brenner 2005). PRAs work as antiprogestins ‐ substances that prevent cells from making or using progesterone. SPRMs represent a new class of progesterone receptor ligands that exert clinically relevant tissue‐selective progesterone agonist, antagonist, or partial (mixed) agonist/antagonist effects on various progesterone target tissues in an in vivo situation, depending on the biological action studied (Spitz 2003). In human cell lines, mifepristone, asoprisnil, ulipristal acetate, lonaprisan, and telapristone acetate suppress endometrial proliferation, resulting in endometrial atrophy. Additional studies on animal models show that mifepristone, onapristone, and ZK136799 suppressed endometrial growth and reduced the production of prostaglandins with possible benefits for pain (Bouchard 2011). As PRMs have a relatively minor effect on serum oestradiol and androgen levels, application of PRMs may have greater efficacy and flexibility than traditional treatments for endometriosis as the result of selective inhibition of endometrial proliferation without systemic effects of oestrogen deprivation. PRMs also have the potential to suppress endometrial prostaglandin and decrease menstruation; this mechanism is proposed to reduce endometriosis‐related pain (Tosti 2016).
Why it is important to do this review
Until now, no systematic review has examined this topic. Doctors considering the use of PRMs in clinical practice are uncertain about the balance between benefit in terms of pain relief and unacceptable side effects. In this review, we evaluated the clinical effectiveness and safety of PRMs, primarily in terms of pain relief, and collated the best evidence for their use as single agents in women with endometriosis.
Objectives
To assess the effectiveness and safety of PRMs primarily in terms of pain relief as compared with other treatments or placebo or no treatment in women of reproductive age with endometriosis.
Methods
Criteria for considering studies for this review
Types of studies
We included randomised controlled trials (RCTs) published in all languages that examined effects of PRMs for treatment of symptomatic endometriosis. We excluded quasi‐RCTs from this review. We also excluded cross‐over trials, as the design is not valid in this context.
Types of participants
Women of reproductive age who have symptoms ascribed to the diagnosis of endometriosis. The diagnosis must have been established during a surgical procedure performed before the start of treatment. We did not consider trials that included women with asymptomatic disease or infertility alone.
Types of interventions
We included trials comparing PRMs versus any other drug therapy or placebo or no treatment. We also included studies that compared doses or regimens of PRMs.
We did not consider studies involving surgical removal of pelvic organs, nor studies exploring the use of hormonal treatment as an adjunct to therapeutic surgery or other medical treatment for endometriosis.
Types of outcome measures
Primary outcomes
-
Pain measures: relief of endometriosis‐related pain at completion of therapy (decrease in pain scores, dysmenorrhoea, and dyspareunia) or other pain‐related outcomes, as reported by included studies
-
Side effects that occur during therapy (Including fatigue, nausea, anorexia, vomiting, weight loss, skin rash, amenorrhoea, endometrial hyperplasia, or hypoadrenalism)
Secondary outcomes
-
Quality of life (QOL). If studies report use of more than one scale, preference is given to the Short Form (SF)‐36, then to other validated generic scales, and finally to condition‐specific scales
-
Change in size and extent of endometrial cysts
-
Change in cancer antigen 125 (CA125)
-
Recurrence rates (percentage of women with recurrence)
-
Side effects that persist after treatment
Search methods for identification of studies
Electronic searches
We developed a comprehensive literature search strategy in consultation with the Information Specialist of the Cochrane Gynaecology and Fertility Group (CGFG). Two review authors (JF and HS) independently conducted a systematic search of the published and unpublished literature from inception of the databases to 28 November 2016 with no restrictions on language or publication status.
We searched the following databases.
-
CGFG Specialised Register (Appendix 1).
-
Central Register of Studies (CRS Online) (Appendix 2).
-
Ovid MEDLINE(R) In‐Process & Other Non‐Indexed Citations, Ovid MEDLINE(R) Daily, and Ovid MEDLINE(R) (Appendix 3).
-
Ovid Embase (Appendix 4).
-
Ovid PsycINFO (Appendix 5).
Searching other resources
We scanned the references of all included studies and relevant reviews to identify additional relevant trials, and we handsearched relevant journals and articles that may not be included in the electronic databases. We also scanned the following databases from inception to 28 November 2016.
-
Trial registers for ongoing and registered trials.
-
-
http://www.clinicaltrials.gov (a service of the US National Institutes of Health).
-
-
-
http://www.who.int/trialsearch/Default.aspx (World Health Organization International Trials Registry Platform search portal).
-
-
DARE (Database of Abstracts of Reviews of Effects) in the Cochrane Library (http://onlinelibrary.wiley.com/o/cochrane/cochrane_cldare_articles_fs.html) for reference lists from relevant non‐Cochrane reviews.
-
Web of Knowledge (http://wokinfo.com/) (another source of trials and conference abstracts).
-
OpenGrey (http://www.opengrey.eu/) for unpublished literature from Europe.
-
LILACS (Latin American Caribbean Health Sciences Literature) (http://regional.bvsalud.org/php/index.php?lang=en).
-
PubMed and Google for recent trials not yet indexed on MEDLINE.
Data collection and analysis
Selection of studies
We downloaded to a reference management database (Endnote) all titles and abstracts retrieved by electronic searching and removed duplicates; two review authors (JF and YW) independently examined the remaining references. We excluded studies that clearly do not meet the inclusion criteria and obtained copies of the full text of potentially relevant references. Two review authors (MZ and HZ) independently assessed the eligibility of retrieved papers. Review authors resolved differences by discussion or by appeal to a third review author (WH), if required. We documented reasons for exclusion and presented the selection process in a PRISMA flow chart.
Data extraction and management
Two review authors (JFand HZ) independently extracted data from eligible studies using a data extraction form that they designed and pilot‐tested.
Data extracted include:
-
participant characteristics;
-
number of participants in each arm of the trial;
-
number excluded from analysis;
-
type of intervention;
-
proportion of participants who received all/part/none of the intended treatment;
-
methods of randomization, blinding, and allocation concealment applied;
-
length of follow‐up; and
-
outcome measurements.
We resolved differences between review authors by discussion or by appeal to a third review author (WH), if necessary. Review authors were not blinded to article, author, or journal title, and tried to contact trial authors for further information and updated data.
Assessment of risk of bias in included studies
Two review authors (JF and HS) independently assessed the methodological risk of bias of each trial according to the guidelines provided in the Cochrane Handbook for Systematic Reviews of Interventions, Section 8.5 (Higgins 2011). According to the Cochrane 'Risk of bias' assessment tool, assessment for risk of bias in included studies consists of six domains ‐ random sequence generation and allocation concealment (selection bias); blinding of participants and personnel (performance bias); blinding of outcome assessment (detection bias); incomplete outcome data (attrition bias); selective reporting (reporting bias); and other sources of bias (other bias) ‐ and yields a judgement of low risk, high risk, or unclear risk. We resolved differences by discussion among review authors or by consultation with the CGFG.
Measures of treatment effect
For dichotomous data (e.g. recurrence rates), we used numbers of events in control and intervention groups of each study to calculate Mantel‐Haenszel odds ratios. If similar outcomes were reported on different scales, we calculated standardized mean differences. We treated ordinal data (e.g. pain scores) as continuous data and presented 95% confidence intervals for all outcomes.
Unit of analysis issues
We conducted the primary analysis per woman randomised.
Dealing with missing data
We analyzed data on an intention‐to‐treat basis as far as possible and attempted to obtain missing data from the original investigators. If studies reported sufficient detail for calculation of mean differences but no information on associated standard deviation (SD), we planned to assume that outcomes had a standard deviation equal to the highest standard deviation used for other studies within the same analysis. Otherwise, we analyzed only available data. We found that no imputation was necessary.
Assessment of heterogeneity
We assessed heterogeneity between studies by visually inspecting forest plots and by estimating the I2 value, which summarises the percentage of heterogeneity between trials that cannot be ascribed to sampling variation. We will consider an I2 < 25% to show heterogeneity of low level, 25% to 50% moderate level, and > 50% high level. If we found evidence of substantial heterogeneity in later updates, we considered possible reasons for it. We did not combine results of trials using different comparator drugs.
Assessment of reporting biases
In view of the difficulty involved in detecting and correcting for publication bias and other reporting biases, we aimed to minimise their potential impact by ensuring a comprehensive search for eligible studies and by staying alert for duplication of data. If we included 10 or more studies in an analysis, we planned to use a funnel plot to explore the possibility of a small‐study effect (tendency for estimates of the intervention effect to be more beneficial in smaller studies).
Data synthesis
We considered the following comparisons.
We combined data from primary studies using a fixed‐effect model for the following.
-
PRMs versus placebo, stratified by dose.
-
PRMs versus no treatment, stratified by dose.
-
PRMs versus other medical therapies, stratified by dose (danazol, GnRH analogue, combined oral contraceptive pill (OCP), levonorgestrel‐releasing intrauterine system, each in a separate analysis, not stratified).
-
Dose or regimen comparison of PRMs.
In the meta‐analyses, we will display graphically to the right of the centre line an increase in the odds of a particular outcome that may be beneficial (e.g. pain relief) or detrimental (e.g. adverse effects), and we will display to the left of the centre line a decrease in the odds of a particular outcome.
For Comparison 1 (PRMs vs placebo), two analyses showed that the event rate was too low in control groups to allow review authors to split the group for the purpose of stratification. Therefore, we pooled all data in a single analysis and reported a separate analysis stratified by dose but not pooled (this applied to the outcomes 'amenorrhoea at 3 months' and 'hot flushes at 3 months').
Subgroup analysis and investigation of heterogeneity
We planned to explore the following potential sources of heterogeneity by conducting subgroup analyses: different mode of administration and different course.
Sensitivity analysis
We planned to conduct sensitivity analyses for the primary outcomes to determine whether conclusions were robust to arbitrary decisions made regarding trial eligibility and analysis of results. Through these analyses, we planned to consider whether conclusions would have differed if:
-
eligibility were restricted to studies without high risk of bias;
-
studies with outlying results had been excluded; or
-
a random‐effects model had been adopted.
Overall quality of the body of evidence: 'Summary of findings' table
We prepared a 'Summary of findings' table using GRADEpro and Cochrane methods. This table presents our evaluation of the overall quality of the body of evidence for the main review outcomes ('Relief in endometriosis‐related pain', 'Side effects occurring during therapy') for the main review comparison ('Mifeprostone vs placebo'). We assessed the quality of the evidence using GRADE criteria: risk of bias, consistency of effect, imprecision, indirectness, and publication bias. Two review authors independently judged evidence quality (as high, moderate, low, or very low) and resolved disagreements by discussion. We justified judgements and documented and incorporated them into reporting of results for each outcome.
Results
Description of studies
Results of the search
Through the search, we retrieved 353 articles. We retrieved in full text 19 that were potentially eligible. Ten articles met our inclusion criteria. We excluded nine studies. (See Characteristics of included studies, Characteristics of excluded studies, and the PRISMA flow chart – Figure 1.) We tried to contact trial authors to request information including missing data. We reported in Table 1 data that were unsuitable for analysis.

Study flow diagram.
| Outcome | Study | Comparison | Measure | Int group | Control group | P value | |
| Combined non‐pelvic pain, dysmenorrhoea, and dyspareunia | Asoprisnil: 5 mg (n = 31), 10 mg (n = 33), 25 mg (n = 32) Placebo (n = 34) | Mean reduction at 3 months on 0‐4 pain scale | 0.5 points for each dose | < 0.1 points | < 0.05 |
Included studies
Study design and setting
We included in the review eight RCTs (Bromham 1995; Carbonell 2012; Carbonell 2016; Chwalisz 2004; Fedele 1989; GISG 1996; Hornstein 1990; Spitz 2009). We included two other RCTs (Dawood 1997; Worthington 1993) that did not report the primary and secondary outcomes of our review.
Participants
We included 960 women with endometriosis confirmed by laparoscopy.
Interventions
Carbonell 2016 and Carbonell 2012 compared different dosages of mifepristone for laparoscopically confirmed endometriosis, Chwalisz 2004 compared three doses of asoprisnil with placebo, and Spitz 2009 compared three doses of ulipristal with leuprolide acetate. Bromham 1995 and Fedele 1989 compared gestrinone with danazol, GISG 1996 compared gestrinone with leuprolin depot, and Hornstein 1990 compared different dosages of gestrinone.
Outcomes
Eight studies reported one or more of our primary outcomes. Investigators reported some specific outcomes only in women who were symptomatic at baseline.
Excluded studies
We excluded nine studies from the review. Bulun 2016,Kettel 1996, and Kettel 1998 are not RCTs; Mettler 1987, Nieto 1996,Yang 2006, and Zhang 2016 provided interventions that were a mixture of surgical and medical therapy; Nobel 1980 compared danazol with an OCP; and Thomas 1987 concentrated on asymptomatic endometriosis and its effects on fertility.
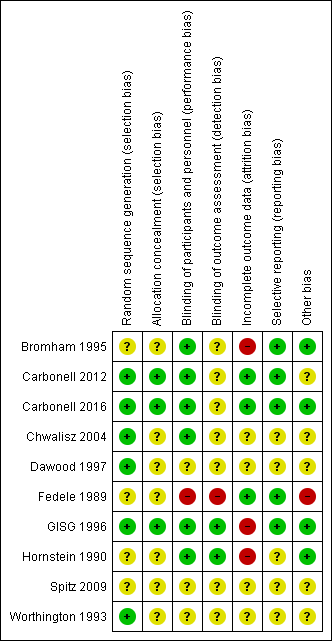
Risk of bias in included studies
Refer to the 'Risk of bias' tables and Figure 2 and Figure 3.

Risk of bias graph: review authors' judgements about each risk of bias item presented as percentages across all included studies.

Risk of bias summary: review authors' judgements about each risk of bias item for each included study.
Allocation
Sequence generation
Carbonell 2016 used a random list obtained from the MEDSTAT 2.1 programme (low risk of bias). Carbonell 2012 used a computer‐generated randomization process (low risk of bias); Chwalisz 2004 and GISG 1996 included details of their randomization process and were at low risk of this bias. Bromham 1995, Fedele 1989, Hornstein 1990, and Spitz 2009 did not describe the method used and were at unclear risk of bias for this domain.
Allocation concealment
Carbonell 2016 applied opaque sealed envelopes that contained a card indicating the treatment group to which the participant was assigned (low risk of bias). Carbonell 2012 applied opaque sealed envelopes that contained a card indicating the treatment group to which the participant was assigned (low risk of bias). GISG 1996 also included allocation concealment in the study design and was at low risk of selection bias. The other seven studies did not describe the method used and were at unclear risk of bias for this domain.
Blinding
We rated six studies as having low risk of performance bias (Bromham 1995; Carbonell 2012; Carbonell 2016; Chwalisz 2004; GISG 1996; Hornstein 1990) and two as having low risk of detection bias (GISG 1996; Hornstein 1990). Fedele 1989 was unblinded, and we rated it as having high risk of performance bias and detection bias. Other studies did not clearly describe blinding procedures, and we rated them as having unclear risk of bias in one or both of these domains.
Incomplete outcome data
Carbonell 2016 and Carbonell 2012 analyzed all women randomised, and we judged them to be at low risk of attrition bias. Three studies reported large losses to follow‐up (> 10%), and we rated them as having high risk of attrition bias (Bromham 1995;GISG 1996;Hornstein 1990). Other studies did not clearly state attrition rates, and we rated them as having unclear risk.
Selective reporting
Five studies reported our main review outcomes, and we rated them as having low risk of selective reporting (Bromham 1995; Carbonell 2012, Carbonell 2016; Fedele 1989; GISG 1996). We rated other studies as having unclear risk of selective reporting, as they reported insufficient data for review authors to make a judgement.
Other potential sources of bias
We rated four studies as having low risk of other bias (Bromham 1995; Carbonell 2016; GISG 1996; Hornstein 1990). We rated one study (Fedele 1989) as having high risk because researchers amended drug doses during the trial, and only seven participants given gestrinone and nine taking danazol had repeat laparoscopy. We rated the other studies as having unclear risk of bias in this domain because information was insufficient for review authors to make a judgement as to other potential sources of bias.
Effects of interventions
See: Summary of findings for the main comparison Mifepristone versus placebo for endometriosis; Summary of findings 2 Gestrinone versus danazol for endometriosis; Summary of findings 3 Gestrinone versus leuprolin for endometriosis
1. Mifepristone
Carbonell 2016 compared three doses of mifepristone (2.5 mg, 5 mg, 10 mg) versus placebo for three months and as a dose comparison (without placebo) for six months. Carbonell 2012 compared 5 mg versus 25 mg of mifepristone for six months.
1.1 Mifepristone versus placebo
Primary outcomes
1.1.1 Pain measures
One study (Carbonell 2016 ) reported rates of patient‐assessed dysmenorrhoea or dyspareunia (respectively) at three months among women who reported these symptoms at baseline.
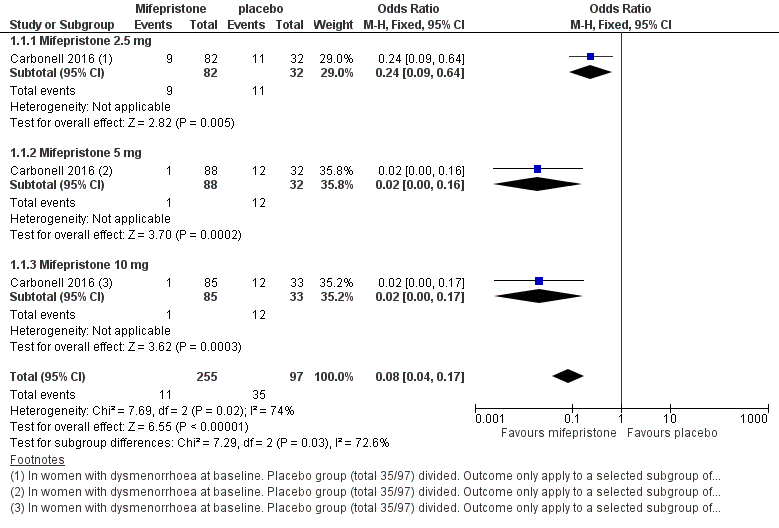
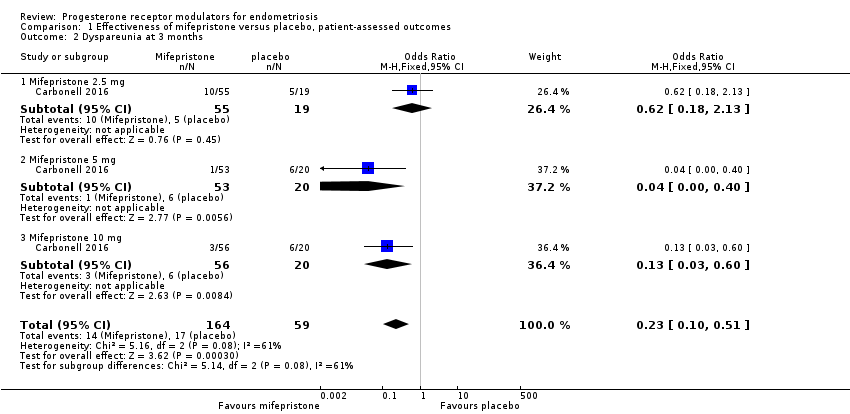
Symptoms were less common in the mifepristone group for both dysmenorrhoea (OR 0.08, 95% CI 0.04 to 0.17; one RCT, n = 352; moderate‐quality evidence; Figure 4) and dyspareunia (OR 0.23, 95% CI 0.10 to 0.51; one RCT, n = 223; low‐quality evidence).
Forest plot of comparison: 1 Effectiveness of mifepristone versus placebo, patient‐assessed outcomes, outcome: 1.1 Dysmenorrhoea at three months.
Subgroup analysis
We stratified the data by dose of mifepristone (2.5 mg, 5 mg, 10 mg).
With respect to dysmenorrhoea, all three doses were more effective than placebo, but the test for subgroup differences indicated a significant difference in effectiveness between doses (Chi2 = 7.29, df = 2 (P = 0.03), I2 = 72.6%). When we excluded the 2.5 mg dose from the analysis, the effect estimate showed increased benefit for mifepristone (OR 0.02, 95% CI 0.00 to 0.09), and the test for subgroup differences showed no evidence of a difference between groups (Chi2 = 0.00, df = 1 (P = 0.96), I2 = 0%). This suggests that 5 mg and 10 mg doses are more effective than the 2.5 mg dose, and that results show no clear difference in effectiveness between 5 mg and 10 mg doses.
With respect to dyspareunia, all three doses were more effective than placebo, but the test for subgroup differences indicated a significant difference in effectiveness between doses (Chi2 = 3.68, df = 2 (P = 0.16), I2 = 45.6%). When we exclude the 2.5 mg dose from the analysis, the effect estimate shows increased benefit for mifepristone (OR 0.09, 95% CI 0.03 to 0.30), and the test for subgroup differences shows no evidence of a difference between groups (Chi2 = 0.63, df = 1 (P = 0.43), I2 = 0%). This suggests that 5 mg and 10 mg doses are more effective than the 2.5 mg dose, and that results show no clear difference in effectiveness between 5 mg and 10 mg doses.
1.1.2 Side effects at three months
The mifepristone group had higher rates of amenorrhoea (OR 686.16, 95% CI 92.29 to 5101.33; one RCT, n = 360; high‐quality evidence) and hot flushes (OR 28.79, 95% CI 3.93 to 210.73; one RCT, n = 360; high‐quality evidence) at three months of treatment. These CIs are extremely wide because nearly 90% of the mifepristone group had amenorrhoea and 24% had hot flushes, and investigators reported only one event of each (1%) in the placebo group.
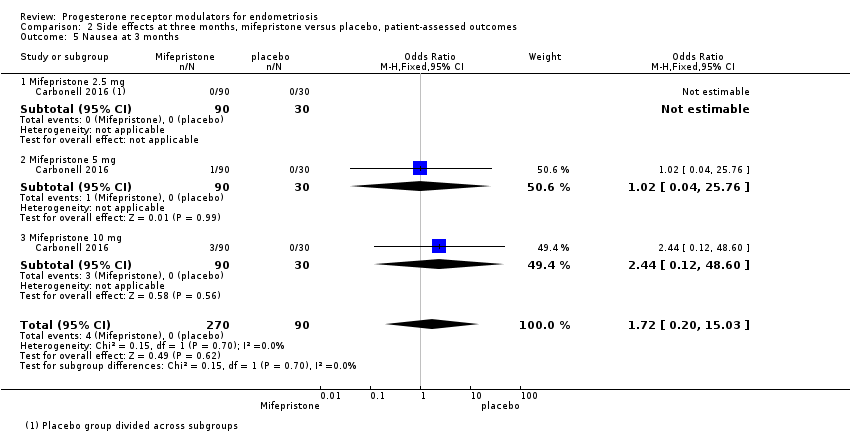
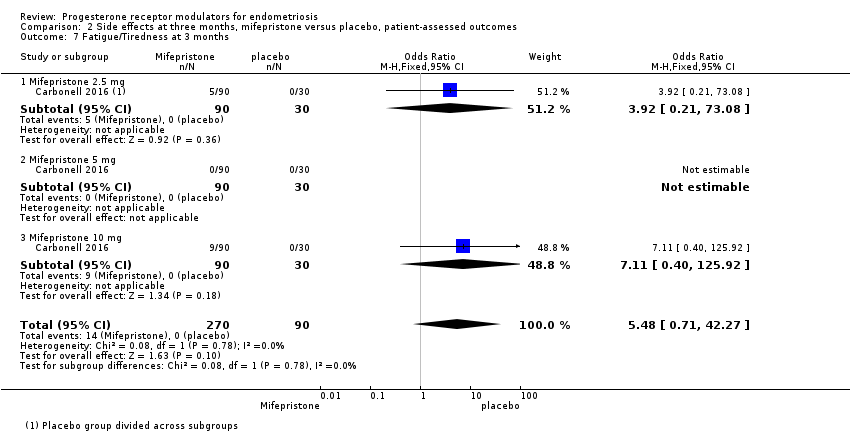
Evidence was insufficient to show differences between groups in rates of nausea (OR 1.72 , 95% CI 0.20 to 15.03; one RCT, n = 360), vomiting (OR 1.02, 95% CI 0.10 to 10.01), or fatigue/tiredness (OR 5.48, 95% CI 0.71 to 42.27; one RCT, n = 360; very low‐quality evidence) at three months, if present. No studies reported endometrial hyperplasia or hypoadrenalism. See Figure 5 and Figure 6.

Forest plot of comparison.
2 Mifepristone versus placebo, patient‐assessed outcomes, outcome: 2.1 Amenorrhoea at three months.

Forest plot of comparison: side effects at three months, mifepristone versus placebo, patient‐assessed outcomes, outcome: 2.2 Hot flushes at three months.
Subgroup analysis
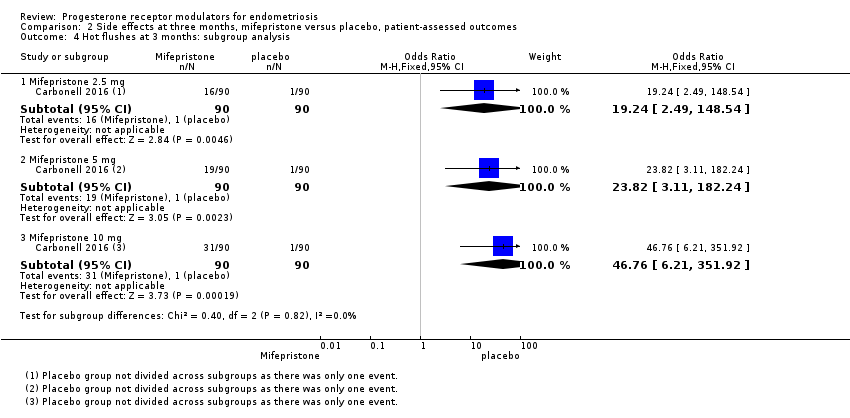
We subgrouped data by dose of mifepristone (2.5 mg, 5 mg, 10 mg).
All three doses were associated with higher rates of amenorrhoea than occurred with placebo, but the test for subgroup differences indicated a significant difference in effectiveness between doses (test for subgroup differences: Chi2 = 4.73, df = 2 (P = 0.09), I2 = 57.7%). When we excluded the 2.5 mg dose from the analysis, the test for subgroup differences showed no evidence of a difference between groups (test for subgroup differences: Chi2 = 0.00, df = 1 (P = 1.00), I2 = 0%). This suggests that 5 mg and 10 mg doses are more likely than the 2.5 mg dose to be associated with amenorrhoea.
For other reported side effects (nausea, vomiting, and fatigue or tiredness), results show no indication of a difference between subgroups (test for subgroup differences, I2 = 0%).
Secondary outcomes
No studies reported on our secondary outcomes.
1.2 Mifepristone dose comparison
Two studies compared different doses of mifepristone at six months of follow‐up. One trial (Carbonell 2016) compared 2.5 mg versus 5 mg and 10 mg, and the other (Carbonell 2012) compared 5 mg versus 25 mg. Carbonell 2016 reported data on effectiveness as well as side effects. Carbonell 2012 provided a graph showing pain scores on a 0 to 10 visual analogue scale (VAS). As investigators reported the standard deviation for only one group, we assumed equal variances in the two groups. Carbonell 2012 also reported data on selected side effects.
Primary outcomes
1.2.1 Pain measures at six months
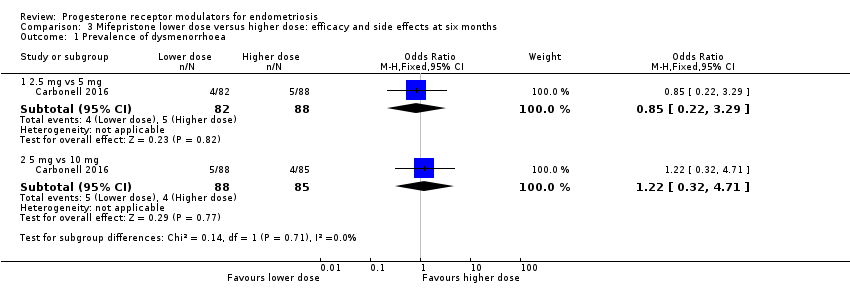
When we compared lower doses versus higher doses of mifepristone, the data were too imprecise to reveal differences between groups in rates of dysmenorrhoea, dyspareunia, or pelvic pain, as follows.
Dysmenorrhoea (Analysis 3.1;Analysis 3.2).
-
2.5 mg vs 5 mg: OR 0.85, 95% CI 0.22 to 3.29; one RCT, n = 170; very low‐quality evidence.
-
5 mg vs 10 mg: OR 1.22, 95% CI 0.32 to 4.71; one RCT, n = 173; very low‐quality evidence.
-
5 mg vs 25 mg: MD on VAS 0 to 10 scale ‐0.50 points, 96% CI ‐2.04 to 1.04; one RCT, n = 26; very low‐quality evidence).
Dyspareunia (Analysis 3.3;Analysis 3.4).
-
2.5 mg vs 5 mg: OR 6.37, 95% CI 0.74 to 54.81; one RCT, n = 108; very low‐quality evidence.
-
5 mg vs 10 mg: OR 0.52, 95% CI 0.05 to 5.90; one RCT, n = 109; very low‐quality evidence.
-
5 mg vs 25 mg: MD on VAS 0 to 10 scale 0.00 points, 95% CI ‐1.23 to 1.23; n = 26; very low‐quality evidence.
Pelvic pain (Analysis 3.5).
-
2.5 mg vs 5 mg: OR 1.81, 95% CI 0.63 to 5.17; one RCT, n = 110; very low‐quality evidence.
-
5 mg vs 10 mg: OR 3.97, 95% CI 0.79 to 19.97; one RCT, n = 120; very low‐quality evidence.
1.2.2 Side effects at six months
When we compared lower doses versus higher doses of mifepristone, amenorrhoea was less common among women taking 2.5 mg than in those taking 5 mg, and fatigue or tiredness was less common among women taking 5 mg than in those taking 10 mg. For other outcomes, the data were too imprecise to show whether differences between groups occurred. Effect estimates were as follows.
Amenorrhoea (Analysis 3.6).
-
2.5 mg vs 5 mg: OR 0.45, 95% CI 0.21 to 0.97; n = 180; very low‐quality evidence.
-
5 mg vs 10 mg: OR 1.10, 95% CI 0.47 to 2.56; n = 180; very low‐quality evidence.
-
5 mg vs 25 mg: OR 0.61, 95% CI 0.08 to 4.41; n = 52; very low‐quality evidence.
Hot flushes (Analysis 3.7).
-
2.5 mg vs 5 mg: OR 0.84, 95% CI 0.38 to 1.89; n = 180; very low‐quality evidence.
-
5 mg vs 10 mg: OR 0.75, 95% CI 0.35 to 1.58; n = 180; very low‐quality evidence.
-
5 mg vs 25 mg: OR 3.24, 95% CI 0.12 to 87.13; n = 52; very low‐quality evidence.
Nausea (Analysis 3.8).
-
2.5 mg vs 5 mg: OR 2.02, 95% CI 0.18 to 22.71; n = 180; very low‐quality evidence.
-
5 mg vs 10 mg: OR 1.00, 95% CI 0.06 to 16.24; n = 180; very low‐quality evidence.
Vomiting (Analysis 3.9).
-
2.5 mg vs 5 mg: OR 3.03, 95% CI 0.12 to 75.46; n = 180; very low‐quality evidence.
-
5 mg vs 10 mg: OR 0.33, 95% CI 0.01 to 8.20; n = 180; very low‐quality evidence.
Fatigue/tiredness (Analysis 3.10).
-
2.5 mg vs 5 mg: OR 13.92, 95% CI 0.77 to 250.94; n = 180; very low‐quality evidence.
-
5 mg vs 10 mg: OR 0.03, 95% CI 0.00 to 0.54; n = 180; very low‐quality evidence.
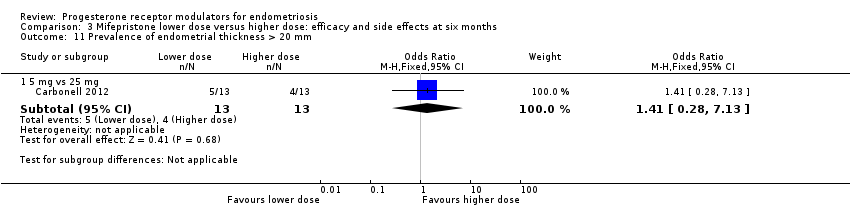
Endometrial thickness > 20 mm (Analysis 3.11).
-
2.5 mg vs 25 mg: OR 1.41, 95% CI 0.28 to 1.86; n = 52; very low‐quality evidence.
Secondary outcomes
No studies reported on secondary outcomes.
2. Gestrinone
Gestrinone was another PRM assessed in the included trials. No RCTs compared gestrinone versus no treatment or placebo.
2.1 Gestrinone versus danazol
Primary outcomes
2.1.1 Pain measures
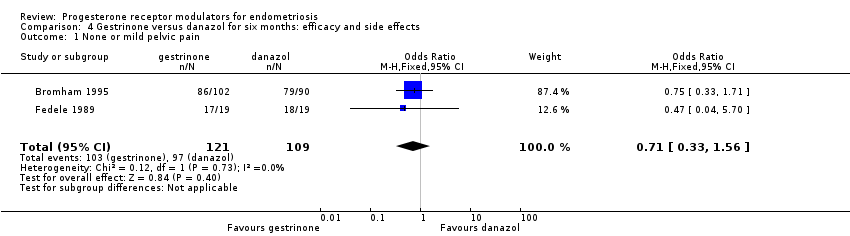
Two studies reported this outcome (Bromham 1995; Fedele 1989).
Data were insufficient to show differences between groups, if present, in the rate of pain relief (those reporting no or mild symptoms), with respect to pelvic pain (OR 0.71, 95% CI 0.33 to 1.56; two RCTs, n = 214; I2 = 0%; very low‐quality evidence), dysmenorrhoea (OR 0.72, 95% CI 0.39 to 1.33; two RCTs, n = 214; I2 = N/A; very low‐quality evidence), and dyspareunia (OR 0.83, 95% CI 0.37 to 1.86; two RCTs, n = 222; I2 = 0%; very low‐quality evidence).
2.1.2 Side effects
The gestrinone group had lower rates of decreased breast size (OR 0.62, 95% CI 0.38 to 0.98; two RCTs, n = 302; I2 = 0%; low‐quality evidence), muscle cramps (OR 0.49, 95% CI 0.30 to 0.78; two RCTs, n = 302; I2 = 0%; low‐quality evidence), and hunger (OR 0.59, 95% CI 0.36 to 0.97; one RCT, n = 264; very low‐quality evidence), but higher rates of hirsutism (OR 2.73, 95% CI 1.67 to 4.46; two RCTs, n = 302; I2 = 68%; very low‐quality evidence) and seborrhoea (greasy skin) (OR 2.74, 95% CI 1.69 to 4.46; two RCTs, n = 302; I2 = 65%; low‐quality evidence, respectively).
Evidence was insufficient to show differences between groups, if present, in rates of acne, voice problems, swelling of hands or feet, hot flushes, headache, nausea, vomiting, loss of appetite, dizziness, tiredness, faintness, skin rash, weight gain, vaginal dryness, and raised liver transaminase.
Evidence shows substantial statistical heterogeneity for the outcomes of hirsutism, seborrhoea, and hot flushes (I2= 68%, 65%, 72%). We considered that this was likely due to clinical heterogeneity related to variations in study location and patient population.
No studies reported endometrial hyperplasia or hypoadrenalism.
Secondary outcomes
No studies reported on our secondary outcomes.
2.2 Gestrinone versus leuprolin
Primary outcomes
2.2.1 Pain measures
One study compared gestrinone versus the GnRH analogue leuprolin (GISG 1996). This study reported symptom scores at six months.
When researchers compared gestrinone versus leuprolin, measurements on the 1 to 3 verbal rating scale (lower score denotes benefit) show that the mean dysmenorrhoea score was higher in the gestrinone group (MD 0.35 points, 95% CI 0.12 to 0.58; one RCT, n = 55; low‐quality evidence), but the mean dyspareunia score was lower in the gestrinone group (MD 0.33 points, 95% CI 0.62 to 0.04; low‐quality evidence).
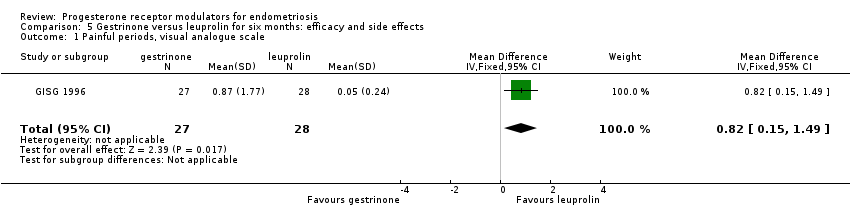
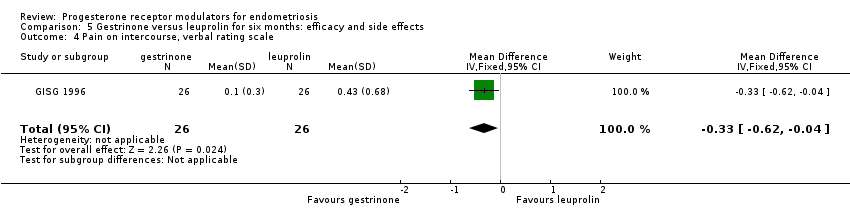
Outcomes measured on a 0 to 10 VAS scale showed a lower mean dysmenorrhoea score in the leuprolin group (MD 0.82 points, 95% CI 0.15 to 1.49) and a higher mean dyspareunia score in the leuprolin group (MD 1.16 points, 95% CI 2.08 to 0.24). (See Figure 7 and Figure 8.)
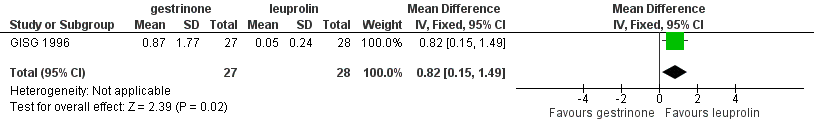
Forest plot of comparison: 7 Gestrinone versus leuprolin for six months: efficacy and side effects, outcome: 7.1 Painful periods, visual analogue scale.

Forest plot of comparison: 7 Gestrinone versus leuprolin for six months: efficacy and side effects, outcome: 7.3 Pain on intercourse, visual analogue scale.
2.2.2 Side effects
The gestrinone group had lower rates of hot flushes (OR 0.20, 95% CI 0.06 to 0.63; one RCT, n = 55; very low‐quality evidence), amenorrhoea (OR 0.04, 95% CI 0.01 to 0.38; one RCT, n = 49; very low‐quality evidence), and headache (OR 0.20, 95% CI 0.06 to 0.63; one RCT, n = 55; very low‐quality evidence), but higher rates of spotting or bleeding (OR 22.92, 95% CI 2.64 to 198.66; one RCT, n = 55; very low‐quality evidence). Evidence was insufficient to show differences between groups, if present, in rates of seborrhoea, swelling hands/feet, leg or muscle cramps, nausea, dizziness, skin rash, vaginal dryness, mood changes, joint pain, drowsiness, and tachycardia. Investigators reported no data on endometrial hyperplasia or hypoadrenalism.
Secondary outcomes
No studies reported on secondary outcomes.
2.3 Gestrinone dose comparison
Primary outcomes
2.2.1 Pain measures
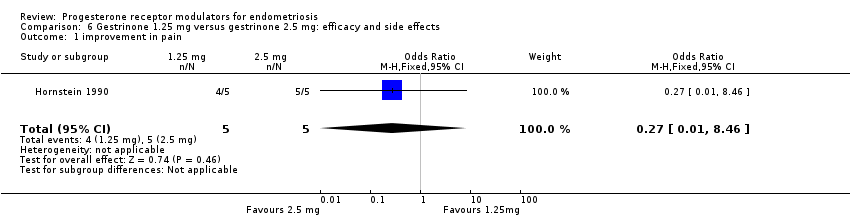
Hornstein 1990 compared two doses of gestrinone (1.25 mg vs 2.5 mg). Evidence was insufficient to show differences between groups, if present, in rates of pain relief (OR 0.27, 95% CI 0.01 to 8.46; one RCT, n = 10; very low‐quality evidence). .
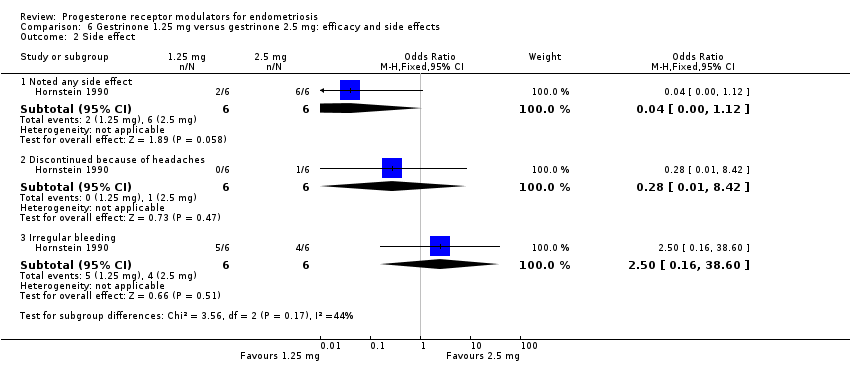
2.2.2 Side effects
Evidence was insufficient to show differences between groups, if present, in rates of any adverse effect (OR 0.04, 95% CI 0.00 to 1.12; one RCT, n = 12; very low‐quality evidence), discontinuation due to headaches (OR 0.28, 95% CI 0.01 to 8.42; one RCT, n = 12), or irregular bleeding (OR 2.5, 95% CI 0.16 to 38.60; one RCT, n = 12). Reported adverse effects included weight gain, headache, palpitations, peripheral oedema, and hirsutism. No studies reported on endometrial hyperplasia or hypoadrenalism.
Secondary outcomes
No studies reported on our secondary outcomes.
3. SPRMs
Two studies compared SPRMs versus placebo (Chwalisz 2004) or leuprolide acetate (Spitz 2009). These studies were presented as abstracts and did not report data suitable for analysis.
3.1 Asoprisnil versus placebo
Chwalisz 2004 (n = 130) compared three different doses of asoprisnil versus placebo.
Primary outcome
3.1.1 Pain measures
Study authors reported that asoprisnil reduced average daily combined non‐menstrual pelvic pain/dysmenorrhoea scores during all treatment months compared with placebo, and that this treatment induced amenorrhoea during the entire treatment period in a dose‐dependent manner (placebo: 0%; 5 mg: 50%; 10 mg: 71%; and 25 mg: 93%).
3.1.2 Side effects
The included study did not report these effects.
Secondary outcomes
The included study did not report these outcomes.
3.2 Uliprisnil versus leuprolide acetate
Spitz 2009 compared six months of treatment with three doses of ulipristal (12.5 mg, 25 mg, and 50 mg) versus leuprolide acetate depot in 38 women.
Primary outcome
3.2.1 Pain measures
Study authors reported that the 50 mg dose of ulipristal was associated with fewer days of pain, less severe pain, and accompanying distress when compared with lower doses, and that it was as effective as leuprolide acetate.
3.1.2 Side effects
The included study did not report these effects.
Secondary outcomes
The included study did not report these outcomes.
Other analyses
Data were too few for review authors to conduct planned subgroup and sensitivity analyses, or to construct a funnel plot to assess reporting bias.
Discussion
Summary of main results
Mifepristone represents relief of dysmenorrhoea and dyspareunia with side effects of amenorrhoea and hot flushes. We found no evidence of benefit of gestrinone compared with other treatments. Data on asoprisnil and ulipristal are limited. Results were based on very limited evidence and thus should be interpreted with caution.
Overall completeness and applicability of evidence
The included studies partially answered the review question. Studies investigated relevant participants and interventions, but future studies must be more unified and specific about study outcomes. Methods of outcome evaluation differed among studies. Progesterone receptor modulators (PRMs) showed effects of relieving pain, but more evidence is needed. Evidence is limited by the small number of comparisons reported and by the small sample size included for each comparison.
Quality of the evidence
Five of eight trials adequately described randomization and allocation concealment, and seven trials reported blinding. Five studies reported on a priori outcomes; two were at unclear risk and one at high risk of reporting bias. The quality of the body of evidence ranged from very low to high.
The main limitations were serious risk of bias (associated with poor reporting of methods and high or unclear rates of attrition in most studies), very serious imprecision with low event rates, small sample sizes, and very wide confidence intervals for most comparisons, as well as indirectness (outcomes assessed in a selected subgroup of participants). Only two studies were at low risk of attrition bias, which is a matter of concern because attrition may well have been related to participant response. The main limitation remains the issue of multiple comparisons with a small number of trials. Results show lack of consistency in outcome measures used, which leads to difficulties in combining data in a suitable meta‐analysis, thus making it difficult for review authors to draw clinically relevant conclusions.
Potential biases in the review process
We aimed to identify all relevant studies by performing comprehensive database searches. Rare side effects of voice problems found in randomised controlled trials (RCTs) examining gestrinone versus danazol may introduce bias. Our choice of multiple measures for primary outcomes (e.g. dysmenorrhoea, dyspareunia, amenorrhoea, hot flushes) could be another potential source of bias, especially as selective reporting is apparent in at least one of the included studies.
Agreements and disagreements with other studies or reviews
The conclusions of other non‐Cochrane reviews (Bouchard 2011; Giudice 2010; Tosti 2016) and of studies that were excluded from this review were substantially the same as the conclusions of this review, and more studies are needed to evaluate the effectiveness and safety of PRMs.

Study flow diagram.

Risk of bias graph: review authors' judgements about each risk of bias item presented as percentages across all included studies.
Risk of bias summary: review authors' judgements about each risk of bias item for each included study.

Forest plot of comparison: 1 Effectiveness of mifepristone versus placebo, patient‐assessed outcomes, outcome: 1.1 Dysmenorrhoea at three months.

Forest plot of comparison.
2 Mifepristone versus placebo, patient‐assessed outcomes, outcome: 2.1 Amenorrhoea at three months.

Forest plot of comparison: side effects at three months, mifepristone versus placebo, patient‐assessed outcomes, outcome: 2.2 Hot flushes at three months.

Forest plot of comparison: 7 Gestrinone versus leuprolin for six months: efficacy and side effects, outcome: 7.1 Painful periods, visual analogue scale.

Forest plot of comparison: 7 Gestrinone versus leuprolin for six months: efficacy and side effects, outcome: 7.3 Pain on intercourse, visual analogue scale.
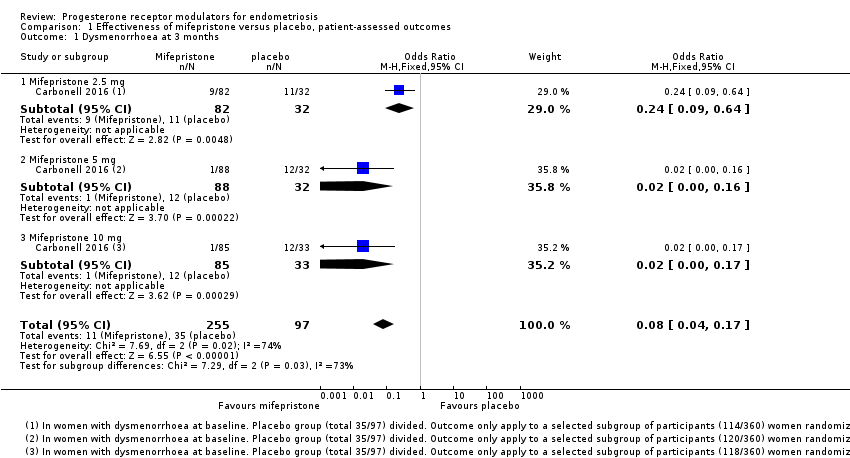
Comparison 1 Effectiveness of mifepristone versus placebo, patient‐assessed outcomes, Outcome 1 Dysmenorrhoea at 3 months.
Comparison 1 Effectiveness of mifepristone versus placebo, patient‐assessed outcomes, Outcome 2 Dyspareunia at 3 months.

Comparison 2 Side effects at three months, mifepristone versus placebo, patient‐assessed outcomes, Outcome 1 Amenorrhoea at 3 months.

Comparison 2 Side effects at three months, mifepristone versus placebo, patient‐assessed outcomes, Outcome 2 Amenorrhoea at 3 months: subgroup analysis.
Comparison 2 Side effects at three months, mifepristone versus placebo, patient‐assessed outcomes, Outcome 3 Hot flushes at 3 months.
Comparison 2 Side effects at three months, mifepristone versus placebo, patient‐assessed outcomes, Outcome 4 Hot flushes at 3 months: subgroup analysis.
Comparison 2 Side effects at three months, mifepristone versus placebo, patient‐assessed outcomes, Outcome 5 Nausea at 3 months.

Comparison 2 Side effects at three months, mifepristone versus placebo, patient‐assessed outcomes, Outcome 6 Vomiting at 3 months.
Comparison 2 Side effects at three months, mifepristone versus placebo, patient‐assessed outcomes, Outcome 7 Fatigue/Tiredness at 3 months.
Comparison 3 Mifepristone lower dose versus higher dose: efficacy and side effects at six months, Outcome 1 Prevalence of dysmenorrhoea.

Comparison 3 Mifepristone lower dose versus higher dose: efficacy and side effects at six months, Outcome 2 Dysmenorrhoea score 0‐10 VAS scale.

Comparison 3 Mifepristone lower dose versus higher dose: efficacy and side effects at six months, Outcome 3 Prevalence of dyspareunia.

Comparison 3 Mifepristone lower dose versus higher dose: efficacy and side effects at six months, Outcome 4 Dyspareunia score 0‐10 VAS scale.

Comparison 3 Mifepristone lower dose versus higher dose: efficacy and side effects at six months, Outcome 5 Prevalence of pelvic pain.

Comparison 3 Mifepristone lower dose versus higher dose: efficacy and side effects at six months, Outcome 6 Prevalence of amenorrhoea.

Comparison 3 Mifepristone lower dose versus higher dose: efficacy and side effects at six months, Outcome 7 Prevalence of hot flushes.

Comparison 3 Mifepristone lower dose versus higher dose: efficacy and side effects at six months, Outcome 8 Prevalence of nausea.

Comparison 3 Mifepristone lower dose versus higher dose: efficacy and side effects at six months, Outcome 9 Prevalence of vomiting.

Comparison 3 Mifepristone lower dose versus higher dose: efficacy and side effects at six months, Outcome 10 Prevalence of fatigue/tiredness.
Comparison 3 Mifepristone lower dose versus higher dose: efficacy and side effects at six months, Outcome 11 Prevalence of endometrial thickness > 20 mm.
Comparison 4 Gestrinone versus danazol for six months: efficacy and side effects, Outcome 1 None or mild pelvic pain.
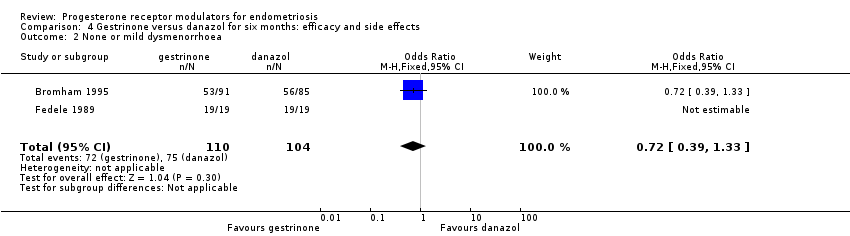
Comparison 4 Gestrinone versus danazol for six months: efficacy and side effects, Outcome 2 None or mild dysmenorrhoea.
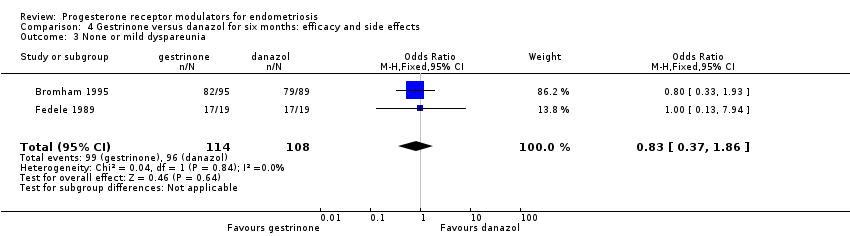
Comparison 4 Gestrinone versus danazol for six months: efficacy and side effects, Outcome 3 None or mild dyspareunia.

Comparison 4 Gestrinone versus danazol for six months: efficacy and side effects, Outcome 4 Adverse effects.
Comparison 5 Gestrinone versus leuprolin for six months: efficacy and side effects, Outcome 1 Painful periods, visual analogue scale.

Comparison 5 Gestrinone versus leuprolin for six months: efficacy and side effects, Outcome 2 Painful periods, verbal rating scale.

Comparison 5 Gestrinone versus leuprolin for six months: efficacy and side effects, Outcome 3 Pain on intercourse, visual analogue scale.
Comparison 5 Gestrinone versus leuprolin for six months: efficacy and side effects, Outcome 4 Pain on intercourse, verbal rating scale.
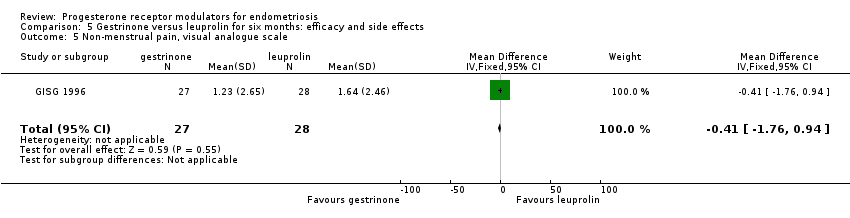
Comparison 5 Gestrinone versus leuprolin for six months: efficacy and side effects, Outcome 5 Non‐menstrual pain, visual analogue scale.

Comparison 5 Gestrinone versus leuprolin for six months: efficacy and side effects, Outcome 6 Side effects.
Comparison 6 Gestrinone 1.25 mg versus gestrinone 2.5 mg: efficacy and side effects, Outcome 1 improvement in pain.
Comparison 6 Gestrinone 1.25 mg versus gestrinone 2.5 mg: efficacy and side effects, Outcome 2 Side effect.
| Mifepristone versus placebo for endometriosis | ||||||
| Patient or population: women with symptomatic endometriosis Settings: gynaecology clinic Intervention: progesterone receptor modulator (mifepristone) Comparison: placebo | ||||||
| Outcomes | Illustrative comparative risks* (95% CI) | Relative effect | No. of participants | Quality of the evidence | Comments | |
| Assumed risk | Corresponding risk | |||||
| Placebo | Mifepristone | |||||
| Prevalence of dysmenorrhoea Follow‐up: 3 months | 402 per 1000 | 51 per 1000 | OR 0.08 (0.04 to 0.17) | 352 | ⊕⊕⊕⊝ | |
| Prevalence of dyspareunia Follow‐up: 3 months | 288 per 1000 | 85 per 1000 | OR 0.23 (0.10 to 0.51) | 223 | ⊕⊕⊝⊝ | |
| Side effects: amenorrhoea Follow‐up: 3 months | 11 per 1000 | 884 per 1000 | OR 686.16 (92.29 to 5101.33) | 360 | ⊕⊕⊕⊝ High | 239/270 events in the mifepristone group vs 1/90 in the placebo group |
| Side effects: hot flushes Follow‐up: 3 months | 11 per 1000 | 243 per 1000 | OR 28.79 (3.93 to 210.73) | 360 | ⊕⊕⊕⊝ High | 66/270 events in the mifepristone group vs 1/90 in the placebo group |
| *The basis for the assumed risk is the mean control group risk across studies. The corresponding risk (and its 95% confidence interval) is based on the assumed risk in the comparison group and the relative effect of the intervention (and its 95% CI) | ||||||
| GRADE Working Group grades of evidence | ||||||
| aDowngraded one level for serious imprecision (wide confidence intervals and/or very few events) bOutcome applied only to women with dysmenorrhoea at baseline, but this was 352/360 women randomised, so not downgraded for indirectness cOutcome applied only to women with dyspareunia at baseline, which was 223/360 women randomised. Downgraded one level for serious indirectness | ||||||
| Gestrinone versus danazol for endometriosis | ||||||
| Patient or population: women with symptomatic endometriosis Settings: gynaecology clinic Intervention: progesterone receptor modulator (gestrinone) Comparison: danazol | ||||||
| Outcomes | Illustrative comparative risks* (95% CI) | Relative effect | No. of participants | Quality of the evidence | Comments | |
| Assumed risk | Corresponding risk | |||||
| Danazol | Gestrinone | |||||
| Pelvic pain: none or mild | 890 per 1000 | 852 per 1000 (727 to 927) | OR 0.71 (0.33 to 1.56) | 230 (2) | ⊕⊕⊝⊝ | |
| Dysmenorrhoea: none or mild Follow‐up: 6 months | 721 per 1000 | 650 per 1000 | OR 0.72 (0.39 to 1.33) | 214 | ⊕⊝⊝⊝ | |
| Dyspareunia: none or mild Follow‐up: 6 months | 889 per 1000 | 869 per 1000 | OR 0.83 (0.37 to 1.86) | 222 | ⊕⊝⊝⊝ | |
| Side effects: hirsutism Follow‐up: 6 months | 248 per 1000 | 464 per 1000 | OR 2.63 (1.60 to 4.32) | 302 | ⊕⊝⊝⊝ | I2 = 68% |
| Decreased breast size Follow‐up: 6 months | 477 per 1000 | 360 per 1000 | OR 0.62 (0.38 to 0.98) | 302 | ⊕⊕⊝⊝ | |
| Side effects: hot flushes Follow‐up: 6 months | 425 per 1000 | 368 per 1000 (270 to 482) | OR 0.79 (0.50 to 1.26) | 302 (2 studies) | ⊕⊝⊝⊝ | I2 = 72% |
| Side effects: acne Follow‐up: 6 months | 556 per 1000 | 644 per 1000 (529 to 744) | OR 1.45 (0.90 to 2.33) | 302 (2 studies) | ⊕⊕⊝⊝ | |
| *The basis for the assumed risk is the mean control group risk across studies. The corresponding risk (and its 95% confidence interval) is based on the assumed risk in the comparison group and the relative effect of the intervention (and its 95% CI) | ||||||
| GRADE Working Group grades of evidence | ||||||
| aAssessed in all randomised participants. Not all were symptomatic at baseline (although results show no significant differences in baseline symptoms between groups). Outcome therefore applies only to a select subgroup of participants: downgraded one level for serious indirectness bDowngraded one level for serious risk of bias associated with poor reporting of study methods, high attrition in one study, and high risk of other bias in both studies cImprecision of results (wide confidence intervals and/or few events), downgraded one level for serious imprecision dDowngraded one level for serious inconsistency | ||||||
| Gestrinone versus leuprolin for endometriosis | ||||||
| Patient or population: women with symptomatic endometriosis Settings: gynaecology clinic Intervention: progesterone receptor modulator (gestrinone) Comparison: leuprolin | ||||||
| Outcomes | Illustrative comparative risks* (95% CI) | Relative effect | No. of participants | Quality of the evidence | Comments | |
| Assumed risk | Corresponding risk | |||||
| Leuprolin | Gestrinone | |||||
| Dysmenorrhoea, verbal rating scale Follow‐up: 6 months | In control group, mean score for dysmenorrhoea on verbal rating scale was 0.04 points | Mean score in gestrinone group was 0.35 points higher (0.12 to 0.58 higher) | 55 | ⊕⊕⊝⊝ | Verbal rating scale defines dysmenorrhoea according to limitation of ability to work (mild = 1, moderate = 2, incapacitated = 3) | |
| Dyspareunia, verbal rating scale Follow‐up: 6 months | In control group, mean score for dyspareunia on verbal rating scale was 0.43 points | Mean score in gestrinone group was 0.33 points lower (0.62 to 0.04 lower) | 52 | ⊕⊕⊝⊝ | Verbal rating scale defines dyspareunia according to limitation of sexual activity (discomfort tolerated = 1; pain interrupts intercourse = 2, intercourse avoided owing to pain = 3) | |
| Amenorrhoea Follow‐up: 6 months | 962 per 1000 | 500 per 1000 | OR 0.04 (0.01 to 0.38) | 49 | ⊕⊕⊝⊝ | Only 55 events overall |
| Spotting or bleeding Follow‐up: 6 months | 38 per 1000 | 475 per 1000 | OR 22.92 (2.64 to 198.66) | 49 | ⊕⊕⊝⊝ | Only 12 events overall |
| Side effects: hot flushes Follow‐up: 6 months | 679 per 1000 | 297 per 1000 (112 to 571) | OR 0.20 (0.06 to 0.63) | 55 | ⊕⊕⊝⊝ | Only 27 events overall |
| *The basis for the assumed risk is the mean control group risk across studies. The corresponding risk (and its 95% confidence interval) is based on the assumed risk in the comparison group and the relative effect of the intervention (and its 95% CI). | ||||||
| GRADE Working Group grades of evidence | ||||||
| aDowngraded two levels for very serious imprecision: confidence intervals were compatible with no clinically meaningful difference between groups, or with small benefit in one group bDowngraded two levels for very serious imprecision: small overall sample size (n = 55) and low event rates | ||||||
| Outcome | Study | Comparison | Measure | Int group | Control group | P value | |
| Combined non‐pelvic pain, dysmenorrhoea, and dyspareunia | Asoprisnil: 5 mg (n = 31), 10 mg (n = 33), 25 mg (n = 32) Placebo (n = 34) | Mean reduction at 3 months on 0‐4 pain scale | 0.5 points for each dose | < 0.1 points | < 0.05 |
| Outcome or subgroup title | No. of studies | No. of participants | Statistical method | Effect size |
| 1 Dysmenorrhoea at 3 months Show forest plot | 1 | 352 | Odds Ratio (M‐H, Fixed, 95% CI) | 0.08 [0.04, 0.17] |
| 1.1 Mifepristone 2.5 mg | 1 | 114 | Odds Ratio (M‐H, Fixed, 95% CI) | 0.24 [0.09, 0.64] |
| 1.2 Mifepristone 5 mg | 1 | 120 | Odds Ratio (M‐H, Fixed, 95% CI) | 0.02 [0.00, 0.16] |
| 1.3 Mifepristone 10 mg | 1 | 118 | Odds Ratio (M‐H, Fixed, 95% CI) | 0.02 [0.00, 0.17] |
| 2 Dyspareunia at 3 months Show forest plot | 1 | 223 | Odds Ratio (M‐H, Fixed, 95% CI) | 0.23 [0.10, 0.51] |
| 2.1 Mifepristone 2.5 mg | 1 | 74 | Odds Ratio (M‐H, Fixed, 95% CI) | 0.62 [0.18, 2.13] |
| 2.2 Mifepristone 5 mg | 1 | 73 | Odds Ratio (M‐H, Fixed, 95% CI) | 0.04 [0.00, 0.40] |
| 2.3 Mifepristone 10 mg | 1 | 76 | Odds Ratio (M‐H, Fixed, 95% CI) | 0.13 [0.03, 0.60] |
| Outcome or subgroup title | No. of studies | No. of participants | Statistical method | Effect size |
| 1 Amenorrhoea at 3 months Show forest plot | 1 | Odds Ratio (M‐H, Fixed, 95% CI) | Subtotals only | |
| 1.1 Mifepristone all doses | 1 | 360 | Odds Ratio (M‐H, Fixed, 95% CI) | 686.16 [92.29, 5101.33] |
| 2 Amenorrhoea at 3 months: subgroup analysis Show forest plot | 1 | Odds Ratio (M‐H, Fixed, 95% CI) | Subtotals only | |
| 2.1 Mifepristone 2.5 mg | 1 | 180 | Odds Ratio (M‐H, Fixed, 95% CI) | 207.67 [27.50, 1568.36] |
| 2.2 Mifepristone 5 mg | 1 | 180 | Odds Ratio (M‐H, Fixed, 95% CI) | 3916.0 [348.75, 43971.52] |
| 2.3 Mifepristone 10 mg | 1 | 180 | Odds Ratio (M‐H, Fixed, 95% CI) | 3916.0 [348.75, 43971.52] |
| 3 Hot flushes at 3 months Show forest plot | 1 | Odds Ratio (M‐H, Fixed, 95% CI) | Subtotals only | |
| 3.1 Mifepristone all doses | 1 | 360 | Odds Ratio (M‐H, Fixed, 95% CI) | 28.79 [3.93, 210.73] |
| 4 Hot flushes at 3 months: subgroup analysis Show forest plot | 1 | Odds Ratio (M‐H, Fixed, 95% CI) | Subtotals only | |
| 4.1 Mifepristone 2.5 mg | 1 | 180 | Odds Ratio (M‐H, Fixed, 95% CI) | 19.24 [2.49, 148.54] |
| 4.2 Mifepristone 5 mg | 1 | 180 | Odds Ratio (M‐H, Fixed, 95% CI) | 23.82 [3.11, 182.24] |
| 4.3 Mifepristone 10 mg | 1 | 180 | Odds Ratio (M‐H, Fixed, 95% CI) | 46.76 [6.21, 351.92] |
| 5 Nausea at 3 months Show forest plot | 1 | 360 | Odds Ratio (M‐H, Fixed, 95% CI) | 1.72 [0.20, 15.03] |
| 5.1 Mifepristone 2.5 mg | 1 | 120 | Odds Ratio (M‐H, Fixed, 95% CI) | 0.0 [0.0, 0.0] |
| 5.2 Mifepristone 5 mg | 1 | 120 | Odds Ratio (M‐H, Fixed, 95% CI) | 1.02 [0.04, 25.76] |
| 5.3 Mifepristone 10 mg | 1 | 120 | Odds Ratio (M‐H, Fixed, 95% CI) | 2.44 [0.12, 48.60] |
| 6 Vomiting at 3 months Show forest plot | 1 | 360 | Odds Ratio (M‐H, Fixed, 95% CI) | 1.02 [0.10, 10.01] |
| 6.1 Mifepristone 2.5 mg | 1 | 120 | Odds Ratio (M‐H, Fixed, 95% CI) | 1.02 [0.04, 25.76] |
| 6.2 Mifepristone 5 mg | 1 | 120 | Odds Ratio (M‐H, Fixed, 95% CI) | 0.0 [0.0, 0.0] |
| 6.3 Mifepristone 10 mg | 1 | 120 | Odds Ratio (M‐H, Fixed, 95% CI) | 1.02 [0.04, 25.76] |
| 7 Fatigue/Tiredness at 3 months Show forest plot | 1 | 360 | Odds Ratio (M‐H, Fixed, 95% CI) | 5.48 [0.71, 42.27] |
| 7.1 Mifepristone 2.5 mg | 1 | 120 | Odds Ratio (M‐H, Fixed, 95% CI) | 3.92 [0.21, 73.08] |
| 7.2 Mifepristone 5 mg | 1 | 120 | Odds Ratio (M‐H, Fixed, 95% CI) | 0.0 [0.0, 0.0] |
| 7.3 Mifepristone 10 mg | 1 | 120 | Odds Ratio (M‐H, Fixed, 95% CI) | 7.11 [0.40, 125.92] |
| Outcome or subgroup title | No. of studies | No. of participants | Statistical method | Effect size |
| 1 Prevalence of dysmenorrhoea Show forest plot | 1 | Odds Ratio (M‐H, Fixed, 95% CI) | Subtotals only | |
| 1.1 2.5 mg vs 5 mg | 1 | 170 | Odds Ratio (M‐H, Fixed, 95% CI) | 0.85 [0.22, 3.29] |
| 1.2 5 mg vs 10 mg | 1 | 173 | Odds Ratio (M‐H, Fixed, 95% CI) | 1.22 [0.32, 4.71] |
| 2 Dysmenorrhoea score 0‐10 VAS scale Show forest plot | 1 | Mean Difference (IV, Fixed, 95% CI) | Totals not selected | |
| 2.1 5 mg vs 25 mg | 1 | Mean Difference (IV, Fixed, 95% CI) | 0.0 [0.0, 0.0] | |
| 3 Prevalence of dyspareunia Show forest plot | 1 | Odds Ratio (M‐H, Fixed, 95% CI) | Subtotals only | |
| 3.1 2.5 mg vs 5 mg | 1 | 108 | Odds Ratio (M‐H, Fixed, 95% CI) | 6.37 [0.74, 54.81] |
| 3.2 5 mg vs 10 mg | 1 | 109 | Odds Ratio (M‐H, Fixed, 95% CI) | 0.52 [0.05, 5.90] |
| 4 Dyspareunia score 0‐10 VAS scale Show forest plot | 1 | Mean Difference (IV, Fixed, 95% CI) | Totals not selected | |
| 4.1 5 mg vs 25 mg | 1 | Mean Difference (IV, Fixed, 95% CI) | 0.0 [0.0, 0.0] | |
| 5 Prevalence of pelvic pain Show forest plot | 1 | Odds Ratio (M‐H, Fixed, 95% CI) | Subtotals only | |
| 5.1 2.5 mg vs 5 mg | 1 | 110 | Odds Ratio (M‐H, Fixed, 95% CI) | 1.81 [0.63, 5.17] |
| 5.2 5 mg vs 10 mg | 1 | 120 | Odds Ratio (M‐H, Fixed, 95% CI) | 3.97 [0.79, 19.97] |
| 6 Prevalence of amenorrhoea Show forest plot | 2 | Odds Ratio (M‐H, Fixed, 95% CI) | Subtotals only | |
| 6.1 2.5 mg vs 5 mg | 1 | 180 | Odds Ratio (M‐H, Fixed, 95% CI) | 0.45 [0.21, 0.97] |
| 6.2 5 mg vs 10 mg | 1 | 180 | Odds Ratio (M‐H, Fixed, 95% CI) | 1.10 [0.47, 2.56] |
| 6.3 5 mg vs 25 mg | 1 | 26 | Odds Ratio (M‐H, Fixed, 95% CI) | 0.61 [0.08, 4.41] |
| 7 Prevalence of hot flushes Show forest plot | 2 | Odds Ratio (M‐H, Fixed, 95% CI) | Subtotals only | |
| 7.1 2.5 mg vs 5 mg | 1 | 180 | Odds Ratio (M‐H, Fixed, 95% CI) | 0.84 [0.38, 1.89] |
| 7.2 5 mg vs 10 mg | 1 | 180 | Odds Ratio (M‐H, Fixed, 95% CI) | 0.75 [0.35, 1.58] |
| 7.3 5 mg vs 25 mg | 1 | 26 | Odds Ratio (M‐H, Fixed, 95% CI) | 3.24 [0.12, 87.13] |
| 8 Prevalence of nausea Show forest plot | 1 | Odds Ratio (M‐H, Fixed, 95% CI) | Subtotals only | |
| 8.1 2.5 mg vs 5 mg | 1 | 180 | Odds Ratio (M‐H, Fixed, 95% CI) | 2.02 [0.18, 22.71] |
| 8.2 5 mg vs 10 mg | 1 | 180 | Odds Ratio (M‐H, Fixed, 95% CI) | 1.0 [0.06, 16.24] |
| 9 Prevalence of vomiting Show forest plot | 1 | Odds Ratio (M‐H, Fixed, 95% CI) | Subtotals only | |
| 9.1 2.5 mg vs 5 mg | 1 | 180 | Odds Ratio (M‐H, Fixed, 95% CI) | 3.03 [0.12, 75.46] |
| 9.2 5 mg vs 10 mg | 1 | 180 | Odds Ratio (M‐H, Fixed, 95% CI) | 0.33 [0.01, 8.20] |
| 10 Prevalence of fatigue/tiredness Show forest plot | 1 | Odds Ratio (M‐H, Fixed, 95% CI) | Subtotals only | |
| 10.1 2.5 mg vs 5 mg | 1 | 180 | Odds Ratio (M‐H, Fixed, 95% CI) | 13.92 [0.77, 250.94] |
| 10.2 5 mg vs 10 mg | 1 | 180 | Odds Ratio (M‐H, Fixed, 95% CI) | 0.03 [0.00, 0.54] |
| 11 Prevalence of endometrial thickness > 20 mm Show forest plot | 1 | Odds Ratio (M‐H, Fixed, 95% CI) | Subtotals only | |
| 11.1 5 mg vs 25 mg | 1 | 26 | Odds Ratio (M‐H, Fixed, 95% CI) | 1.41 [0.28, 7.13] |
| Outcome or subgroup title | No. of studies | No. of participants | Statistical method | Effect size |
| 1 None or mild pelvic pain Show forest plot | 2 | 230 | Odds Ratio (M‐H, Fixed, 95% CI) | 0.71 [0.33, 1.56] |
| 2 None or mild dysmenorrhoea Show forest plot | 2 | 214 | Odds Ratio (M‐H, Fixed, 95% CI) | 0.72 [0.39, 1.33] |
| 3 None or mild dyspareunia Show forest plot | 2 | 222 | Odds Ratio (M‐H, Fixed, 95% CI) | 0.83 [0.37, 1.86] |
| 4 Adverse effects Show forest plot | 2 | Odds Ratio (M‐H, Fixed, 95% CI) | Subtotals only | |
| 4.1 Acne | 2 | 302 | Odds Ratio (M‐H, Fixed, 95% CI) | 1.45 [0.90, 2.33] |
| 4.2 Seborrhoea | 2 | 302 | Odds Ratio (M‐H, Fixed, 95% CI) | 2.73 [1.67, 4.46] |
| 4.3 Hirsutism | 2 | 302 | Odds Ratio (M‐H, Fixed, 95% CI) | 2.63 [1.60, 4.32] |
| 4.4 Voice problems | 2 | 302 | Odds Ratio (M‐H, Fixed, 95% CI) | 0.70 [0.34, 1.43] |
| 4.5 Swelling hands/feet | 1 | 264 | Odds Ratio (M‐H, Fixed, 95% CI) | 1.40 [0.82, 2.38] |
| 4.6 Hot flushes | 2 | 302 | Odds Ratio (M‐H, Fixed, 95% CI) | 0.79 [0.50, 1.26] |
| 4.7 Decreased breast size | 2 | 302 | Odds Ratio (M‐H, Fixed, 95% CI) | 0.62 [0.38, 0.98] |
| 4.8 Leg or muscle cramps | 2 | 302 | Odds Ratio (M‐H, Fixed, 95% CI) | 0.49 [0.30, 0.78] |
| 4.9 Headache | 1 | 264 | Odds Ratio (M‐H, Fixed, 95% CI) | 1.36 [0.84, 2.21] |
| 4.10 Nausea | 2 | 302 | Odds Ratio (M‐H, Fixed, 95% CI) | 1.36 [0.84, 2.19] |
| 4.11 Vomiting | 1 | 264 | Odds Ratio (M‐H, Fixed, 95% CI) | 0.67 [0.32, 1.43] |
| 4.12 Loss of appetite | 1 | 264 | Odds Ratio (M‐H, Fixed, 95% CI) | 1.31 [0.72, 2.37] |
| 4.13 Hunger | 1 | 264 | Odds Ratio (M‐H, Fixed, 95% CI) | 0.59 [0.36, 0.97] |
| 4.14 Dizziness | 1 | 264 | Odds Ratio (M‐H, Fixed, 95% CI) | 1.24 [0.75, 2.05] |
| 4.15 Tiredness | 1 | 264 | Odds Ratio (M‐H, Fixed, 95% CI) | 1.44 [0.84, 2.45] |
| 4.16 Faintness | 1 | 264 | Odds Ratio (M‐H, Fixed, 95% CI) | 1.23 [0.54, 2.76] |
| 4.17 Skin rash | 1 | 264 | Odds Ratio (M‐H, Fixed, 95% CI) | 1.71 [0.91, 3.20] |
| 4.18 Weight gain | 1 | 38 | Odds Ratio (M‐H, Fixed, 95% CI) | 0.34 [0.09, 1.27] |
| 4.19 Vaginal dryness | 1 | 38 | Odds Ratio (M‐H, Fixed, 95% CI) | 0.18 [0.01, 4.00] |
| 4.20 Raised liver transaminases | 1 | 38 | Odds Ratio (M‐H, Fixed, 95% CI) | 0.18 [0.01, 4.00] |
| Outcome or subgroup title | No. of studies | No. of participants | Statistical method | Effect size |
| 1 Painful periods, visual analogue scale Show forest plot | 1 | 55 | Mean Difference (IV, Fixed, 95% CI) | 0.82 [0.15, 1.49] |
| 2 Painful periods, verbal rating scale Show forest plot | 1 | 55 | Mean Difference (IV, Fixed, 95% CI) | 0.35 [0.12, 0.58] |
| 3 Pain on intercourse, visual analogue scale Show forest plot | 1 | 52 | Mean Difference (IV, Fixed, 95% CI) | ‐1.16 [‐2.08, ‐0.24] |
| 4 Pain on intercourse, verbal rating scale Show forest plot | 1 | 52 | Mean Difference (IV, Fixed, 95% CI) | ‐0.33 [‐0.62, ‐0.04] |
| 5 Non‐menstrual pain, visual analogue scale Show forest plot | 1 | 55 | Mean Difference (IV, Fixed, 95% CI) | ‐0.41 [‐1.76, 0.94] |
| 6 Side effects Show forest plot | 1 | 813 | Odds Ratio (M‐H, Fixed, 95% CI) | 0.65 [0.42, 1.01] |
| 6.1 Seborrhoea | 1 | 55 | Odds Ratio (M‐H, Fixed, 95% CI) | 3.23 [0.13, 82.71] |
| 6.2 Swelling hands/feet | 1 | 55 | Odds Ratio (M‐H, Fixed, 95% CI) | 5.59 [0.26, 121.96] |
| 6.3 Hot flushes | 1 | 55 | Odds Ratio (M‐H, Fixed, 95% CI) | 0.20 [0.06, 0.63] |
| 6.4 Leg or muscle cramps | 1 | 55 | Odds Ratio (M‐H, Fixed, 95% CI) | 0.33 [0.01, 8.55] |
| 6.5 Headache | 1 | 55 | Odds Ratio (M‐H, Fixed, 95% CI) | 0.20 [0.06, 0.63] |
| 6.6 Nausea | 1 | 55 | Odds Ratio (M‐H, Fixed, 95% CI) | 1.04 [0.06, 17.49] |
| 6.7 Dizziness | 1 | 55 | Odds Ratio (M‐H, Fixed, 95% CI) | 2.16 [0.18, 25.32] |
| 6.8 Skin rash | 1 | 55 | Odds Ratio (M‐H, Fixed, 95% CI) | 3.23 [0.13, 82.71] |
| 6.9 Vaginal dryness | 1 | 55 | Odds Ratio (M‐H, Fixed, 95% CI) | 0.19 [0.01, 4.21] |
| 6.10 Mood changes | 1 | 55 | Odds Ratio (M‐H, Fixed, 95% CI) | 0.67 [0.10, 4.34] |
| 6.11 Joint pain | 1 | 55 | Odds Ratio (M‐H, Fixed, 95% CI) | 2.16 [0.18, 25.32] |
| 6.12 Drowsiness | 1 | 55 | Odds Ratio (M‐H, Fixed, 95% CI) | 2.16 [0.18, 25.32] |
| 6.13 Tachycardia | 1 | 55 | Odds Ratio (M‐H, Fixed, 95% CI) | 1.04 [0.06, 17.49] |
| 6.14 Amenorrhoea | 1 | 49 | Odds Ratio (M‐H, Fixed, 95% CI) | 0.04 [0.01, 0.38] |
| 6.15 Spotting or bleeding | 1 | 49 | Odds Ratio (M‐H, Fixed, 95% CI) | 22.92 [2.64, 198.66] |
| Outcome or subgroup title | No. of studies | No. of participants | Statistical method | Effect size |
| 1 improvement in pain Show forest plot | 1 | 10 | Odds Ratio (M‐H, Fixed, 95% CI) | 0.27 [0.01, 8.46] |
| 2 Side effect Show forest plot | 1 | Odds Ratio (M‐H, Fixed, 95% CI) | Subtotals only | |
| 2.1 Noted any side effect | 1 | 12 | Odds Ratio (M‐H, Fixed, 95% CI) | 0.04 [0.00, 1.12] |
| 2.2 Discontinued because of headaches | 1 | 12 | Odds Ratio (M‐H, Fixed, 95% CI) | 0.28 [0.01, 8.42] |
| 2.3 Irregular bleeding | 1 | 12 | Odds Ratio (M‐H, Fixed, 95% CI) | 2.5 [0.16, 38.60] |