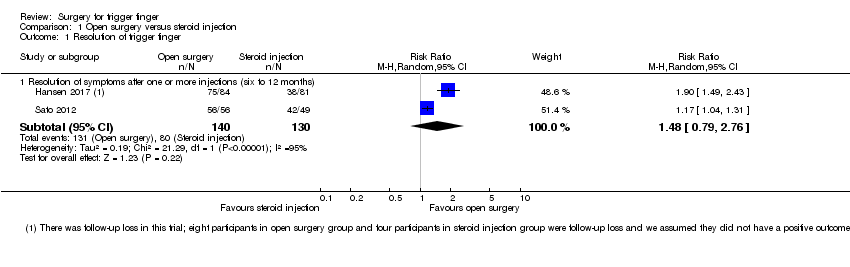
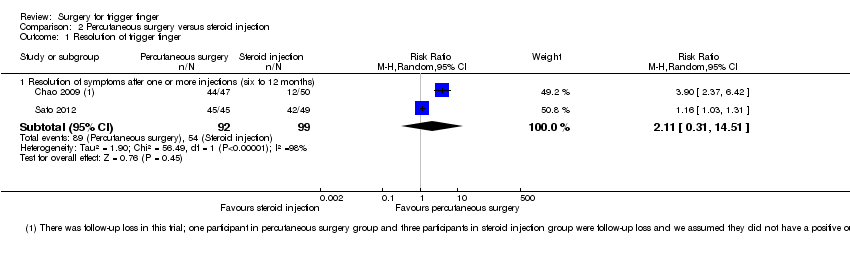
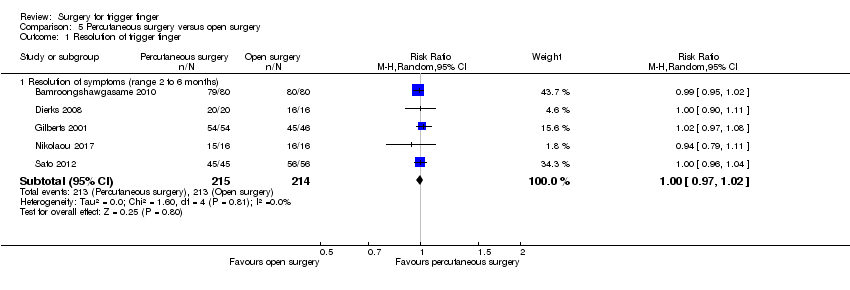
| 1 Resolution of trigger finger Show forest plot | 2 | | Risk Ratio (M‐H, Random, 95% CI) | Subtotals only |
|
| 1.1 Resolution of symptoms after one or more injections (six to 12 months) | 2 | 191 | Risk Ratio (M‐H, Random, 95% CI) | 2.11 [0.31, 14.51] |
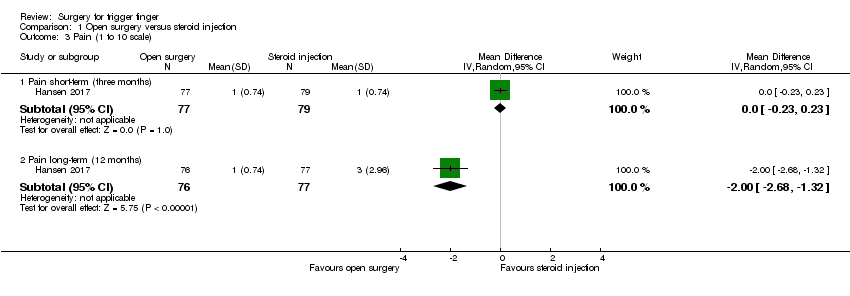
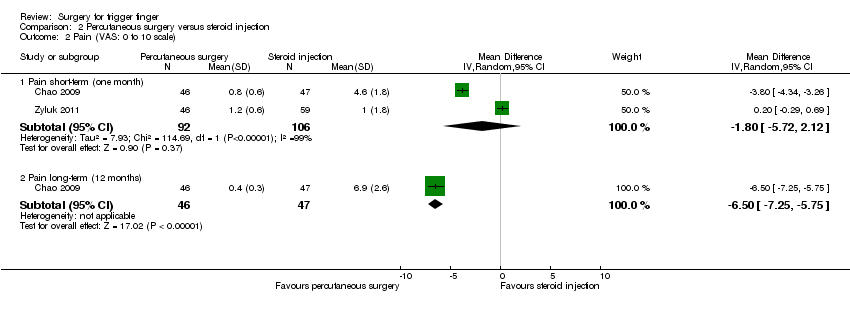
| 2 Pain (VAS: 0 to 10 scale) Show forest plot | 2 | | Mean Difference (IV, Random, 95% CI) | Subtotals only |
|
| 2.1 Pain short‐term (one month) | 2 | 198 | Mean Difference (IV, Random, 95% CI) | ‐1.80 [‐5.72, 2.12] |
| 2.2 Pain long‐term (12 months) | 1 | 93 | Mean Difference (IV, Random, 95% CI) | ‐6.5 [‐7.25, ‐5.75] |
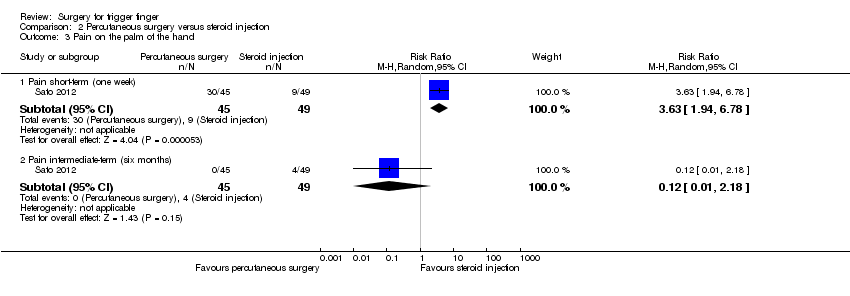
| 3 Pain on the palm of the hand Show forest plot | 1 | | Risk Ratio (M‐H, Random, 95% CI) | Subtotals only |
|
| 3.1 Pain short‐term (one week) | 1 | 94 | Risk Ratio (M‐H, Random, 95% CI) | 3.63 [1.94, 6.78] |
| 3.2 Pain intermediate‐term (six months) | 1 | 94 | Risk Ratio (M‐H, Random, 95% CI) | 0.12 [0.01, 2.18] |
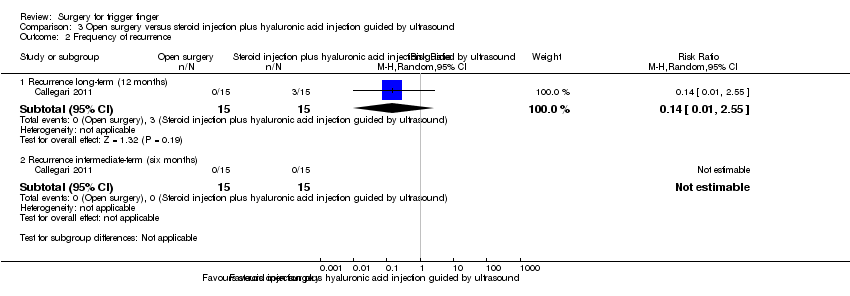
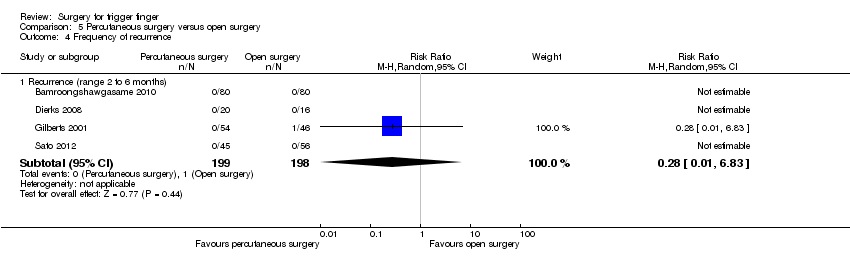
| 4 Frequency of recurrence Show forest plot | 5 | | Risk Ratio (M‐H, Random, 95% CI) | Subtotals only |
|
| 4.1 Recurrence (range six to 12 months) | 5 | 392 | Risk Ratio (M‐H, Random, 95% CI) | 0.57 [0.21, 1.59] |
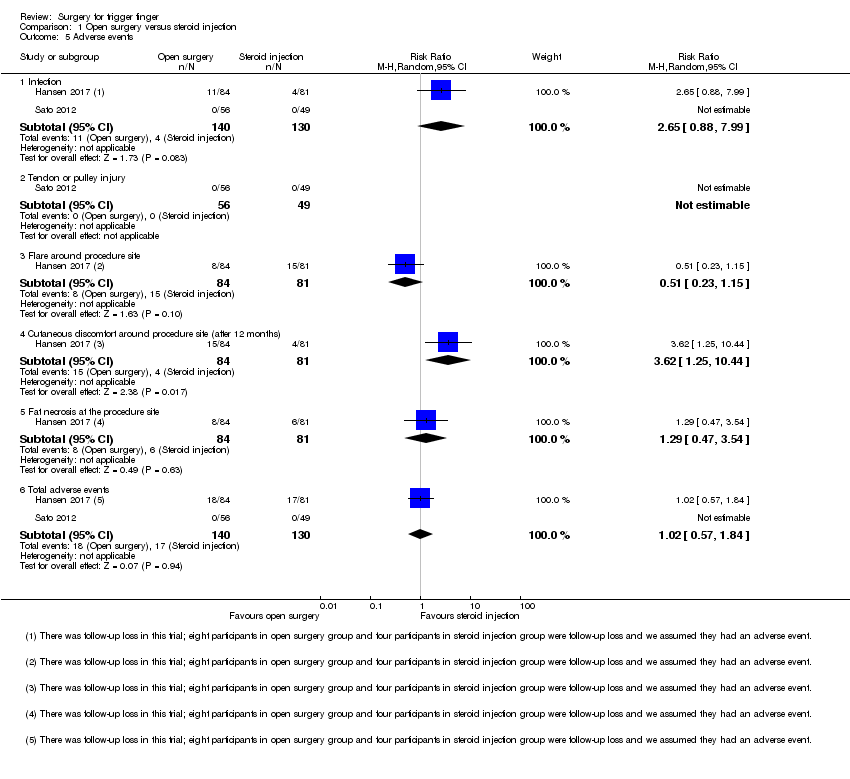
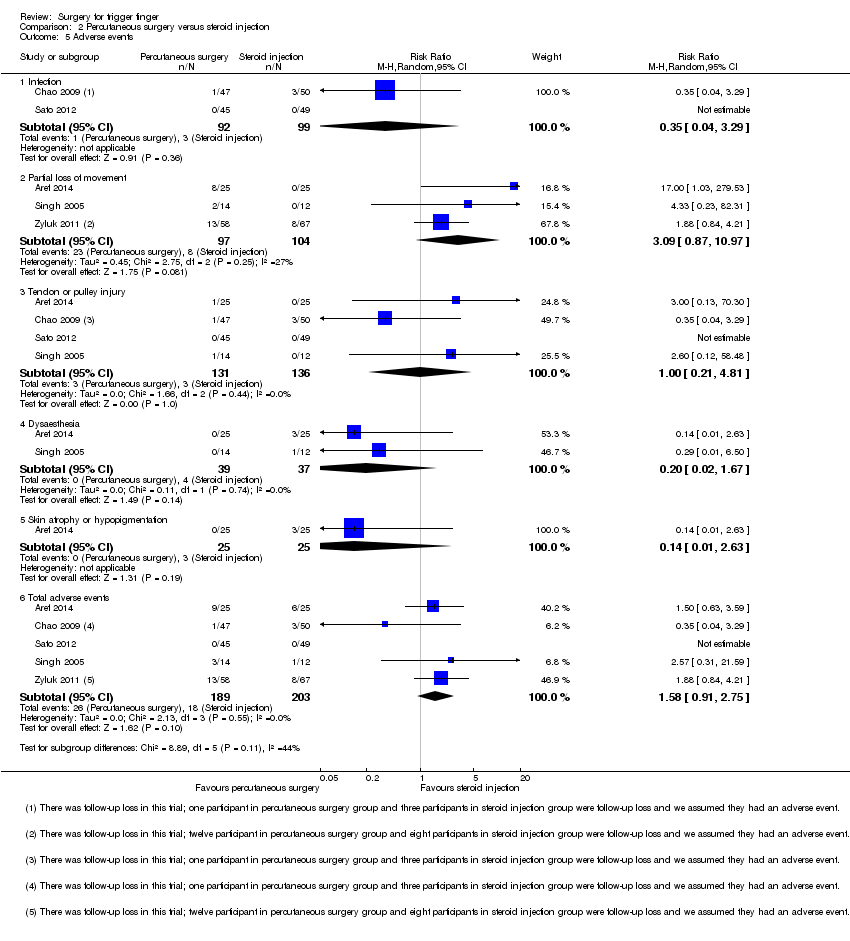
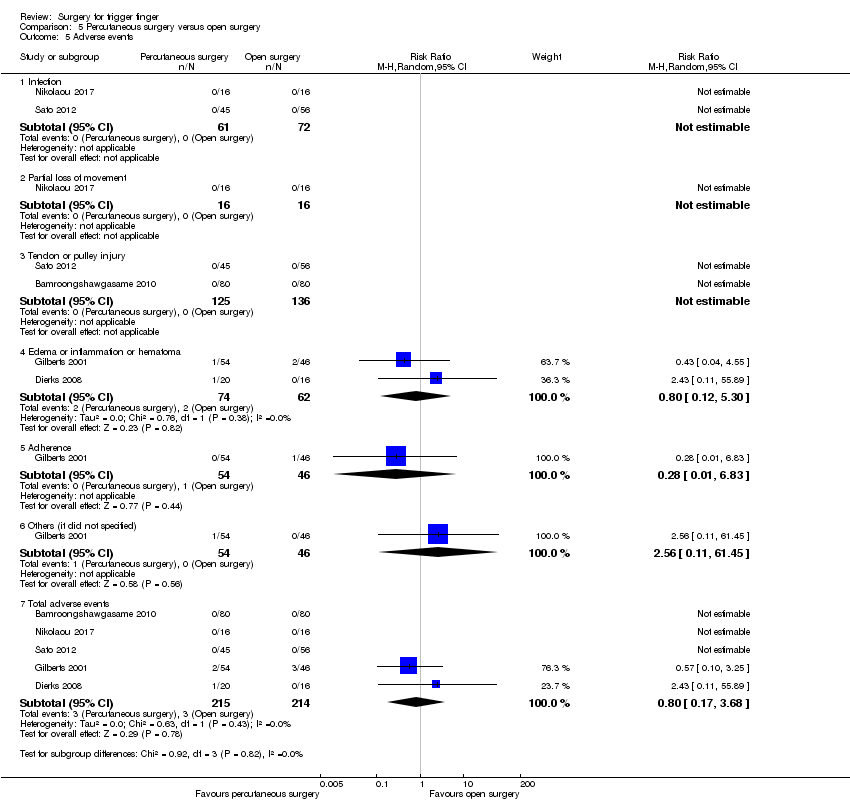
| 5 Adverse events Show forest plot | 5 | | Risk Ratio (M‐H, Random, 95% CI) | Subtotals only |
|
| 5.1 Infection | 2 | 191 | Risk Ratio (M‐H, Random, 95% CI) | 0.35 [0.04, 3.29] |
| 5.2 Partial loss of movement | 3 | 201 | Risk Ratio (M‐H, Random, 95% CI) | 3.09 [0.87, 10.97] |
| 5.3 Tendon or pulley injury | 4 | 267 | Risk Ratio (M‐H, Random, 95% CI) | 1.00 [0.21, 4.81] |
| 5.4 Dysaesthesia | 2 | 76 | Risk Ratio (M‐H, Random, 95% CI) | 0.20 [0.02, 1.67] |
| 5.5 Skin atrophy or hypopigmentation | 1 | 50 | Risk Ratio (M‐H, Random, 95% CI) | 0.14 [0.01, 2.63] |
| 5.6 Total adverse events | 5 | 392 | Risk Ratio (M‐H, Random, 95% CI) | 1.58 [0.91, 2.75] |
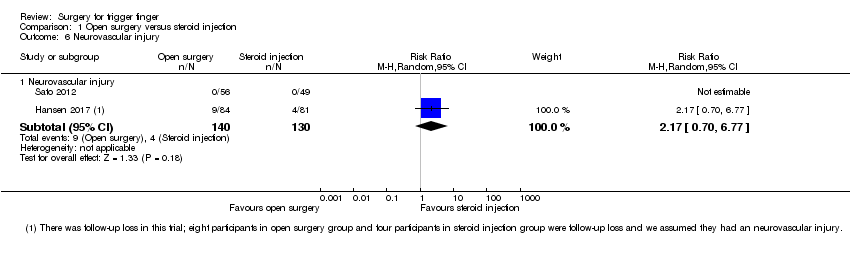
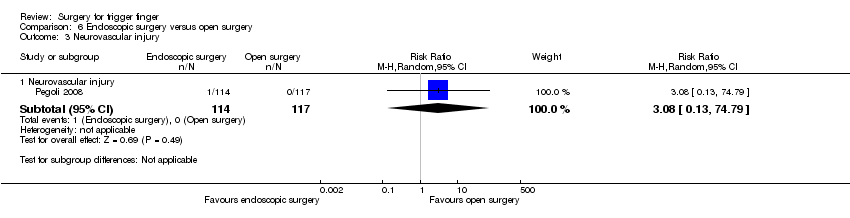
| 6 Neurovascular injury Show forest plot | 2 | | Risk Ratio (M‐H, Random, 95% CI) | Subtotals only |
|
| 6.1 Neurovascular injury | 2 | 191 | Risk Ratio (M‐H, Random, 95% CI) | 0.35 [0.04, 3.29] |
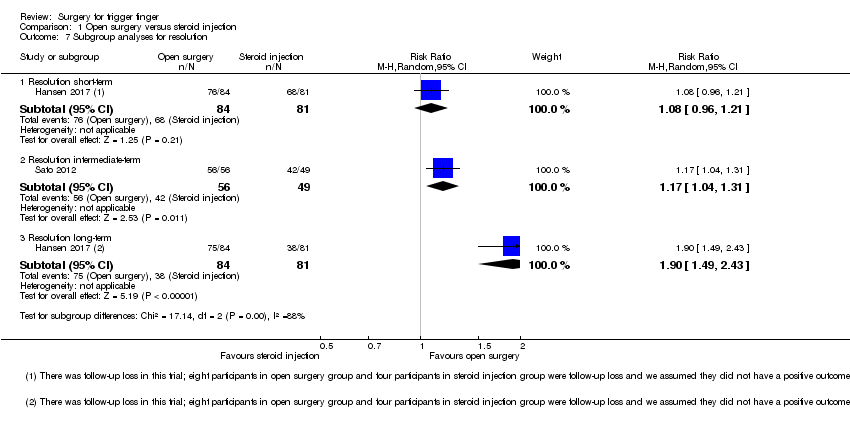
| 7 Subgroup analyses for resolution Show forest plot | 2 | | Risk Ratio (M‐H, Random, 95% CI) | Subtotals only |
|
| 7.1 Resolution short‐term | 1 | 97 | Risk Ratio (M‐H, Random, 95% CI) | 2.18 [1.55, 3.05] |
| 7.2 Resolution intermediate‐term | 1 | 94 | Risk Ratio (M‐H, Random, 95% CI) | 1.16 [1.03, 1.31] |
| 7.3 Resolution long‐term | 1 | 97 | Risk Ratio (M‐H, Random, 95% CI) | 3.90 [2.37, 6.42] |
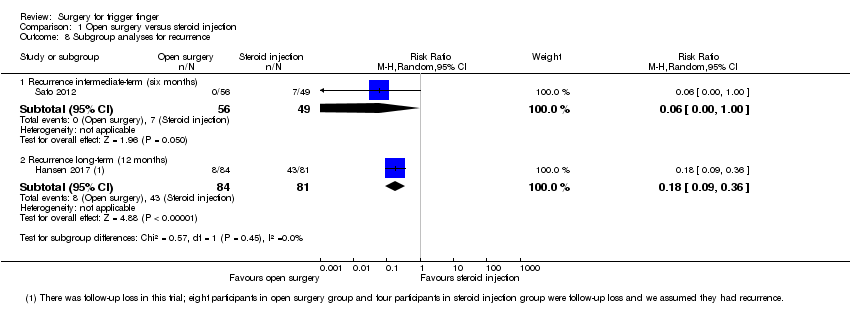
| 8 Subgroup analyses for recurrence Show forest plot | 5 | | Risk Ratio (M‐H, Random, 95% CI) | Subtotals only |
|
| 8.1 Recurrence short‐term (one month) | 1 | 125 | Risk Ratio (M‐H, Random, 95% CI) | 1.73 [0.76, 3.94] |
| 8.2 Recurrence intermediate‐term (six months) | 2 | 219 | Risk Ratio (M‐H, Random, 95% CI) | 0.37 [0.02, 5.50] |
| 8.3 Recurrence long‐term (range nine to 12 months) | 3 | 173 | Risk Ratio (M‐H, Random, 95% CI) | 0.55 [0.10, 2.99] |