比较家庭或寄养家庭护理与机构长期护理对功能障碍的老年人的影响
Referencias
References to studies included in this review
References to studies excluded from this review
Additional references
References to other published versions of this review
Characteristics of studies
Characteristics of included studies [ordered by study ID]
Ir a:
| Methods | Study design: nested case‐control study | |
| Participants | Participants: N = 98 (Control N = 49; Intervention: N = 49) Mean age: Control: 79.9 years, Intervention: 81.6 years Gender: Control: 57% female, intervention: 80% female Setting: Hawaii | |
| Interventions | Type of intervention: care in participant's own home Description of the intervention: participants receiving care in their own home from the Nursing Home Without Walls Program. Nursing Home Without Walls (NHWW) provides an array of services including case management, skilled nursing, personal care, adult day health, home delivered meals, nutritional counselling, transportation, respite, emergency alarms, moving assistance, rehabilitation, home maintenance, environmental modifications, homemakers Control: nursing home care | |
| Outcomes | Happiness at 3 months; physical function at 3 months (ADL) | |
| Notes | Study supported by the Hawaii Department of Social Services and Housing; and the Henry J Kaiser Foundation (California, USA) | |
| Risk of bias | ||
| Bias | Authors' judgement | Support for judgement |
| Random sequence generation (selection bias) | High risk | Non‐randomised trial. Notes from text: since agency procedures did not permit random assignment to placement settings, sample groups were selected. Intermediate Care Facility patients ≥ 55 years of age who staying in one of the three settings for 3 months were considered. They were then matched on ADL, mobility and orientation scores. |
| Allocation concealment (selection bias) | High risk | No allocation concealment used |
| Blinding of participants and personnel (performance bias) | Unclear risk | It is unclear if the staff delivering care or the participants were aware of the study. |
| Blinding of outcome assessment (detection bias) | Low risk | N/A ‐ no objective outcomes |
| Blinding of outcome assessment (detection bias) | Unclear risk | Data obtained from self‐report surveys |
| Incomplete outcome data (attrition bias) | Low risk | Follow‐up rate was either 100% or 88% for all outcomes |
| Selective reporting (reporting bias) | Low risk | All outcomes reported |
| Baseline measures | Unclear risk | The participants in each group were matched based on ADL, mobility and orientation. Across groups, age, ADL and mobility are similar |
| Free of contamination | Low risk | No crossover |
| Other bias | High risk | Possible reverse causality |
| Methods | Study design: non‐randomised trial | |
| Participants | Participants: N = 352 (Control: 131; Intervention: 221 [foster care N = 138, home care N = 83]) Mean age: Control: 79.85 years, Intervention: 78.83 years Gender: Control: 62% female, Intervention: 63% female. Setting: Hawaii | |
| Interventions | Type of intervention: foster home care or care at home Description of the intervention: care provided in a foster home setting with comprehensive Intermediate Care Facility home services. Control: nursing home care | |
| Outcomes | Mortality at 6 months, change in ADL at 6 months using Katz Index of ADLs | |
| Notes | Baseline imbalances include reduced prevalence of dementia in those allocated to care in community. Note: patients received foster care or care in their own home. Care in their own home was provided by Nursing Without Walls. Case managers arrange a package of services for the family, most commonly personal care, chore service, meals, home modifications, and transportation. In all, the study involved 131 patients in 10 nursing homes, 138 patients in 98 foster homes, and 83 patients in their own homes, for a total of 352 patients. In this case the intervention arm data combined both foster and home care, with most data coming from foster care and thus, we could not include the results for analysis in the comparison of home care with nursing care. Study supported by the Hawaii Department of Social Services and Housing; and the Henry J Kaiser Foundation (California, USA) | |
| Risk of bias | ||
| Bias | Authors' judgement | Support for judgement |
| Random sequence generation (selection bias) | High risk | This is not a randomised trial. As described, the study uses a 2‐step Heckman procedure to further control for selection bias before comparing outcomes of 352 patients in nursing homes and community care. |
| Allocation concealment (selection bias) | High risk | No allocation concealment used |
| Blinding of participants and personnel (performance bias) | High risk | Participants had to provide informed consent, so they were likely unblinded. Unclear if personnel were aware of study |
| Blinding of outcome assessment (detection bias) | Low risk | Data obtained from medical records |
| Blinding of outcome assessment (detection bias) | Unclear risk | Data obtained from self‐report survey Unclear if the personnel were aware of the study purpose or if this was similar to routinely collected data. All data were collected by 2 hospital staff members (one fluent in Japanese) within a few days of admission to the long‐term care setting by observing and interviewing patients, reviewing charts, and discussing patient physical function with formal and informal caregivers. |
| Incomplete outcome data (attrition bias) | Unclear risk | For mortality this would be low as data is available for all participants; however, it would be high for physical function. Timing of and reason for discharge were available for all 352 members of the sample. Six‐month ADL and mobility scores were available for the 220 patients still in placement at the end of 6 months: 54 (65%) in Nursing Home Without Walls, 80 (58%) in foster care, and 86 (65%) in nursing homes. |
| Selective reporting (reporting bias) | Low risk | All outcomes reported |
| Baseline measures | High risk | Groups differed at baseline on several factors, including ethnicity and comorbidities such as dementia, cancer and musculoskeletal diagnoses, as well as baseline levels of medications used, ADL function and mobility levels. |
| Free of contamination | Low risk | No crossover |
| Other bias | High risk | Possibility of reverse casualty |
| Methods | Study design: non‐randomised trial | |
| Participants | Participants: N = 214 (Control: 113; Intervention: 101) Mean age: Control: 81 years; Control: 80 years Gender: Control: 65% female; Intervention: 64% female Setting: UK | |
| Interventions | Type of intervention: care in own home Description of the intervention: people receiving care in their own home from the Darlington Care Project. Darlington Care Project: case management service, which could include any number of medical services based on client needs (speech therapy, stoma care, catheter care, change of dressing). Personal care (bathing, dressing, toileting, feeding, hand/nail care), physical care, (assist with walking, lifting/transferring). Social and recreational activities and therapeutic exercises Control: long‐stay care wards | |
| Outcomes | Mortality at 6 and 12 months, subjective well‐being at 6 months | |
| Notes | Increased social disturbance in participants allocated to nursing home care, increased length of stay for control patients No information about funding sources. | |
| Risk of bias | ||
| Bias | Authors' judgement | Support for judgement |
| Random sequence generation (selection bias) | High risk | Non‐randomised trial. The study compared individual cases receiving services from the project group with a similar group of patients in LTC in adjacent health districts. Groups were not randomly allocated to receive a particular intervention. |
| Allocation concealment (selection bias) | High risk | No allocation to conceal |
| Blinding of participants and personnel (performance bias) | High risk | Personnel and participants in the home care group were likely unblinded as part of the Darlington Care Project. |
| Blinding of outcome assessment (detection bias) | Low risk | Data obtained from medical records |
| Blinding of outcome assessment (detection bias) | Unclear risk | Data obtained from self‐report surveys |
| Incomplete outcome data (attrition bias) | Unclear risk | 100% of data participant data available on mortality; however, likely high risk for quality of life with less than 60% of cases providing data |
| Selective reporting (reporting bias) | Low risk | All outcomes reported |
| Baseline measures | Unclear risk | Age and disability appear similar at baseline; however, there may be difference in social disturbance and length of stay indicating a possible selection effect |
| Free of contamination | Low risk | No crossover |
| Other bias | High risk | Potential for baseline confounding |
| Methods | Study design: non‐randomised trial | |
| Participants | Participants: N = 474 (Control: HCBC, N = 144; FC, N = 264; Intervention: N = 66) Mean age: 71.2 years Gender: 46% female Participants were included if they had had a stroke Setting: Taiwan | |
| Interventions | Type of intervention: care in the community Description of the intervention: people receiving care in the community. This was either respite care, day care, home maker services or care provided by a live‐in personal helper Control: nursing home care | |
| Outcomes | Mortality at 6 months, physical function at 6 months | |
| Notes | This study was longitudinal and classified patients into groups depending on the type of care they had received in the previous 6 months. There were 3 categories of care: institution (INS), home‐ or community‐based care (HCBC), and family care (FC). Since family care was defined as only receiving care solely by a family member with no formal care services, this group was not included for analysis in the main comparison. Study supported by the National Health Research Institute, Taiwan | |
| Risk of bias | ||
| Bias | Authors' judgement | Support for judgement |
| Random sequence generation (selection bias) | High risk | Non‐randomised trial. This study used a longitudinal quasi‐experimental study design following stroke patients 6 months after discharge |
| Allocation concealment (selection bias) | High risk | Participants were allocated based on their self‐report of LTC received during the telephone survey |
| Blinding of participants and personnel (performance bias) | High risk | Hospitals and patients were unblinded to study. Page 67‐68: "formal approvals of the study were obtained from the hospitals. Patients and their families were given a written statements describing the purpose of the study". It is unclear if formal care providers were blinded. |
| Blinding of outcome assessment (detection bias) | Low risk | Data obtained from medical records |
| Blinding of outcome assessment (detection bias) | Unclear risk | Data obtained from self‐report surveys |
| Incomplete outcome data (attrition bias) | Low risk | It appears that 100% of data provided for mortality |
| Selective reporting (reporting bias) | Low risk | All outcomes reported |
| Baseline measures | Unclear risk | Unclear |
| Free of contamination | Low risk | No crossover |
| Other bias | High risk | Potential for residual confounding |
| Methods | Study design: observational cohort study, data set | |
| Participants | Participants: N = 694 (Control: N = 477 [special accommodation: N = 269], Intervention N = 402 [home care: N = 425]) Mean age: 80 years Gender: 65% female Participanst were included if they had one or more hospital admission during the year 2001, were aged 65 years or older and received long‐term care and services from the municipality Setting: Sweden | |
| Interventions | Type of intervention: care in own home Description of the intervention: participants receiving at least 4 visits per month in their home from care services. Help with laundry, shopping, cleaning, and personal care. Excluded meals on wheels or transport services Control: nursing home care | |
| Outcomes | Hospital visits and outpatient usage at 1 year; physical function (assessed using ADL staircase); general health (assessed using a 6‐item health complaints questionnaire); mental health (assessed using the Berger scale) Data were collected by means of a form completed by Registered Nurses, assistant officers, physiotherapists, or occupational therapists. The form comprises questions concerning demographic data, physical function, health complaints, adaptation and standard of housing and formal and informal care. | |
| Notes | Baseline imbalances included younger age and less dependency in those living at home Study supported by the Vardal Institute (Sweden); the Swedish Institute for Health Sciences; and the Faculty of Medicine, Unit of Caring Sciences, Lund University, Sweden | |
| Risk of bias | ||
| Bias | Authors' judgement | Support for judgement |
| Random sequence generation (selection bias) | High risk | Not a randomised trial. Using routinely collected data within an existing data set |
| Allocation concealment (selection bias) | High risk | No allocation methods used. |
| Blinding of participants and personnel (performance bias) | Unclear risk | Unclear if consent was obtained for this study. Since this is just an analysis of an existing data set, it is unlikely that participants are aware of this study. |
| Blinding of outcome assessment (detection bias) | Unclear risk | Data from medical records. Data were collected as part of another national study on ageing ‐ unlikely data collection team were aware of this study aim |
| Blinding of outcome assessment (detection bias) | Unclear risk | Data obtained from self‐report surveys |
| Incomplete outcome data (attrition bias) | Low risk | All outcomes reported |
| Selective reporting (reporting bias) | Low risk | All outcomes of interest were reported. |
| Baseline measures | High risk | Participant characteristics differed between groups. Participants that received care at home were younger, lived with someone, less dependent and less depressed mood. |
| Free of contamination | Low risk | No crossover |
| Other bias | High risk | Possibility of reverse causality |
| Methods | Study design: non‐randomised trial | |
| Participants | Participants N =195. (Control: N = 87; Intervention: N = 108) Mean age: 65.6 years Gender: All patients were male Setting: USA | |
| Interventions | Type of intervention: care in own home Description of the intervention: participants receiving care in their own home from a home care team including physician, nurse, dietician and social worker as a minimum. Medical care and ancillary services in participant's own home. A potential caregiver (friend, relative, or hired caretaker) must be living in the patient's home and able to assume responsibility for care. Control: nursing home care | |
| Outcomes | Disability at 3 months using functional status index | |
| Notes | Partially supported by a doctoral training grant from the Department of Medicine and Surgery, Veterans Administration (USA) | |
| Risk of bias | ||
| Bias | Authors' judgement | Support for judgement |
| Random sequence generation (selection bias) | High risk | Non‐randomised trial (page 443). As random assignment of participant could not be achieved, it was necessary to control for differences in initial health status; the VA hospitals were not chosen randomly. |
| Allocation concealment (selection bias) | High risk | No allocation methods used |
| Blinding of participants and personnel (performance bias) | Unclear risk | Unclear. it is not reported if participants knew of the study or its aims |
| Blinding of outcome assessment (detection bias) | Unclear risk | N/A ‐ no objective outcomes |
| Blinding of outcome assessment (detection bias) | Unclear risk | Data from self‐report survey. It is not reported if the social workers collecting the data were blinded to study aims |
| Incomplete outcome data (attrition bias) | Low risk | The total sample was 195, not one of whom was lost to follow‐up. |
| Selective reporting (reporting bias) | Low risk | All outcomes reported |
| Baseline measures | Low risk | Adjustments made, including for initial health status |
| Free of contamination | Low risk | No crossover |
| Other bias | High risk | Potential for residual confounding |
| Methods | Study design: randomised trial | |
| Participants | Participants: N = 112 (Control: N = 53; Intervention: N = 59) Meand age: Control: 69.8 years, Intervention: 70.2 years Gender: Control 64.2% female, Intervention 64.6% female Setting: USA | |
| Interventions | Type of intervention: care in foster home Description of the intervention: people living in a foster home setting. Caregivers provided the patient with meals, laundry, assistance with personal and instrumental ADLS, 24‐hour supervision and nursing tasks as needed (e.g. monitoring medication, injections and behavioural modification) Control: nursing home care | |
| Outcomes | all outcomes were measured at 12 months, Mortality, attitudes‐life satisfaction, attitudes‐perceived health, physical function, basic ADL and instrumental ADL, mental status | |
| Notes | Study supported by the Robert Wood Johnson Foundation, USA | |
| Risk of bias | ||
| Bias | Authors' judgement | Support for judgement |
| Random sequence generation (selection bias) | Unclear risk | Unclear how the random sequence was generated |
| Allocation concealment (selection bias) | Low risk | Random sequence was placed in sealed envelopes and opened in sequence by a blinded research assistance once a patient was deemed eligible (page 1506). |
| Blinding of participants and personnel (performance bias) | Unclear risk | No blinding of participants. Unclear if personnel were aware of study aim. |
| Blinding of outcome assessment (detection bias) | Low risk | Data obtained from medical records |
| Blinding of outcome assessment (detection bias) | Unclear risk | Data obtained from self‐report survey. It is not reported if the social workers collecting the data were blinded to study aims. |
| Incomplete outcome data (attrition bias) | High risk | 22% loss to follow‐up |
| Selective reporting (reporting bias) | Unclear risk | All outcomes reported but no means or measures of variability reported for any outcome |
| Baseline measures | High risk | Groups were different at baseline on ethnicity and marital status, which could influence outcome |
| Free of contamination | Low risk | No crossover |
| Other bias | Low risk | Randomised trial. Note: only 20% of the eligible sample agreed to participate in the study |
| Methods | Study design: observational cohort study | |
| Participants | Participants: N = 98 (Control: N = 49, Intervention: N = 49) Setting: USA | |
| Interventions | Type of intervention: care in foster home Description of the intervention: people living foster homes and receiving services through the Pennsylvania Domiciliary Care Programme. Foster homes provide personal care services for 1‐3 clients. Counselling, transportation, meals, recreational activities, information/referral, and monitoring services. Based on a patient assessment, the programme could provide medication monitoring, and/or arrange for various types of therapies Control: nursing home care | |
| Outcomes | All outcomes were measured at 9 months. Community integration and feeling of contentment; utilisation of skills for independent living | |
| Notes | Study supported by the Department of Health and Human Services, USA | |
| Risk of bias | ||
| Bias | Authors' judgement | Support for judgement |
| Random sequence generation (selection bias) | High risk | Non‐randomised trial |
| Allocation concealment (selection bias) | High risk | No allocation methods used |
| Blinding of participants and personnel (performance bias) | Unclear risk | It is unclear if participants or personnel had knowledge of the study aim. |
| Blinding of outcome assessment (detection bias) | Unclear risk | N/A ‐ no objective outcomes |
| Blinding of outcome assessment (detection bias) | Unclear risk | Data obtained from self‐report. It is unclear if the trained interviewers collecting data knew of the study aim or patient allocation. Additionally some data on services were collected by a third party. |
| Incomplete outcome data (attrition bias) | Low risk | The sample sizes at baseline and follow‐up appear similar |
| Selective reporting (reporting bias) | High risk | Authors selectively reported results |
| Baseline measures | Low risk | Simulated random group assignment computer procedure used to match groups by large number of variables |
| Free of contamination | Low risk | No crossover |
| Other bias | High risk | Baseline confounding |
| Methods | Study design: observational cohort study | |
| Participants | Participants: N = 11,803 (Control: N = 4774; Intervention: N = 7029) Mean age: Control: 83 years, Intervention: 81 years Gender: Control 74.3% female, Intervention 76.9% female Setting: Canada | |
| Interventions | Type of intervention: care in own home Description of the intervention: people living in own home receiving home care services Control: nursing home care | |
| Outcomes | Admission to hospital over a 2‐year period | |
| Notes | Study supported by the Health Research Fund of the Alberta Heritage Foundation for Medical Research, Canada | |
| Risk of bias | ||
| Bias | Authors' judgement | Support for judgement |
| Random sequence generation (selection bias) | High risk | Non‐randomised trial |
| Allocation concealment (selection bias) | High risk | No allocation methods used |
| Blinding of participants and personnel (performance bias) | Low risk | This study used retrospective, routinely collected data and thus participants or personnel were unaware of the study aim |
| Blinding of outcome assessment (detection bias) | Low risk | Data obtained from medical records |
| Blinding of outcome assessment (detection bias) | Unclear risk | N/A ‐ no subjective outcomes |
| Incomplete outcome data (attrition bias) | Low risk | It would appear that all data were obtained for the cohort of interest. There was some missing data identified during the data cleaning process but was described as < 1% |
| Selective reporting (reporting bias) | Low risk | All outcomes of interest appear to be reported with point estimates and measures of variance |
| Baseline measures | High risk | Limited data provided on key baseline characteristics with no adjustment for baseline status |
| Free of contamination | Low risk | No crossover |
| Other bias | High risk | Potential multiple baseline confounders |
| Methods | Study design: observational cohort study, dataset | |
| Participants | Participants: N = 2338 (Control: N = 1169; Intervention: N = 1169) Age: range 65‐91 Gender: Control: 75% female; Intervention: 73% female Setting: USA | |
| Interventions | Type of intervention: care in own home or community Description of the intervention: home‐ and community‐based services provided by Medicaid within the first month after being discharged from a nursing home in which they had received care for at least 90 days (called transitioners) Control: nursing home care (called stayers) | |
| Outcomes | All outcomes were assessed at 12 months. Primary outcome: potentially preventable hospitalisations: hospitalisations with an ambulatory case‐sensitive condition Secondary: hospitalisations of any type | |
| Notes | The total populations included 32,504 stayers and 1,942 transitioners. The study sample used a propensity score matching method (page 73). After matching the sample this study included 1169 in each group. Study supported by the Centers for Medicare and Medicaid Services, USA | |
| Risk of bias | ||
| Bias | Authors' judgement | Support for judgement |
| Random sequence generation (selection bias) | High risk | Non‐randomised trial |
| Allocation concealment (selection bias) | High risk | No allocation methods used |
| Blinding of participants and personnel (performance bias) | Unclear risk | This study used data from 7 US states, routinely collected as part of an ongoing initiative to examine progress for rebalancing LTC programs ‐ it is unlikely that participants or personnel were aware of this study aim |
| Blinding of outcome assessment (detection bias) | Unclear risk | Data obtained from medical records |
| Blinding of outcome assessment (detection bias) | Low risk | N/A ‐ no subjective outcomes |
| Incomplete outcome data (attrition bias) | Low risk | All data were available for the included sample |
| Selective reporting (reporting bias) | Low risk | Data were reported for all outcomes of interest with point estimates and measures of variance |
| Baseline measures | Low risk | Groups were matched on key criteria (age, gender, ethnicity, residence, diagnosis, ADLs and cognitive impairment) and appear similar. |
| Free of contamination | Low risk | No crossover |
| Other bias | Unclear risk | Potential multiple baseline confounders |
ADL: activities of daily living; FC: family care; HCBC: home‐ or community‐based care; LTC: long‐term care; N/A: not applicable
Characteristics of excluded studies [ordered by study ID]
Ir a:
| Study | Reason for exclusion |
| Does not look at enhanced domiciliary services | |
| Cross‐sectional survey | |
| Looks only at barriers to acceptance of care models | |
| Does not include enhanced home care services | |
| Groups different at baseline | |
| Cross‐sectional survey | |
| Does not look at functionally dependent older people in the community | |
| Only lists economic data | |
| Looks at assessment of dementia in 3 different settings | |
| Cross‐sectional survey | |
| No robust outcome data reported | |
| Does not include institutional care setting | |
| Does not include stated primary or secondary outcomes | |
| Does not look at functionally dependent older people in the community | |
| Observational before after study with no control | |
| Does not include stated primary or secondary outcomes | |
| Does not look at functionally dependent older people in the community | |
| Only lists economic data | |
| Cross‐sectional survey | |
| Does not include stated primary or secondary outcomes | |
| Cost analysis study | |
| Does not include institutional care setting | |
| Does not fit defined interventions and outcomes |
Data and analyses
| Outcome or subgroup title | No. of studies | No. of participants | Statistical method | Effect size |
| 1 Mortality Show forest plot | 2 | Risk Ratio (M‐H, Fixed, 95% CI) | Totals not selected | |
| Analysis 1.1 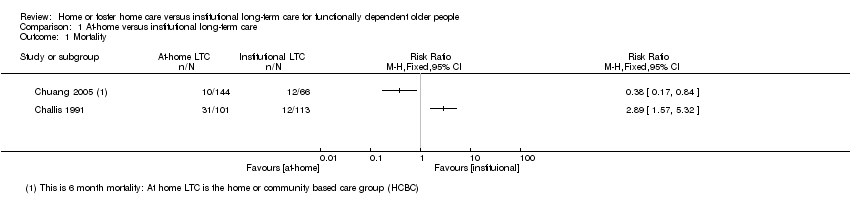 Comparison 1 At‐home versus institutional long‐term care, Outcome 1 Mortality. | ||||
| 2 Number of patients with a hospital admission Show forest plot | 3 | Risk Ratio (M‐H, Fixed, 95% CI) | Totals not selected | |
| Analysis 1.2  Comparison 1 At‐home versus institutional long‐term care, Outcome 2 Number of patients with a hospital admission. | ||||

Study flow diagram.
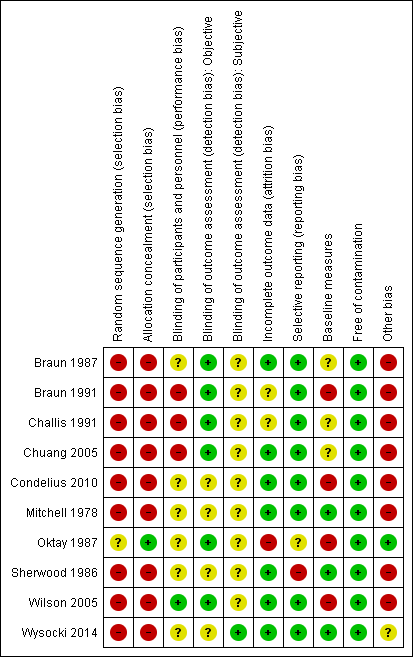
Risk of bias summary: review authors' judgements about each risk of bias item for each included study.

Comparison 1 At‐home versus institutional long‐term care, Outcome 1 Mortality.
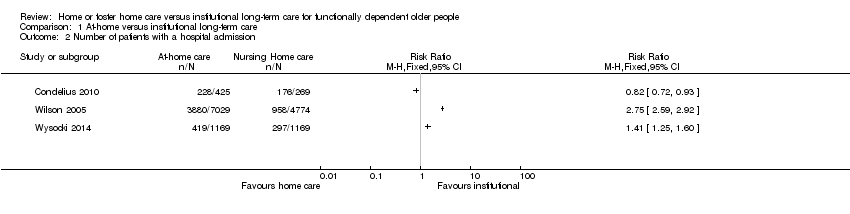
Comparison 1 At‐home versus institutional long‐term care, Outcome 2 Number of patients with a hospital admission.
| Home or foster home versus institutional long‐term care for functionally dependent older people | ||||
| Patient or population: older adults with functional dependence Settings: long‐term care Intervention: long‐term home care Comparison: long‐term institutional care | ||||
| Outcomes | Relative effect | No of participants | Certainty of evidence | Comments |
| Mortality (6 months) | It is uncertain whether long‐term home care compared to nursing home care decreases mortality risk Estimates ranged from a relative increase in risk of mortality of RR 2.89 (95% CI 1.57 to 5.32) to a relative reduction in risk of RR 0.38 (95% CI 0.17 to 0.61). | 314* | ⊕⊝⊝⊝ | Data were not pooled due to the high degree of statistical heterogeneity for this outcome (I2 = 94%) |
| Physical function (3‐6 months) | It is uncertain whether long‐term home care compared to nursing home care improves physical function Estimates ranged from and improvement in activities of daily living of MD −0.25 points (95% CI −0.44 to −0.06) to MD −1.90 (95% CI −2.18 to −1.62) | 1295* | ⊕⊝⊝⊝ | 3 studies reporting data used the Katz Index of ADLs or a variation of this measure 2 studies did not provide usable post or change‐score data. 1 study reported no between‐group difference in change in ADLs. 2 studies reported improvements in ADLs for participants receiving home LTC compared to nursing home LTC |
| Quality of life (3‐6 months) | It is uncertain whether long‐term home care compared to nursing home care improves happiness (RR 1.97, 95% CI 1.27 to 3.04) or general satisfaction | 114 | ⊕⊝⊝⊝ | Both studies used proxy items for this outcome. While both variables were assessed using continuous measures, authors further dichotomised the outcome for reporting, precluding meta‐analysis. |
| Hospital admissions | It is uncertain whether long‐term home care compared to nursing home care decreases hospital admissions Estimates ranged from a relative increase in risk of a hospitalisation of RR 2.75 (95% CI 2.59 to 2.92) to a relative reduction in risk of RR 0.82 (95% CI 0.72 to 0.93). | 14,853 (3 studies) | ⊕⊝⊝⊝ | This outcome described the number of participants having at least one hospital admission. Data were not pooled due to the high degree of statistical heterogeneity for this outcome (I2 = 99%) |
| Number of adverse health outcomes | The extent to which long‐term home care was associated to more or fewer adverse health outcomes than nursing home care was not reported. | ‐‐‐ | ‐‐‐ | ‐‐‐ |
| ADL: activities of daily living; CI: confidence interval; LTC: long‐term care; RR: risk ratio. | ||||
| GRADE Working Group grades of evidence | ||||
| aDowngraded due to study design. * For Chuang 2005, only participants receiving institutional or home/community‐based care were included; participants receiving family care were not included. | ||||
| Study | Service Location (home / community) | Type of services | Dose (how many services and their frequency of provision) | Provider |
| Home | Help with laundry, shopping, cleaning, and personal care. Excluded meals on wheels or transport services | ≥ 4 home visits per month | Not reported | |
| Home | Medical care and ancillary services in participant's own home. A potential caregiver (friend, relative, or hired caretaker) must be living in the patient's home and able to assume responsibility for care. | Not reported | Home care team (physician, nurse, dietician, social worker) | |
| Home | Darlington Care Project: case management service, which could include any number of medical services based on client needs (speech therapy, stoma care, catheter care, change of dressing). Personal care (bathing, dressing, toileting, feeding, hand/nail care), physical care, (assist with walking, lifting/transferring). Social and recreational activities and therapeutic exercises | Not reported | Case manager likely a nurse? Other HCPs as needed | |
| Home | Not reported | Not reported | Not reported | |
| Home or community | Not reported | Not reported | Not reported | |
| Home or community | Not reported | Not reported | Not reported | |
| Home or community | Nursing Home Without Walls (NHWW) provides an array of services including case management, skilled nursing, personal care, adult day health, home delivered meals, nutritional counselling, transportation, respite, emergency alarms, moving assistance, rehabilitation, home maintenance, environmental modifications, homemakers | Not reported | Nurse | |
| Community | Counselling, transportation, meals, recreational activities, information/referral, and monitoring services. Based on a patient assessment, the programme could provide medication monitoring, and/or arrange for various types of therapies | Not reported | Social worker/nurse |
| Study | Service Location | Type of services | Provider |
| Room in a foster home | Caregivers provided the patient with meals, laundry, assistance with personal and instrumental ADLS, 24‐hour supervision and nursing tasks as needed (e.g. monitoring medication, injections and behavioural modification) | Caregivers were trained by the Johns Hopkins Hospital | |
| Foster home care | Caregivers provided personal care services, 24‐hour supervision, and meal, laundry and household services | Caregivers were a part of a certification and monitoring programme | |
| Foster care home | Community Care Program: families provide 24‐hour supervision, room and board, homemaker services, personal care including assistance with ADLs, medication, range of motion and other exercises, and in some cases, tube feeding, dressing changes, insulin injections, catheter irrigations, transportation to medical and social outings | Families are trained and supervised by social worker/nurse teams to adopt and care for 1‐2 patients |
| Study | Time‐point | Type of long‐term care | Sample size | Results | Relative effect RR (95% CI) | |
| Home care | Nursing home | |||||
| 6 months | Blended | 352 | 8% (18/221) | 16% (21/131) | 0.51 (0.28 to 0.92) | |
| 6 months | Home care | 214 | 34% (31/101) | 11% (12/113) | 2.89 (1.57 to 5.32) | |
| 6 months | Home care | 474 poststroke | 6% (24/408) | 18% (12/66) | 0.38 (0.17 to 0.61) | |
| 12 months | Home care | 214 | 40% (40/101) | 31% (35/113) | 1.28 (0.89 to 1.84) | |
| 12 months | Foster care | 112 | 29% (17/59) | 32% (17/53) | 0.90 (0.51 to 1.57) | |
| CI: confidence interval; RR: risk ratio. | ||||||
| RR: risk ratio. | ||||||
| Study | Time point | Sample size | Measure | D/Ca | Results | Relative effectb (95% CI) | |
| Home care | Nursing home | ||||||
| Home care | |||||||
| 3 months | 195 | ADLd (change) | — | — | — | — | |
| 3 months | 98 | ADLe | C | Post: 13.02 | Post: 13.16 | — | |
| 3 months | 98 | ADL (mobility)e | C | −1.02 | −1.05 | — | |
| 6 months | 210 | ADLe | — | — | — | — | |
| 9 months | 98 | ADL performance assessment | ? | — | — | −0.25 (−0.44 to −0.06) | |
| Unclear | 694 | ADLg | C | 3.0 (1.2) | 3.9 (0.4) | −0.9 (−1.02 to −0.78) | |
| Unclear | 694 | ADLh | C | 1.4 (1.7) | 3.4 (1.9) | −1.90 (−2.18 to −1.62) | |
| Foster care | |||||||
| 12 months | 53 | ADLd (improved/maintained) | D | 79% (22/28) | 60% (15/25) | 0.19 (−0.07 to 0.43) | |
| 12 months | 53 | ADLg (improved/maintained) | D | 75% (21/28) | 68% (17/25) | 0.07 (−0.17 to 0.31) | |
| 9 months | 62 | ADL performance assessment | — | — | — | — | |
| Unclear | — | — | — | — | — | — | |
| Blended | |||||||
| 6 months | 352 | ADLe (pre‐post) | C | Pre: 12.87 Post: 12.16 | Pre: 14.43 Post: 13.78 | — | |
| 6 months | 352 | ADLe (change) | 0.71 | 0.65 | — | ||
| ADL: activities of daily living; CI: confidence interval; RR: risk ratio. | |||||||
| aD: dichotomous outcome; C: continuous outcome. | |||||||
| Study | Time point | Type of long‐term care | Sample Size | Measure | D/Ca | Results | Relative effectb (95% CI) | Favours | |
| Home care | Nursing home | ||||||||
| Home care | |||||||||
| 3 months | Community care | 132 | Reported level of happinessc | D | 67% (59/88) | 34% (15/44) | 1.97 (1.27 to 3.04) | Home care | |
| 6 months | Community care | 214 | General satisfactiond (change) | C | 0.79 | 0.08 | — | Home care | |
| 6 months | Community care | 214 | Well‐being – moraled (change) | C | 0.79 | 0.21 | — | Home care | |
| 6 months | Community care | 214 | Well‐being – depressiond (change) | C | 0.33 | −1.05 | — | Home care | |
| Foster care | |||||||||
| 12 months | Foster care | 53 | Life satisfaction (improved/maintained) | D | 46% (13/28) | 72% (18/25) | RR: 0.64 (0.40 to 1.03) | Nursing | |
| 12 months | Foster care | 53 | Perceived health (improved/maintained) | D | 68% (19/28) | 84% (21/25) | RR: 0.81 (0.59 to 1.10) | Nursing | |
| 12 months | Foster care | 53 | Mental status (improved/maintained) | D | 64% (18/28) | 60% (15/25) | RR: 1.07 (0.70 to 1.64) | ||
| CI: confidence interval; RR: risk ratio. | |||||||||
| aD: dichotomous outcome; C: continuous outcome. | |||||||||
| Study | Time‐point | Type of long‐term care | Sample Size | Measure | Results | Relative effect: RR (95% CI) | Favours | |
| Home care | Nursing home | |||||||
| Observational (data set) | Home care | 11,803 | Hospital admissiona | 55% (3880/7029) | 20% (958/4774) | 2.75 (2.59 to 2.92) | Nursing home? | |
| Observational (dataset) | Home care | 11,803 | Emergency room visitsb | 70.1% (4992/70290 | 34.8% (1662/4774) | — | Nursing home? | |
| Observational (dataset) | Home/community care | 2338 | Preventable hospitalisationc | 11.4% (133/1169) | 9.7% (113/1169) | — | Nursing home? | |
| Observational (dataset) | Home/community care | 2338 | Any hospitalisationd | 35.8% (419/1169) | 25.4% (297/1169) | 1.41 (1.25, 1.60) | Nursing home? | |
| unclear | Home care | 694 | Hospital staysf | 53.6% (228/425) | 65.4% (176/269) | 0.82 (0.72, 0.93) | Home care? | |
| CI: confidence interval; RR: risk ratio. | ||||||||
| aNumber admitted to hospital at least once. | ||||||||
| Outcome or subgroup title | No. of studies | No. of participants | Statistical method | Effect size |
| 1 Mortality Show forest plot | 2 | Risk Ratio (M‐H, Fixed, 95% CI) | Totals not selected | |
| 2 Number of patients with a hospital admission Show forest plot | 3 | Risk Ratio (M‐H, Fixed, 95% CI) | Totals not selected | |