Häusliche Pflege oder häusliche Pflegeunterbringung versus institutionelle Langzeitpflege für funktional abhängige ältere Menschen
Zusammenfassung
Hintergrund
Die demografische Entwicklung hat zu einer steigenden Anzahl an funktional abhängigen älteren Menschen, die Pflege und medizinische Behandlung benötigen, geführt. In vielen Ländern versucht die Regierungspolitik, Ressourcen von Pflegeheimen in die Gemeinden zu verschieben. Dies geschieht mit der Erwartung, dass Kosten reduziert und die Versorgungsqualität verbessert wird.
Ziele
Erfassung der Wirkung von Langzeitpflege oder Förderung der häuslichen Pflege versus institutioneller Pflege für funktional abhängige ältere Menschen.
Literatursuche
Wir durchsuchten das Cochrane Central Register of Controlled Trials (CENTRAL) über die Cochrane Library, MEDLINE, Embase, CINAHL und zwei Studienregister bis November 2015.
Auswahlkriterien
Wir schlossen randomisierte und nicht‐randomisierte Studien, kontrollierte vorher‐nachher Studien und unterbrochene Zeitreihen‐Studien ein, die mit den EPOC Studiendesignkriterien übereinstimmten, und die Wirkung von Langzeitpflege zu Hause mit institutioneller Pflege für funktional abhängige ältere Menschen verglichen.
Datenerhebung und ‐analyse
Zwei Reviewer extrahierten unabhängig voneinander Daten und erhoben das Risiko für Bias in jeder eingeschlossenen Studie. Wir berichteten die Ergebnisse narrativ, da die substantielle studienübergreifende Heterogenität bedeutete, dass eine Meta‐Analyse nicht angemessen war.
Wesentliche Ergebnisse
Wir schlossen 10 Studien, mit 16.377 Teilnehmenden, die alle in Ländern mit hohem Einkommen durchgeführt wurden, ein. Die eingeschlossenen Studien verglichen Gemeinde‐gestützte Pflege mit institutioneller Pflege (Pflegeheime). Die Stichprobengröße reichte von 98 bis 11.803 (Median N=204). Es lag substantielle Heterogenität im Gesundheitsversorgungskontext, in den untersuchten Interventionen und in den erhobenen Endpunkten vor. Eine Studie war eine randomisierte Studie (n=112); andere eingeschlossene Studien verwendeten Designs, die möglicheriwese einen Bias hatten, vor allem aufgrund des Fehlens der Randomisierung, Ungleichheiten in den Studiengruppen beim Behandlungsbeginn und nicht verblindeten Endpunkt‐Erhebungen. Die meisten Studien führten die Auswahl oder den Ausschluss der Teilnehmenden nicht anhand eines spezifischen Krankheitsstadiums durch, mit der Ausnahme einer Studie, die nur Patienten einschloss, die einen Schlaganfall erlitten hatten. Alle Studien hatten methodische Einschränkungen, sodass die Leser die Ergebnisse mit Vorsicht interpretieren sollten.
Es ist unklar, ob die häusliche Langzeitpflege verglichen mit der Pflege im Pflegeheim das Mortalitätsrisiko senkt (2 Studien, n=314, sehr niedrige Vertrauenswürdigkeit der Evidenz). Die Schätzungen reichten von nahezu dreifach‐erhöhtem Mortalitätsrisiko in der Gruppe der häuslichen Pflege (relatives Risiko (RR) 2,89, 95 % Konfidenzintervall (KI) 1,57 bis 5,32) bis zu einer 62 % relativen Reduktion (RR 0,38, 95 % KI 0,17 bis 0,61). Wir führten die Daten aufgrund der hohen Heterogenität (I2=94%) nicht zusammen.
Es bleibt unsicher, ob die Intervention eine positive Wirkung auf die physische Funktion hat, da die Qualität der Evidenz sehr niedrig ist (5 Studien, n=1295). Zwei Studien berichteten, dass Teilnehmende, die häusliche Langzeitpflege erhielten, Verbesserungen im Bereich der Aktivitäten des täglichen Lebens verglichen zu jenen, die in einem Pflegeheim lebten, auswiesen. Allerdings zeigte eine dritte Studie, dass alle Teilnehmenden ähnliche Werte hinsichtlich physischer Funktion aufwiesen.
Aufgrund der sehr niedrigen Verlässlichkeit der Evidenz (2 Studien, n=114) ist unsicher, ob häusliche Langzeitpflege verglichen mit Pflegeheimen die Zufriedenheit (RR 1,97, 95 % KI 1,27 bis 3,04) oder die generelle Zufriedenheit, verbessert.
Das Ausmaß, in welchem häusliche Langzeitpflege mit mehr oder weniger unerwünschten gesundheitsbezogenen Endpunkten assoziiert wird, wurde nicht berichtet.
Es ist unsicher, ob häusliche Langzeitpflege verglichen mit Pflegeheimen das Risiko für Krankenhausaufnahmen vermindert (sehr niedrige Vertrauenswürdigkeit der Evidenz, n=14.853). Effektschätzer des relativen Risikos reichten von 2,75 (95 % KI 2,59 bis 2,92), was ein erhöhtes Risiko für jene, die zu Hause gepflegt werden zeigt, bis 0,82 (95 % KI 0,72 bis 0,93), was ein leicht reduziertes Risiko für die gleiche Gruppe zeigt. Wir führten die Daten aufgrund der hohen Heterogenität (I2=99%) nicht zusammen.
Schlussfolgerungen der Autoren
Es gibt unzureichend qualitativ hochwertige publizierte Daten, um ein spezielles Versorgungsmodell für funktional abhängige ältere Menschen zu empfehlen. Gemeinde‐gestützte Pflege war nicht konsequent nutzbringend über alle eingeschlossenen Studien hinweg; es gab einige Daten, die Gemeinde‐gestützte Pflege, im Vergleich mit institutioneller Pflege, mit verbesserter Lebensqualität und physischer Funktion assoziierten. Allerdings könnten Gemeinde‐gestützte Alternativen im Vergleich zur institutionellen Pflege mit einem erhöhten Risiko für Krankenhausaufnahmen in Zusammenhang gebracht werden. Künftige Studien sollten die Inanspruchnahme von Gesundheitsdienstleistungen erheben, ökonomische Analysen durchführen und die Belastung der Pflegenden berücksichtigen.
PICO
Laienverständliche Zusammenfassung
Häusliche Pflege oder Pflegeheimalternativen zur institutionellen Langzeitpflege für funktional abhängige ältere Menschen
Was ist das Ziel dieses Reviews?
Das Ziel dieses Cochrane Reviews war, die Wirkung von häuslicher Pflege oder Pflegeheimalternativen im Vergleich zur institutionellen Pflege bei älteren Menschen, die für ihre Versorgung auf andere angewiesen sind, zu erheben.
Kernaussagen
Die Studien schlossen verschiedene Teilnehmende und Settings der Gesundheitsversorgung, sowie verschiedene Interventionen ein. Einige der Studien wurden schlecht durchgeführt, was bedeutet, dass wir bei der Interpretation unserer Ergebnisse vorsichtig sein müssen.
Zum jetzigen Zeitpunkt gibt es unzureichende Evidenz, um Empfehlungen für häuslich‐basierte Alternativen zur institutionellen Langzeitpflege für gebrechliche ältere Menschen zu unterstützen.
Was wir in diesem Review untersuchten
In vielen Ländern erhalten gebrechliche ältere Menschen mit verschiedenen Erkrankungen Langzeitpflege in Pflegeheimen oder anderen Institutionen. Aufgrund der steigenden Anzahl älterer Menschen und die mit Pflegeheimen verbundenen Kosten, sind andere Formen der Pflege notwendig ‐ inklusive zusätzlicher Pflege im eigenen Haus der betroffenen Person. Wir beurteilten Studien, die Pflege zu Hause versus Pflege in einer Institution anboten.
Was sind die Hauptergebnisse des Reviews?
Wir schlossen 10 Studien ein, die in fünf verschiedenen Ländern (USA, Taiwan, Schweden, Grossbritannien und Kanada) durchgeführt wurden. Die Studien inkludierten 16.377 ältere Menschen, welche eine Pflegeleistung in Anspruch nahmen. Alle Studien verglichen eine Form der häuslichen Pflege mit institutioneller Langzeitpflege. Die meisten Studien involvierten Personen mit mehreren unterschiedlichen Erkrankungen, mit Ausnahme einer Studie, die nur Teilnehmende nach einem Schlaganfall einschloss.
Wir sind unsicher, ob die Langzeitpflege zu Hause verglichen mit der Versorgung im Pflegeheim das Risiko für Mortalität oder Krankenhauswiederaufnahme senken kann, da die Evidenz von sehr niedriger Vertrauenswürdigkeit war. Wir sind gleichermaßen unsicher, ob die Intervention die physische Funktion oder Lebensqualität steigern kann, da auch hier die Evidenz von niedriger Vertrauenswürdigkeit war. Wir konnten keine Studien identifizieren, die über unerwünschte gesundheitsbezogene Endpunkte berichteten.
Wie aktuell ist dieser Review?
Die Autoren des Reviews suchten nach Studien, die bis November 2015 publiziert wurden.
Authors' conclusions
Summary of findings
| Home or foster home versus institutional long‐term care for functionally dependent older people | ||||
| Patient or population: older adults with functional dependence Settings: long‐term care Intervention: long‐term home care Comparison: long‐term institutional care | ||||
| Outcomes | Relative effect | No of participants | Certainty of evidence | Comments |
| Mortality (6 months) | It is uncertain whether long‐term home care compared to nursing home care decreases mortality risk Estimates ranged from a relative increase in risk of mortality of RR 2.89 (95% CI 1.57 to 5.32) to a relative reduction in risk of RR 0.38 (95% CI 0.17 to 0.61). | 314* | ⊕⊝⊝⊝ | Data were not pooled due to the high degree of statistical heterogeneity for this outcome (I2 = 94%) |
| Physical function (3‐6 months) | It is uncertain whether long‐term home care compared to nursing home care improves physical function Estimates ranged from and improvement in activities of daily living of MD −0.25 points (95% CI −0.44 to −0.06) to MD −1.90 (95% CI −2.18 to −1.62) | 1295* | ⊕⊝⊝⊝ | 3 studies reporting data used the Katz Index of ADLs or a variation of this measure 2 studies did not provide usable post or change‐score data. 1 study reported no between‐group difference in change in ADLs. 2 studies reported improvements in ADLs for participants receiving home LTC compared to nursing home LTC |
| Quality of life (3‐6 months) | It is uncertain whether long‐term home care compared to nursing home care improves happiness (RR 1.97, 95% CI 1.27 to 3.04) or general satisfaction | 114 | ⊕⊝⊝⊝ | Both studies used proxy items for this outcome. While both variables were assessed using continuous measures, authors further dichotomised the outcome for reporting, precluding meta‐analysis. |
| Hospital admissions | It is uncertain whether long‐term home care compared to nursing home care decreases hospital admissions Estimates ranged from a relative increase in risk of a hospitalisation of RR 2.75 (95% CI 2.59 to 2.92) to a relative reduction in risk of RR 0.82 (95% CI 0.72 to 0.93). | 14,853 (3 studies) | ⊕⊝⊝⊝ | This outcome described the number of participants having at least one hospital admission. Data were not pooled due to the high degree of statistical heterogeneity for this outcome (I2 = 99%) |
| Number of adverse health outcomes | The extent to which long‐term home care was associated to more or fewer adverse health outcomes than nursing home care was not reported. | ‐‐‐ | ‐‐‐ | ‐‐‐ |
| ADL: activities of daily living; CI: confidence interval; LTC: long‐term care; RR: risk ratio. | ||||
| GRADE Working Group grades of evidence | ||||
| aDowngraded due to study design. * For Chuang 2005, only participants receiving institutional or home/community‐based care were included; participants receiving family care were not included. | ||||
Background
Changing population demographics have led to an increasing number of functionally dependent older people who require care and medical treatment (World Population Aging 2015). In many countries, government policy aims to shift resources into the community from care homes with the expectation that this will reduce costs and improve the quality of care compared to institutional care settings.
Description of the condition
Long‐term care of chronically dependent older people has become an increasingly important issue for both policy makers and healthcare providers.
For older adults, their place of residence and the quality of care they receive can influence their quality of life. Costs, consumer preference, and growing demand for long‐term care have led to increased interest in alternative care models for the elderly and a shift in resources from long‐term institutional care towards home‐ and community‐based care (Iwarsson 2007). For example, investment from the public and private sector has created housing schemes for older people that combine independent living with relatively high levels of care. Home and community care services aim to help older people live independently in their homes and to maintain or enhance their quality of life for as long as possible.
The two main options for providing formal long‐term support for older people who become functionally dependent are enhanced domiciliary support services (home care) or care home placement (institutional care).
Description of the intervention
Enhanced long‐term home care services can include a number of different elements, such as formal personal care (including bathing, toileting, feeding, dressing, transfers, meal preparation, shopping), adapted environments (including within the older person's own home, or in a specifically adapted residence), day care (planned regular care given in day care centres to patients otherwise living at home), or respite care (care given primarily at home, but where patients receive planned regular respite within an institution).
How the intervention might work
In theory, enhanced long‐term home care services should favour maintenance of independence and personal autonomy in the home environment, a reduction in institutionalisation, and most likely an increased level of satisfaction and quality of life for the person. This can help maintain and support seniors' relationships to their caregivers and avoid separation from them.
Why it is important to do this review
A previously published (and now withdrawn) Cochrane Review, Mottram 2002, included one randomised trial that compared foster care through a community care programme, where caregivers had been trained and closely followed up by health professionals, versus nursing home care, concluding that there was insufficient evidence on the likely benefit and harms of institutional versus home care for functionally dependent older people (Oktay 1987).
It is not clear whether in practice, enhanced home care can provide an alternative that satisfies both the functionally dependent older person and their informal caregivers, without causing increased caregiver stress or increasing the burden on primary and secondary care.
There have been several studies describing home care versus institutional care (e.g. Braun 1991), and by offering an up‐to‐date synthesis of the data, we aim to clarify whether or not home care for the functionally dependent older person is a viable alternative to long‐term institutional care.
Objectives
To assess the effects of long‐term home or foster home care versus institutional care for functionally dependent older people, with a particular focus on mortality, physical function, quality of life, and caregiver outcomes.
Methods
Criteria for considering studies for this review
Types of studies
We anticipated finding few randomised trials given the logistical difficulties of conducting them in this area. Thus, in addition to including randomised trials, we also included non‐randomised trials, controlled before‐after studies and interrupted time series studies that compared the effects of institutional versus home care for functionally dependent older people.
We excluded controlled before‐after studies that did not meet the EPOC Group study design criteria resources (EPOC 2016).
-
The timing of the periods of study for the control and intervention groups should be comparable (that is, the pre‐ and postintervention periods of measurement for the control and intervention groups should be the same).
-
The intervention and control groups should be comparable on key characteristics.
We excluded interrupted time series studies that did not meet the EPOC Group study design criteria resources (EPOC 2016).
-
There should be a clearly defined point in time when the intervention occurred.
-
There should be at least three data points before and three after the intervention.
Types of participants
We included elderly participants (aged 65 years or older) with long‐term functional dependency, who were considered as potentially requiring care home placement (from hospital or the community). We defined functional dependence as the need for assistance in one or more activities of daily living (ADLs).
We excluded studies if they recruited the following participants.
-
Participants under the age of 65 years.
-
Participants who had become acutely functionally impaired and who were likely to require only a period of rehabilitation.
-
Participants who predominantly required palliative care.
Types of interventions
We included studies comparing enhanced long‐term homecare services versus long‐term institutional care.
Enhanced long‐term homecare services included the following:
-
Formal personal care provided by trained staff (including bathing, toileting, feeding, dressing, transfers, meal preparation, shopping). Where possible we categorised this as follows.
-
Regular care: personal care received regularly, but less often than daily, for specific activities of daily living.
-
Daily care: personal care received daily for specific activities of daily living, but not completely dependent on others for all activities of daily living and participation.
-
Continuous care: personal care for fully dependent participants.
-
-
Adapted environments, including within the older person's own home or in a specifically adapted residence.
-
Day care, where participants received planned regular care given in day care centres but were otherwise living at home.
-
Respite care, where participants receive planned regular care within an institution.
We defined Institutional long‐term care as care given to a participant in a day‐and‐night institution from which he or she could be discharged according to the rules applying to the institution.
We defined home care as care given to people in their own home, in a foster care setting, or in a group living setting.
Types of outcome measures
We included the following outcome measures.
Primary outcomes
Participant outcomes
-
Mortality at the end of scheduled follow‐up
-
Physical function (activities of daily living scales, such as the Barthel (Mahoney 1965) or the Katz (Katz 1963) Indexes of Daily Living)
-
Quality of life measures (e.g. WHO Quality of life assessment, WHOQOL Group 1995)
Secondary outcomes
Participant outcomes
-
Satisfaction with care
-
Number of adverse health outcomes, including incidence of infection (chest and urinary) over the period of the study
-
Hospital admissions
Informal caregivers of functionally dependent older people
-
Satisfaction with care (of the caregiver)
-
Perceived stress
-
Perceived burden
Search methods for identification of studies
We identified primary studies by searching the following bibliographic databases up to November 2015. We identified related systematic reviews by searching the Cochrane Database of Systematic Reviews (CDSR; 2015, Issue 11), the Database of Abstracts of Reviews of Effectiveness (DARE; 2015, Issue 2). EPOC Information Specialists (IS) developed search strategies in consultation with the authors. We used two methodological search filters, the Cochrane RCT Sensitivity/Precision Maximizing Filter (cf.Cochrane Handbook for Systematic Reviews of Interventions 6.4d; Higgins 2011) and the EPOC Filter, to limit retrieval to appropriate study designs. We restricted this review to studies published in English. The MEDLINE strategy is in Appendix 1.
Electronic searches
We undertook a comprehensive search covering the following databases on 11 November 2015, except where specified otherwise.
-
The Cochrane Central Register of Controlled Trials (CENTRAL; 2015, issue 10), including the EPOC Trials Register, in the Cochrane Library.
-
Health Technology Assessment Database (2015, Issue 4) in the Cochrane Library.
-
Ovid MEDLINE In‐Process & Other Non‐Indexed Citations and Ovid MEDLINE (1946 to 10 November 2015).
-
Embase Ovid (1974 to 10 November 2015)
-
CINAHL EBSCO (from 1981 to 10 November 2015).
-
WHO International Clinical Trials Registry Platform (ICTRP) (apps.who.int/trialsearch).
-
The Grey Literature Report (The New York Academy of Medicine) (www.greylit.org).
-
OpenGrey (www.opengrey.eu).
-
Agency for Healthcare Research and Quality (AHRQ) (from inception to July 2012).
-
ClinicalTrials.gov (clinicaltrials.gov).
-
Association of Gerentology & Geriatrics (IAGG) (from inception to July 2012).
Searching other resources
We identified additional information as follows.
-
We conducted cited reference searches for studies selected for inclusion in our review.
-
We reviewed reference lists of relevant systematic reviews and other relevant publications.
-
If/when required, we contacted authors of relevant studies/reviews to clarify reported information or seek unpublished results/data.
Data collection and analysis
Selection of studies
We downloaded all titles and abstracts retrieved by electronic searching to the reference management database and removed duplicates. Two review authors (CY, DS) independently examined the remaining unique records, excluding studies that clearly did not meet the inclusion criteria and obtaining full‐text copies of potentially relevant references. Two review authors (CY, DS) independently applied the eligibility criteria and resolved disagreements by discussion.
Data extraction and management
Two review authors (CY, DS) independently extracted details of study design, participants, intervention and comparison intervention, and outcome data from included articles using a specially designed data extraction form based on the EPOC data collection sheet (EPOC 2013). We resolved any disagreements by discussion and consensus.
Assessment of risk of bias in included studies
Two review authors (CY, AH) assessed the risk of bias of each included study. We used the criteria outlined in the Cochrane Handbook for Systematic Reviews of Interventions (Higgins 2011), and the guidance from the EPOC group (EPOC 2015). We assessed nine domains: sequence generation, allocation concealment, blinding of participants, blinding of outcome assessments, incomplete outcome data, selective outcome reporting, baseline measures, freedom from contamination, and 'other issues'. The ninth domain, 'other issues', included a baseline assessment (do the groups differ in fundamental ways?). We assessed baseline measures in all studies by considering if there were differences on key variables including age, sex and function. We assessed if studies were free from contamination by looking for crossover between intervention arms, if cross over was not reported it was judged to be low.
We used the overall 'Risk of bias' assessment to inform the certainty of the evidence, for which we used GRADE methodology.
Measures of treatment effect
We estimated the effect of the intervention using risk ratio for dichotomous data and mean difference and standardised mean difference for continuous data, together with the appropriate associated 95% confidence interval. We ensured that an increase in scores for continuous outcomes could be interpreted in the same way for each outcome.
Dealing with missing data
Whenever possible, we tried to contact authors for the primary studies to request missing data; however it was not always possible to find contacts for the authors, as some of the studies were published more than two decades ago.
Assessment of heterogeneity
We examined statistical heterogeneity among trials using the I2 statistic for mortality and hospital admissions.
Assessment of reporting biases
We did not assess reporting biases as planned using the Risk Correlation test and funnel plot, as there were too few studies to give a meaningful result.
Data synthesis
We conducted Mantel‐Haenszel fixed‐effects meta‐analyses for two outcome measures (mortality and hospital admissions), as the remaining collected data, identified interventions, and outcome measurements were not comparable. One of the studies included in the meta‐analyses was multi‐arm. Chuang 2005 had two control groups, home or community‐based and family care, and we included the former in the analysis as the services provided to the participants were compatible with the types of interventions we defined a priori, whereas the latter group received care from relatives, without training or additional services, and thus was not eligible. Where it was not possible to meta‐analyse the data due to diversity of interventions and outcomes, we reported the results using a narrative summary.
Sensitivity analysis
In order to determine how robust and consistent the results were, we planned to conduct sensitivity analyses, based upon study design (randomised trial versus other) or overall risk of bias in study (high, medium, low, according to the EPOC quality checklists; EPOC 2015).
Summary of findings
We created a 'Summary of findings' table for our primary comparison of long‐term home care versus institutional care, including all outcomes deemed important to decision makers, including patient outcomes and healthcare use (mortality, physical function, quality of life, hospital admissions, number of adverse health outcomes). We did not present secondary outcomes related to caregivers in the 'Summary of findings' table but did report them in the text. Similarly, we reported results for our secondary comparison of foster care and blended care in text only.
We assessed the overall certainty of evidence for each outcome using the GRADE approach, as recommended in the Cochrane Handbook for Systematic Reviews of Interventions (Higgins 2011) and EPOC (EPOC 2013a). Factors that may decrease the certainty of evidence are: study design and risk of bias (downgraded if more than 25% of the participants were from studies at a high risk of bias); inconsistency of results (downgraded if considerable heterogeneity was apparent in visual inspection or if the I2 value was greater than 50%); indirectness (generalisability of the findings; downgraded if more than 50% of the participants were outside the target group); imprecision (downgraded if fewer than 400 participants were included in the comparison for continuous data and there were fewer than 300 events for dichotomous data (Mueller 2007) and other factors (e.g. reporting bias, publication bias). As suggested previously, if a study included fewer than 400 participants we assessed its outcomes as inconsistent and imprecise and downgraded two levels to 'low certainty evidence', downgrading it further to 'very low certainty evidence' if there were other limitations. We reduced the certainty of evidence for a specific outcome by one level, according to the performance of the studies against these five factors, and we described the evidence as follows.
-
High‐certainty evidence: there are consistent findings among at least 75% of trials with low risk of bias; consistent, direct, and precise data; and no known or suspected publication biases. Further research is unlikely to change either the estimate or our confidence in the results.
-
Moderate‐certainty evidence: one of the domains is inadequate. Further research is likely to have an important impact on our confidence in the estimate of effect and may change the estimate.
-
Low‐certainty evidence: two of the domains are inadequate. Further research is very likely to have an important impact on our confidence in the estimate of effect and is likely to change the estimate.
-
Very low‐certainty evidence: we are very uncertain about the estimate.
-
No evidence: we did not find any studies that addressed this outcome.
Results
Description of studies
Results of the search
We retrieved 14,671 unique records from the electronic database search and excluded 14,638 based on title and abstract. We assessed the full text 33 records, identifying 10 studies that were eligible for inclusion in this review. Figure 1 shows the study selection process.
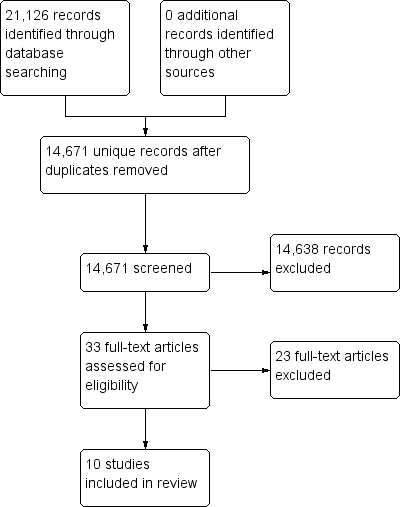
Study flow diagram.
Included studies
See Characteristics of included studies.
Design and country
Of the 10 included studies, there was 1 randomised trial (Oktay 1987), 4 non‐randomised trials (Braun 1991; Challis 1991; Chuang 2005; Mitchell 1978), 4 observational cohort studies (Condelius 2010; Sherwood 1986; Wilson 2005; Wysocki 2014) and 1 nested case‐control study (Braun 1987). The studies took place in five different countries, including six studies in the USA (Braun 1987; Braun 1991; Mitchell 1978; Oktay 1987; Sherwood 1986; Wysocki 2014), one in Taiwan (Chuang 2005), one in Sweden (Condelius 2010), one in the UK (Challis 1991), and one in Canada (Wilson 2005). All studies except one reported sources of funding (Challis 1991).
Participants
The 10 studies included 16,377 total participants. Sample sizes ranged from 98 to 11,803, and mean participant age ranged from 65 years to 82 years. All studies excluded participants who were younger than 65 except Mitchell 1978, which included participants from age 26 but had a mean cohort age of 65.6 years. Most participants in all studies were considered to be functionally dependent older people in need of long‐term care services. Most studies did not select (or exclude) participants for any specific co‐morbidities, with the exception of Chuang 2005, which only included patients if they had had a stroke.
Description of the interventions
Home care
See Table 1.
| Study | Service Location (home / community) | Type of services | Dose (how many services and their frequency of provision) | Provider |
| Home | Help with laundry, shopping, cleaning, and personal care. Excluded meals on wheels or transport services | ≥ 4 home visits per month | Not reported | |
| Home | Medical care and ancillary services in participant's own home. A potential caregiver (friend, relative, or hired caretaker) must be living in the patient's home and able to assume responsibility for care. | Not reported | Home care team (physician, nurse, dietician, social worker) | |
| Home | Darlington Care Project: case management service, which could include any number of medical services based on client needs (speech therapy, stoma care, catheter care, change of dressing). Personal care (bathing, dressing, toileting, feeding, hand/nail care), physical care, (assist with walking, lifting/transferring). Social and recreational activities and therapeutic exercises | Not reported | Case manager likely a nurse? Other HCPs as needed | |
| Home | Not reported | Not reported | Not reported | |
| Home or community | Not reported | Not reported | Not reported | |
| Home or community | Not reported | Not reported | Not reported | |
| Home or community | Nursing Home Without Walls (NHWW) provides an array of services including case management, skilled nursing, personal care, adult day health, home delivered meals, nutritional counselling, transportation, respite, emergency alarms, moving assistance, rehabilitation, home maintenance, environmental modifications, homemakers | Not reported | Nurse | |
| Community | Counselling, transportation, meals, recreational activities, information/referral, and monitoring services. Based on a patient assessment, the programme could provide medication monitoring, and/or arrange for various types of therapies | Not reported | Social worker/nurse |
The intervention in eight studies was provision of home care services to participants, mostly living in their own home (Braun 1987; Challis 1991; Chuang 2005; Condelius 2010; Mitchell 1978; Wilson 2005; Wysocki 2014), but also in the community (Sherwood 1986). Three studies did not report intervention details (Chuang 2005; Wilson 2005; Wysocki 2014). The home care services provided in four studies tended to include both medical and ancillary services, consisting of personal care, household chores, or both (Braun 1987; Challis 1991; Mitchell 1978; Sherwood 1986). Two of these studies provided a detailed list of the services offered, including a case management service that provided referrals for medical services (e.g. speech therapy, stoma care, catheter care, change of dressing), personal care (e.g. bathing, dressing, toileting, feeding, hand/nail care), physical care (e.g. assistance with walking, lifting/transferring, and therapeutic exercises) and social and recreational activities (Braun 1987; Challis 1991). The intervention in Condelius 2010 provided household and personal care, but authors did not report any provision of medical services. Lastly, the intervention in Sherwood 1986 provided community‐based services from a geriatric day hospital where participants attended and received an assessment by a nurse or social worker, along with any other services based on their needs, including counselling, transportation, meals, recreational activities, information/referral, medication monitoring, or other various types of therapies.
Foster care
See Table 2.
| Study | Service Location | Type of services | Provider |
| Room in a foster home | Caregivers provided the patient with meals, laundry, assistance with personal and instrumental ADLS, 24‐hour supervision and nursing tasks as needed (e.g. monitoring medication, injections and behavioural modification) | Caregivers were trained by the Johns Hopkins Hospital | |
| Foster home care | Caregivers provided personal care services, 24‐hour supervision, and meal, laundry and household services | Caregivers were a part of a certification and monitoring programme | |
| Foster care home | Community Care Program: families provide 24‐hour supervision, room and board, homemaker services, personal care including assistance with ADLs, medication, range of motion and other exercises, and in some cases, tube feeding, dressing changes, insulin injections, catheter irrigations, transportation to medical and social outings | Families are trained and supervised by social worker/nurse teams to adopt and care for 1‐2 patients |
In addition to interventions provided to participants in their home (as above), we identified studies that provided geriatric foster care within a home environment as an alternative to nursing home care. Oktay 1987 used this type of intervention exclusively, and two other studies used it as an additional comparison arm (Braun 1987; Sherwood 1986). All three studies described the foster care intervention as including a foster caregiver/family member providing 24‐hour supervision, room and board, homemaker services, personal care including assistance with activities of daily living, medication monitoring, physical exercise, and in some cases, tube feeding, dressing changes, insulin injections, catheter irrigations, and transportation to medical and social outings.
Blended (mix of different intervention types)
Lastly, in one study, the intervention included participants who were receiving either care in a foster home or in their own home (Braun 1991).
While this blended model fulfilled our protocol criteria by offering the participant an alternative to nursing home care within a domestic home environment, the service provision type and intensity were different. In foster care, the person resides in the home of a trained caregiver who provides 24‐hour monitoring and performs an extended role, often including nursing‐type support. This contrasts with what is generally more limited homecare services provided within the person's own home environment.
Control group: nursing home
Participants in the control group were residents in a long‐term care facility where they received 24‐hour monitoring and care.
Outcomes
Primary outcomes
Patient level outcomes reported in the included studies were mortality (4 studies), physical function (4 studies) and quality of life (3 studies).
Investigators reported mortality at 6 months in Braun 1991, Challis 1991, and Chuang 2005, and at 12 months in Challis 1991 and Oktay 1987.
Six studies measured physical function using a version of the Katz Index of Activities of Daily Living (ADL) at 6 months (Braun 1987; Braun 1991; Chuang 2005), 9 months (Sherwood 1986), and 12 months (Condelius 2010; Oktay 1987), while one used the Functional Status Index at 3 months (Mitchell 1978).
Secondary outcomes
Three studies assessed hospital admissions (Condelius 2010; Wilson 2005; Wysocki 2014).
Excluded studies
We excluded 23 studies after full‐text review. The most common reasons for exclusion were ineligible study design or lack of reporting on an eligible outcome (Characteristics of excluded studies).
Risk of bias in included studies
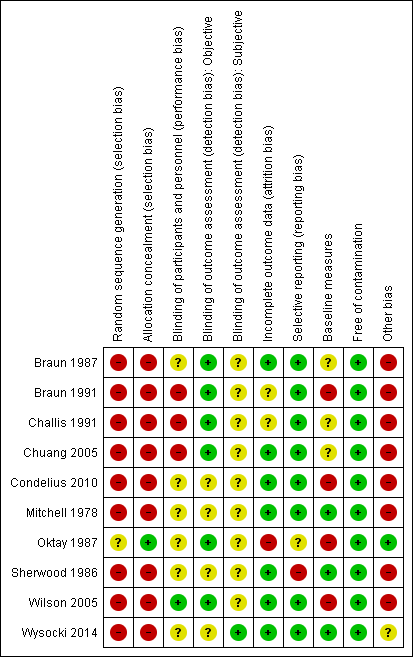
See Figure 2.

Risk of bias summary: review authors' judgements about each risk of bias item for each included study.
Sequence generation
Nine studies were not randomised, so we assigned a high risk of bias rating on this item. The single randomised trial did not report the method of randomisation, leading us to rate it as being at unclear risk of bias (Oktay 1987).
Allocation
As above, nine studies were not randomised and did not use allocation methods, so we rated them as being at high risk of bias. The single randomised trial reported adequate allocation concealment, and we rated it as being at low risk (Oktay 1987).
Blinding
Blinding of participants and personnel
With the exception of one study (Wilson 2005), participants and personnel were either unblinded and rated as being at high risk of bias (Braun 1987; Challis 1991; Chuang 2005), or there was insufficient information to make a judgment.
Blinding of outcome assessors
Only two studies blinded outcome assessors (Braun 1987, Wilson 2005).
Incomplete outcome data
We rated seven studies as being at low risk of bias on this item. We considered one other study to be at high risk (Oktay 1987), while two were at unclear risk (Braun 1991; Challis 1991).
Selective reporting
In the absence of a protocol, it is difficult to judge if authors report outcomes as planned. We assessed whether the Methods and Results sections reported the same outcomes. Consequently, we rated eight studies as being at low risk of bias on this item, one at high risk (Sherwood 1986), and one at unclear risk (Oktay 1987).
Other potential sources of bias
We judged four studies to have between‐group similarity at baseline (Chuang 2005; Mitchell 1978; Sherwood 1986; Wysocki 2014). We considered that four studies had between‐group differences at baseline that could influence outcome (Braun 1991; Condelius 2010; Oktay 1987; Wilson 2005). Baseline similarity was unclear in two studies.
The possibility of reverse causality was high in the included non‐randomised trials.
Effects of interventions
See: Summary of findings for the main comparison
Main comparison: home care versus nursing home care
Mortality
Two studies reported the number of participants in each group who had died at six months (Challis 1991; Chuang 2005). It is uncertain whether long‐term home care decreases risk of mortality at six months compared to nursing home care; RR ranged from 0.38 (95% CI 0.17 to 0.61) to 2.89 (95% CI 1.57 to 5.32) (2 studies, N = 314, very low‐certainty evidence). When combined in a meta‐analysis, there was high heterogeneity (I2 = 94%), and thus we did not retain the pooled estimate. Challis 1991 also assessed mortality at 12 months; the effect on mortality is uncertain (RR 1.28, 0.89 to 1.84). See Table 3; Analysis 1.1.
| Study | Time‐point | Type of long‐term care | Sample size | Results | Relative effect RR (95% CI) | |
| Home care | Nursing home | |||||
| 6 months | Blended | 352 | 8% (18/221) | 16% (21/131) | 0.51 (0.28 to 0.92) | |
| 6 months | Home care | 214 | 34% (31/101) | 11% (12/113) | 2.89 (1.57 to 5.32) | |
| 6 months | Home care | 474 poststroke | 6% (24/408) | 18% (12/66) | 0.38 (0.17 to 0.61) | |
| 12 months | Home care | 214 | 40% (40/101) | 31% (35/113) | 1.28 (0.89 to 1.84) | |
| 12 months | Foster care | 112 | 29% (17/59) | 32% (17/53) | 0.90 (0.51 to 1.57) | |
| CI: confidence interval; RR: risk ratio. | ||||||
RR: risk ratio.
Physical function
Five studies assessed function; four studies used the Katz ADL index, either in its original version (Braun 1987; Chuang 2005) or a modified variation (Condelius 2010; Sherwood 1986). One study used the Function Status Index (FSI) (Mitchell 1978). We are uncertain whether the intervention improves physical function (5 studies, N = 1295; very low‐certainty evidence). Three studies did not provide post‐test or change score data (Braun 1987; Chuang 2005; Mitchell 1978). For the three studies that did provide usable data on this outcome, two studies provided very low‐certainty evidence for a beneficial effect of long‐term home care on ADLs (MD −1.90, 95% CI −2.18 to −1.62, Condelius 2010; MD −0.25 points, 95% CI −0.44 to −0.06, Sherwood 1986). In both of these studies, a lower score indicated better ADL performance; the former scale ranged from 0 (independent in all activities) to 4 (dependent in all activities), whereas the latter ranged between 1 (good) to 2 (severely impaired). See Table 4.
| Study | Time point | Sample size | Measure | D/Ca | Results | Relative effectb (95% CI) | |
| Home care | Nursing home | ||||||
| Home care | |||||||
| 3 months | 195 | ADLd (change) | — | — | — | — | |
| 3 months | 98 | ADLe | C | Post: 13.02 | Post: 13.16 | — | |
| 3 months | 98 | ADL (mobility)e | C | −1.02 | −1.05 | — | |
| 6 months | 210 | ADLe | — | — | — | — | |
| 9 months | 98 | ADL performance assessment | ? | — | — | −0.25 (−0.44 to −0.06) | |
| Unclear | 694 | ADLg | C | 3.0 (1.2) | 3.9 (0.4) | −0.9 (−1.02 to −0.78) | |
| Unclear | 694 | ADLh | C | 1.4 (1.7) | 3.4 (1.9) | −1.90 (−2.18 to −1.62) | |
| Foster care | |||||||
| 12 months | 53 | ADLd (improved/maintained) | D | 79% (22/28) | 60% (15/25) | 0.19 (−0.07 to 0.43) | |
| 12 months | 53 | ADLg (improved/maintained) | D | 75% (21/28) | 68% (17/25) | 0.07 (−0.17 to 0.31) | |
| 9 months | 62 | ADL performance assessment | — | — | — | — | |
| Unclear | — | — | — | — | — | — | |
| Blended | |||||||
| 6 months | 352 | ADLe (pre‐post) | C | Pre: 12.87 Post: 12.16 | Pre: 14.43 Post: 13.78 | — | |
| 6 months | 352 | ADLe (change) | 0.71 | 0.65 | — | ||
| ADL: activities of daily living; CI: confidence interval; RR: risk ratio. | |||||||
aD: dichotomous outcome; C: continuous outcome.
bFor dichotomous outcomes, the relative effect is reported as a risk ratio (RR).
cNo post‐test data provided for this study. Pre‐test Functional Status Index mean (SD): home care (HC) 8.12 (3.9), institution (hospital): 10.48 (3.3).
dADLs were assessed with theFunction Status Index (FSI). This measure evaluates people on the extent to which they can perform everyday activities and socially defined roles. The self‐care dimension was expanded to include an item (continence) not in the original FSI. Continence used in ADL‐ Katz total FSI scores ranges from a 0 to 17. Higher score worse.
eADLs assessed with theKatz Index of ADLs (Katz 1963). This measures function in eight activities: bathing, dressing, transfer, toileting, continence, feeding, ambulation, house confinement. ADL is first 6 items summed for total score (range: 6 to 18). Mobility is final 2 items summed for total score (range: 2 to 9) We are using the ADL score. Higher scores worse.
fIn this study, there were no pre‐post measures reported; it appears these data are cross‐sectional, and it is unclear at what time point they were taken.
gADL: Activities of daily living were assessed with the Instrumental Activities of Daily Living (IADL) including cooking, transportation, cleaning and shopping. The IADL sum score ranges from 0 (independent in all activities) to 6 (dependent in all activities).
hADL: Activities of daily living were assessed with thePersonal Activities of Daily Living (PADL) including bathing, dressing, going to the toilet, transferring, continence and feeding. The PADL sum score ranges from 0 (independent in all activities) to 4 (dependent in all activities).
Quality of life
Two studies reported on participants' quality of life (Braun 1987; Challis 1991). Neither study used a standardised assessment of health‐related quality of life such as the Short Form 36‐item Health Survey (SF‐36) or EurQoL; rather, both studies used proxy outcomes. Braun 1987 used level of happiness, and Challis 1991 used general satisfaction reporting. Investigators measured happiness using a single‐item question: "Are you happy here?" with a three‐point response: 1 = rarely; 2 = sometimes; 3 = often. They assessed satisfaction using a single item but did not describe it. While investigators assessed both outcomes using continuous measures, authors further dichotomised happiness into 'happy' or 'not happy' and reported the results for general satisfaction as within‐group mean change scores without standard deviations, precluding meta‐analysis for this outcome. It is uncertain whether long‐term home care compared to nursing home care improves happiness (RR 1.97, 95% CI 1.27 to 3.04) or general satisfaction (2 studies, N = 114, very‐low certainty evidence). See Table 5.
| Study | Time point | Type of long‐term care | Sample Size | Measure | D/Ca | Results | Relative effectb (95% CI) | Favours | |
| Home care | Nursing home | ||||||||
| Home care | |||||||||
| 3 months | Community care | 132 | Reported level of happinessc | D | 67% (59/88) | 34% (15/44) | 1.97 (1.27 to 3.04) | Home care | |
| 6 months | Community care | 214 | General satisfactiond (change) | C | 0.79 | 0.08 | — | Home care | |
| 6 months | Community care | 214 | Well‐being – moraled (change) | C | 0.79 | 0.21 | — | Home care | |
| 6 months | Community care | 214 | Well‐being – depressiond (change) | C | 0.33 | −1.05 | — | Home care | |
| Foster care | |||||||||
| 12 months | Foster care | 53 | Life satisfaction (improved/maintained) | D | 46% (13/28) | 72% (18/25) | RR: 0.64 (0.40 to 1.03) | Nursing | |
| 12 months | Foster care | 53 | Perceived health (improved/maintained) | D | 68% (19/28) | 84% (21/25) | RR: 0.81 (0.59 to 1.10) | Nursing | |
| 12 months | Foster care | 53 | Mental status (improved/maintained) | D | 64% (18/28) | 60% (15/25) | RR: 1.07 (0.70 to 1.64) | ||
| CI: confidence interval; RR: risk ratio. | |||||||||
aD: dichotomous outcome; C: continuous outcome.
bFor dichotomous outcomes, the relative effect is reported as a risk ratio (RR).
cA single item question, "Are you happy here?" with a 3 point response: 1 = rarely, 2 = sometimes, 3 = often. They report raw response data on each point and then dichotomise data as happy or not. Higher score = better.
dA single item was used but not described. Mean change score at 6 month is reported. SD were not provided. Higher scores are assumed to be better.
Satisfaction with care
We did not find studies reporting on satisfaction with care.
Number of adverse health outcomes
We did not find studies reporting on adverse health outcomes.
Hospital admissions
Three studies assessed the number of patients admitted to hospital during the study period using observational datasets (Condelius 2010; Wilson 2005; Wysocki 2014). It is uncertain whether home care decreases the risk of hospitalisation compared to nursing home care (3 studies, N = 14,853, very‐low certainty evidence). Studies reported both increased risk of hospitalisation (RR 2.75, 95% CI 2.59 to 2.92; Wilson 2005; and RR 1.41, 95% CI 1.25 to 1.60; Wysocki 2014), and reduced risk of hospitalisation (RR 0.82, 95% CI 0.72 to 0.93; Condelius 2010). See Table 6; Analysis 1.2.
| Study | Time‐point | Type of long‐term care | Sample Size | Measure | Results | Relative effect: RR (95% CI) | Favours | |
| Home care | Nursing home | |||||||
| Observational (data set) | Home care | 11,803 | Hospital admissiona | 55% (3880/7029) | 20% (958/4774) | 2.75 (2.59 to 2.92) | Nursing home? | |
| Observational (dataset) | Home care | 11,803 | Emergency room visitsb | 70.1% (4992/70290 | 34.8% (1662/4774) | — | Nursing home? | |
| Observational (dataset) | Home/community care | 2338 | Preventable hospitalisationc | 11.4% (133/1169) | 9.7% (113/1169) | — | Nursing home? | |
| Observational (dataset) | Home/community care | 2338 | Any hospitalisationd | 35.8% (419/1169) | 25.4% (297/1169) | 1.41 (1.25, 1.60) | Nursing home? | |
| unclear | Home care | 694 | Hospital staysf | 53.6% (228/425) | 65.4% (176/269) | 0.82 (0.72, 0.93) | Home care? | |
| CI: confidence interval; RR: risk ratio. | ||||||||
aNumber admitted to hospital at least once.
bNumber of patients having ≥ 1 emergency room visits.
cNumber of patients with at least one potentially preventable hospitalisation.
dNumber of patients with at least one any type hospitalisation.
eIn this study, there were no pre‐post measures reported; it appears these data are cross‐sectional, and it is unclear at what time point they were taken.
fNumber of patients with 1 hospital stay.
Caregiver outcomes
We did not find studies reporting on caregiver outcomes, including satisfaction with care, stress and burden.
Secondary comparison: foster care versus nursing home care
Mortality
One study assessed the effect of foster home care compared to nursing home care on mortality at 12 months (Oktay 1987), generating low‐certainty evidence showing no effect for this care model on mortality (OR 0.90, 95% CI 0.51 to 1.57). See Table 3.
Physical function
Three studies assessed the effect of foster home care compared to nursing home care on changes in function measured by ADLs (Braun 1987; Oktay 1987; Sherwood 1986). Braun 1987 reported the mean pre‐ and post‐test scores but did not report standard deviations; from the scores provided, those in the foster care group did have greater improvements in ADLs than those in the nursing home group. Sherwood 1986 reported that participants allocated to a geriatric day hospital were less impaired than those allocated to a nursing home (MD ‐ 0.25, 95% CI ‐ 0.44 to ‐ 0.06). Oktay 1987 used the Katz Index of ADLs reporting a dichotomised estimate of the participants who either improved or maintained ADLs (RR 0.19, 95% CI ‐ 0.07 to 0.43). It is uncertain whether long‐term foster care compared to nursing home care improves or maintains ADLs because the certainty of evidence is very low. See Table 4.
Quality of life
One study assessed the effect of foster home care versus nursing home care on quality of life (Oktay 1987). Similar to other included studies, Oktay 1987 did not use a standardised assessment of quality of life. Instead, the study used the life satisfaction scale, which aims to assess psychological well‐being using five items: zest, resolution and fortitude, goal achievement, positive self‐concept, and mood. Assessors administered the test by telephone at baseline and at 3, 6, 9, and 12 months; however, authors reported only the 12 month scores. While the scale is continuous, with total scores ranging from 5 to 25, the authors dichotomised the total score as either improved/maintained or not. It is uncertain whether long‐term foster care compared to nursing home care improves satisfaction with life because the certainty of evidence is very low (RR 0.64, 95% CI 0.40 to 1.03). See Table 5.
Satisfaction with care
We did not find studies reporting on satisfaction with care.
Number of adverse health outcomes
We did not find studies reporting on adverse health outcomes.
Hospital admissions
We did not find studies reporting on hospital admissions.
Caregiver outcomes
Data were incomplete for this outcome, and we cannot draw any conclusion.
Discussion
Summary of main results
We attempted to establish whether dependent older people benefit from enhanced long‐term home care services compared with placement in a long‐term care institution. We also aimed to determine whether enhanced home care affects informal caregivers.
Our literature search yielded relevant data on a wide range of interventions of interest, but the certainty of evidence was poor with a lack of randomised trial data and substantial between‐study heterogeneity. For example, we were very inclusive regarding the types of studies eligible for the review to demonstrate the types of study design used in this area.
The studies reviewed here were heterogeneous in their inclusion criteria, design, sample, and methods of delivery. There was variability not just in the choice of instruments to measure outcomes, but the outcomes measured. The health and social care systems in which the studies took place differ significantly. The UK offers universal health and social care, whereas people in the USA receive care from multiple providers (for profit, not‐for‐profit, and state) and reimbursement from insurers as well as state and federal funds.
Therefore, we deemed meta‐analysis of the available data inappropriate, and we offered a narrative overview that we hope will stimulate thought and debate about options for long‐term care for frail elderly people.
The inconsistencies in outcomes between studies are notable.
Effects on mortality varied greatly, from a reduction to an increase in risk of death with enhanced care in a community setting compared to long‐term care home. None of the data for this outcome came from randomised trials, and these results are highly likely to be subject to allocation bias, with frailer participants at higher baseline risk of death more likely to be admitted to an institutional care home than to enhanced home care. There was little or no difference in mortality at 12 months between people allocated to foster home care compared to care homes (Oktay 1987). However, foster care is not a standard type of care for the elderly in most countries, so the results are hard to generalise. The certainty of evidence was very low.
Changes in physical function varied between studies, although results showed benefits for enhanced home care versus institutional care in Condelius 2010 and Sherwood 1986 and little or no difference in Braun 1987. Oktay 1987 noted improvement in physical function in participants allocated to foster home care. The certainty of evidence was very low.
Two studies described a measure of quality of life, reporting that this was better in those allocated to enhanced home care (Braun 1987; Challis 1991). However, patients receiving foster care were less likely to report improved or maintained life satisfaction compared to institutional care (Oktay 1987). The certainty of evidence was very low.
Overall completeness and applicability of evidence
We used a sensitive search strategy, and we believe we have a comprehensive overview of all studies that address our question of interest. However, the studies included in our review evaluated complex interventions involving various different patient groups with different medical diagnoses and different cultural, ethnic, and socioeconomic backgrounds. The included studies were from multinational locations (the USA, Sweden, Taiwan, and the UK) and were published over a prolonged period (around 40 years), during which long‐term care health and social care policies and practice have changed. Furthermore, ethnic and cultural aspects are relevant in the care of frail dependent elderly people, with large variations internationally in the use of long‐term care facilities. It was not possible to group the studies by geographic location or ethnicity.
While all studies included some form of home care, the level of care varied between studies. There was variability not just in the choice of instruments to measure outcomes, but in the outcomes measured and the time points of assessment. The wide diversity of outcome measures used prevented pooling of the data.
The incomplete and inconsistent reporting of data, including age, and unusable formats limited our ability to synthesise the evidence.
Certainty of evidence
A total of 16,377 people participated in 10 studies of long‐term care for functionally dependent older people. The sample size in the included studies ranged from 98 to 11,803. We elected not to offer summary analyses using meta‐analysis for most outcomes. In presenting results at individual study level, we must be mindful that some studies were modest in size and likely underpowered to answer their primary question, and that the quality of studies varied considerably.
We determined that the certainty of evidence across all the included studies was very low with high risk of bias for all outcomes. We are thus uncertain whether the intervention decreases the risk of mortality or hospital admission, or increases physical function and quality of life. Various study designs included one randomised trial, four non‐randomised trials, four observational cohort studies and one nested case‐control study.
The external validity/generalisability of included studies to an unselected frail, older adult population was generally good, although one of the included studies only included people who had had a stroke.
Potential biases in the review process
Identifying relevant studies in this broad topic area was challenging. We searched a wide variety of databases, including trial registers.
Two review authors, working independently, carried out study identification and data extraction. Although we were very careful not to discard relevant studies, we cannot discount the possibility that we may have missed some. It is also possible that limiting the review to English‐language studies might have biased our results, although recent data seems to suggest little or no evidence of systematic bias associated with language restriction in systematic reviews in conventional medicine (Morrison 2012).
Agreements and disagreements with other studies or reviews
Our review adds new data to the previous Cochrane review on this topic (Mottram 2002), albeit we could not find new randomised trials. Our more inclusive approach to studies gave us a larger pool of evidence to work with, but our final conclusions are similar to those of the previous review, with insufficient high quality data to allow a definitive statement on the utility of home care versus institutional care. We did not find any non‐Cochrane systematic reviews in this area.

Study flow diagram.
Risk of bias summary: review authors' judgements about each risk of bias item for each included study.

Comparison 1 At‐home versus institutional long‐term care, Outcome 1 Mortality.
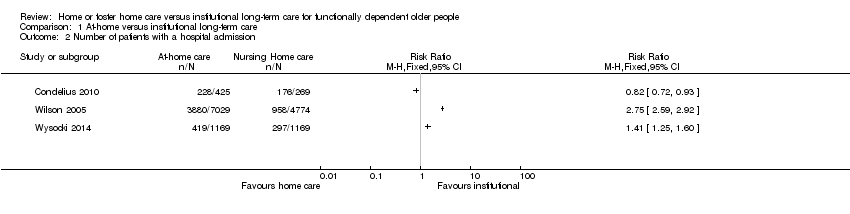
Comparison 1 At‐home versus institutional long‐term care, Outcome 2 Number of patients with a hospital admission.
| Home or foster home versus institutional long‐term care for functionally dependent older people | ||||
| Patient or population: older adults with functional dependence Settings: long‐term care Intervention: long‐term home care Comparison: long‐term institutional care | ||||
| Outcomes | Relative effect | No of participants | Certainty of evidence | Comments |
| Mortality (6 months) | It is uncertain whether long‐term home care compared to nursing home care decreases mortality risk Estimates ranged from a relative increase in risk of mortality of RR 2.89 (95% CI 1.57 to 5.32) to a relative reduction in risk of RR 0.38 (95% CI 0.17 to 0.61). | 314* | ⊕⊝⊝⊝ | Data were not pooled due to the high degree of statistical heterogeneity for this outcome (I2 = 94%) |
| Physical function (3‐6 months) | It is uncertain whether long‐term home care compared to nursing home care improves physical function Estimates ranged from and improvement in activities of daily living of MD −0.25 points (95% CI −0.44 to −0.06) to MD −1.90 (95% CI −2.18 to −1.62) | 1295* | ⊕⊝⊝⊝ | 3 studies reporting data used the Katz Index of ADLs or a variation of this measure 2 studies did not provide usable post or change‐score data. 1 study reported no between‐group difference in change in ADLs. 2 studies reported improvements in ADLs for participants receiving home LTC compared to nursing home LTC |
| Quality of life (3‐6 months) | It is uncertain whether long‐term home care compared to nursing home care improves happiness (RR 1.97, 95% CI 1.27 to 3.04) or general satisfaction | 114 | ⊕⊝⊝⊝ | Both studies used proxy items for this outcome. While both variables were assessed using continuous measures, authors further dichotomised the outcome for reporting, precluding meta‐analysis. |
| Hospital admissions | It is uncertain whether long‐term home care compared to nursing home care decreases hospital admissions Estimates ranged from a relative increase in risk of a hospitalisation of RR 2.75 (95% CI 2.59 to 2.92) to a relative reduction in risk of RR 0.82 (95% CI 0.72 to 0.93). | 14,853 (3 studies) | ⊕⊝⊝⊝ | This outcome described the number of participants having at least one hospital admission. Data were not pooled due to the high degree of statistical heterogeneity for this outcome (I2 = 99%) |
| Number of adverse health outcomes | The extent to which long‐term home care was associated to more or fewer adverse health outcomes than nursing home care was not reported. | ‐‐‐ | ‐‐‐ | ‐‐‐ |
| ADL: activities of daily living; CI: confidence interval; LTC: long‐term care; RR: risk ratio. | ||||
| GRADE Working Group grades of evidence | ||||
| aDowngraded due to study design. * For Chuang 2005, only participants receiving institutional or home/community‐based care were included; participants receiving family care were not included. | ||||
| Study | Service Location (home / community) | Type of services | Dose (how many services and their frequency of provision) | Provider |
| Home | Help with laundry, shopping, cleaning, and personal care. Excluded meals on wheels or transport services | ≥ 4 home visits per month | Not reported | |
| Home | Medical care and ancillary services in participant's own home. A potential caregiver (friend, relative, or hired caretaker) must be living in the patient's home and able to assume responsibility for care. | Not reported | Home care team (physician, nurse, dietician, social worker) | |
| Home | Darlington Care Project: case management service, which could include any number of medical services based on client needs (speech therapy, stoma care, catheter care, change of dressing). Personal care (bathing, dressing, toileting, feeding, hand/nail care), physical care, (assist with walking, lifting/transferring). Social and recreational activities and therapeutic exercises | Not reported | Case manager likely a nurse? Other HCPs as needed | |
| Home | Not reported | Not reported | Not reported | |
| Home or community | Not reported | Not reported | Not reported | |
| Home or community | Not reported | Not reported | Not reported | |
| Home or community | Nursing Home Without Walls (NHWW) provides an array of services including case management, skilled nursing, personal care, adult day health, home delivered meals, nutritional counselling, transportation, respite, emergency alarms, moving assistance, rehabilitation, home maintenance, environmental modifications, homemakers | Not reported | Nurse | |
| Community | Counselling, transportation, meals, recreational activities, information/referral, and monitoring services. Based on a patient assessment, the programme could provide medication monitoring, and/or arrange for various types of therapies | Not reported | Social worker/nurse |
| Study | Service Location | Type of services | Provider |
| Room in a foster home | Caregivers provided the patient with meals, laundry, assistance with personal and instrumental ADLS, 24‐hour supervision and nursing tasks as needed (e.g. monitoring medication, injections and behavioural modification) | Caregivers were trained by the Johns Hopkins Hospital | |
| Foster home care | Caregivers provided personal care services, 24‐hour supervision, and meal, laundry and household services | Caregivers were a part of a certification and monitoring programme | |
| Foster care home | Community Care Program: families provide 24‐hour supervision, room and board, homemaker services, personal care including assistance with ADLs, medication, range of motion and other exercises, and in some cases, tube feeding, dressing changes, insulin injections, catheter irrigations, transportation to medical and social outings | Families are trained and supervised by social worker/nurse teams to adopt and care for 1‐2 patients |
| Study | Time‐point | Type of long‐term care | Sample size | Results | Relative effect RR (95% CI) | |
| Home care | Nursing home | |||||
| 6 months | Blended | 352 | 8% (18/221) | 16% (21/131) | 0.51 (0.28 to 0.92) | |
| 6 months | Home care | 214 | 34% (31/101) | 11% (12/113) | 2.89 (1.57 to 5.32) | |
| 6 months | Home care | 474 poststroke | 6% (24/408) | 18% (12/66) | 0.38 (0.17 to 0.61) | |
| 12 months | Home care | 214 | 40% (40/101) | 31% (35/113) | 1.28 (0.89 to 1.84) | |
| 12 months | Foster care | 112 | 29% (17/59) | 32% (17/53) | 0.90 (0.51 to 1.57) | |
| CI: confidence interval; RR: risk ratio. | ||||||
| RR: risk ratio. | ||||||
| Study | Time point | Sample size | Measure | D/Ca | Results | Relative effectb (95% CI) | |
| Home care | Nursing home | ||||||
| Home care | |||||||
| 3 months | 195 | ADLd (change) | — | — | — | — | |
| 3 months | 98 | ADLe | C | Post: 13.02 | Post: 13.16 | — | |
| 3 months | 98 | ADL (mobility)e | C | −1.02 | −1.05 | — | |
| 6 months | 210 | ADLe | — | — | — | — | |
| 9 months | 98 | ADL performance assessment | ? | — | — | −0.25 (−0.44 to −0.06) | |
| Unclear | 694 | ADLg | C | 3.0 (1.2) | 3.9 (0.4) | −0.9 (−1.02 to −0.78) | |
| Unclear | 694 | ADLh | C | 1.4 (1.7) | 3.4 (1.9) | −1.90 (−2.18 to −1.62) | |
| Foster care | |||||||
| 12 months | 53 | ADLd (improved/maintained) | D | 79% (22/28) | 60% (15/25) | 0.19 (−0.07 to 0.43) | |
| 12 months | 53 | ADLg (improved/maintained) | D | 75% (21/28) | 68% (17/25) | 0.07 (−0.17 to 0.31) | |
| 9 months | 62 | ADL performance assessment | — | — | — | — | |
| Unclear | — | — | — | — | — | — | |
| Blended | |||||||
| 6 months | 352 | ADLe (pre‐post) | C | Pre: 12.87 Post: 12.16 | Pre: 14.43 Post: 13.78 | — | |
| 6 months | 352 | ADLe (change) | 0.71 | 0.65 | — | ||
| ADL: activities of daily living; CI: confidence interval; RR: risk ratio. | |||||||
| aD: dichotomous outcome; C: continuous outcome. | |||||||
| Study | Time point | Type of long‐term care | Sample Size | Measure | D/Ca | Results | Relative effectb (95% CI) | Favours | |
| Home care | Nursing home | ||||||||
| Home care | |||||||||
| 3 months | Community care | 132 | Reported level of happinessc | D | 67% (59/88) | 34% (15/44) | 1.97 (1.27 to 3.04) | Home care | |
| 6 months | Community care | 214 | General satisfactiond (change) | C | 0.79 | 0.08 | — | Home care | |
| 6 months | Community care | 214 | Well‐being – moraled (change) | C | 0.79 | 0.21 | — | Home care | |
| 6 months | Community care | 214 | Well‐being – depressiond (change) | C | 0.33 | −1.05 | — | Home care | |
| Foster care | |||||||||
| 12 months | Foster care | 53 | Life satisfaction (improved/maintained) | D | 46% (13/28) | 72% (18/25) | RR: 0.64 (0.40 to 1.03) | Nursing | |
| 12 months | Foster care | 53 | Perceived health (improved/maintained) | D | 68% (19/28) | 84% (21/25) | RR: 0.81 (0.59 to 1.10) | Nursing | |
| 12 months | Foster care | 53 | Mental status (improved/maintained) | D | 64% (18/28) | 60% (15/25) | RR: 1.07 (0.70 to 1.64) | ||
| CI: confidence interval; RR: risk ratio. | |||||||||
| aD: dichotomous outcome; C: continuous outcome. | |||||||||
| Study | Time‐point | Type of long‐term care | Sample Size | Measure | Results | Relative effect: RR (95% CI) | Favours | |
| Home care | Nursing home | |||||||
| Observational (data set) | Home care | 11,803 | Hospital admissiona | 55% (3880/7029) | 20% (958/4774) | 2.75 (2.59 to 2.92) | Nursing home? | |
| Observational (dataset) | Home care | 11,803 | Emergency room visitsb | 70.1% (4992/70290 | 34.8% (1662/4774) | — | Nursing home? | |
| Observational (dataset) | Home/community care | 2338 | Preventable hospitalisationc | 11.4% (133/1169) | 9.7% (113/1169) | — | Nursing home? | |
| Observational (dataset) | Home/community care | 2338 | Any hospitalisationd | 35.8% (419/1169) | 25.4% (297/1169) | 1.41 (1.25, 1.60) | Nursing home? | |
| unclear | Home care | 694 | Hospital staysf | 53.6% (228/425) | 65.4% (176/269) | 0.82 (0.72, 0.93) | Home care? | |
| CI: confidence interval; RR: risk ratio. | ||||||||
| aNumber admitted to hospital at least once. | ||||||||
| Outcome or subgroup title | No. of studies | No. of participants | Statistical method | Effect size |
| 1 Mortality Show forest plot | 2 | Risk Ratio (M‐H, Fixed, 95% CI) | Totals not selected | |
| 2 Number of patients with a hospital admission Show forest plot | 3 | Risk Ratio (M‐H, Fixed, 95% CI) | Totals not selected | |