Прямое немедленное направление на кольпоскопию в сравнении с цитологическим наблюдением (повторные исследования) при легкой атипии клеток шейки матки (без анализа на ВПЧ)
Appendices
Appendix 1. Abbreviations
ASCUS: atypical squamous cells of undetermined significance
CI: confidence Interval
CIN: cervical intra‐epithelial lesion
CKC: cold knife conization
HSIL: high‐grade squamous intra‐epithelial lesion
LC: laser conization
LEEP: loop electrosurgical excisional procedure
LLETZ: large loop excision of the transformation zone
LSIL: low‐grade squamous intra‐epithelial lesion
NETZ: needle excision of the transformation zone
RCT: randomised controlled trial
RR: risk ratio
SWETZ: straight wire excision of the transformation zone
Appendix 2. CENTRAL search strategy
#1 MeSH descriptor Uterine Cervical Dysplasia, this term only
#2 MeSH descriptor Cervical Intraepithelial Neoplasiaexplode all trees
#3 cervi* near/5 (dysplasia or neoplasia)
#4 CIN*
#5 dyskaryosis or dyskaryosis
#6 LGSIL or LSIL or ASCUS
#7 (#1 OR #2 OR #3 OR #4 OR #5)
#8 MeSH descriptor Precancerous Conditions, this term only
#9 MeSH descriptor Early Detection of Cancer, this term only
#10 MeSH descriptor Carcinoma, Squamous Cell, this term only
#11 MeSH descriptor Neoplasms, Squamous Cell, this term only
#12 squamous near/5 lesion*
#13 precancer* or pre‐cancer* or premalignan* or pre‐malignan* or preneoplas* or pre‐neoplas*
#14 (#8 OR #9 OR #10 OR #11 OR ( #12 AND #13 ))
#15 MeSH descriptor Cervix Uteri, this term only
#16 cervi*
#17 (#15 OR #16)
#18 (#14 AND #17)
#19 MeSH descriptor Vaginal Smears, this term only
#20 (cervi* or vagina*) and (smear* or screen* or test*)
#21 (#19 OR #20)
#22 (#7 OR #18 OR #21)
#23 MeSH descriptor Colposcopy, this term only
#24 colposcop*
#25 LLETZ or LEEP or NETZ or SWETZ or LC or CKC
#26 MeSH descriptor Biopsy explode all trees
#27 biops*
#28 transformation zone
#29 MeSH descriptor Conization explode all trees
#30 conization or conization
#31 excis*
#32 (#23 OR #24 OR #25 OR #26 OR #27 OR #28 OR #29 OR #30 OR #31)
#33 (#22 AND #32)
Appendix 3. MEDLINE search strategy
MEDLINE Ovid
1 Uterine Cervical Dysplasia/
2 Cervical Intraepithelial Neoplasia/
3 (cervi* adj5 (dysplasia or neoplasia)).mp.
4 CIN*.mp.
5 (dyskaryosis or dyskariosis).mp.
6 (LGSIL or LSIL or ASCUS).mp.
7 1 or 2 or 3 or 4 or 5 or 6
8 Precancerous Conditions/
9 Early Detection of Cancer/
10 Carcinoma, Squamous Cell/
11 Neoplasms, Squamous Cell/
12 (squamous adj5 lesion*).mp.
13 (precancer* or pre‐cancer* or premalignan* or pre‐malignan* or preneoplas* or pre‐neoplas*).mp.
14 8 or 9 or 10 or 11 or 12 or 13
15 Cervix Uteri/ or cervi*.mp.
16 14 and 15
17 Vaginal Smear/ or ((cervi* or vagina*) and (smear* or screen* or test*)).mp.
18 7 or 16 or 17
19 Colposcopy/
20 colposcop*.mp.
21 (LLETZ or LEEP or NETZ or SWETZ or LC or CKC).mp.
22 exp Biopsy/
23 biops*.mp.
24 transformation zone.mp.
25 Conization/
26 (conization or conization).mp.
27 excis*.mp.
28 19 or 20 or 21 or 22 or 23 or 24 or 25 or 26 or 27
29 18 and 28
30 randomized controlled trial.pt.
31 controlled clinical trial.pt.
32 randomized.ab.
33 placebo.ab.
34 clinical trials as topic.sh.
35 randomly.ab.
36 trial.ti.
37 30 or 31 or 32 or 33 or 34 or 35 or 36
38 29 and 37
39 exp animals/ not humans.sh.
40 38 not 39
key:
mp=protocol supplementary concept, rare disease supplementary concept, title, original title, abstract, name of substance word, subject heading word, unique identifier
pt=publication type
ab=abstract
ti=title
sh=subject heading
Appendix 4. Embase search strategy
1 uterine cervix dysplasia/
2 uterine cervix carcinoma in situ/
3 (cervi* adj5 (dysplasia or neoplasia)).mp.
4 CIN*.mp.
5 (dyskaryosis or dyskariosis).mp.
6 (LGSIL or LSIL or ASCUS).mp.
7 1 or 2 or 3 or 4 or 5 or 6
8 precancer/
9 early diagnosis/
10 squamous cell carcinoma/
11 (squamous adj5 lesion*).mp.
12 (precancer* or pre‐cancer* or premalignan* or pre‐malignan* or preneoplas* or pre‐neoplas*).mp.
13 8 or 9 or 10 or 11 or 12
14 exp uterine cervix/ or cervi*.mp.
15 13 and 14
16 vagina smear/ or ((cervi* or vagina*) and (smear* or screen* or test*)).mp.
17 7 or 15 or 16
18 colposcopy/
19 colposcop*.mp.
20 (LLETZ or LEEP or NETZ or SWETZ or LC or CKC).mp.
21 exp biopsy/
22 biops*.mp.
23 transformation zone.mp.
24 uterine cervix conization/
25 (conization or conization).mp.
26 excis*.mp.
27 18 or 19 or 20 or 21 or 22 or 23 or 24 or 25 or 26
28 17 and 27
29 crossover procedure/
30 double‐blind procedure/
31 randomized controlled trial/
32 single‐blind procedure/
33 random*.mp.
34 factorial*.mp.
35 (crossover* or cross over* or cross‐over*).mp.
36 placebo*.mp.
37 (double* adj blind*).mp.
38 (singl* adj blind*).mp.
39 assign*.mp.
40 allocat*.mp.
41 volunteer*.mp.
42 29 or 30 or 31 or 32 or 33 or 34 or 35 or 36 or 37 or 38 or 39 or 40 or 41
43 28 and 42
44 (exp Animal/ or Nonhuman/ or exp Animal Experiment/) not Human/
45 43 not 44
key:
mp=title, abstract, subject headings, heading word, drug trade name, original title, device manufacturer, drug manufacturer, device trade name, keyword
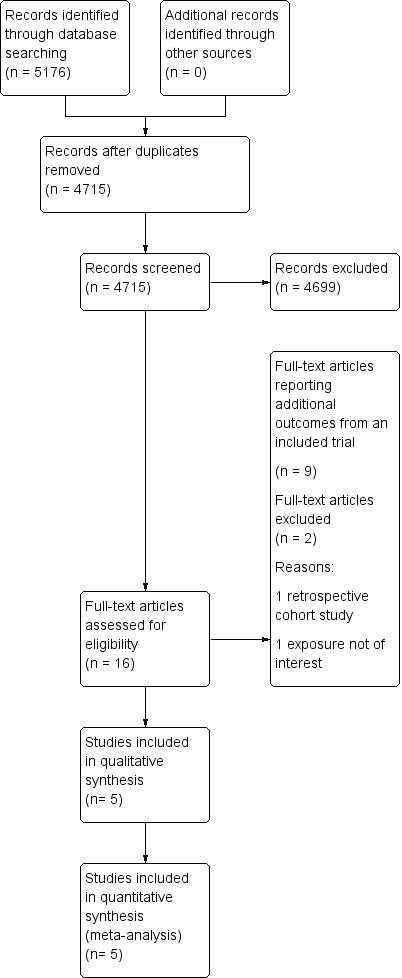
Study flow diagram

Risk of bias summary: review authors' judgements about each risk of bias item for each included study

Forest plot of comparison: occurrence of CIN2+ at different lengths of follow‐up

Forest plot of comparison: occurence of CIN3+ at different lengths of follow‐up

Forest plot of comparison: occurence of CIN2 at different lengths of follow‐up

Forest plot of comparison: default rates at different lengths of follow‐up

Comparison 1: Occurence of CIN2+ at different lengths of follow‐up: immediate colposcopy versus cytological surveillance, Outcome 1: Occurrence of CIN2+

Comparison 2: Occurence of CIN3+ at different lengths of follow‐up: immediate colposcopy versus cytological surveillance, Outcome 1: Occurrence of CIN3+

Comparison 3: Histology at 12 months: immediate colposcopy versus cytological surveillance, Outcome 1: Presence of any CIN in histology at 12 months

Comparison 3: Histology at 12 months: immediate colposcopy versus cytological surveillance, Outcome 2: Presence of CIN1/2 in histology at 12 months

Comparison 3: Histology at 12 months: immediate colposcopy versus cytological surveillance, Outcome 3: Presence of CIN3+ in histology at 12 months

Comparison 4: Histology at 24 months: immediate colposcopy versus cytological surveillance, Outcome 1: Histology at 24 months

Comparison 5: Occurence of CIN2 at different lengths of follow‐up: Immediate colposcopy versus cytological surveillance, Outcome 1: Occurrence of CIN2

Comparison 6: Default rates: immediate colposcopy versus cytological surveillance, Outcome 1: Default rates

Comparison 7: Histology at 24 months: immediate colposcopy versus cytological surveillance, LSIL/mild dyskaryosis only, Outcome 1: CIN incidence at 24 months, after LSIL/mild dyskaryosis at baseline

Comparison 8: Histology at 24 months: immediate colposcopy versus cytological surveillance, excluding 1 trial, Outcome 1: Presence of CIN2 in histology at 24 months

Comparison 8: Histology at 24 months: immediate colposcopy versus cytological surveillance, excluding 1 trial, Outcome 2: Presence of CIN2+ in histology at 24 months

Comparison 8: Histology at 24 months: immediate colposcopy versus cytological surveillance, excluding 1 trial, Outcome 3: Presence of CIN3+ in histology at 24 months
| Immediate colposcopy compared with cytological surveillance for minor cervical cytological abnormalities: occurrence of different grades CIN in histology according to follow‐up time and default rates | ||||||
| Patient or population: women with ASCUS or LSIL Settings: colposcopy clinic Intervention: immediate colposcopy Comparison: cytological surveillance | ||||||
| Outcomes | Illustrative comparative risks* (95% CI) | Relative effect | No of participants | Quality of the evidence | Comments | |
|---|---|---|---|---|---|---|
| Assumed risk | Corresponding risk | |||||
| Risk with cytological surveillance | Risk with immediate colposcopy | |||||
| Occurrence of CIN2+ in histology at 18 months | 101 per 1000 | 151 per 1000 | RR 1.50 (1.12 to 2.01) | 4028 | ⊕⊕⊕⊝ | |
| Occurrence of CIN2+ in histology at 24 months | 183 per 1000 | 209 per 1000 | RR 1.14 (0.66 to 1.97) | 4331 | ⊕⊕⊝⊝ | |
| Occurrence of CIN3+ in histology at 18 months | 69 per 1000 | 86 per 1000 | RR 1.24 (0.77 to 1.98) | 4028 | ⊕⊕⊕⊝ | |
| Occurrence of CIN3+ in histology at 24 months | 119 per 1000 | 121 per 1000 | RR 1.02 (0.53 to 1.97) | 4331 | ⊕⊕⊝⊝ | |
| Occurrence of any CIN in histology at 24 months | 316 per 1000 | 639 per 1000 | RR 2.02 (1.33 to 3.08) | 656 | ⊕⊕⊝⊝ | |
| Default rates at 6 months | 63 per 1000 | 241 per 1000 | RR 3.85 | 5117 | ⊕⊕⊕⊝ moderate6 | |
| Default rates at 12 months | 63 per 1000 | 413 per 1000 | RR 6.60 | 5115 | ⊕⊕⊕⊝ moderate7 | |
| *The basis for the assumed risk (e.g. the median control group risk across studies) is provided in footnotes. The corresponding risk (and its 95% confidence interval) is based on the assumed risk in the comparison group and the relative effect of the intervention (and its 95% CI). For default rates the relative effect is calculated between cytological surveillance versus immediate colposcopy. For histology the relative effect is calculated between immediate colposcopy versus cytological surveillance. | ||||||
| GRADE Working Group grades of evidence | ||||||
| 1 Downgraded to moderate due to substantial inter‐study heterogeneity (P = 0.08, I2= 61%). | ||||||
| Study | Outcomes | Immediate colposcopy n/N (%) | Cytological surveillance n/N (%) | RR + 95% CI |
| ALTS 2003(ASCUS) | Histology at 18 monthsa | |||
| CIN 2 | 61/1163 (5.2) | 26/1164 (2.2) | 2.35 [1.49, 3.69] | |
| CIN 2+ | 119/1163 (10.2) | 92/1164 (7.9) | 1.29 [1.00, 1.68] | |
| CIN 3+ | 58/1163 (5.0) | 66/1164 (5.7) | 0.88 [0.62, 1.24] | |
| Histology at 24 months | ||||
| CIN 2 | 61/1163 (5.2) | 60/1164 (5.2) | 1.02 [0.72,1.44] | |
| CIN 2+ | 119/1163 (10.2) | 168/1164 (14.4) | 0.71 [0.57, 0.88] | |
| CIN 3+ | 58/1163 (5.0) | 108/1164 (9.3) | 0.54 [0.39, 0.73] | |
| Default rates: | ||||
| Default rate at 24 months | 15/1163 (1.3) | 165/1164 (14.2) | 10.99 [6.52, 18.53] | |
| ALTS 2003(LSIL) | Histology at 18 monthsa | |||
| CIN 2 | 63/673 (9.4) | 36/675 (5.3) | 1.76 [1.18, 2.61] | |
| CIN 2+ | 127/673 (18.9) | 95/675 (14.1) | 1.34 [1.05, 1.71] | |
| CIN 3+ | 64/673 (9.5) | 59/675 (8.7) | 1.09 [0.78, 1.52] | |
| Histology at 24 months | ||||
| CIN 2 | 63/673 (9.4) | 58/675 (8.6) | 1.09 [0.78,1.53] | |
| CIN 2+ | 127/673 (18.9) | 151/675 (22.4) | 0.84 [0.68, 1.04] | |
| CIN 3+ | 64/673 (9.5) | 93/675 (13.8) | 0.69 [0.51, 0.93] | |
| Default rates: | ||||
| Default rate at 24 months | 4/673 (0.6) | 110/675 (16.3) | 27.42 [10.17, 73.93] | |
| Histology at 6 months | ||||
| HPV / Koilocytic atypia | 13/145 (9.0) | 28/160 (17.5) | 0.52 [0.28, 0.95] | |
| Any CIN | 121/145 (83.4) | 86/160 (53.8) | 1.55 [1.32, 1.82] | |
| CIN 1 | 23/145 (15.9) | 27/160 (16.9) | 0.94 [0.57, 1.56] | |
| CIN 2 | 32/145 (22.1) | 26/160 (16.3) | 1.36 [0.85, 2.16] | |
| CIN 2+ | 98/145 (67.6) | 59/160 (36.9) | 1.83 [1.45, 2.31] | |
| CIN 3+ | 66/145 (45.5) | 33/160 (20.6) | 2.21 [1.55, 3.14] | |
| Histology at 12 months | ||||
| HPV / Koilocytic atypia | 13/145 (9.0) | 18/158 (11.4) | 0.79 [0.40, 1.55] | |
| Any CIN | 121/145 (83.4) | 96/158 (60.8) | 1.37 [1.19, 1.59] | |
| CIN 1 | 23/145 (15.9) | 25/158 (15.8) | 1.00 [0.60, 1.69] | |
| CIN 2 | 32/145 (22.1) | 26/158 (16.5) | 1.34 [0.84, 2.14] | |
| CIN 1 / 2 | 55/145 (37.9) | 51/158 (32.3) | 1.18 [0.86, 1.60] | |
| CIN 2+ | 98/145 (67.6) | 71/158 (44.9) | 1.50 [1.22, 1.85] | |
| CIN 3+ | 66/145 (45.5) | 45/158 (28.5) | 1.60 [1.18, 2.17] | |
| Histology at 24 months | ||||
| HPV / Koilocytic atypia | 13/145 (9.0) | 11/158 (7.0) | 1.29 [0.60, 2.78] | |
| Any CIN | 121/145 (83.4) | 53/158 (33.5) | 2.49 [1.97, 3.13] | |
| CIN 1 | 23/145 (15.9) | 9/158 (5.7) | 2.78 [1.33, 5.82] | |
| CIN 2 | 32/145 (22.1) | 12/158 (7.6) | 2.91 [1.56, 5.42] | |
| CIN 2+ | 98/145 (67.6) | 44/158 (27.8) | 2.43 [1.84, 3.20] | |
| CIN 3+ | 66/145 (45.5) | 32/158 (20.3) | 2.25 [1.57, 3.21] | |
| Default rates: | ||||
| Default rate at 6 months | 0/145 (0) | 19/160 (11.9) | 35.37 [2.15, 580.52] | |
| Default rate at 12 months | 0/145 (0) | 23/158 (14.6) | 43.16 [2.65, 704.13] | |
| Default rate at 24 months | 0/145 (0) | 38/158 (24.1) | 70.70 [4.38, 1140.47] | |
| Histology at 12 months | ||||
| Any CIN | 83/130 (63.8) | 71/243 (29.2) | 2.19 [1.73, 2.76] | |
| CIN 1 / 2 | 61/130 (46.9) | 47/243 (19.3) | 2.43 [1.77, 3.32] | |
| CIN 3+ | 22/130 (16.9) | 24/243 (9.9) | 1.71 [1.00, 2.93] | |
| Default rates: | ||||
| Default rate at 6 months | 5/130 (3.8) | 46/243 (18.9) | 4.92 [2.01, 12.08] | |
| Default rate at 12 months | 5/130 (3.8) | 95/243 (39.1) | 10.16 [4.24, 24.35] | |
| GHQ casenessb | Choicec | No choicec | ||
| Baseline | 134/233 (58) | 119/241 (49) | 1.16 [0.98, 1.38] | |
| 6 months (pre visit) | 71/183 (39) | 77/190 (41) | 0.96 [0.75, 1.23] | |
| 6 months (post visit) | 59/175 (34) | 66/177 (37) | 0.90 [0.68, 1.20] | |
| 12 months | 40/135 (29) | 35/127 (28) | 1.08 [0.73, 1.58] | |
| Histology at 18 monthsa | ||||
| CIN 2 | 8/182(4.4) | 2/171 (1.1) | 3.76 [0.81, 17.45] | |
| CIN 2+ | 43/182 (23.6) | 16/171 (9.4) | 2.53 [1.48, 4.31] | |
| CIN 3+ | 35/182 (19.2) | 14/171(8.2) | 2.35 [1.31, 2.45] | |
| Histology at 24 months | ||||
| HPV / Koilocytic atypia | 92/182 (50.5) | 57/171 (33.3) | 1.52 [1.17, 1.96] | |
| Any CIN | 88/182 (48.4) | 51/171 (29.8) | 1.62 [1.23, 2.13] | |
| CIN 1 | 45/182 (24.7) | 17/171 (9.9) | 2.49 [1.48, 4.17] | |
| CIN 2 | 8/182 (4.4) | 10/171 (5.8) | 0.75 [0.30, 1.86] | |
| CIN 2+ | 43/182 (23.6) | 34/171 (19.9) | 1.19 [0.80, 1.77] | |
| CIN 3+ | 35/182 (19.2) | 24/171 (14.0) | 1.37 [0.85, 2.20] | |
| Default rates: | ||||
| Default rate at 24 months | 1/182 (0.5) | 36/171 (21.1) | 38.32 [5.31, 276.40] | |
| Tombola 2009 | Histology at 30 monthsa | |||
| CIN 2 | 181/2216 (8.2) | 101/2223 (4.5) | 1.80 [1.42, 2.28] | |
| CIN 2+ | 369/2216 (16.7) | 269/2223 (12.1) | 1.38 [1.19, 1.59] | |
| CIN 3+ | 188/2216 (8.5) | 168/2223 (7.6) | 1.12 [0.92, 1.37] | |
| Histology at 36 months | ||||
| CIN 2 | 181/2216 (8.2) | 157/2223 (7.1) | 1.16 [0.94, 1.42] | |
| CIN 2+ | 369/2216 (16.7) | 350/2223 (15.7) | 1.06 [0.93, 1.21] | |
| CIN 3+ | 188/2216 (8.5) | 193/2223 (8.7) | 0.98 [0.81, 1.18] | |
| Default rates: | ||||
| Default rate at 6 months | 151/2216 (6.8) | 285/2223 (12.8) | 1.88 [1.56, 2.27] | |
| Default rate at 12 months | 151/2216 (6.8) | 327/2223 (14.7) | 2.16 [1.80, 2.59] | |
| Paind | ||||
| Any pain | 304/782 (38.9) | 145/968 (15.0) | 2.60 [2.18, 3.09] | |
| Moderate or more severe | 144/774 (18.6) | 56/965 (5.8) | 3.21 [2.39, 4.30] | |
| Bleedingd | ||||
| Any bleeding | 366/781 (46.9) | 166/967 (17.2) | 2.73 [2.33, 3.19] | |
| Moderate or more severe | 144/772 (18.6) | 16/961 (1.7) | 11.20 [6.74, 18.61] | |
| Discharged | ||||
| Any discharge | 267/780 (34.2) | 83/964 (8.6) | 3.98 [3.17, 4.99] | |
| Moderate or more severe | 133/777 (17.1) | 36/962 (3.7) | 4.57 [3.20, 6.53] | |
| Anxietye | ||||
| 6 weeks | 59/751 (7.9) | 121/900 (13.4) | 0.58 [0.43, 0.79] | |
| 12 months | 190/1161 (16.4) | 218/1130 (19.3) | 0.85 [0.71, 1.01] | |
| 18 months | 162/1050 (15.4) | 177/1008 (17.6) | 0.88 [0.72, 1.07] | |
| 24 months | 179/1001 (17.9) | 177/962 (18.4) | 0.97 [0.81, 1.17] | |
| 30 months | 146/949 (15.4) | 143/887 (16.1) | 0.95 [0.77, 1.18] | |
| Depressionf | ||||
| 6 weeks | 50/757 (6.6) | 68/902 (7.5) | 0.88 [0.62, 1.25] | |
| 12 months | 110/1162 (9.5) | 132/1136 (11.6) | 0.81 [0.64, 1.04] | |
| 18 months | 106/1052 (10.1) | 114/1016 (11.2) | 0.90 [0.70, 1.15] | |
| 24 months | 111/1001 (11.1) | 104/964 (10.8) | 1.03 [0.80, 1.32] | |
| 30 months | 101/948 (10.7) | 108/887 (12.2) | 0.88 [0.68, 1.13] | |
| For Immediate colposcopy, n = n at immediate colposcopy visit, possible follow‐up excluded. a Cumulative incidence during follow‐up, excluding the exit examination or deferred treatment. b GHQ caseness = GHQ (General Health Questionnaire) score ≥ 4. c Analysis for this outcome between the original randomization groups. d Based on Questionnaire 6 weeks after immediate colposcopy or first cytological surveillance visit. e ≥ 11 on hospital anxiety and depression anxiety subscale f ≥ 8 on hospital anxiety and depression subscale | ||||
| Outcome or subgroup title | No. of studies | No. of participants | Statistical method | Effect size |
| 1.1 Occurrence of CIN2+ Show forest plot | 3 | Risk Ratio (IV, Random, 95% CI) | Subtotals only | |
| 1.1.1 18 months' surveillance | 2 | 4028 | Risk Ratio (IV, Random, 95% CI) | 1.50 [1.12, 2.01] |
| 1.1.2 24 months' surveillance | 3 | 4331 | Risk Ratio (IV, Random, 95% CI) | 1.14 [0.66, 1.97] |
| Outcome or subgroup title | No. of studies | No. of participants | Statistical method | Effect size |
| 2.1 Occurrence of CIN3+ Show forest plot | 4 | Risk Ratio (IV, Random, 95% CI) | Subtotals only | |
| 2.1.1 12 months' surveillance | 2 | 676 | Risk Ratio (IV, Random, 95% CI) | 2.07 [1.54, 2.79] |
| 2.1.2 18 months' surveillance | 2 | 4028 | Risk Ratio (IV, Random, 95% CI) | 1.24 [0.77, 1.98] |
| 2.1.3 24 months' surveillance | 3 | 4331 | Risk Ratio (IV, Random, 95% CI) | 1.02 [0.53, 1.97] |
| Outcome or subgroup title | No. of studies | No. of participants | Statistical method | Effect size |
| 3.1 Presence of any CIN in histology at 12 months Show forest plot | 2 | 676 | Risk Ratio (IV, Random, 95% CI) | 1.72 [1.09, 2.70] |
| 3.2 Presence of CIN1/2 in histology at 12 months Show forest plot | 2 | 676 | Risk Ratio (IV, Random, 95% CI) | 1.69 [0.83, 3.43] |
| 3.3 Presence of CIN3+ in histology at 12 months Show forest plot | 2 | 676 | Risk Ratio (IV, Random, 95% CI) | 1.63 [1.25, 2.12] |
| Outcome or subgroup title | No. of studies | No. of participants | Statistical method | Effect size |
| 4.1 Histology at 24 months Show forest plot | 3 | Risk Ratio (IV, Random, 95% CI) | Subtotals only | |
| 4.1.1 HPV/Koilocytic atypia | 2 | 656 | Risk Ratio (IV, Random, 95% CI) | 1.49 [1.17, 1.90] |
| 4.1.2 Any CIN | 2 | 656 | Risk Ratio (IV, Random, 95% CI) | 2.02 [1.33, 3.08] |
| 4.1.3 CIN1 | 2 | 656 | Risk Ratio (IV, Random, 95% CI) | 2.58 [1.69, 3.94] |
| 4.1.4 CIN2 | 3 | 4331 | Risk Ratio (IV, Random, 95% CI) | 1.25 [0.80, 1.96] |
| 4.1.5 CIN2+ | 3 | 4331 | Risk Ratio (IV, Random, 95% CI) | 1.14 [0.66, 1.97] |
| 4.1.6 CIN3+ | 3 | 4331 | Risk Ratio (IV, Random, 95% CI) | 1.02 [0.53, 1.97] |
| Outcome or subgroup title | No. of studies | No. of participants | Statistical method | Effect size |
| 5.1 Occurrence of CIN2 Show forest plot | 3 | Risk Ratio (IV, Random, 95% CI) | Subtotals only | |
| 5.1.1 18 months' surveillance | 2 | 4028 | Risk Ratio (IV, Random, 95% CI) | 2.04 [1.52, 2.73] |
| 5.1.2 24 months' surveillance | 3 | 4331 | Risk Ratio (IV, Random, 95% CI) | 1.45 [0.87, 2.40] |
| Outcome or subgroup title | No. of studies | No. of participants | Statistical method | Effect size |
| 6.1 Default rates Show forest plot | 5 | Risk Ratio (IV, Random, 95% CI) | Subtotals only | |
| 6.1.1 Default rates at 6 months | 3 | 5117 | Risk Ratio (IV, Random, 95% CI) | 3.85 [1.27, 11.63] |
| 6.1.2 Default rates at 12 months | 3 | 5115 | Risk Ratio (IV, Random, 95% CI) | 6.60 [1.49, 29.29] |
| 6.1.3 Default rates at 24 months | 3 | 4331 | Risk Ratio (IV, Random, 95% CI) | 19.10 [9.02, 40.43] |
| Outcome or subgroup title | No. of studies | No. of participants | Statistical method | Effect size |
| 7.1 CIN incidence at 24 months, after LSIL/mild dyskaryosis at baseline Show forest plot | 2 | Risk Ratio (IV, Random, 95% CI) | Subtotals only | |
| 7.1.1 CIN2 incidence at 24 months | 2 | 1651 | Risk Ratio (IV, Random, 95% CI) | 1.72 [0.66, 4.48] |
| 7.1.2 CIN2+ incidence at 24 months | 2 | 1651 | Risk Ratio (IV, Random, 95% CI) | 1.43 [0.51, 4.01] |
| 7.1.3 CIN3+ incidence at 24 months | 2 | 1651 | Risk Ratio (IV, Random, 95% CI) | 1.24 [0.39, 3.94] |
| Outcome or subgroup title | No. of studies | No. of participants | Statistical method | Effect size |
| 8.1 Presence of CIN2 in histology at 24 months Show forest plot | 2 | 656 | Risk Ratio (IV, Random, 95% CI) | 1.54 [0.41, 5.78] |
| 8.2 Presence of CIN2+ in histology at 24 months Show forest plot | 2 | 656 | Risk Ratio (IV, Random, 95% CI) | 1.72 [0.86, 3.47] |
| 8.3 Presence of CIN3+ in histology at 24 months Show forest plot | 2 | 656 | Risk Ratio (IV, Random, 95% CI) | 1.80 [1.11, 2.92] |