Maßnahmen zur Förderung der Wiedereingliederung und Verringerung schädlicher Verhaltens‐ und Lebensweisen bei Kindern und Jugendlichen, die vorübergehend oder dauerhaft auf der Straße leben
Referencias
References to studies included in this review
References to studies excluded from this review
References to studies awaiting assessment
References to ongoing studies
Additional references
Characteristics of studies
Characteristics of included studies [ordered by study ID]
| Methods | RCT | |
| Participants | Homeless; 14 to 19 years of age (mean age 17.9); 56% male, 44% female; drop‐in; USA | |
| Interventions | Brief motivational intervention (75); SAU (52); 1 to 4 sessions (avg 17/32 min); covering 13 topics; up to 4 weeks | |
| Outcomes | Alcohol and drug use frequency and severity, 1 and 3 months; service utilisation, 1 and 3 months; counsellor‐rated engagement; participant satisfaction | |
| Funding source | National Institute on Drug Abuse grant | |
| Notes | ||
| Risk of bias | ||
| Bias | Authors' judgement | Support for judgement |
| Random sequence generation (selection bias) | Low risk | Urn randomisation stratifying for population characteristics |
| Allocation concealment (selection bias) | Low risk | Email evidence from study author ‐ randomisation by phone call to office during intake when office‐based project director would run the programme |
| Blinding of participants and personnel (performance bias) | High risk | Not possible to blind participants and service delivery staff to such an intervention |
| Blinding of outcome assessment (detection bias) | Low risk | Baseline interview without blinding but post‐test assessment blinded |
| Incomplete outcome data (attrition bias) | Unclear risk | Analysed data for participants only full data set was provided |
| Selective reporting (reporting bias) | Unclear risk | All outcomes analysed as far as we know |
| Other bias | Unclear risk | Incentives given to participants |
| Methods | RCT | |
| Participants | Homeless youth with drug or alcohol dependence; 14 to 20 years of age (mean age 18.74); 47% female, 53% male; drop‐in centre; USA | |
| Interventions | Case management (CM); community reinforcement approach (CRA); motivational enhancement therapy (MET); HIV intervention | |
| Outcomes | HIV risk; HIV knowledge; condom use; number of sex partners; substance use; psychological outcomes; % homeless days; victimisation; 3, 6 and 12 months | |
| Funding source | NIDA grant | |
| Notes | ||
| Risk of bias | ||
| Bias | Authors' judgement | Support for judgement |
| Random sequence generation (selection bias) | Low risk | Urn randomisation |
| Allocation concealment (selection bias) | Low risk | Email from author: Programme director conducted all randomisations in her office (staff called her when they had received participant information) |
| Blinding of participants and personnel (performance bias) | High risk | Not possible to blind participants and service delivery staff to such an intervention |
| Blinding of outcome assessment (detection bias) | High risk | Self report and urine toxicology screen |
| Incomplete outcome data (attrition bias) | Low risk | Intention‐to‐treat design, missing data assumed to be missing at random following analysis of drop‐outs |
| Selective reporting (reporting bias) | Unclear risk | Not clear whether all outcomes reported |
| Methods | Same as above | |
| Participants | Same as above | |
| Interventions | Same as above | |
| Outcomes | Same as above | |
| Funding source | Same as above | |
| Notes | ||
| Risk of bias | ||
| Bias | Authors' judgement | Support for judgement |
| Random sequence generation (selection bias) | Low risk | Same as above |
| Allocation concealment (selection bias) | Low risk | Same as above |
| Blinding of participants and personnel (performance bias) | High risk | Same as above |
| Blinding of outcome assessment (detection bias) | High risk | Same as above |
| Incomplete outcome data (attrition bias) | Low risk | Same as above |
| Selective reporting (reporting bias) | Unclear risk | Same as above |
| Methods | Same as above | |
| Participants | Same as above | |
| Interventions | Same as above | |
| Outcomes | Same as above | |
| Funding source | Same as above | |
| Notes | This intervention was a co‐intervention accompanying the interventions detailed above (CM, CRA) | |
| Risk of bias | ||
| Bias | Authors' judgement | Support for judgement |
| Random sequence generation (selection bias) | Low risk | Same as above |
| Allocation concealment (selection bias) | Low risk | Same as above |
| Blinding of participants and personnel (performance bias) | High risk | Same as above |
| Blinding of outcome assessment (detection bias) | High risk | Same as above |
| Incomplete outcome data (attrition bias) | Low risk | Same as above |
| Selective reporting (reporting bias) | Unclear risk | Same as above |
| Methods | Same as above | |
| Participants | Same as above | |
| Interventions | Same as above | |
| Outcomes | Same as above | |
| Funding source | Same as above | |
| Notes | This intervention was selected by review authors as the control condition, in the absence of an SAU condition | |
| Risk of bias | ||
| Bias | Authors' judgement | Support for judgement |
| Random sequence generation (selection bias) | Low risk | Same as above |
| Allocation concealment (selection bias) | Low risk | Same as above |
| Blinding of participants and personnel (performance bias) | High risk | Same as above |
| Blinding of outcome assessment (detection bias) | High risk | Same as above |
| Incomplete outcome data (attrition bias) | Low risk | Same as above |
| Selective reporting (reporting bias) | Unclear risk | Same as above |
| Methods | RCT | |
| Participants | Homeless; mean age 16.5 years; 57% male, 43% female; multi‐service drop‐in; USA | |
| Interventions | Intensive case management (55); regular case management (60); 3 phases, flexible timing; multi‐component; flexible duration | |
| Outcomes | Psychological and social adjustment, 3 months | |
| Funding source | NIMH/SAMHSA grant | |
| Notes | ||
| Risk of bias | ||
| Bias | Authors' judgement | Support for judgement |
| Random sequence generation (selection bias) | Low risk | Random assignment was accomplished by preparing a stack of sequentially numbered envelopes and placing in each a card with a matching number and group assignment. Random assignment was to the group, not to an individual therapist |
| Allocation concealment (selection bias) | High risk | Message from study author: Randomisation was conducted at the service site at the time of admission |
| Blinding of participants and personnel (performance bias) | High risk | Not possible to blind participants and service delivery staff to such an intervention |
| Blinding of outcome assessment (detection bias) | Unclear risk | Not specified ‐ some data were self reported |
| Incomplete outcome data (attrition bias) | Unclear risk | Not clear how attrition was accounted for |
| Selective reporting (reporting bias) | Unclear risk | All outcomes analysed as far as we know |
| Methods | RCT | |
| Participants | Runaway; 8 to 18 years of age (mean age 15.5); male, shelter (Christian); Korea | |
| Interventions | CBT group therapy (14); SAU (13) 50‐minute session, up to 8 weeks | |
| Outcomes | Self esteem; depression; self efficacy, 8 weeks | |
| Funding source | Korea Research Foundation Grant | |
| Notes | ||
| Risk of bias | ||
| Bias | Authors' judgement | Support for judgement |
| Random sequence generation (selection bias) | High risk | Odd/even number distribution at time of consent |
| Allocation concealment (selection bias) | High risk | Odd/even number distribution at time of consent |
| Blinding of participants and personnel (performance bias) | High risk | Not possible to blind participants and service delivery staff to such an intervention |
| Blinding of outcome assessment (detection bias) | Unclear risk | Not specified |
| Incomplete outcome data (attrition bias) | High risk | Excluded 5 non‐returners from analysis (2 in experimental group and 3 in control group) |
| Selective reporting (reporting bias) | Unclear risk | All outcomes analysed as far as we know |
| Methods | RCT | |
| Participants | Newly homeless; 12 to 17 years of age (mean 14.8 years); 33.8% male, 66.2% female; agencies/street‐based; USA | |
| Interventions | Behavioural family intervention (68); SAU (83); 5 × 60 to 90 minutes; up to 5 weeks (76%) | |
| Outcomes | Number of partners; times had alcohol; times used marijuana; times used hard drugs; number of delinquent behaviours; 3, 6 and 12 months | |
| Funding source | National Institute of Mental Health | |
| Notes | ||
| Risk of bias | ||
| Bias | Authors' judgement | Support for judgement |
| Random sequence generation (selection bias) | Low risk | Used computerised coin toss method |
| Allocation concealment (selection bias) | Low risk | After the family gave consent and baseline assessments were performed, the recruitment/assessment team referred participants to the intervention team, which used the coin toss to allocate without meeting the families |
| Blinding of participants and personnel (performance bias) | High risk | Not possible to blind participants and service delivery staff to such an intervention |
| Blinding of outcome assessment (detection bias) | Low risk | Assessment team blinded to study arm |
| Incomplete outcome data (attrition bias) | Unclear risk | No information on drop‐outs or loss to follow‐up |
| Selective reporting (reporting bias) | Unclear risk | All outcomes analysed as far as we know |
| Methods | RCT | |
| Participants | Homeless youth actively engaged in drug use; 18 to 25 years of age (mean age 21.2); 70% male, 30% female; drop‐in centre; USA | |
| Interventions | Health promotion programme (nursing) (HPP); art messaging programme (AMP) | |
| Outcomes | Drug and alcohol use; mental health; health outcomes; 6 months | |
| Funding source | National Institute on Drug Abuse | |
| Notes | ||
| Risk of bias | ||
| Bias | Authors' judgement | Support for judgement |
| Random sequence generation (selection bias) | Low risk | Email from study author: Randomisation was conducted by a computer randomisation programme; the printout of this programme dictated to which group the next enrolled person would be assigned |
| Allocation concealment (selection bias) | Unclear risk | Not specified |
| Blinding of participants and personnel (performance bias) | High risk | Not possible to blind participants and service delivery staff to such an intervention |
| Blinding of outcome assessment (detection bias) | High risk | Self report |
| Incomplete outcome data (attrition bias) | High risk | Missing participants not included in the analysis. Drop‐out rate similar for both groups. African American and Hispanic participants more likely to have dropped out |
| Selective reporting (reporting bias) | Unclear risk | Comparable raw data not presented for all outcomes |
| Methods | Same as above | |
| Participants | Same as above | |
| Interventions | Same as above | |
| Outcomes | Same as above | |
| Funding source | Same as above | |
| Notes | This intervention was selected by review authors as the control condition, in the absence of an SAU condition | |
| Risk of bias | ||
| Bias | Authors' judgement | Support for judgement |
| Random sequence generation (selection bias) | Low risk | Same as above |
| Allocation concealment (selection bias) | Unclear risk | Same as above |
| Blinding of participants and personnel (performance bias) | High risk | Same as above |
| Blinding of outcome assessment (detection bias) | High risk | Same as above |
| Incomplete outcome data (attrition bias) | High risk | Same as above |
| Selective reporting (reporting bias) | Unclear risk | Same as above |
| Methods | RCT | |
| Participants | Homeless; 14 to 19 years of age (mean age 17.4); 54.7% male, 45.3% female; street‐based; USA | |
| Interventions | Brief motivational enhancement (92); assessment only (99); assessment at follow‐up only (94); 10 to 70 (avg 30) minutes; single session | |
| Outcomes | Alcohol and drug use, 1 and 3 months | |
| Funding source | National Institute on Alcohol Abuse and Alcoholism grant; National Institute on Drug Abuse grant | |
| Notes | ||
| Risk of bias | ||
| Bias | Authors' judgement | Support for judgement |
| Random sequence generation (selection bias) | Low risk | Urn randomisation stratifying for population characteristics |
| Allocation concealment (selection bias) | Low risk | Author emailed to say outreach staff contacted the office. Randomisation took place after basic demographic info was entered using computerised urn method by Project Director at study office |
| Blinding of participants and personnel (performance bias) | High risk | Not possible to blind participants and service delivery staff to such an intervention |
| Blinding of outcome assessment (detection bias) | High risk | Interviewers not blind to the condition |
| Incomplete outcome data (attrition bias) | High risk | Incomplete data for all outcomes across all conditions |
| Selective reporting (reporting bias) | Unclear risk | None as far as we know |
| Other bias | Unclear risk | Study authors report that differences at 1 month might have been due to differences among interviewers |
| Methods | Quasi‐RCT | |
| Participants | Homeless; 16 to 23 years of age (mean age 19.5); 61% male, 39% female; street outreach centre; USA | |
| Interventions | Gender‐specific group intervention (196), no intervention (287), control and intervention (89); 8 × 1 hour; 3 weeks | |
| Outcomes | Cognitive‐perceptual and behavioural outcomes, 3 and 6 weeks | |
| Funding source | National Institute of Nursing Research; National Institutes of Health | |
| Notes | ||
| Risk of bias | ||
| Bias | Authors' judgement | Support for judgement |
| Random sequence generation (selection bias) | High risk | Quasi‐RCT; 3‐group design: control group only (287); intervention group only (196); intervention and control groups (i.e. both phases of study) (89) Very unclear process but study author unable to supply more information |
| Allocation concealment (selection bias) | High risk | Not randomised. Unlear processes, as above |
| Blinding of participants and personnel (performance bias) | High risk | Not possible to blind participants and service delivery staff to such an intervention |
| Blinding of outcome assessment (detection bias) | High risk | Self assessment |
| Incomplete outcome data (attrition bias) | High risk | 233 excluded who did not complete all measures |
| Selective reporting (reporting bias) | Unclear risk | As far as we know |
| Methods | CBA | |
| Participants | Runaways; 11 to 18 years of age (mean age 15.6); 51% male, 49% female; shelters; USA | |
| Interventions | Intensive programme intervention group (167, 2 shelters); SAU (144, 2 shelters); 10+ group sessions (avg 9); up to 6 weeks | |
| Outcomes | Sexual behaviours and substance use; 3, 6, 12, 18 and 24 months | |
| Funding source | National Institute of Mental Health grant and University‐wide AIDS research programme grant | |
| Notes | ||
| Risk of bias | ||
| Bias | Authors' judgement | Support for judgement |
| Random sequence generation (selection bias) | High risk | Not randomised ‐ quasi‐experimental according to study author definition. Total of 4 shelters selected for different group conditions but not randomly, so not a cluster‐RCT |
| Allocation concealment (selection bias) | Unclear risk | Study authors did not respond to query on this |
| Blinding of participants and personnel (performance bias) | High risk | Not possible to blind participants and service delivery staff to such an intervention |
| Blinding of outcome assessment (detection bias) | Low risk | Generally, interviewers did not know intervention status of young people interviewed |
| Incomplete outcome data (attrition bias) | Unclear risk | Individuals selected into groups for analysis on the basis of propensity scores according to demographic characteristics. Only certain groups selected to be analysed |
| Selective reporting (reporting bias) | Unclear risk | Investigators appear to analyse all outcomes |
| Methods | RCT | |
| Participants | Substance‐abusing runaways (and family members); mean age 14.8 years; 41.1% male, 58.9% female; shelter; USA | |
| Interventions | Ecologically based family therapy (65); SAU (59); up to 15 sessions (45%); systemic | |
| Outcomes | Substance use; adolescent psychological functioning; family functioning; HIV/AIDS behaviour; diagnostic status, 3, 6 and 12 months | |
| Funding source | NIDA grant | |
| Notes | ||
| Risk of bias | ||
| Bias | Authors' judgement | Support for judgement |
| Random sequence generation (selection bias) | Low risk | Urn randomisation stratifying for many population characteristics: gender, age, primary drug of abuse, ethnicity, psychiatric severity, number of previous runaway episodes |
| Allocation concealment (selection bias) | Low risk | Email from study author: Project director conducted randomisation in absence of participants |
| Blinding of participants and personnel (performance bias) | High risk | Not possible to blind participants and service delivery staff to such an intervention |
| Blinding of outcome assessment (detection bias) | Low risk | Email from study author confirming that outcome assessment was blinded |
| Incomplete outcome data (attrition bias) | High risk | Participants who dropped out excluded from analysis |
| Selective reporting (reporting bias) | Unclear risk | None known |
| Methods | RCT | |
| Participants | Homeless; 14 to 22 years of age (mean age 19.2) 66% male, 34% female; drop‐in; USA | |
| Interventions | Community reinforcement approach + HIV treatment (96); SAU (84); up to 12 sessions (mean 6.8) | |
| Outcomes | Substance use; individual functioning and social stability, 6 months; HIV risk behaviour, 3 and 6 months | |
| Funding source | ||
| Notes | ||
| Risk of bias | ||
| Bias | Authors' judgement | Support for judgement |
| Random sequence generation (selection bias) | Low risk | Urn randomisation stratifying for population characteristics |
| Allocation concealment (selection bias) | Low risk | Randomisation conducted by Project DIrector and youth's group assignment subsequently communicated to the Project Co‐ordinator |
| Blinding of participants and personnel (performance bias) | High risk | Not possible to blind participants and service delivery staff to such an intervention |
| Blinding of outcome assessment (detection bias) | High risk | Research assistants not blinded to participants' treatment condition |
| Incomplete outcome data (attrition bias) | High risk | Drop‐outs not included in analysis, although significance of differences between completers and non‐completers vary between outcomes |
| Selective reporting (reporting bias) | Unclear risk | As far as we know |
| Methods | RCT | |
| Participants | Alcohol‐abusing runaways; 12 to 17 years of age (mean age 15.1); 45% male, 55% female; 2 shelters; USA | |
| Interventions | Ecologically based family therapy (EBFT) (47); SAU (42); up to 16 × 50 minutes | |
| Outcomes | Substance use; psychological functioning and family functioning, 3, 9 and 15 months | |
| Funding source | ||
| Notes | ||
| Risk of bias | ||
| Bias | Authors' judgement | Support for judgement |
| Random sequence generation (selection bias) | Low risk | Urn randomisation stratifying for population characteristics: gender, age, ethnicity, number of days of substance use in last 90 days, co‐morbidity status, number of previous runaway episodes |
| Allocation concealment (selection bias) | Low risk | Randomisation conducted by Project DIrector and youth's group assignment communicated subsequently to Project Co‐ordinator |
| Blinding of participants and personnel (performance bias) | High risk | Not possible to blind participants and service delivery staff to such an intervention |
| Blinding of outcome assessment (detection bias) | High risk | Self report |
| Incomplete outcome data (attrition bias) | Unclear risk | Numbers lost not included in the analysis depending on which assessments participants completed |
| Selective reporting (reporting bias) | Unclear risk | Not clear whether all outcomes assessed |
| Methods | RCT | |
| Participants | Alcohol‐abusing runaways; 12 to 17 years of age (mean age 15.1); 45% male, 55% female; 2 shelters; USA | |
| Interventions | Functional family therapy (FFT) (40); SAU (42); up to 16 × 50 minutes | |
| Outcomes | Substance use; psychological functioning and family functioning, 3, 9 and 15 months | |
| Funding source | ||
| Notes | ||
| Risk of bias | ||
| Bias | Authors' judgement | Support for judgement |
| Random sequence generation (selection bias) | Low risk | Urn randomisation stratifying for population characteristics |
| Allocation concealment (selection bias) | Low risk | Randomisation conducted by Project DIrector and youth's group assignment communicated subsequently to Project Co‐ordinator |
| Blinding of participants and personnel (performance bias) | High risk | Not possible to blind participants and service delivery staff to such an intervention |
| Blinding of outcome assessment (detection bias) | High risk | Self report |
| Incomplete outcome data (attrition bias) | Unclear risk | Numbers lost not included in the analysis depending on which assessments participants completed |
| Selective reporting (reporting bias) | Unclear risk | Not clear whether all outcomes assessed |
| Methods | RCT | |
| Participants | Alcohol‐ or drug‐abusing runaways; 12 to 17 years of age (mean age 15.4); 1 runaway shelter; USA | |
| Interventions | Ecologically based family therapy (EBFT); community reinforcement approach (CRA); motivational enhancement therapy (MET)/motivational interviwiewing (MI) Additionally HIV intervention offered to each group | |
| Outcomes | Percent days of drug and alcohol use (except tobacco); psychological outcomes; 3, 6, 9, 12, 18 and 24 months | |
| Funding source | NIDA grant | |
| Notes | ||
| Risk of bias | ||
| Bias | Authors' judgement | Support for judgement |
| Random sequence generation (selection bias) | Low risk | Urn randomisation stratifying for population characteristics: age, gender and ethnicity |
| Allocation concealment (selection bias) | Low risk | Email from study author: Programme director conducted all randomisations in her office (staff called her when they had received participant information) |
| Blinding of participants and personnel (performance bias) | High risk | Not possible to blind participants and service delivery staff to such an intervention |
| Blinding of outcome assessment (detection bias) | High risk | Self report |
| Incomplete outcome data (attrition bias) | Low risk | Missing data assumed to be missing at random following analysis of drop‐outs |
| Selective reporting (reporting bias) | Unclear risk | Not clear whether all outcomes assessed |
| Methods | Same as above | |
| Participants | Same as above | |
| Interventions | Same as above | |
| Outcomes | Same as above | |
| Funding source | Same as above | |
| Notes | ||
| Risk of bias | ||
| Bias | Authors' judgement | Support for judgement |
| Random sequence generation (selection bias) | Low risk | Same as above |
| Allocation concealment (selection bias) | Low risk | Same as above |
| Blinding of participants and personnel (performance bias) | High risk | Same as above |
| Blinding of outcome assessment (detection bias) | High risk | Same as above |
| Incomplete outcome data (attrition bias) | Low risk | Same as above |
| Selective reporting (reporting bias) | Unclear risk | Same as above |
| Methods | Same as above | |
| Participants | Same as above | |
| Interventions | Same as above | |
| Outcomes | Same as above | |
| Funding source | Same as above | |
| Notes | This intervention was selected by review authors as the control condition, in the absence of an SAU condition | |
| Risk of bias | ||
| Bias | Authors' judgement | Support for judgement |
| Random sequence generation (selection bias) | Low risk | Same as above |
| Allocation concealment (selection bias) | Low risk | Same as above |
| Blinding of participants and personnel (performance bias) | High risk | Same as above |
| Blinding of outcome assessment (detection bias) | High risk | Same as above |
| Incomplete outcome data (attrition bias) | Low risk | Same as above |
| Selective reporting (reporting bias) | Unclear risk | Same as above |
Abbreviations:
AIDS: acquired immunodeficiency syndrome.
AMP: art messaging programme.
CBA: controlled before‐and‐after trial.
CBT: cognitive‐behavioural therapy.
CM: case management.
CRA: community reinforcement approach.
EBFT: ecologically based family therapy.
HIV: human immunodeficiency virus.
HPP: health promotion programme.
MET: motivational enhancement therapy.
MI: motivational interviewing.
NIDA: National Institute on Drug Abuse.
NIMH: National Institute of Mental Health.
RCT: randomised controlled trial.
SAMHSA: Substance Abuse and Mental Health Services Administration.
SAU: service as usual.
Characteristics of excluded studies [ordered by study ID]
| Study | Reason for exclusion |
| Review of studies | |
| No control group | |
| Convenience control group | |
| Cross‐sectional | |
| Study would have been eligible for inclusion, except that 27% of study participants were 25 to 35 years of age. Separate data were requested from study authors for study population eligible for inclusion, but were not received in time for inclusion. The YP4 intervention assessed in this study was based in Australia and involved case management and joined‐up services for young homeless job seekers. | |
| Not available | |
| As confirmed by the study author, the sample in this randomised controlled trial (RCT) consisted of 'former street children' who were not necessarily currently street‐connected, and it included other types of vulnerable children living at the same residential centre. Study methods were robust, and the study would have been included were it not for the lack of comparability with other study populations included in this review. This was the only identified RCT involving a potentially relevant population and conducted in a low‐income country (Burundi) that has been referred to in our discussion. The study demonstrates that RCTs are feasible in a low‐income country setting, even if it was not possible in this instance to recruit a sample of former street children only, as was the original intention of the study (personal communication with study author). Intervention differed from any of those included in the review, focusing on prevention of aggressive behaviours in residentially sheltered boys and drawing on a trauma‐informed theoretical framework | |
| No control group | |
| Qualitative evaluation | |
| Convenience control group | |
| Survey | |
| Abstract only | |
| No homeless population | |
| No control group | |
| No evaluation | |
| Control group not randomly assigned | |
| Not randomly assigned; no relevant outcomes | |
| Protocol; actual study not available | |
| No comparison group | |
| No evaluation | |
| No comparison group | |
| Not on street children | |
| Age group too wide | |
| Not available | |
| Not an evaluation | |
| Review of projects | |
| Adult population (delete) | |
| Convenience comparison group. This is the only identified study conducted in a middle‐income country (Nigeria) involving a (non‐randomised) controlled study design with a relevant street‐connected population. The focus of the study was on HIV/AIDS‐related outcomes, which are outside the main focus of our review, although some social behaviour skills were also examined in this study | |
| No evaluation | |
| No control group | |
| Not available | |
| No comparison group | |
| Focus on suicide | |
| Convenience comparison group | |
| No control group | |
| Convenience control group | |
| No evaluation | |
| No evaluation | |
| No evaluation | |
| Age group too wide, repeated measures | |
| No relevant outcomes | |
| No control group | |
| No control group | |
| No control group | |
| Age group too wide | |
| Involves homeless families ‐ excluded at the stage of review update to be included in a separate review on homeless family interventions | |
| No evaluation | |
| Convenience control group | |
| Qualitative | |
| Cross‐sectional |
Characteristics of studies awaiting assessment [ordered by study ID]
| Methods | RCT |
| Participants | Street‐connected female adolescents 12 to 16 years of age |
| Interventions | Resilience training |
| Outcomes | Psychological well‐being |
| Notes | This Iranian study is published in Farsi. We were unable to obtain a translation of the study in time for the review update |
Characteristics of ongoing studies [ordered by study ID]
| Trial name or title | Strengths‐based method for homeless youth (Houvast) |
| Methods | Quasi‐experimental |
| Participants | Homeless youth in ambulatory/residential care |
| Interventions | Strengths‐based case management intervention developed through participatory method |
| Outcomes | Quality of life and various psychological and substance use outcomes |
| Starting date | Not specified |
| Contact information | Professor Judith Wolf, [email protected] |
| Notes |
| Trial name or title | Intervention to enhance psychological capital in homeless women |
| Methods | Quasi‐randomised controlled trial (RCT) |
| Participants | Homeless young women; 18 to 23 years of age (mean age 21.2); drop‐in centre; USA |
| Interventions | Psychological capital enhancement |
| Outcomes | Hope, resilience, future time perspective, safer sex behaviours, psychological capital, social connectedness, self efficacy/risky behaviours |
| Starting date | Not specified |
| Contact information | Professor Lynn Rew, [email protected] |
| Notes |
Data and analyses
| Outcome or subgroup title | No. of studies | No. of participants | Statistical method | Effect size |
| 1 Number of times had sex ‐ 3 months Show forest plot | 2 | 239 | Mean Difference (IV, Random, 95% CI) | ‐0.56 [‐1.13, 0.01] |
| Analysis 1.1 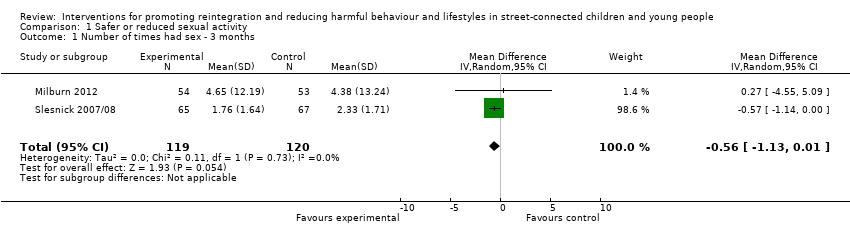 Comparison 1 Safer or reduced sexual activity, Outcome 1 Number of times had sex ‐ 3 months. | ||||
| 2 Number of times had sex ‐ 6 months Show forest plot | 2 | 242 | Mean Difference (IV, Random, 95% CI) | 0.73 [‐2.97, 4.43] |
| Analysis 1.2  Comparison 1 Safer or reduced sexual activity, Outcome 2 Number of times had sex ‐ 6 months. | ||||
| 3 Number of sexual partners ‐ 3 months Show forest plot | 2 | 239 | Mean Difference (IV, Random, 95% CI) | ‐0.04 [‐0.25, 0.17] |
| Analysis 1.3  Comparison 1 Safer or reduced sexual activity, Outcome 3 Number of sexual partners ‐ 3 months. | ||||
| 4 Number of sexual partners ‐ 6 months Show forest plot | 2 | 242 | Mean Difference (IV, Random, 95% CI) | ‐0.04 [‐0.22, 0.13] |
| Analysis 1.4  Comparison 1 Safer or reduced sexual activity, Outcome 4 Number of sexual partners ‐ 6 months. | ||||
| Outcome or subgroup title | No. of studies | No. of participants | Statistical method | Effect size |
| 1 Number of days used alcohol in last month ‐ 1 month Show forest plot | 2 | 235 | Mean Difference (IV, Random, 95% CI) | ‐0.33 [‐2.25, 1.59] |
| Analysis 2.1 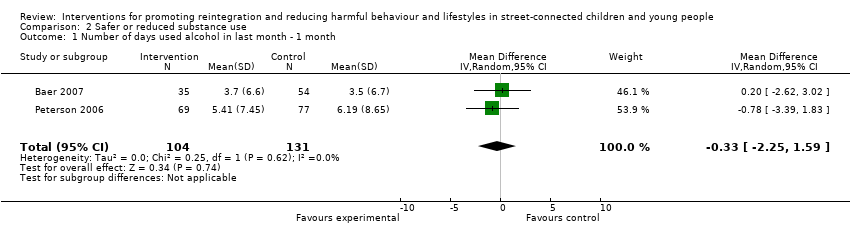 Comparison 2 Safer or reduced substance use, Outcome 1 Number of days used alcohol in last month ‐ 1 month. | ||||
| 2 Number of days used alcohol in last month ‐ 3 months Show forest plot | 2 | 235 | Mean Difference (IV, Random, 95% CI) | 1.10 [‐0.67, 2.88] |
| Analysis 2.2  Comparison 2 Safer or reduced substance use, Outcome 2 Number of days used alcohol in last month ‐ 3 months. | ||||
| 3 Percent days of alcohol use in last 90 days (Form 90) ‐ 3 months Show forest plot | 5 | 383 | Mean Difference (IV, Random, 95% CI) | 0.03 [‐1.86, 1.93] |
| Analysis 2.3 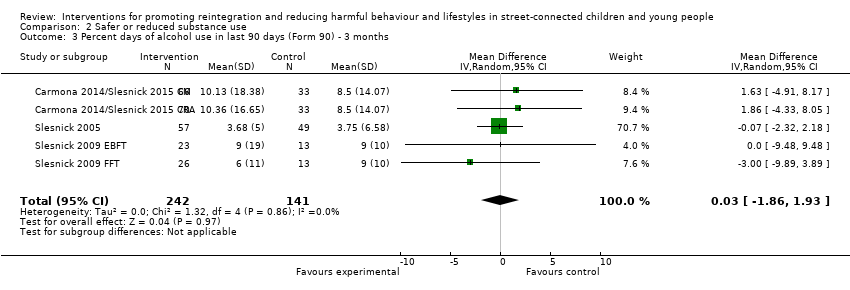 Comparison 2 Safer or reduced substance use, Outcome 3 Percent days of alcohol use in last 90 days (Form 90) ‐ 3 months. | ||||
| 4 Percent days of alcohol use in last 90 days (Form 90) ‐ 6 months Show forest plot | 3 | 295 | Mean Difference (IV, Random, 95% CI) | 1.05 [‐1.76, 3.86] |
| Analysis 2.4  Comparison 2 Safer or reduced substance use, Outcome 4 Percent days of alcohol use in last 90 days (Form 90) ‐ 6 months. | ||||
| 5 Percent days of alcohol use in last 90 days (Form 90) ‐ 12 months Show forest plot | 3 | 304 | Mean Difference (IV, Random, 95% CI) | 0.63 [‐2.23, 3.48] |
| Analysis 2.5  Comparison 2 Safer or reduced substance use, Outcome 5 Percent days of alcohol use in last 90 days (Form 90) ‐ 12 months. | ||||
| 6 Number of standard drinks (Form 90) ‐ 3 months Show forest plot | 2 | 75 | Mean Difference (IV, Random, 95% CI) | ‐2.87 [‐5.68, ‐0.07] |
| Analysis 2.6  Comparison 2 Safer or reduced substance use, Outcome 6 Number of standard drinks (Form 90) ‐ 3 months. | ||||
| 7 Adolescent Drinking Index ‐ 3 months Show forest plot | 2 | 75 | Mean Difference (IV, Random, 95% CI) | 1.08 [‐4.42, 6.57] |
| Analysis 2.7 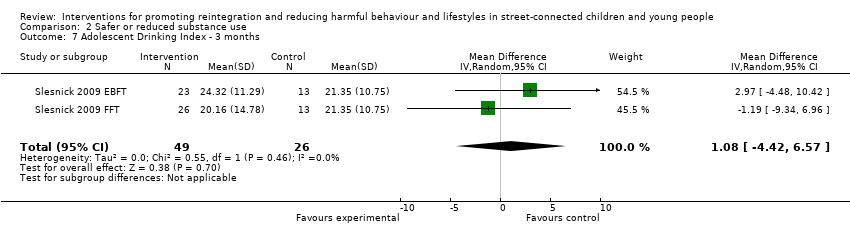 Comparison 2 Safer or reduced substance use, Outcome 7 Adolescent Drinking Index ‐ 3 months. | ||||
| 8 Percent days of alcohol/drug use (excl tobacco) (Form 90) ‐ 3 months Show forest plot | 4 | 214 | Mean Difference (IV, Random, 95% CI) | ‐0.70 [‐9.09, 7.70] |
| Analysis 2.8  Comparison 2 Safer or reduced substance use, Outcome 8 Percent days of alcohol/drug use (excl tobacco) (Form 90) ‐ 3 months. | ||||
| 9 Percent days of alcohol/drug use (excl tobacco) (Form 90) ‐ 6 months Show forest plot | 3 | 278 | Mean Difference (IV, Random, 95% CI) | ‐2.15 [‐9.82, 5.53] |
| Analysis 2.9 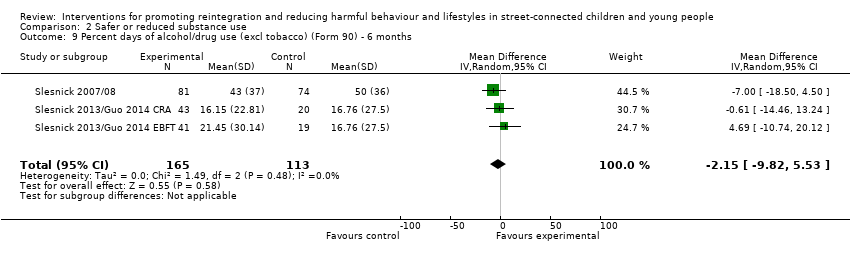 Comparison 2 Safer or reduced substance use, Outcome 9 Percent days of alcohol/drug use (excl tobacco) (Form 90) ‐ 6 months. | ||||
| 10 Percent days of alcohol/drug use (excl tobacco) (Form 90) ‐ 12 months Show forest plot | 2 | 127 | Mean Difference (IV, Random, 95% CI) | 5.87 [‐5.06, 16.79] |
| Analysis 2.10  Comparison 2 Safer or reduced substance use, Outcome 10 Percent days of alcohol/drug use (excl tobacco) (Form 90) ‐ 12 months. | ||||
| 11 Percent days only/any drug use (Form 90) ‐ 3 months Show forest plot | 5 | 384 | Mean Difference (IV, Random, 95% CI) | 0.67 [‐6.82, 8.15] |
| Analysis 2.11 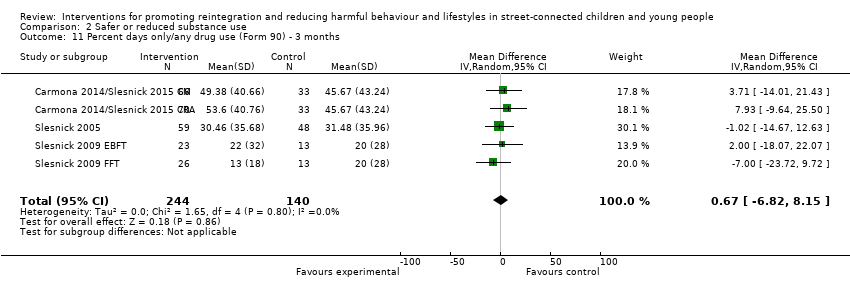 Comparison 2 Safer or reduced substance use, Outcome 11 Percent days only/any drug use (Form 90) ‐ 3 months. | ||||
| 12 Percent days only/any drug use (Form 90) ‐ 6 months Show forest plot | 3 | 295 | Mean Difference (IV, Random, 95% CI) | ‐2.28 [‐11.53, 6.96] |
| Analysis 2.12 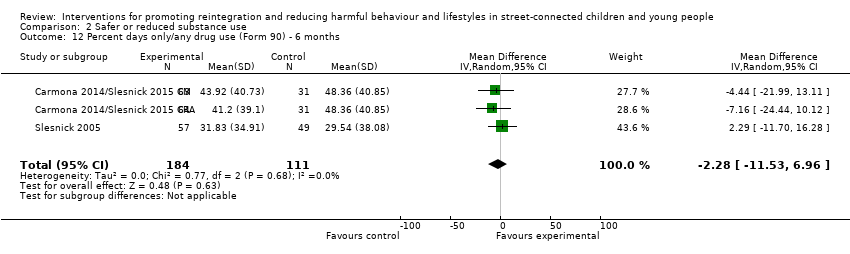 Comparison 2 Safer or reduced substance use, Outcome 12 Percent days only/any drug use (Form 90) ‐ 6 months. | ||||
| 13 Percent days only/any drug use (Form 90) ‐ 12 months Show forest plot | 3 | 304 | Mean Difference (IV, Random, 95% CI) | ‐5.28 [‐13.79, 3.23] |
| Analysis 2.13  Comparison 2 Safer or reduced substance use, Outcome 13 Percent days only/any drug use (Form 90) ‐ 12 months. | ||||
| 14 Number of days used marijuana in last month ‐ 1 month Show forest plot | 2 | 235 | Mean Difference (IV, Random, 95% CI) | ‐0.52 [‐3.65, 2.62] |
| Analysis 2.14  Comparison 2 Safer or reduced substance use, Outcome 14 Number of days used marijuana in last month ‐ 1 month. | ||||
| 15 Number of days used marijuana in last month ‐ 3 months Show forest plot | 2 | 235 | Mean Difference (IV, Random, 95% CI) | 0.37 [‐2.73, 3.47] |
| Analysis 2.15  Comparison 2 Safer or reduced substance use, Outcome 15 Number of days used marijuana in last month ‐ 3 months. | ||||
| 16 Number of days used other drugs in last month ‐ 1 month Show forest plot | 2 | 204 | Mean Difference (IV, Random, 95% CI) | 1.21 [‐0.68, 3.10] |
| Analysis 2.16 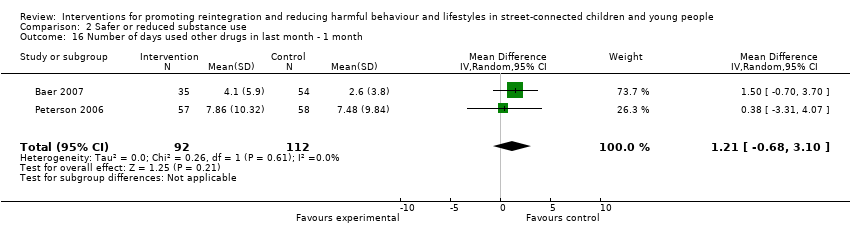 Comparison 2 Safer or reduced substance use, Outcome 16 Number of days used other drugs in last month ‐ 1 month. | ||||
| 17 Number of days used other drugs in last month ‐ 3 months Show forest plot | 2 | 204 | Mean Difference (IV, Random, 95% CI) | 0.22 [‐1.84, 2.28] |
| Analysis 2.17 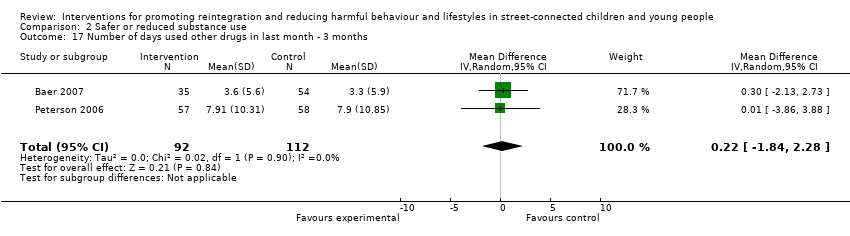 Comparison 2 Safer or reduced substance use, Outcome 17 Number of days used other drugs in last month ‐ 3 months. | ||||
| 18 Number of problem consequences ‐ 3 months Show forest plot | 3 | 182 | Mean Difference (IV, Random, 95% CI) | 1.51 [0.56, 2.47] |
| Analysis 2.18 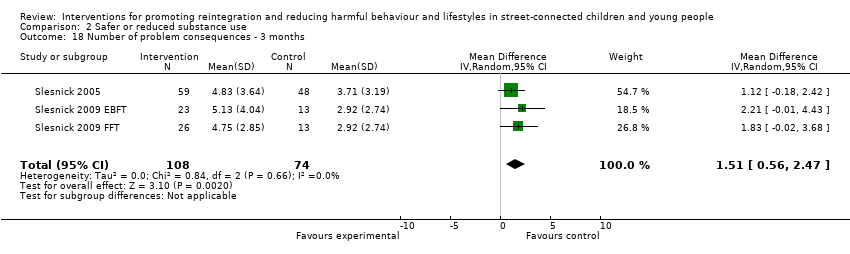 Comparison 2 Safer or reduced substance use, Outcome 18 Number of problem consequences ‐ 3 months. | ||||
| 19 Number of problem consequences ‐ 6 months Show forest plot | 2 | 261 | Mean Difference (IV, Random, 95% CI) | 0.34 [‐0.67, 1.34] |
| Analysis 2.19  Comparison 2 Safer or reduced substance use, Outcome 19 Number of problem consequences ‐ 6 months. | ||||
| 20 Number of substance use diagnoses (CDISC) ‐ 3 months Show forest plot | 2 | 75 | Mean Difference (IV, Random, 95% CI) | ‐0.70 [‐1.27, ‐0.14] |
| Analysis 2.20  Comparison 2 Safer or reduced substance use, Outcome 20 Number of substance use diagnoses (CDISC) ‐ 3 months. | ||||
| 21 Number of categories of drug use (Form 90) ‐ 6 months Show forest plot | 2 | 261 | Mean Difference (IV, Random, 95% CI) | 0.14 [‐0.33, 0.61] |
| Analysis 2.21  Comparison 2 Safer or reduced substance use, Outcome 21 Number of categories of drug use (Form 90) ‐ 6 months. | ||||
| Outcome or subgroup title | No. of studies | No. of participants | Statistical method | Effect size |
| 1 Self esteem at endpoint Show forest plot | 2 | 142 | Std. Mean Difference (IV, Random, 95% CI) | 0.11 [‐0.22, 0.44] |
| Analysis 3.1  Comparison 3 Self esteem, Outcome 1 Self esteem at endpoint. | ||||
| Outcome or subgroup title | No. of studies | No. of participants | Statistical method | Effect size |
| 1 Depression at 3 months Show forest plot | 9 | 661 | Std. Mean Difference (IV, Random, 95% CI) | ‐0.03 [‐0.22, 0.17] |
| Analysis 4.1  Comparison 4 Depression, Outcome 1 Depression at 3 months. | ||||
| 2 Depression at 6 months Show forest plot | 6 | 586 | Mean Difference (IV, Random, 95% CI) | 0.83 [‐0.88, 2.55] |
| Analysis 4.2  Comparison 4 Depression, Outcome 2 Depression at 6 months. | ||||
| 3 Depression at 12 months Show forest plot | 5 | 441 | Mean Difference (IV, Random, 95% CI) | 1.28 [‐0.36, 2.92] |
| Analysis 4.3  Comparison 4 Depression, Outcome 3 Depression at 12 months. | ||||
| Outcome or subgroup title | No. of studies | No. of participants | Statistical method | Effect size |
| 1 Verbal aggression (Conflict Tactic Scale) ‐ 3 months Show forest plot | 3 | 208 | Mean Difference (IV, Random, 95% CI) | ‐0.00 [‐0.07, 0.06] |
| Analysis 5.1  Comparison 5 Reduced use of violence, Outcome 1 Verbal aggression (Conflict Tactic Scale) ‐ 3 months. | ||||
| 2 Family violence (Conflict Tactic Scale) ‐ 3 months Show forest plot | 3 | 208 | Mean Difference (IV, Random, 95% CI) | ‐0.00 [‐0.02, 0.02] |
| Analysis 5.2 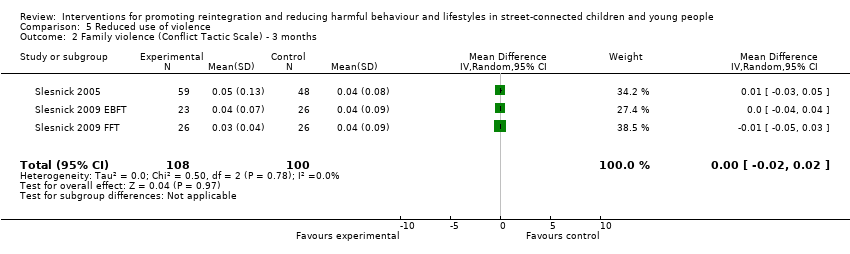 Comparison 5 Reduced use of violence, Outcome 2 Family violence (Conflict Tactic Scale) ‐ 3 months. | ||||
| Outcome or subgroup title | No. of studies | No. of participants | Statistical method | Effect size |
| 1 Percent of days living at home (Form 90) ‐ 3 months Show forest plot | 2 | 75 | Mean Difference (IV, Random, 95% CI) | ‐9.46 [‐27.96, 9.03] |
| Analysis 6.1 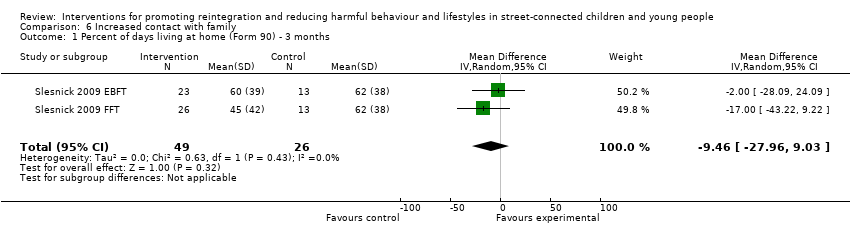 Comparison 6 Increased contact with family, Outcome 1 Percent of days living at home (Form 90) ‐ 3 months. | ||||
| Outcome or subgroup title | No. of studies | No. of participants | Statistical method | Effect size |
| 1 Delinquent behaviours at 3 months Show forest plot | 5 | 404 | Std. Mean Difference (IV, Random, 95% CI) | ‐0.29 [‐0.54, ‐0.03] |
| Analysis 7.1  Comparison 7 Social functioning, Outcome 1 Delinquent behaviours at 3 months. | ||||
| 2 Delinquent behaviours at 6 months Show forest plot | 3 | 348 | Std. Mean Difference (IV, Random, 95% CI) | ‐0.07 [‐0.52, 0.37] |
| Analysis 7.2 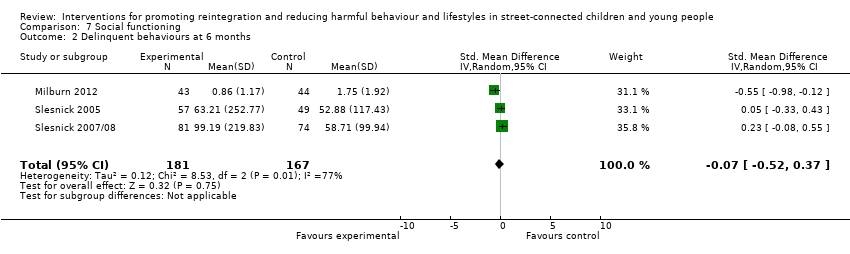 Comparison 7 Social functioning, Outcome 2 Delinquent behaviours at 6 months. | ||||
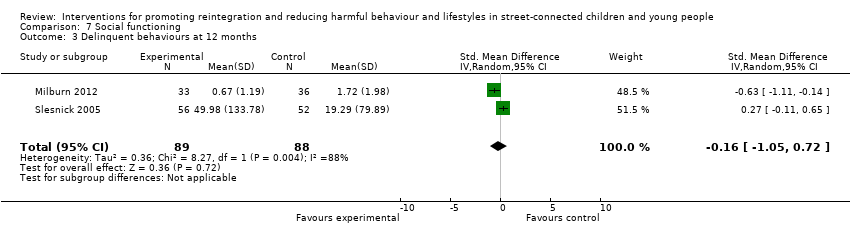
| 3 Delinquent behaviours at 12 months Show forest plot | 2 | 177 | Std. Mean Difference (IV, Random, 95% CI) | ‐0.16 [‐1.05, 0.72] |
| Analysis 7.3  Comparison 7 Social functioning, Outcome 3 Delinquent behaviours at 12 months. | ||||
| Outcome or subgroup title | No. of studies | No. of participants | Statistical method | Effect size |
| 1 Internalising behaviours at 3 months Show forest plot | 8 | 634 | Mean Difference (IV, Random, 95% CI) | 0.73 [‐0.87, 2.34] |
| Analysis 8.1  Comparison 8 Psychological functioning, Outcome 1 Internalising behaviours at 3 months. | ||||
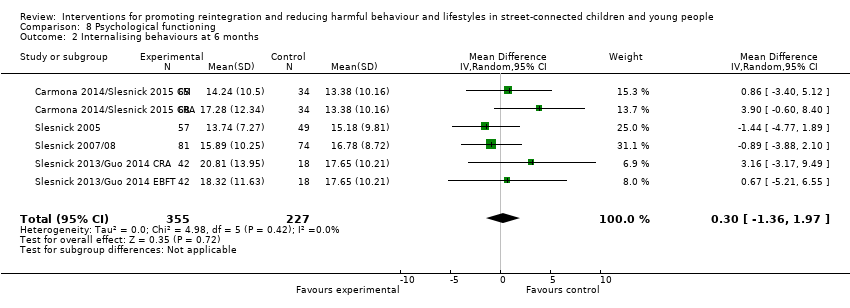
| 2 Internalising behaviours at 6 months Show forest plot | 6 | 582 | Mean Difference (IV, Random, 95% CI) | 0.30 [‐1.36, 1.97] |
| Analysis 8.2  Comparison 8 Psychological functioning, Outcome 2 Internalising behaviours at 6 months. | ||||
| 3 Internalising behaviours at 12 months Show forest plot | 5 | 433 | Mean Difference (IV, Random, 95% CI) | 0.31 [‐1.58, 2.20] |
| Analysis 8.3 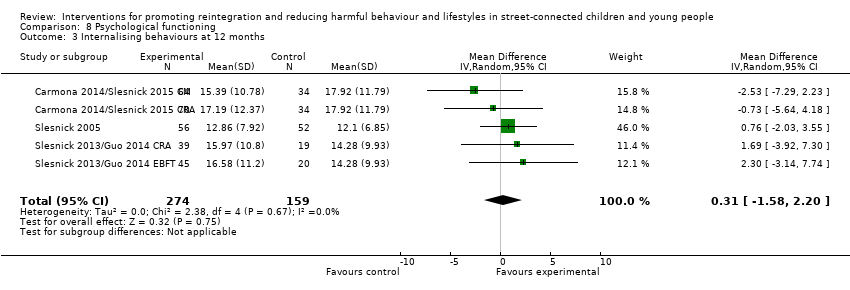 Comparison 8 Psychological functioning, Outcome 3 Internalising behaviours at 12 months. | ||||
| 4 Externalising behaviours at 3 months Show forest plot | 8 | 636 | Std. Mean Difference (IV, Random, 95% CI) | 0.09 [‐0.10, 0.28] |
| Analysis 8.4 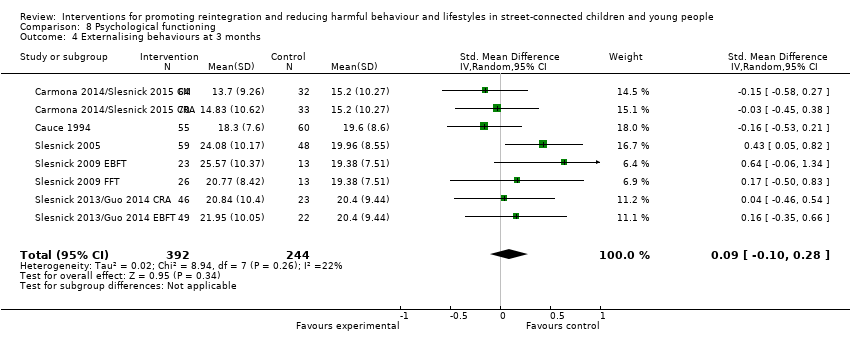 Comparison 8 Psychological functioning, Outcome 4 Externalising behaviours at 3 months. | ||||
| 5 Externalising behaviours at 6 months Show forest plot | 6 | 583 | Mean Difference (IV, Random, 95% CI) | 0.83 [‐0.74, 2.41] |
| Analysis 8.5  Comparison 8 Psychological functioning, Outcome 5 Externalising behaviours at 6 months. | ||||
| 6 Externalising behaviours at 12 months Show forest plot | 5 | 434 | Mean Difference (IV, Random, 95% CI) | 0.04 [‐2.89, 2.97] |
| Analysis 8.6 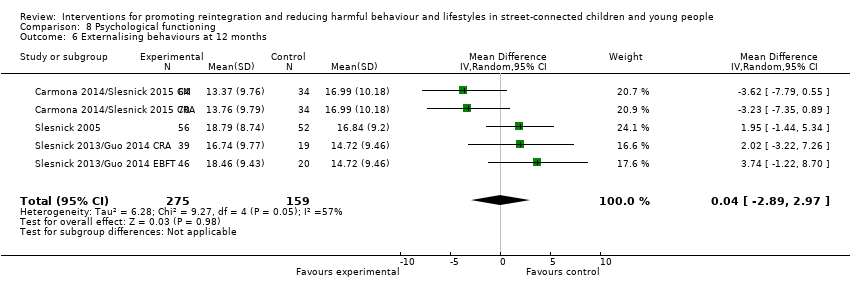 Comparison 8 Psychological functioning, Outcome 6 Externalising behaviours at 12 months. | ||||
| 7 Number of psychiatric diagnoses Show forest plot | 3 | 182 | Mean Difference (IV, Random, 95% CI) | ‐0.06 [‐0.50, 0.37] |
| Analysis 8.7 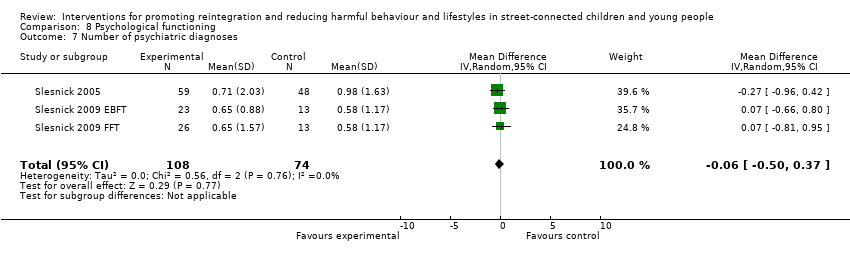 Comparison 8 Psychological functioning, Outcome 7 Number of psychiatric diagnoses. | ||||
| Outcome or subgroup title | No. of studies | No. of participants | Statistical method | Effect size |
| 1 Family cohesion (Family Environment Scale) ‐ 3 months Show forest plot | 3 | 208 | Mean Difference (IV, Random, 95% CI) | 0.88 [0.23, 1.54] |
| Analysis 9.1 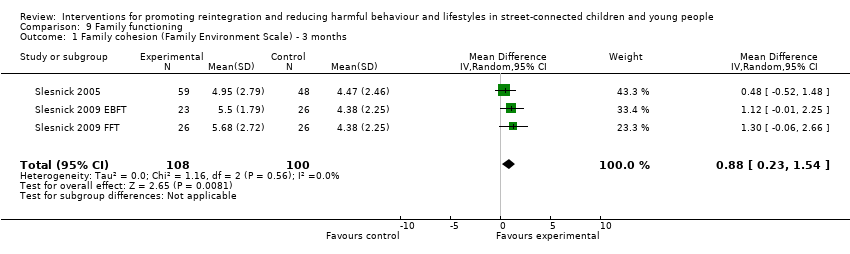 Comparison 9 Family functioning, Outcome 1 Family cohesion (Family Environment Scale) ‐ 3 months. | ||||
| 2 Family conflict (Family Environment Scale) ‐ 3 months Show forest plot | 3 | 208 | Mean Difference (IV, Random, 95% CI) | ‐0.05 [‐0.91, 0.81] |
| Analysis 9.2  Comparison 9 Family functioning, Outcome 2 Family conflict (Family Environment Scale) ‐ 3 months. | ||||
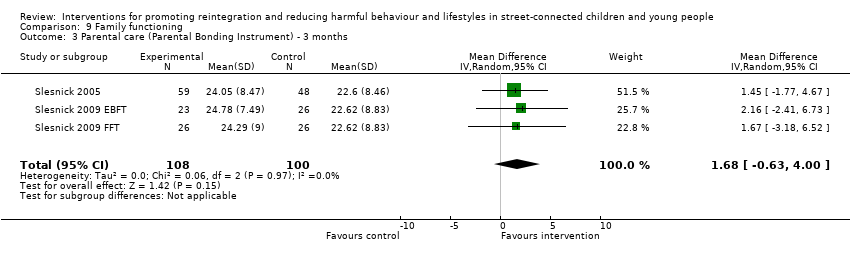
| 3 Parental care (Parental Bonding Instrument) ‐ 3 months Show forest plot | 3 | 208 | Mean Difference (IV, Random, 95% CI) | 1.68 [‐0.63, 4.00] |
| Analysis 9.3  Comparison 9 Family functioning, Outcome 3 Parental care (Parental Bonding Instrument) ‐ 3 months. | ||||
| 4 Parental overprotection (Parental Bonding Instrument) ‐ 3 months Show forest plot | 3 | 208 | Mean Difference (IV, Random, 95% CI) | ‐0.82 [‐4.75, 3.10] |
| Analysis 9.4 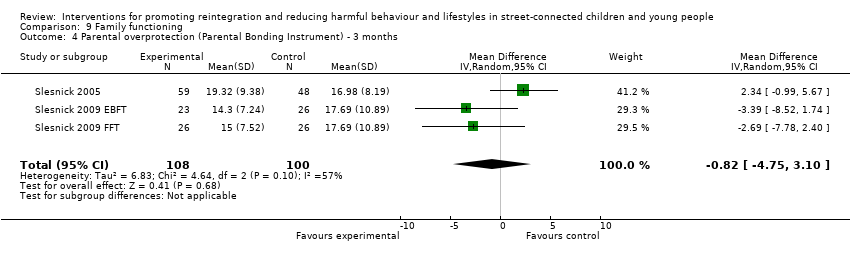 Comparison 9 Family functioning, Outcome 4 Parental overprotection (Parental Bonding Instrument) ‐ 3 months. | ||||

Intervention and context logic model.
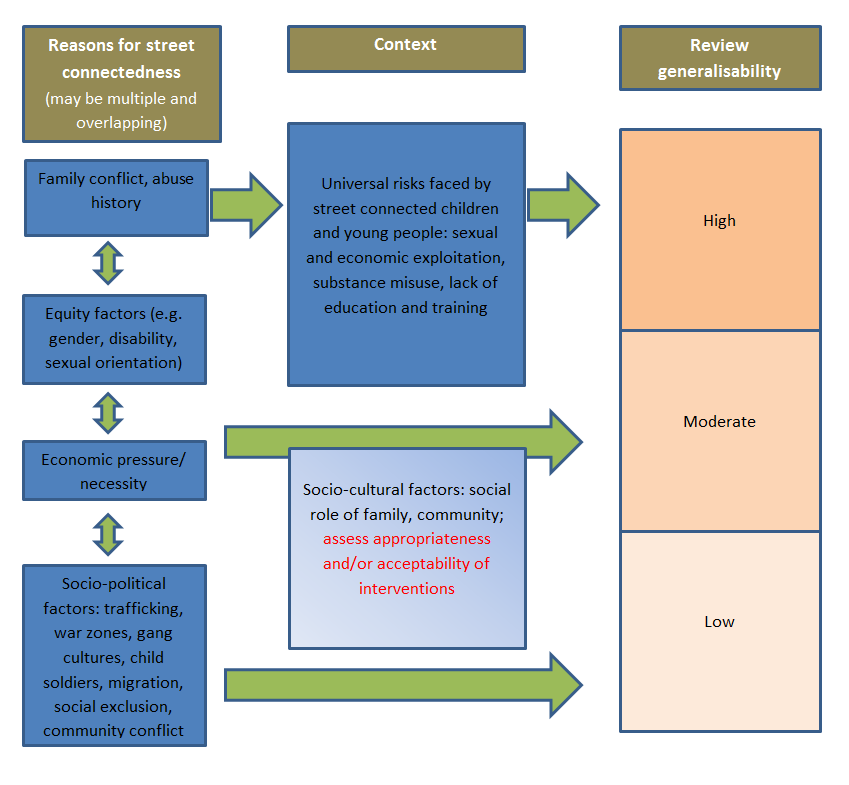
Generalisability logic model.

Study flow diagram.
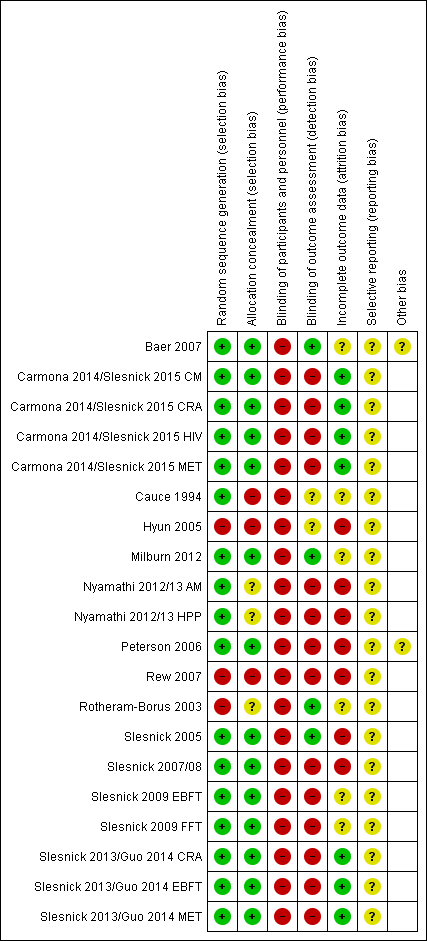
Risk of bias summary: review authors' judgements about each risk of bias item for each included study.

Risk of bias graph: review authors' judgements about each risk of bias item presented as percentages across all included studies.

Comparison 1 Safer or reduced sexual activity, Outcome 1 Number of times had sex ‐ 3 months.

Comparison 1 Safer or reduced sexual activity, Outcome 2 Number of times had sex ‐ 6 months.
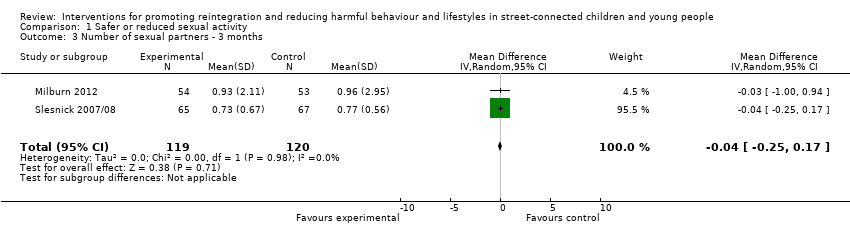
Comparison 1 Safer or reduced sexual activity, Outcome 3 Number of sexual partners ‐ 3 months.

Comparison 1 Safer or reduced sexual activity, Outcome 4 Number of sexual partners ‐ 6 months.

Comparison 2 Safer or reduced substance use, Outcome 1 Number of days used alcohol in last month ‐ 1 month.
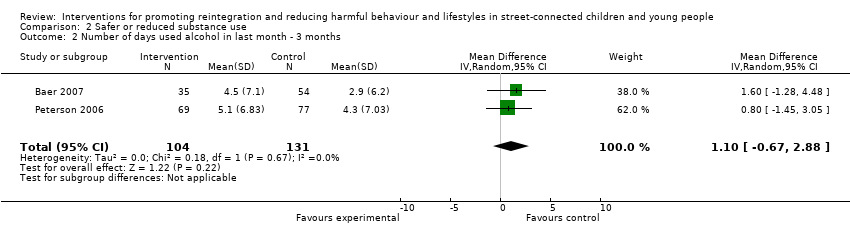
Comparison 2 Safer or reduced substance use, Outcome 2 Number of days used alcohol in last month ‐ 3 months.

Comparison 2 Safer or reduced substance use, Outcome 3 Percent days of alcohol use in last 90 days (Form 90) ‐ 3 months.

Comparison 2 Safer or reduced substance use, Outcome 4 Percent days of alcohol use in last 90 days (Form 90) ‐ 6 months.
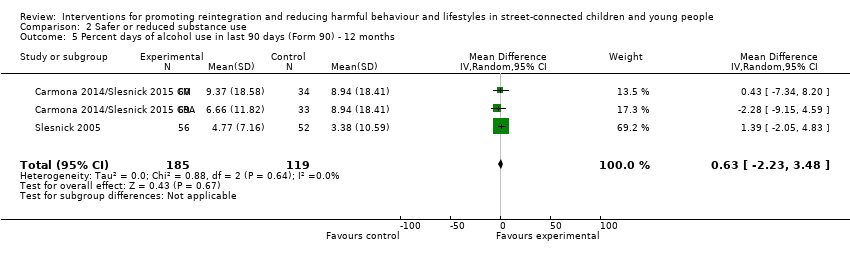
Comparison 2 Safer or reduced substance use, Outcome 5 Percent days of alcohol use in last 90 days (Form 90) ‐ 12 months.
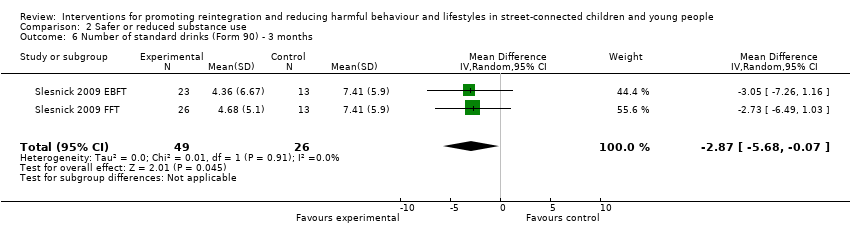
Comparison 2 Safer or reduced substance use, Outcome 6 Number of standard drinks (Form 90) ‐ 3 months.

Comparison 2 Safer or reduced substance use, Outcome 7 Adolescent Drinking Index ‐ 3 months.

Comparison 2 Safer or reduced substance use, Outcome 8 Percent days of alcohol/drug use (excl tobacco) (Form 90) ‐ 3 months.

Comparison 2 Safer or reduced substance use, Outcome 9 Percent days of alcohol/drug use (excl tobacco) (Form 90) ‐ 6 months.
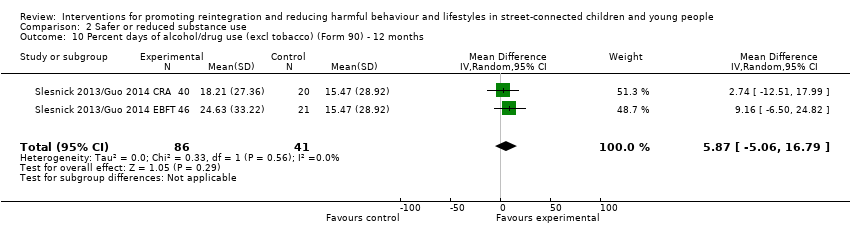
Comparison 2 Safer or reduced substance use, Outcome 10 Percent days of alcohol/drug use (excl tobacco) (Form 90) ‐ 12 months.

Comparison 2 Safer or reduced substance use, Outcome 11 Percent days only/any drug use (Form 90) ‐ 3 months.

Comparison 2 Safer or reduced substance use, Outcome 12 Percent days only/any drug use (Form 90) ‐ 6 months.
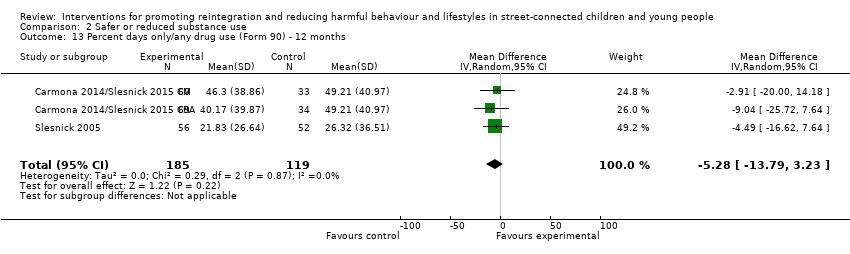
Comparison 2 Safer or reduced substance use, Outcome 13 Percent days only/any drug use (Form 90) ‐ 12 months.
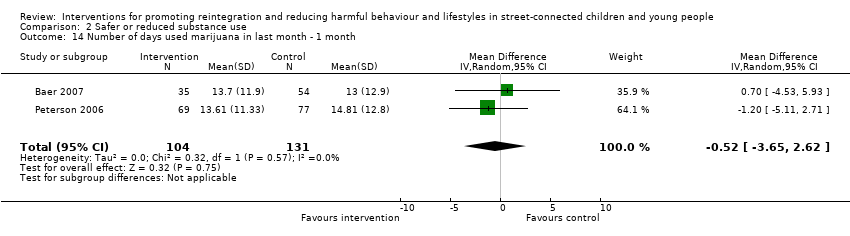
Comparison 2 Safer or reduced substance use, Outcome 14 Number of days used marijuana in last month ‐ 1 month.
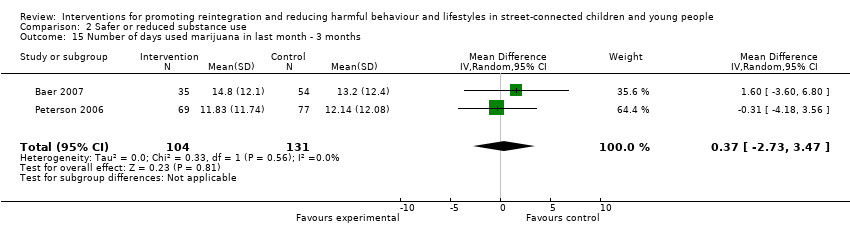
Comparison 2 Safer or reduced substance use, Outcome 15 Number of days used marijuana in last month ‐ 3 months.

Comparison 2 Safer or reduced substance use, Outcome 16 Number of days used other drugs in last month ‐ 1 month.

Comparison 2 Safer or reduced substance use, Outcome 17 Number of days used other drugs in last month ‐ 3 months.

Comparison 2 Safer or reduced substance use, Outcome 18 Number of problem consequences ‐ 3 months.

Comparison 2 Safer or reduced substance use, Outcome 19 Number of problem consequences ‐ 6 months.

Comparison 2 Safer or reduced substance use, Outcome 20 Number of substance use diagnoses (CDISC) ‐ 3 months.

Comparison 2 Safer or reduced substance use, Outcome 21 Number of categories of drug use (Form 90) ‐ 6 months.

Comparison 3 Self esteem, Outcome 1 Self esteem at endpoint.

Comparison 4 Depression, Outcome 1 Depression at 3 months.

Comparison 4 Depression, Outcome 2 Depression at 6 months.

Comparison 4 Depression, Outcome 3 Depression at 12 months.

Comparison 5 Reduced use of violence, Outcome 1 Verbal aggression (Conflict Tactic Scale) ‐ 3 months.

Comparison 5 Reduced use of violence, Outcome 2 Family violence (Conflict Tactic Scale) ‐ 3 months.

Comparison 6 Increased contact with family, Outcome 1 Percent of days living at home (Form 90) ‐ 3 months.

Comparison 7 Social functioning, Outcome 1 Delinquent behaviours at 3 months.

Comparison 7 Social functioning, Outcome 2 Delinquent behaviours at 6 months.
Comparison 7 Social functioning, Outcome 3 Delinquent behaviours at 12 months.

Comparison 8 Psychological functioning, Outcome 1 Internalising behaviours at 3 months.
Comparison 8 Psychological functioning, Outcome 2 Internalising behaviours at 6 months.

Comparison 8 Psychological functioning, Outcome 3 Internalising behaviours at 12 months.

Comparison 8 Psychological functioning, Outcome 4 Externalising behaviours at 3 months.

Comparison 8 Psychological functioning, Outcome 5 Externalising behaviours at 6 months.

Comparison 8 Psychological functioning, Outcome 6 Externalising behaviours at 12 months.

Comparison 8 Psychological functioning, Outcome 7 Number of psychiatric diagnoses.

Comparison 9 Family functioning, Outcome 1 Family cohesion (Family Environment Scale) ‐ 3 months.

Comparison 9 Family functioning, Outcome 2 Family conflict (Family Environment Scale) ‐ 3 months.
Comparison 9 Family functioning, Outcome 3 Parental care (Parental Bonding Instrument) ‐ 3 months.

Comparison 9 Family functioning, Outcome 4 Parental overprotection (Parental Bonding Instrument) ‐ 3 months.
| Therapeutic intervention compared with service as usual for street‐connected children and young people | |||
| Patient or population: street‐connected children and young people Settings: shelters and drop‐in centres Intervention: various specific therapeutic types of interventions Comparison: shelter/drop‐in service as usual | |||
| Outcome categories (summarised) | Impact | Number of | Quality of the evidence |
| Primary outcome ‐ reintegration
| Reintegration was not measured in any of the studies. Similarly, access to literacy, numeracy, education and employment were not measured in any of the studies that met the criteria for inclusion. However, social stability was measured in 1 study and delinquent behaviours in 4 studies. Social stability outcomes measured in 1 study showed benefit for the intervention group. Delinquent behaviour results were mixed across studies; investigators used different types and constructs of measurement, so findings cannot be summarised | 1 4 | Moderatea |
| Promotion of mental health, including self esteem | Outcomes included in this category included depression, internalising and externalising behaviours, self esteem and psychiatric diagnoses measured on various scales. None of these measures showed overall differences between intervention and control groups, and change score calculations demonstrated that for the most part, both groups improved from baseline. These results indicate that for mental health promotion outcomes, the therapeutic intervention did not obtain significantly better outcomes than the service as usual/control condition in the studies included in this review | 8 | Moderatea |
| Reduction in harms associated with substance misuse | Substance misuse was measured in a wide variety of ways and includes alcohol misuse and different categories of non‐prescription drugs, as well as a scale measuring 'problem consequences'. The overall picture emerging form the included studies on these outcomes is unclear, possibly because of the array of measurement types and tools that measure subtly different constructs and differing time windows that were impossible to combine statistically. Results are mixed across studies, with some showing marginal or no differences between groups, and others showing clear benefit for intervention or control. Improvements in some substance misuse measures were noted in all 3 family intervention studies | 8 | Moderatea |
| Reduction in harms associated with early sexual activity | Sexually risky behaviour was similarly measured in different ways, including numbers of partners, numbers of times had sex, HIV knowledge, unprotected sex, condom use and rates of abstinence. Again, the picture across studies is mixed. Some studies showed benefit in 1 or another group, but it is difficult to untangle whether this shows benefit of a particular intervention or control condition, or whether this reflects differences in measurement approach | 5 | Lowb |
| Family functioning | These outcomes were measured by two studies that utilised family‐based approaches to providing intervention. No differences were found between intervention and control conditions on most of the outcome measures used. These included various aspects of family life such as parenting style, aggression and violence, family conflict and percent days living at home | 2 | Lowc |
| Overall picture | Participants in studies remained for the most part at a similar level or improved on outcomes measured. Assessment of the grade of evidence is moderate overall, as whilst some domains of bias (e.g. allocation concealment) were assessed mostly as having low risk of bias, other domains such as blinding, were assessed consistently as high risk, whilst selective reporting was consistently assessed as unclear. No clear examples showed deteriorated outcomes. Findings may be more generalisable to young people in low‐ and middle‐income countries with circumstances more similar to those included in the studies (i.e. those who have left home because of abuse or family conflict | Total studies included = 13 | Moderatea |
| GRADE Working Group grades of evidence | |||
| Summarised outcome categories used in Summary of findings (SoF) table in the interest of space aOverall, the quality of the evidence was assessed as 'moderate' in the context of typical study quality in comparable areas (psychosocial interventions with at‐risk populations), and standard quality criteria were used in Cochrane reviews (in particular, the GRADE evaluation framework as utilised here). Quality of evidence for all available outcome categories was upgraded because they were based on robust study designs (RCTs); reasonably low drop‐out rates (for the study population involved); some analysis of major confounders including age and gender, and publication of data for a broad range of outcomes, including non‐significant outcomes, measured over reasonably long follow‐up periods, in most included studies. Quality of evidence was downgraded for the following reasons: heterogeneity of study outcomes, measures and types of statistical analysis used; inconsistency in measures, findings and analyses across outcomes and across studies with similar interventions; reliance on self report; use of convenience samples; over‐representation of studies from one study team; and questions over study generalisability. Further, few studies involved a control condition receiving no services, and some did not involve a service as usual condition, reducing comparability across studies. Finally, the relationship between intervention theories and outcomes measured remained unclear, and clinical and subjective significance of outcomes was explored in a small number of included studies. No participatory or process evaluations were available bAs above, but the quality of the evidence was further downgraded because of the relatively small number of heterogeneous studies cAs above, but the quality of the evidence was further downgraded because of the small number of studies available. The two included studies were conducted by the same study team. | |||
| Number* | Outcome name | Study | Measure | ≤1 month | 3 months | 6 months | 12 months |
| Number of times participant had sex in last 90 days | HRQ | x | x | ||||
| Own | x | x | |||||
| Number of sexual partners | HRQ | x | x | ||||
| Own | x | x | |||||
| Alcohol use (number of days in last 30 days) | TLFB | x | x | ||||
| TLFB | x | x | |||||
| Alcohol use (% days in last 90 days) | Form 90 | x | x | x | |||
| Form 90 | x | ||||||
| Form 90 | x | ||||||
| Form 90 | x | x | x | ||||
| Form 90 | x | x | x | ||||
| Form 90 | x | x | x | ||||
| Number of standard drinks (in last 90 days) | Form 90 | x | |||||
| Form 90 | x | ||||||
| Alcohol use (total score) | ADI | x | |||||
| ADI | x | ||||||
| Alcohol/drug use (% days in last 90 days) | Form 90 | x | |||||
| Form 90 | x | ||||||
| Form 90 | x | ||||||
| Form 90 | x | x | x | ||||
| Form 90 | x | x | x | ||||
| Form 90 | x | x | x | ||||
| Only/any drug use (% days in last 90 days) | Form 90 | x | x | x | |||
| Form 90 | x | ||||||
| Form 90 | x | ||||||
| Form 90 | x | x | x | ||||
| Form 90 | x | x | x | ||||
| Form 90 | x | x | x | ||||
| Marijuana use (number of days in last 30 days) | TLFB | x | x | ||||
| TLFB | x | x | |||||
| Drug use other than marijuana (number of days in last 30 days) | TLFB | x | x | ||||
| TLFB | x | x | |||||
| Number of problem consequences | POSIT | x | x | ||||
| POSIT | x | ||||||
| POSIT | x | ||||||
| POSIT | x | ||||||
| Number of substance use diagnoses | CDISC | x | |||||
| CDISC | x | ||||||
| Number of categories of drug use (last 90 days) | Form 90 | x | |||||
| Form 90 | x | ||||||
| Self esteem | RSES | x | |||||
| SEI | x | ||||||
| Depression | RADS | x | |||||
| BDI | x | ||||||
| BDI | x | x | x | ||||
| BDI | x | ||||||
| BDI | x | ||||||
| BDI | x | ||||||
| BDI | x | x | x | ||||
| BDI | x | x | x | ||||
| BDI | x | x | x | ||||
| BDI | x | x | x | ||||
| BDI | x | x | x | ||||
| BDI | x | x | x | ||||
| Verbal aggression (youth) | CTS | x | |||||
| CTS | x | ||||||
| CTS | x | ||||||
| Family violence (youth) | CTS | x | |||||
| CTS | x | ||||||
| CTS | x | ||||||
| Days living at home (% days in last 90 days) | Form 90 | x | |||||
| Form 90 | x | ||||||
| Delinquent behaviours | YSR | x | |||||
| DSM‐IV | x | x | x | ||||
| NYSDS | x | x | x | ||||
| NYSDS | x | ||||||
| NYSDS | x | ||||||
| NYSDS | x | ||||||
| Internalising problems | YSR | x | |||||
| YSR | x | x | x | ||||
| YSR | x | ||||||
| YSR | x | ||||||
| YSR | x | ||||||
| YSR | x | x | x | ||||
| YSR | x | x | x | ||||
| YSR | x | x | x | ||||
| YSR | x | x | x | ||||
| YSR | x | x | x | ||||
| YSR | x | x | x | ||||
| Externalising problems | YSR | x | |||||
| YSR | x | x | x | ||||
| YSR | x | ||||||
| YSR | x | ||||||
| YSR | x | ||||||
| YSR | x | x | x | ||||
| YSR | x | x | x | ||||
| YSR | x | x | x | ||||
| YSR | x | x | x | ||||
| YSR | x | x | x | ||||
| YSR | x | x | x | ||||
| Number of psychiatric diagnoses | CDISC | x | |||||
| CDISC | x | ||||||
| CDISC | x | ||||||
| Family cohesion | FES | x | |||||
| FES | x | ||||||
| FES | x | ||||||
| Family conflict | FES | x | |||||
| FES | x | ||||||
| FES | x | ||||||
| Parental care | PBI | x | |||||
| PBI | x | ||||||
| PBI | x | ||||||
| Parental overprotectiveness | PBI | x | |||||
| PBI | x | ||||||
| PBI | x | ||||||
| Number | Outcome name | Study | Measure | ≤1 month | 3 months | 6 months | 12 months |
| Gaps occur when absence of relevant data was noted in relation to particular outcomes defined in the protocol | |||||||
| Outcome or subgroup title | No. of studies | No. of participants | Statistical method | Effect size |
| 1 Number of times had sex ‐ 3 months Show forest plot | 2 | 239 | Mean Difference (IV, Random, 95% CI) | ‐0.56 [‐1.13, 0.01] |
| 2 Number of times had sex ‐ 6 months Show forest plot | 2 | 242 | Mean Difference (IV, Random, 95% CI) | 0.73 [‐2.97, 4.43] |
| 3 Number of sexual partners ‐ 3 months Show forest plot | 2 | 239 | Mean Difference (IV, Random, 95% CI) | ‐0.04 [‐0.25, 0.17] |
| 4 Number of sexual partners ‐ 6 months Show forest plot | 2 | 242 | Mean Difference (IV, Random, 95% CI) | ‐0.04 [‐0.22, 0.13] |
| Outcome or subgroup title | No. of studies | No. of participants | Statistical method | Effect size |
| 1 Number of days used alcohol in last month ‐ 1 month Show forest plot | 2 | 235 | Mean Difference (IV, Random, 95% CI) | ‐0.33 [‐2.25, 1.59] |
| 2 Number of days used alcohol in last month ‐ 3 months Show forest plot | 2 | 235 | Mean Difference (IV, Random, 95% CI) | 1.10 [‐0.67, 2.88] |
| 3 Percent days of alcohol use in last 90 days (Form 90) ‐ 3 months Show forest plot | 5 | 383 | Mean Difference (IV, Random, 95% CI) | 0.03 [‐1.86, 1.93] |
| 4 Percent days of alcohol use in last 90 days (Form 90) ‐ 6 months Show forest plot | 3 | 295 | Mean Difference (IV, Random, 95% CI) | 1.05 [‐1.76, 3.86] |
| 5 Percent days of alcohol use in last 90 days (Form 90) ‐ 12 months Show forest plot | 3 | 304 | Mean Difference (IV, Random, 95% CI) | 0.63 [‐2.23, 3.48] |
| 6 Number of standard drinks (Form 90) ‐ 3 months Show forest plot | 2 | 75 | Mean Difference (IV, Random, 95% CI) | ‐2.87 [‐5.68, ‐0.07] |
| 7 Adolescent Drinking Index ‐ 3 months Show forest plot | 2 | 75 | Mean Difference (IV, Random, 95% CI) | 1.08 [‐4.42, 6.57] |
| 8 Percent days of alcohol/drug use (excl tobacco) (Form 90) ‐ 3 months Show forest plot | 4 | 214 | Mean Difference (IV, Random, 95% CI) | ‐0.70 [‐9.09, 7.70] |
| 9 Percent days of alcohol/drug use (excl tobacco) (Form 90) ‐ 6 months Show forest plot | 3 | 278 | Mean Difference (IV, Random, 95% CI) | ‐2.15 [‐9.82, 5.53] |
| 10 Percent days of alcohol/drug use (excl tobacco) (Form 90) ‐ 12 months Show forest plot | 2 | 127 | Mean Difference (IV, Random, 95% CI) | 5.87 [‐5.06, 16.79] |
| 11 Percent days only/any drug use (Form 90) ‐ 3 months Show forest plot | 5 | 384 | Mean Difference (IV, Random, 95% CI) | 0.67 [‐6.82, 8.15] |
| 12 Percent days only/any drug use (Form 90) ‐ 6 months Show forest plot | 3 | 295 | Mean Difference (IV, Random, 95% CI) | ‐2.28 [‐11.53, 6.96] |
| 13 Percent days only/any drug use (Form 90) ‐ 12 months Show forest plot | 3 | 304 | Mean Difference (IV, Random, 95% CI) | ‐5.28 [‐13.79, 3.23] |
| 14 Number of days used marijuana in last month ‐ 1 month Show forest plot | 2 | 235 | Mean Difference (IV, Random, 95% CI) | ‐0.52 [‐3.65, 2.62] |
| 15 Number of days used marijuana in last month ‐ 3 months Show forest plot | 2 | 235 | Mean Difference (IV, Random, 95% CI) | 0.37 [‐2.73, 3.47] |
| 16 Number of days used other drugs in last month ‐ 1 month Show forest plot | 2 | 204 | Mean Difference (IV, Random, 95% CI) | 1.21 [‐0.68, 3.10] |
| 17 Number of days used other drugs in last month ‐ 3 months Show forest plot | 2 | 204 | Mean Difference (IV, Random, 95% CI) | 0.22 [‐1.84, 2.28] |
| 18 Number of problem consequences ‐ 3 months Show forest plot | 3 | 182 | Mean Difference (IV, Random, 95% CI) | 1.51 [0.56, 2.47] |
| 19 Number of problem consequences ‐ 6 months Show forest plot | 2 | 261 | Mean Difference (IV, Random, 95% CI) | 0.34 [‐0.67, 1.34] |
| 20 Number of substance use diagnoses (CDISC) ‐ 3 months Show forest plot | 2 | 75 | Mean Difference (IV, Random, 95% CI) | ‐0.70 [‐1.27, ‐0.14] |
| 21 Number of categories of drug use (Form 90) ‐ 6 months Show forest plot | 2 | 261 | Mean Difference (IV, Random, 95% CI) | 0.14 [‐0.33, 0.61] |
| Outcome or subgroup title | No. of studies | No. of participants | Statistical method | Effect size |
| 1 Self esteem at endpoint Show forest plot | 2 | 142 | Std. Mean Difference (IV, Random, 95% CI) | 0.11 [‐0.22, 0.44] |
| Outcome or subgroup title | No. of studies | No. of participants | Statistical method | Effect size |
| 1 Depression at 3 months Show forest plot | 9 | 661 | Std. Mean Difference (IV, Random, 95% CI) | ‐0.03 [‐0.22, 0.17] |
| 2 Depression at 6 months Show forest plot | 6 | 586 | Mean Difference (IV, Random, 95% CI) | 0.83 [‐0.88, 2.55] |
| 3 Depression at 12 months Show forest plot | 5 | 441 | Mean Difference (IV, Random, 95% CI) | 1.28 [‐0.36, 2.92] |
| Outcome or subgroup title | No. of studies | No. of participants | Statistical method | Effect size |
| 1 Verbal aggression (Conflict Tactic Scale) ‐ 3 months Show forest plot | 3 | 208 | Mean Difference (IV, Random, 95% CI) | ‐0.00 [‐0.07, 0.06] |
| 2 Family violence (Conflict Tactic Scale) ‐ 3 months Show forest plot | 3 | 208 | Mean Difference (IV, Random, 95% CI) | ‐0.00 [‐0.02, 0.02] |
| Outcome or subgroup title | No. of studies | No. of participants | Statistical method | Effect size |
| 1 Percent of days living at home (Form 90) ‐ 3 months Show forest plot | 2 | 75 | Mean Difference (IV, Random, 95% CI) | ‐9.46 [‐27.96, 9.03] |
| Outcome or subgroup title | No. of studies | No. of participants | Statistical method | Effect size |
| 1 Delinquent behaviours at 3 months Show forest plot | 5 | 404 | Std. Mean Difference (IV, Random, 95% CI) | ‐0.29 [‐0.54, ‐0.03] |
| 2 Delinquent behaviours at 6 months Show forest plot | 3 | 348 | Std. Mean Difference (IV, Random, 95% CI) | ‐0.07 [‐0.52, 0.37] |
| 3 Delinquent behaviours at 12 months Show forest plot | 2 | 177 | Std. Mean Difference (IV, Random, 95% CI) | ‐0.16 [‐1.05, 0.72] |
| Outcome or subgroup title | No. of studies | No. of participants | Statistical method | Effect size |
| 1 Internalising behaviours at 3 months Show forest plot | 8 | 634 | Mean Difference (IV, Random, 95% CI) | 0.73 [‐0.87, 2.34] |
| 2 Internalising behaviours at 6 months Show forest plot | 6 | 582 | Mean Difference (IV, Random, 95% CI) | 0.30 [‐1.36, 1.97] |
| 3 Internalising behaviours at 12 months Show forest plot | 5 | 433 | Mean Difference (IV, Random, 95% CI) | 0.31 [‐1.58, 2.20] |
| 4 Externalising behaviours at 3 months Show forest plot | 8 | 636 | Std. Mean Difference (IV, Random, 95% CI) | 0.09 [‐0.10, 0.28] |
| 5 Externalising behaviours at 6 months Show forest plot | 6 | 583 | Mean Difference (IV, Random, 95% CI) | 0.83 [‐0.74, 2.41] |
| 6 Externalising behaviours at 12 months Show forest plot | 5 | 434 | Mean Difference (IV, Random, 95% CI) | 0.04 [‐2.89, 2.97] |
| 7 Number of psychiatric diagnoses Show forest plot | 3 | 182 | Mean Difference (IV, Random, 95% CI) | ‐0.06 [‐0.50, 0.37] |
| Outcome or subgroup title | No. of studies | No. of participants | Statistical method | Effect size |
| 1 Family cohesion (Family Environment Scale) ‐ 3 months Show forest plot | 3 | 208 | Mean Difference (IV, Random, 95% CI) | 0.88 [0.23, 1.54] |
| 2 Family conflict (Family Environment Scale) ‐ 3 months Show forest plot | 3 | 208 | Mean Difference (IV, Random, 95% CI) | ‐0.05 [‐0.91, 0.81] |
| 3 Parental care (Parental Bonding Instrument) ‐ 3 months Show forest plot | 3 | 208 | Mean Difference (IV, Random, 95% CI) | 1.68 [‐0.63, 4.00] |
| 4 Parental overprotection (Parental Bonding Instrument) ‐ 3 months Show forest plot | 3 | 208 | Mean Difference (IV, Random, 95% CI) | ‐0.82 [‐4.75, 3.10] |