Intervenções para promover reintegração e para reduzir comportamento e estilo de vida prejudiciais em crianças e jovens em situação de rua.
Appendices
Appendix 1. Descriptive map of studies
Interventions for promoting reintegration and reducing harmful behaviour and lifestyles in street‐connected children and young people
Report on internal descriptive map (relates to original review; not updated in 2015)
Methods
The original search for the systematic review was broad based and inclusive and retrieved 15,995 unique references. These were screened by two people into the following categories: Effectiveness study: probability of inclusion, Evaluation study with other study designs, Ethnography or other qualitative studies, Excluded: related to street children but not evaluating effectiveness, Narrative Review, Excluded: not related with street children, Non‐English language studies. Fifty‐seven studies were coded by one or both reviewers as ‘Effectiveness study: probability of inclusion’. For the mapping exercise, full text was obtained for all of these, where available. In addition, non‐English language studies and forty references identified through narrative reviews were evaluated according to the same categories. As a result, six more studies (seven references) were added to the mapping.
The research team developed a pilot coding scheme with 50 coding categories which was implemented using SPSS to describe and categorise the studies. This framework was based on the conceptual thinking underlying the street children review and explicated in the review protocol. Thus codes included study location, income status of country, age, gender, religion, ethnicity, disability, sexual orientation status, numbers of participants, study design, objectives, and intervention details. The criteria for in the mapping exercise were otherwise the same as in the main review, but a broader range of study designs (e.g. cross‐sectional, 1‐group pretest‐posttest) were included.
Sixty references were included in the mapping exercise and full text was sought for all of them. The majority were published journal articles. Out of the sixty publications reviewed by full text, 23 were excluded on various grounds, e.g. for not focusing on street children or not evaluating outcomes (full text was unavailable for three of these references). Five studies were associated with two references, bringing the total number of studies considered for mapping to fifty‐five. Eleven of these studies (12 references) were included in the review.
Two of the mapped studies (three references) did not report on outcomes, but were deemed relevant for the mapping since they pertain to LMI countries and included useful process evaluation (these studies are excluded from the frequency analysis). One of these reports on a qualitative cross‐regional comparison study, and the other provides an overview of an HIV/AIDS prevention programme for street youth in Uganda.
The following overview draws on a statistical frequency analysis of the remaining thirty studies (34 references). More detailed data, including missing values where relevant, are available in tables from the authors. Numbers in brackets refer to the number of studies.
Dates
The included publications were published between 1985 and 2012, with the majority being published from 2001 onwards, and the highest number of studies (6) published in 2007, including two out of the three MIC studies included in the map. The third MIC study was published in 2010.
Countries and regions
Out of the total of thirty studies included in the map, twenty‐seven were conducted in high income (HI) countries and three in middle income (MI) countries[1] (two in Africa and one in Latin America). The only relevant study from a low income (LI) country is the study from Uganda mentioned above. The overwhelming majority of the studies (22) were conducted in the USA. Other study countries were Canada (2), Australia, Brazil, Egypt, Korea, Nigeria and UK (one study in each).
Age groups
Approximately half of the studies (16) examined children and young people in the 11‐24 age‐group (of these, two studies only described the average age of participants). Seven studies looked at the age‐group between 11 and 18, two studies at participants aged 15‐18 and one study at participants aged 11‐14. Only four studies included children under the age of 10, two of these being studies of homeless families with children in HI countries. Two out of the three MIC studies recruited participants in the 11‐24 age‐group, while one Egyptian intervention was aimed at boys aged 7‐15.
Demographic data and equities
The majority of the studies (27) reported a mixed sample of males and females. One US study had an all‐female sample, and two studies (one Korean and one Egyptian) only included street‐connected boys.
Seven studies did not indicate ethnic minority status for participants. The majority of studies conducted in HI countries, especially in the USA, reported on demographic data and included participants of various ethnic backgrounds.
Data on sexual orientation of participants were reported in five studies. Data on disability status was not reported in any study.
Study design
The majority (27) of the studies included in this map (aside from the two excluded from the current analysis) were quantitative, while three employed mixed methods. We classified eight studies as randomised controlled trials, two as controlled before and after studies, and one as a quasi‐randomised trial. All of these studies were conducted in HICs (see Table 1 below) and were included in the review following further screening against criteria specified in the review protocol.
Types of control groups ranged from those receiving treatment/ services as usual (SAU) (11)[2], to groups receiving no treatment/ unspecified SAU (4)[3], or a comparison or control group receiving an alternate form of treatment (3)[4]. Four studies included a comparison group from a different setting[5].
Reasons for excluding studies from the review are summarised in the Characteristics of excluded studies table in the review. A common reason was the lack of a comparable control group, e.g. due to selection bias. Nine studies did not include any control or comparison group [6] and were thus excluded from the review.
Longest follow‐up points ranged from less than three months (7) to 3 months (4), 5 months (1), 6 months (4), 9 months (1) one year (5) and over one year (4). Relevant data was unavailable for four studies.
Intervention type
The most typical type of intervention was multi‐component (15), e.g. consisting of an educational, health and counselling or other type of intervention. The next most common type of intervention was focused on HIV/ AIDS education (4). Other interventions were therapeutic (5), focusing on sexual health (3), drug and alcohol abuse (2), or educational (1). Process factors regarding aspects of delivery of the interventions, were highlighted in approximately half of the studies.
Outcomes
A range of outcomes were measured in the studies. For MI countries, the most commonly measured were education and empowerment. Also measured in these studies were family reintegration, reduced risk behaviours, mental health outcomes and employment, all of which are relevant to the review.
Concluding remarks
The map highlights a paucity of robust evaluations conducted in low and middle income countries. Even within HIC evaluations, some do not utilise robust methods. Where evaluations are conducted in LMICs the study designs tend towards the more observational. Intervention types evaluated vary, and many are multi‐component, although there is consistent focus on addressing reintegration and welfare promotion related factors. However, it should be noted that due to imbalance in the evidence base regarding studies from these countries, the sample we are describing is small. Future research needs to address this gap in knowledge with more evaluated intervention studies that acknowledge the specific socio‐economic conditions of HI, MI and LI countries.
Reference
Bragge P ; Clavisi O ; Turner T; Tavender E ; Collie A ; Gruen R (2011) The ‘Global Evidence Mapping Initiative: Scoping research in broad topic areas’ BMC Medical Research Methodology 11, 1 rec.no 92 Issn:14712288
[1] As defined by the World Bank
[2] Baer 2007n, Cauce 1994n Ferguson 2007/08, Hyun 2005n, Milburn 2012n, Rotheram‐Borus 2003n, Slesnick 2005n, Slesnick 2007/08n, Slesnick 2009 EBFT; Slensick 2009 FFTn, Upshur 1985, Wurzbacher 1991
[3] Booth 1999, Olley 2007, Peterson 2006n, Rew 2007n
[4] Beharie 2011, Davey 2001, Slesnick 2009 EBFT; Slesnick 2009 FFTn
[5] Gleghorn 1997, Sears 2001, Thompson 2002, Upshur 1985
[6] Auerswald 2006, Barber 2005, Dalton 2002, Haley 1998, Hosny 2007, Schram 1991, Scivoletto 2010, Steele 2001/03, Stewart 2009
n = included in review
Appendix 2. Change scores
We calculated the change scores by subtracting mean scores at the relevant time point from mean scores at baseline. Directions of the change are explained in the text. They were calculated for all outcome items and time‐points included in the meta‐analysis. Further, ‘longer term’ change scores were calculated for these items at the longest follow‐up point not included in the meta‐analysis.
For outcome items not included in the meta‐analysis (see Appendix 3 for a list of these outcome items by study), change scores were similarly calculated using relevant time points (where raw data was available) or the longest follow‐up point (where only percentage data were available). These scores are presented separately under relevant subsections below.
P‐value and F‐values for some of these trends can be found in the relevant studies. However, it was beyond the scope of this review to confirm or calculate these values for each of the outcome items discussed here. For the sake of consistency, we have chosen not to refer to the values reported by study authors.
Secondary outcomes
The numbering of the outcome categories follows the numbering in Effects of interventions. The sub‐outcomes are numbered in the order they appear here.
1. Safer or reduced sexual activity
1.a Number of times had sex in last 90 days (3 & 6 months)
Change scores: 3 months: Milburn 2012: 0.56 (intervention), 1.38 (control). Slesnick 2007/08: 0.02 (intervention), ‐0.05 (control). 6 months: Milburn 2012: 3.26 (intervention), 0.23 (control). Slesnick 2009 EBFT; Slesnick 2009 FFT: 0.08 (intervention), ‐0.24 (control). The changes show mixed patterns but overall are marginal to small.
Longer term change scores. Number of times had sex in last 90 days: Milburn 2012: 12 months: 4.39 (intervention), ‐0.53 (control). The figures appear to be in benefit of the control group, although the validity of this measure in indicating high‐risk behaviour is unclear.
1.b Number of sexual partners in last 90 days (3 & 6 months)
Change scores: 3 months: Milburn 2012: 0.15 (intervention), 0.22 (control). Slesnick 2007/08: ‐0.05 (intervention), ‐0.09 (control). 6 months: Milburn 2012: ‐0.25 (intervention), ‐0.06 (control). Slesnick: ‐0.11 (intervention), ‐0.19 (control). The changes appear marginal in all groups.
Longer term change scores. Number of sexual partners in last 90 days: Milburn 2012: 12 months: ‐0.36 (intervention), 1.02 (control). The figures appear to be in benefit of the control group. Among significant intervention effects in this study, this trend shows the most divergent long‐term pattern between intervention and control groups.
In Milburn 2012, an unexpected result was that while the (already low) number of partners differentially reduced in the intervention group, for number of times had sex there was a reversal in trends at 6 months: compared to the 3 month scores, the mean increased 5.8 times in the intervention group, and reduced 6 times in the control group. These data are difficult to interpret but may mean that intervention participants had fewer partners but had sex more often. In terms of this review, fewer partners may entail less risk so this may be seen as a positive result.
1.c Unprotected sex/ condom use
In Slesnick 2007/08, change scores for condom use frequency (self/ partner) were: 3 months: 0.16 (intervention), 0.24 (control). 6 months: 0.15 (intervention), 0.05 (control). Total scores on the condom attitude scale (Slesnick 2007/08) were not available.
Longer term change scores: Milburn 2012: 12 months: Percentage of participants who had had unprotected sex in last 3 months: 2.3 (intervention), 0.9 (control).
In Slesnick 2007/08, the changes appear marginal. In Milburn 2012, the longer term figures appear to favour the control group.
1.d Other sexual risk behaviour
In Slesnick 2007/08: Raw numbers were not available for these outcome items. So we calculated change scores at 6 months for percentage of participants who had had sex with more than one partner within 24h: 1.11 (intervention), ‐5.75 (control). Percentage of participants had had sex with high‐risk sex partners in last 3 months: ‐2.6 (intervention), ‐4.25 (control). Percentage of participants had engaged in anal sex in last 3 months: ‐2.36 (intervention), ‐5.14 (control). Percentage of participants had engaged in casual sex in last 3 months: ‐10.19 (intervention), ‐12.54 (control). Percentage of participants had engaged in survival sex in last 3 months: 0.6 (intervention), ‐8.3 (control).
Notably the above figures suggest that control group participants had reduced risky behaviours considerably more than intervention participants on several outcome items. In particular, for percentage of participants who had had sex with more than one partner within 24h, the figure increased in the intervention group but reduced in the control group (see also the last outcome item, although total numbers of participants for this were small). These figures suggest that the comparison intervention may have been more efficient for this outcome category.
Longer term change scores: Milburn 2012: 12 months: Percentage of participants who had had sex in last 3 months: ‐4.9 (intervention), 1.9 (control). As the authors maintain, fewer participants in the intervention group appear to have initiated sexual relations over the duration of the study. In the control group there was a marginal increase. According to the figures, on average less than half of participants in either group had had sex in the last 3 months (no SD available).
2. Safer or reduced substance use (e.g. reduced sharing of injecting equipment).
2.a Number of days of alcohol use in last 30 days (1 & 3 months)
Change scores: 1 month: Baer 2007: ‐1.9 (intervention), ‐1.3 (control), Peterson 2006: ‐1.16 (intervention), ‐1.2 (control). 3 months: Baer 2007: ‐1.1 (intervention), ‐1.9 (control); Peterson 2006: ‐1.47 (intervention), ‐3.09 (control). The changes were similar in all groups, showing only a marginal reduction in number of days of alcohol use. The largest reduction was in the control group in Peterson 2006.
2.b Percentage days of alcohol use in last 90 days (3, 6 & 12 months)
Change scores: 3 months: Slesnick 2005: ‐2.04 (intervention), ‐1.22 (control). Slesnick 2009 EBFT; Slesnick 2009 FFT: ‐15.0 (EBFT intervention), ‐18.0 (FFT intervention), ‐8.0 (control). Carmona 2014/Slesnick 2015 CM; Carmona 2014/Slesnick 2015 CRA; Carmona 2014/Slesnick 2015 HIV; Carmona 2014/Slesnick 2015 MET: ‐8.2 (MET), ‐4.7 (CRA), ‐2.29 (CM). 6 months: Slesnick 2005: ‐18.94(EBFT), ‐17.04 (control); Carmona 2014/Slesnick 2015 CM; Carmona 2014/Slesnick 2015 CRA; Carmona 2014/Slesnick 2015 HIV; Carmona 2014/Slesnick 2015 MET: ‐6.31 (CRA), ‐0.53 (CM), ‐10.5 (MET). 12 months:Slesnick 2005: ‐0.95 (intervention), ‐1.59 (control). Carmona 2014/Slesnick 2015 CM; Carmona 2014/Slesnick 2015 CRA; Carmona 2014/Slesnick 2015 HIV; Carmona 2014/Slesnick 2015 MET: ‐8.45 (CRA), ‐3.05 (CM), ‐7.76 (MET).
Percentage days of alcohol use was reduced across all groups, but the largest reduction was in both intervention groups in Slesnick 2009 EBFT; Slesnick 2009 FFT at 3 months, while the figures for Slesnick 2005 appear to favour the control group at 12 months.
Longer term change scores: Slesnick 2009 EBFT; Slesnick 2009 FFT: 15 months: ‐26 (EBFT intervention), ‐20 (FFT intervention), ‐10 (control).
Overall the trends are similar to above, with reductions across the groups, particularly in the family therapy intervention groups.
Milburn 2012: 12 months: Times used alcohol: ‐6.16 (intervention), ‐0.82 (control). This appears to represent a benefit in favour of the intervention group. Accurate data for percentage of participants who used alcohol (intervention) was not available.
In Baer 2007, change scores for number of days of abstinence in last 30 days were: 1 month: 3.7 (intervention), 6.4 (control). 3 months: 2.7 (intervention), 6.0 (control). These figures appear to favour the control group.
2.c Number of standard drinks in last 90 days (3 months)
Change scores: Slesnick 2009 EBFT; Slesnick 2009 FFT: 5.31 (EBFT intervention), 5.16 (FFT intervention), 0.18 (control). The number of standard drinks reduced for both intervention groups, but only marginally for the control group.
Longer term change scores. Slesnick 2009 EBFT; Slesnick 2009 FFT: 15 months: ‐7.37 (EBFT intervention), ‐6.24 (FFT intervention), ‐0.13 (control). The trend is similar to above.
In Peterson 2006, change scores at 1 month for number of standard drink units in last 30 days were ‐5.51 (intervention), ‐7.89 (control). The trends appear similar, with a slightly larger reduction in the control group. 3‐month data were not available. Data for number of days of binge drinking in last 30 days were also not available.
2.d Adolescent Drinking Index score (3 months)
Change scores: ‐2.36 (Slesnick 2009 EBFT),‐ 6.9 (Slesnick 2009 FFT), ‐2.34 (control). The ADI score reduced in all groups, most significantly in the FFT intervention group.
Longer term change scores: 15 months: ‐12.91 (Slesnick 2009 EBFT), ‐11.42 (Slesnick 2009 FFT), ‐8.69 (control).
The differences between the groups appear small but all show an overall reduction in the ADI score.
In Nyamathi 2012/13 AM; Nyamathi 2012/13 HPP, change scores for alcohol use were: ‐22.7% (AM), ‐19.6% (HHP). The definition used in the scale is unclear.
2.e Percentage days of alcohol/ drug use in last 90 days (3,6 & 12 months)
Change scores: 3 months: Slesnick 2009 EBFT; Slesnick 2009 FFT: ‐10 (EBFT intervention), ‐28 (FFT intervention), ‐13 (control). Slesnick 2013/Guo 2014 CRA; Slesnick 2013/Guo 2014 EBFT; Slesnick 2013/Guo 2014 MET were: ‐15.49 (EBFT), ‐2.5 (CRA), ‐10.73 (MET). 6 months: Slesnick 2007/08: ‐24 (intervention), ‐10 (control). Slesnick 2013/Guo 2014 CRA; Slesnick 2013/Guo 2014 EBFT; Slesnick 2013/Guo 2014 MET: ‐14.75 (EBFT), ‐10.25 (CRA), ‐15.26 (MET). 12 months: Slesnick 2013/Guo 2014 CRA; Slesnick 2013/Guo 2014 EBFT; Slesnick 2013/Guo 2014 MET: ‐11.57 (EBFT), ‐8.19 (CRA), ‐16.55 (MET).
The percentage of days of alcohol or drug use reduced in all groups.
Longer term change scores. Slesnick 2009 EBFT; Slesnick 2009 FFT: 15 months: ‐31 (EBFT intervention), ‐30 (FFT intervention), ‐5 (control). Slesnick 2013/Guo 2014 CRA; Slesnick 2013/Guo 2014 EBFT; Slesnick 2013/Guo 2014 MET: 24 months: ‐3.41 (EBFT), ‐0.88 (CRA), ‐7.78 (MET).
There were reductions in all groups, but comparatively smaller in the CRA intervention group.
In Cauce 1994, change scores at 3 months for substance abuse were: ‐3.4 (intervention). ‐5.3 (control), indicating slightly more change in the control group.
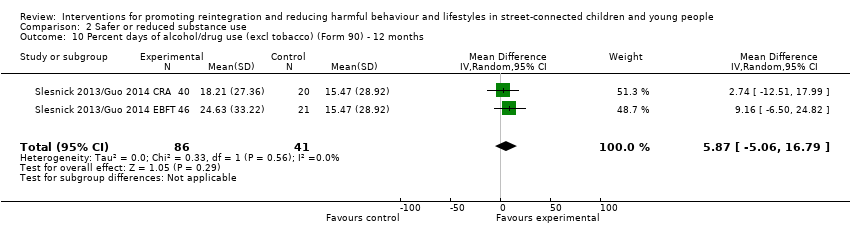
2.f Percentage days of only/ any drug use (excl. alcohol or tobacco) in last 90 days (3, 6 & 12 months)
Change scores:3 months: Slesnick 2005: ‐20.31 (intervention), ‐15.1 (control). Slesnick 2009 EBFT; Slesnick 2009 FFT: ‐12 (EBFT intervention), ‐19 (FFT intervention), ‐8 (control). Carmona 2014/Slesnick 2015 CM; Carmona 2014/Slesnick 2015 CRA; Carmona 2014/Slesnick 2015 HIV; Carmona 2014/Slesnick 2015 MET: ‐22.69 (MET), ‐5.16 (CRA), ‐6.09 (CM). 6 months: Slesnick 2005: ‐18.94 (intervention), ‐17.04 (control). Carmona 2014/Slesnick 2015 CM; Carmona 2014/Slesnick 2015 CRA; Carmona 2014/Slesnick 2015 HIV; Carmona 2014/Slesnick 2015 MET: ‐20 (MET), ‐17.56 (CRA), ‐11.55 (CM). 12 months: Slesnick 2005 ‐28.94 (intervention), ‐20.26 (control). Carmona 2014/Slesnick 2015 CM; Carmona 2014/Slesnick 2015 CRA; Carmona 2014/Slesnick 2015 HIV; Carmona 2014/Slesnick 2015 MET: ‐19.15 (MET), ‐18.59 (CRA), ‐9.17 (CM).
Longer term change scores: Slesnick 2009 EBFT; Slesnick 2009 FFT: 15 months: ‐23 (EBFT intervention), ‐23 (FFT intervention), 2 (control). These data appear impressive and the authors claim benefit, however, due to the lack of information on error or deviation from the mean, they should be treated with caution, and as indicators only.
In Slesnick 2005, (MOVED ABOVE) Percentage days used tobacco in last 90 days: 3 months: ‐8.63 (intervention), ‐5.55 (control). 6 months: ‐1.45 (intervention), ‐3.44 (control). 12 months: 0.39 (intervention), ‐7.27 (control). Percentage days used cocaine in last 90 days: 3 months: ‐1.63 (intervention), ‐4.82 (control). 6 months: ‐2.89 (intervention), ‐5.01 (control). 12 months: ‐2.8 (intervention), ‐5.94 (control). Percentage days used opiates in last 90 days: 3 months: ‐0.9 (intervention), 0.43 (control). 6 months: ‐1.74 (intervention), ‐0.64 (control). 12 months: ‐2.08 (intervention), ‐0.87 (control).
These findings are very mixed, which may partially reflect the fact that use of different substances is being assessed in each category, and thus potentially different participants. For some of these, there appeared to be significant baseline differences. The authors claim some benefits which are partially supported by these data, but without great certainty, in view of the missing standard deviation/error data. The data also suggest some benefits for control groups, especially for tobacco and cocaine use.
2.g Number of categories of drug use in last 90 days (6 months)
Change scores: Slesnick 2005:‐ 0.38 (intervention), ‐0.81 (control); Slesnick 2007/08: ‐1.14 (intervention), ‐0.85 (control). The changes were marginal across all groups.
Longer term change scores: Slesnick 2005: 12 months: ‐0.88 (intervention), ‐1.41 (control)
A slightly larger reduction is suggested in the control group.
2.h Number of days of marijuana use in last 30 days (1 & 3 months)
Change scores: 1 month: Baer 2007: ‐3.7 (intervention), ‐6.1 (control), Peterson 2006: ‐2.16 (intervention), ‐1.77 (control). 3 months: Baer 2007: ‐2.6 (intervention), ‐5.9 (control); Peterson 2006:‐ 3.94 (intervention), ‐4.44 (control). The number of days of marijuana use reduced across all groups. The largest reductions were for the control groups at both time‐points in Baer 2007 and at 3 months in Peterson 2006.
In Slesnick 2005, change scores for percentage days used marijuana in last 90 days were: 3 months: ‐17.92 (intervention), ‐12.58 (control). 6 months: ‐15.39 (intervention), ‐14.59 (control). 12 months: ‐25.65 (intervention), ‐16.96 (control). There were reductions in both groups at both time points but changes were slightly larger in the intervention group.
In Nyamathi 2012/13 AM; Nyamathi 2012/13 HPP, change scores for marijuana use were: ‐18.2 (AM), ‐14.6% (HHP). The definition used in the scale is unclear.
Longer term change scores: Milburn 2012: 12 months: Percentage of participants who used marijuana: ‐10.8 (intervention), ‐22.8 (control). Times used marijuana: 0.88 (intervention), ‐5.19 (control). Both figures appear to be in favour of the control group.
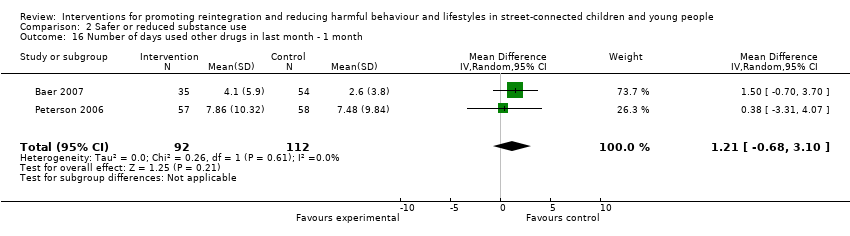
2.i Number of days of illicit drug use other than marijuana in last 30 days (1 & 3 months)
Change scores: 1 month: Baer 2007: ‐2.3 (intervention), ‐3.0 (control), Peterson 2006: ‐1.42 (intervention), ‐0.71 (control). 3 months: Baer 2007: ‐2.8 (intervention), ‐2.3 (control); Peterson 2006: ‐1.37 (intervention), ‐0.29 (control). The number of days of other drug use reduced across all groups. In Baer 2007, the changes for the two groups were similar. In Peterson 2006, the reduction was larger in the intervention group.
In Peterson 2006, change scores for 'summed drug use other than marijuana' were: 1 month: ‐2.94 (intervention, 0.34 (control). 3 months: ‐4.53 (intervention), ‐1 (control). These appear to favour the intervention group, though at 3 months there was a reduction in both groups.
Longer term change scores: Milburn 2012: 12 months: Percentage of participants who used hard drugs: ‐8.8 (intervention), ‐9.8 (control). Times used hard drugs: ‐2.3 (intervention), ‐1.34 (control). The first figures indicate a similar change in both groups, whilst the second indicates a larger reduction in the intervention group.
2.j Number of problem consequences (3 & 6 months)
Change scores: 3 months: Slesnick 2005: ‐1.14 (intervention), ‐1.78 (control); Slesnick 2009: ‐1.44 (EBFT intervention), ‐2.08 (FFT intervention), ‐3.66 (control). 6 months: Slesnick 2005: ‐2.15 (intervention), ‐2.25 (control); Slesnick 2007/08: ‐2.33 (intervention), ‐1.74 (control). The number of problem consequences reduced across all groups. The reduction was relatively larger in the control group at 3 months in Slesnick 2009.
Longer term change scores. Slesnick 2005: 12 months: ‐2.58 (intervention), ‐3.04 (control). Slesnick 2009: ‐2.92 (EBFT intervention), ‐2.95 (FFT intervention), ‐2.73 (control).
The figures indicate similar reductions across all groups.
2.k Number of substance use diagnoses (3 months)
Change scores: Slesnick 2009 EBFT; Slesnick 2009 FFT: ‐0.78 (EBFT intervention), ‐1.08 (FFT intervention), ‐0.35 (control). The number of substance use diagnoses reduced marginally across all groups.
Longer term change scores. Slesnick 2009 EBFT; Slesnick 2009 FFT: 15 months: ‐1.17 (EBFT intervention), ‐1.23 (FFT intervention), ‐1.58 (control).
2.l Use of injection drugs
In Slesnick 2007/08, change scores for number of people shared needles to inject drugs in last 3 months were: 3 months: ‐0.01 (intervention), ‐0.01 (control). 6 months: 0.0 (intervention), 0.0 (control). Percentage of participants who had shared needles to inject any drugs in last 3 months: 6 months: ‐0.5 (intervention), ‐0.9 (control). Percentage of participants who had injected drug use in last 3 months: 6 months: ‐3.86 (intervention), ‐3.05 (control).
The trends are similar for both groups, ranging from no change to a very small reduction in risk behaviours. The baseline levels for these outcome items were very low.
2.m Average standard ethanol content (SEC) (3, 6 & 12 months)
Chage scores: 3 months: Carmona 2014/Slesnick 2015 CM; Carmona 2014/Slesnick 2015 CRA; Carmona 2014/Slesnick 2015 HIV; Carmona 2014/Slesnick 2015 MET: ‐1.35 (CRA), ‐0.25 (CM), ‐0.89 (MET). 6 months: ‐2.36 (CRA), ‐1.62 (CM), ‐2.04 (MET), 12 months: Carmona 2014/Slesnick 2015 CM; Carmona 2014/Slesnick 2015 CRA; Carmona 2014/Slesnick 2015 HIV; Carmona 2014/Slesnick 2015 MET: ‐2.15 (CRA), ‐12.5 (CM), ‐2 (MET).
This measure was not used in any other study and we were unable to find sufficient information on this measure to assist in interpreting the results.
3. Increased use of hostel/shelter type services
In Baer 2007, the change scores for 'number of visits at drop‐in centre in last 30 days' (agency reported) were: 1 month: 0.9 (intervention), ‐0.2 (control). 3 months: ‐1.1 (intervention), ‐1.0 (control). 'Number of visits to additional services in last 30 days' (agency reported): 1 month: 0.5 (intervention), 0.0 (control). 3 months: 0.1 (intervention), ‐0.1 (control). 'Number of visits to other services in last 30 days' (youth reported) were: 1 month: ‐2.4 (intervention), ‐7 (control). 3 months: ‐3.4 (intervention), ‐8.2 (control).
The figures indicate little differences between the groups, apart from number of visit to drop‐in centre at 1 month, which may be a contingency effect (youth using drop‐in services while attending the intervention). Also, self‐reported number of visits to additional services appear to have reduced more in the control group. Overall, the intervention did not appear to increase service use.
6. Self‐esteem
Change scores: Cauce 1994: 0.2 (intervention), 0.5 (control); Hyun 2005 2.29 (intervention), 3.07 (control). The trends are similar for all groups, but largest increase in mean score for self‐esteem was in the control group in Hyun 2005.
7. Depression (BDI score) (3, 6 & 12 months)
Change scores: 3 months (/8 weeks, Hyun 2005): Cauce 1994: ‐5.1 (intervention), ‐3.7 (control); Hyun 2005: ‐5.79 (intervention), 2.38 (control); Slesnick 2005: ‐4.69 (intervention), ‐4.65 (control); Slesnick 2009: ‐4.09 (EBFT intervention), ‐5.88 (FFT intervention), ‐3.24 (control); Slesnick 2013/Guo 2014 CRA; Slesnick 2013/Guo 2014 EBFT; Slesnick 2013/Guo 2014 MET ‐6.43 (EBFT), ‐4.65 (CRA), ‐4.48 (MET); Carmona 2014/Slesnick 2015 CM; Carmona 2014/Slesnick 2015 CRA; Carmona 2014/Slesnick 2015 HIV; Carmona 2014/Slesnick 2015 MET: ‐0.7 (CRA), ‐4.84 (CM), ‐4.56 (MET). 6 months: Slesnick 2005: ‐5.13 (intervention), ‐6.05 (control); Slesnick 2007/08: ‐8.25 (intervention), ‐3.8 (control); Slesnick 2013/Guo 2014 CRA; Slesnick 2013/Guo 2014 EBFT; Slesnick 2013/Guo 2014 MET ‐4.65 (EBFT), ‐6.87 (CRA), ‐8.94 (MET); Carmona 2014/Slesnick 2015 CM; Carmona 2014/Slesnick 2015 CRA; Carmona 2014/Slesnick 2015 HIV; Carmona 2014/Slesnick 2015 MET: ‐3.93 (CR), ‐4.81 (CM), ‐6.99 (MET). 12 months: Slesnick 2005: ‐6.94 (intervention), ‐8.48 (control). Slesnick 2013/Guo 2014 CRA; Slesnick 2013/Guo 2014 EBFT; Slesnick 2013/Guo 2014 MET: ‐5.65 (EBFT), ‐8 (CRA), ‐9.45 (MET). Carmona 2014/Slesnick 2015 CM; Carmona 2014/Slesnick 2015 CRA; Carmona 2014/Slesnick 2015 HIV; Carmona 2014/Slesnick 2015 MET: ‐3.14 (CR), ‐6.11 (CM), ‐7.55 (MET),
Again, the trends are similar across the studies, indicating reductions in depression scores across all groups, apart from a contrasting trend in Hyun 2005, clearly favouring the intervention. The figures for Slesnick 2007/08 also seem to favour the intervention.
In Cauce 1994, the change scores for anxious/ depressed (as measured on the YSR) were: 3 months: ‐1.7 (intervention), ‐0.9 (control), indicating no clinically significant difference between the groups and no significant change from baseline on this scale, as compared to the RADS cited above.
Longer term change scores. Slesnick 2009 EBFT; Slesnick 2009 FFT: 15 months: ‐7.13 (EBFT intervention), ‐7.60 (FFT intervention), ‐4 (control). Slesnick 2013/Guo 2014 CRA; Slesnick 2013/Guo 2014 EBFT; Slesnick 2013/Guo 2014 MET: 24 months: ‐5.74 (EBFT), ‐6.1 (CRA), ‐6.74 (MET).
The figures show similar reductions in all groups .
10. Reduced use of violence
10.a Verbal aggression (youth) (3 months)
Change scores: Slesnick 2005: ‐0.19 (intervention), ‐0.14 (control); Slesnick 2009 EBFT; Slesnick 2009 FFT : ‐0.21 (EBFT intervention),‐ 0.25 (FFT intervention), ‐0.11 (control).
Longer term change scores. Slesnick 2005: 12 months: ‐0.25 (intervention), ‐0.25 (control). Slesnick 2009 EBFT; Slesnick 2009 FFT: 15 months: ‐0.23 (EBFT intervention), ‐0.36 (FFT intervention), ‐0.18 (control).
There appear to be no differences between the groups, with reduced aggression reported in all. The mean scores on this measure appear to be consistently low.
10.b Family violence (youth) (3 months)
Change scores: Slesnick 2005: ‐0.03 (intervention), ‐0.04 (control); Slesnick 2009 EBFT; Slesnick 2009 FFT: ‐0.04 (EBFT intervention), ‐0.05 (FFT intervention), ‐0.04 (control).
Longer term change scores. Slesnick 2005: 12 months: ‐0.06 (intervention), ‐0.05 (control). Slesnick 2009 EBFT; Slesnick 2009 FFT: 15 months: ‐0.07 (EBFT intervention), ‐0.06 (FFT intervention), ‐0.03 (control).
Again, there appear to be no differences between the groups, with reduced aggression reported in all. The mean scores on this measure appear very low overall.
11. Increased contact with family
Change scores: Slesnick 2009 EBFT; Slesnick 2009 FFT: ‐11.0 (EBFT intervention), ‐19 (FFT intervention), 3 (control). The control group increased their number of days living at home by three days on average, in contrast to both intervention groups who reduced it by more than one week (EBFT) and two weeks (FFT) on average.
Longer term change scores. Slesnick 2009 EBFT; Slesnick 2009 FFT: 15 months: 7 (EBFT intervention), 9 (FFT intervention), 27 (control).
At 15 months, all groups had increased the amount of time spent at home. However, there appears to have been a considerably larger increase in the average percentage of days living at home in the control group, compared to both intervention groups.
Other outcomes
13. Social functioning
13.a Delinquent behaviours (at 3, 6 & 12 months)
Change scores: 3 months: Cauce 1994: ‐1.4 (intervention), ‐0.7 (control); Milburn 2012: ‐1.45 (intervention), ‐1.07 (control); Slesnick 2005: ‐87.63 (intervention), ‐192.61 (control); Slesnick 2009: ‐154 (EBFT intervention), ‐151 (FFT intervention), ‐842 (control). 6 months: Milburn 2012: ‐1.55 (intervention), ‐1.09 (control); Slesnick 2005: ‐71.20 (intervention), ‐274.29 (control); Slesnick 2007/08: 10.56 (intervention), ‐29.97 (control). 12 months: Milburn 2012: ‐1.74 (intervention), ‐1.12 (control); Slesnick 2005: ‐84.43 (intervention), ‐307.8 (control).
According to these figures, there was a reduction in delinquent behaviours across all groups, with the single exception of the intervention group in Slesnick 2007/08, for whom the number of delinquent behaviours had increased at 6 months, as opposed to a reduction in the control group. Further, in the Slesnick studies, the reductions appear considerably larger in the control group, while the opposite was true in Milburn 2012 and Cauce 1994.
Little information was available for any of the scales to aid interpretation of the scores. However, in the Slesnick studies, the data were skewed and in two Slesnick studies there was considerable baseline imbalance for this outcome, with the control groups in Slesnick 2005 and Slesnick 2009 EBFT; Slesnick 2009 FFT having considerably higher mean scores at baseline.
Longer term change scores. Delinquent behaviours: Slesnick 2005: 12 months: ‐84.43 (intervention), ‐307.17 (control). Slesnick 2009 EBFT; Slesnick 2009 FFT: 15 months: ‐154 (EBFT intervention), ‐159 (FFT intervention), ‐912 (control). Milburn 2012: 12 months: ‐1.74 (intervention), ‐1.12 (control).
The figures indicate reductions in all groups. The figures for Slesnick appear to favour the control group, while the figures for Milburn appear similar in both groups.
13.b Other social functioning measures
In Cauce 1994, the change scores for 'social problems' were: ‐0.4 (intervention), ‐0.1 (control), indicating marginal change in both groups.
In Slesnick 2007/08, change scores at 6 months for 'social stability', were: 28 (intervention), 7 (control). This figure appears to significantly favour the intervention. Social stability was measured in this study only on Form 90 by the percentage days in work, education, being housed, and seen for medical care.
In Carmona 2014/Slesnick 2015 CM; Carmona 2014/Slesnick 2015 CRA; Carmona 2014/Slesnick 2015 HIV; Carmona 2014/Slesnick 2015 MET, change scores for % days homeless (defined as 'Total number of days living homeless, or with
others, no rent') were: 3 months: ‐16.09 (CRA), ‐14.5 (CM), ‐23.07 (MET). 6 months: ‐27.79 (CRA), ‐33.83 (CM), ‐45.27 (MET). 12 months: ‐44.38 (CRA), ‐40.33 (CM), ‐46.70 (MET). There appeared to be reductions across all groups, particularly at the longest follow‐up.
14. Psychological functioning
14.a Internalising problems (YSR) (at 3, 6 & 12 months)
Change scores: 3 months: Cauce 1994 2.7 (intervention), 1.8 (control); Slesnick 2005: 1.33 (intervention), 4.91 (control); Slesnick 2009: 3.44 (EBFT intervention), 3.44 (FFT intervention), 4.46 (control); Slesnick 2013/Guo 2014 CRA; Slesnick 2013/Guo 2014 EBFT; Slesnick 2013/Guo 2014 MET ‐0.2 (EBFT), ‐3.54 (CRA), ‐3.22 (MET); Carmona 2014/Slesnick 2015 CM; Carmona 2014/Slesnick 2015 CRA; Carmona 2014/Slesnick 2015 HIV; Carmona 2014/Slesnick 2015 MET: 0.41 (CRA), ‐3.15 (CM), ‐1.94 (MET). 6 months: Slesnick 2005: 3.76 (intervention), 4.64 (control); Slesnick 2007/08: 7.04 (intervention), 3.31 (control); Slesnick 2013/Guo 2014 CRA; Slesnick 2013/Guo 2014 EBFT; Slesnick 2013/Guo 2014 MET: ‐3.13 (EBFT), ‐0.88 (CR), ‐5.51 (MET); Carmona 2014/Slesnick 2015 CM; Carmona 2014/Slesnick 2015 CRA; Carmona 2014/Slesnick 2015 HIV; Carmona 2014/Slesnick 2015 MET: ‐0.76 (CRA), ‐4.14 (CM), ‐4.87 (MET). 12 months: Slesnick 2005: ‐4.64 (intervention), ‐8.43 (control). Slesnick 2013/Guo 2014 CRA; Slesnick 2013/Guo 2014 EBFT; Slesnick 2013/Guo 2014 MET: ‐4.87 (EBFT), ‐5.72 (CM), ‐8.88 (MET); Carmona 2014/Slesnick 2015 CM; Carmona 2014/Slesnick 2015 CRA; Carmona 2014/Slesnick 2015 HIV; Carmona 2014/Slesnick 2015 MET: ‐0.85 (CRA), ‐3 (CM), ‐0.33 (MET).
The figures indicate a reduction in internalising problems in all intervention and control groups at most time points. The largest reduction appeared to be in the intervention group in Slesnick 2007/08 and 'control' intervention (MET) in Slesnick 2013/Guo 2014 CRA; Slesnick 2013/Guo 2014 EBFT; Slesnick 2013/Guo 2014 MET.
In Cauce 1994, the change scores for 'Withdrawn' were: 0.3 (intervention), 0.0 (control). For 'Somatic complaints', the change scores were: ‐0.8 (intervention), ‐1 (control). The changes appear marginal.
Change scores for carer‐reported internalising problems (CBCL) in Slesnick 2013/Guo 2014 CRA; Slesnick 2013/Guo 2014 EBFT; Slesnick 2013/Guo 2014 MET were: 3 months: ‐1.32 (EBFT), ‐1.72 (CRA), ‐1.44 (MET). 6 months: ‐2.81 (EBFT), ‐1.64 (CRA), ‐2.78 (MET). 12 months: ‐3.55 (EBFT), ‐3.26 (CRA), ‐2.8 (MET). 24 months: ‐7.07 (EBFT), ‐4.02 (CRA), ‐6.21 (MET). There appear to be reductions across all groups and the largest reductions appear to occur at the longest time point.
Longer term change scores. Internalising problems: Slesnick 2009: 15 months: ‐6.09 (EBFT intervention), ‐5.96 (FFT intervention), ‐5.5 (control). Slesnick 2013/Guo 2014 CRA; Slesnick 2013/Guo 2014 EBFT; Slesnick 2013/Guo 2014 MET: 24 months: ‐6.01 (EBFT), ‐5.83 (CRA), ‐7.74 (MET). There appear to be reductions in all groups,
14.b Externalising problems (at 3, 6 & 12 months)
Change scores: 3 months: Cauce 1994 2.9 (intervention), 0.6 (control); Slesnick 2005: 2.31 (intervention), 6.11 (control); Slesnick 2009: 4.78 (EBFT intervention), 6.38 (FFT intervention), 6.43 (control). Slesnick 2013/Guo 2014 CRA; Slesnick 2013/Guo 2014 EBFT; Slesnick 2013/Guo 2014 MET: ‐3.6 (EBFT), ‐5.29 (CRA), ‐2.73 (MET); Carmona 2014/Slesnick 2015 CM; Carmona 2014/Slesnick 2015 CRA; Carmona 2014/Slesnick 2015 HIV; Carmona 2014/Slesnick 2015 MET: ‐0.3 (CRA), ‐2.63 (CM), 0.4 (MET). 6 months: Slesnick 2005: 4.35 (intervention), 6.62 (control); Slesnick 2007/08: 5.09 (intervention), 4.26 (control); Slesnick 2013/Guo 2014 CRA; Slesnick 2013/Guo 2014 EBFT; Slesnick 2013/Guo 2014 MET: ‐6.56 (EBFT), ‐4.96 (CRA), ‐4.71 (MET); Carmona 2014/Slesnick 2015 CM; Carmona 2014/Slesnick 2015 CRA; Carmona 2014/Slesnick 2015 HIV; Carmona 2014/Slesnick 2015 MET: ‐0.78 (CRA), ‐3.19 (CM), ‐3.06 (MET). 12 months: Slesnick 2005: ‐7.6 (intervention), ‐9.23 (control).Slesnick 2013/Guo 2014 CRA; Slesnick 2013/Guo 2014 EBFT; Slesnick 2013/Guo 2014 MET‐7.09 (EBFT), ‐9.39 (CRA), ‐8.41 (MET); Carmona 2014/Slesnick 2015 CM; Carmona 2014/Slesnick 2015 CRA; Carmona 2014/Slesnick 2015 HIV; Carmona 2014/Slesnick 2015 MET: ‐1.37 (CR), ‐2.96 (CM), 1.83 (MET),
The figures indicate a reduction in externalising problems in most intervention and control groups. In Slesnick 2005 and Slesnick 2009 EBFT, the reduction in externalising problems was larger in the control group.
Longer term change scores. Externalising problems: Slesnick 2009 EBFT; Slesnick 2009 FFT: 15 months: ‐10.52 (EBFT intervention), ‐11.11 (FFT intervention), ‐6.23 (control). Slesnick 2013/Guo 2014 CRA; Slesnick 2013/Guo 2014 EBFT; Slesnick 2013/Guo 2014 MET: 24 months: ‐7.69 (EBFT), ‐6.5 (CRA), ‐8.35 (MET).
In Cauce 1994, the change scores for attention problems were: ‐0.7 (intervention), 0.1 (control). For aggressivity, the change scores were: ‐1.5 (intervention), 0,2 (control). For problem behaviour, the change scores were: ‐0.2 (intervention), ‐0.3 (control).
Change scores for carer‐reported externalising problems (CBCL) in Slesnick 2013/Guo 2014 CRA; Slesnick 2013/Guo 2014 EBFT; Slesnick 2013/Guo 2014 MET were: 3 months: ‐3.4 (EBFT), ‐4.5 (CRA), ‐2.85 (MET). 6 months: ‐6.51 (EBFT), ‐3.9 (CRA), ‐6.34 (MET). 12 months: ‐7.49 (EBFT), ‐7.07 (CRA), ‐7.16 (MET). 24 months: ‐13.61 (EBFT), ‐9.52 (CRA), ‐10.63 (MET). There appear to be similar reductions across all groups, and as with CBCL internalising scores, the largest reductions appear to be at the longest timepoint.
14.c Number of psychiatric diagnoses (3 months)
Change scores: Slesnick 2005: ‐0.17 (intervention), ‐0.33 (control);Slesnick 2009 EBFT; Slesnick 2009 FFT: ‐0.52 (EBFT intervention), ‐0.39 (FFT intervention), 0.46 (control). The changes for this outcome measure were marginal, indicating that some psychiatric diagnoses may be stable over time and not responsive to interventions not specifically targeted at a clinically mentally ill population.
Longer term change scores. Slesnick 2005: 12 months: ‐0.63 (intervention), ‐1.04 (control). Slesnick 2009 EBFT; Slesnick 2009 FFT: 15 months: ‐1.0 (EBFT intervention), ‐0.85 (FFT intervention), ‐0.85 (control).
14.d Other psychological functioning measures
In Cauce 1994, change scores at 3 months for 'thought problems' were: ‐0.3 (intervention), 0.0 (control). Change scores for 'total problems' were: ‐3.2 (intervention), ‐1.2 (control). Change scores for 'quality of life' were: 0.2 (intervention), 0.0 (control).
Of these, the most change appears to be manifest in reductions in the scores in the 'total problems' category.
In Slesnick 2007/08, change scores at 6 months for CISS task scale ('task‐oriented coping') were: 2.41 (intervention), 1.57 (control); change scores for CISS emotion scale ('emotion‐oriented coping') were: ‐7.52 (intervention), ‐3.96 (control), and change scores for CISS avoidance scale ('avoidance‐oriented coping') were: ‐1.55 (intervention), ‐2.26 (control).
In Carmona 2014/Slesnick 2015 CM; Carmona 2014/Slesnick 2015 CRA; Carmona 2014/Slesnick 2015 HIV; Carmona 2014/Slesnick 2015 MET, change scores at 3 months for CISS task scale were: ‐0.89 (CRA), 0.89 (CM), 0.52 (MET); CISS emotion scale: ‐3.23 (CRA), 0,01 (CM), ‐1.15 (MET); CISS avoidance scale: 1.04 (CRA), 1.61 (CM), 1.8 (MET).
6 months: CISS task scale: ‐0.75 (CRA), ‐0.13 (CM), 1.52 (MET); CISS emotion scale: ‐3.9 (CRA), ‐4.34 (CM), ‐3.01 (MET); CISS avoidance scale: ‐1.39 (CRA), ‐0.98 (CM), 1.26 (MET)
12 months: CISS task scale:1.57 (CRA), 1.48 (CM), 2.87 (MET); CISS emotion scale: ‐1.08 (CRA), ‐2.57 (CM), ‐0.36 (MET); CISS avoidance scale: 1.95 (CRA), ‐0.28 (CM), 2.12 (MET)
The scores reported here appear to go in different directions, but the interpretation of the results is unclear since we have been unable to find further detail of the meaning of scores on this particular scale.
15. Family functioning
It should be noted that it is only one group of studies (Slesnick 2005 and Slesnick 2009 EBFT; Slesnick 2009 FFT) that included this category of outcomes. They are all measured on a self‐report measure for which limited information was available. The data for these outcomes is mixed, generally indicating improvements in all groups in both studies. We are unable to comment on the clinical significance of the changes.
15.a Family cohesion (3 months)
Change scores: Slesnick 2005: 0.95 (intervention), 0.32 (control); Slesnick 2009 EBFT; Slesnick 2009 FFT: 1.45 (EBFT intervention), 0.72 (FFT intervention), 0.38 (control).
Longer term change scores. Slesnick 2005: 12 months: 1.88 (intervention), 2.10 (control). Slesnick 2009 EBFT; Slesnick 2009 FFT: 15 months: 1.68 (EBFT intervention), 1.28 (FFT intervention), 1.65 (control).
At 3 months, family cohesion appears to have improved the most in the intervention groups in both studies, particularly in Slesnick 2009 EBFT. At 12 months, family cohesion appeared to have improved similarly in all groups, again in both studies.
15.b Family conflict (3 months)
Change scores: Slesnick 2005: ‐0.63 (intervention), ‐1.49 (control); Slesnick 2009 EBFT; Slesnick 2009 FFT : ‐0.82 (EBFT intervention), ‐1.65 (FFT intervention),‐ 0.5 (control).
Longer term change scores. Slesnick 2005: 12 months: ‐1.78 (intervention), ‐1.88 (control). Slesnick 2009 EBFT; Slesnick 2009 FFT: 15 months: ‐1.69 (EBFT intervention), ‐2.52 (FFT intervention), ‐1.3 (control).
At 3 months, family conflict appears to have reduced the most in the control group in Slesnick 2005, and the intervention group in Slesnick 2009 FFT. At 12 months, change scores appear similar for all groups, but with a greater reduction in Slesnick 2009 FFT.
15.c Parental care (3 months)
Change scores: Slesnick 2005: 3.39 (intervention), 2.93 (control); Slesnick 2009 EBFT; Slesnick 2009 FFT : 1.65 (EBFT intervention), 4.0 (FFT intervention), 1.0 (control).
Longer term change scores. Slesnick 2005: 12 months: 4.88 (intervention), 5.62 (control). Slesnick 2009 EBFT; Slesnick 2009 FFT: 15 months: 2.48 (EBFT intervention), 4.66 (FFT intervention), 2 (control).
Parental care appears to have increased in all groups, especially in Slesnick 2005, while the greatest differential impact appears to be for Slesnick 2009 FFT.
15.d Parental overprotectiveness (3 months)
Change scores: Slesnick 2005: ‐1.52 (intervention), ‐1.85 (control); Slesnick 2009 EBFT; Slesnick 2009 FFT: ‐4.35 (EBFT intervention), ‐3.14 (FFT intervention), 0.54 (control).
Longer term change scores. Slesnick 2005: 12 months: ‐4.37 (intervention), ‐4.91 (control). Slesnick 2009 EBFT; Slesnick 2009 FFT: 15 months: ‐5.26 (EBFT intervention), ‐2.5 (FFT intervention), ‐2.5 (control).
At 3 months, the figures suggest a similar trend in all groups, apart from the control group in Slesnick 2005. This was the only instance where parental overprotectiveness appears to have slightly increased. At 12 months, there was a reduction in all groups, especially both groups in Slesnick 2005, and in Slesnick 2009 EBFT.
Appendix 3. Outcome items not included in meta‐analyses
Outcome items not included in meta‐analysis were (for each study):
Baer 2007 (3 months): Number of days of abstinence (in last 30 days); number of visits at drop‐in centre (last 30 days); number of visits to additional services (last 30 days, agency reported), and number of visits to other services (last 30 days, youth reported).
Cauce 1994 (3 months): Withdrawn; Somatic complaints; Anxious/ depressed; Social problems; Thought problems; Attention problems; Aggressive; Total problems; Problem behaviour, and Quality of life.
Carmona 2014/Slesnick 2015 CM; Carmona 2014/Slesnick 2015 CRA; Carmona 2014/Slesnick 2015 HIV; Carmona 2014/Slesnick 2015 MET (3, 6 and 12 months): Average SEC (standard ethanol content); coping styles (CISS); Percentage of homeless days; Victimization experience; HIV‐related outcomes.
Hyun 2005 (8 weeks): Self‐efficacy.
Milburn 2012 (3, 6 & 12 months): Had sex (past 3 months); Had unprotected sex (past 3 months); Used alcohol (past 3 months); Used marijuana; Used hard drugs (past 3 months), and Number of times used hard drugs (past 3 months).
Nyamathi 2012/13 AM; Nyamathi 2012/13 HPP (6 months): Drug and alcohol use; Depressive symptoms; Psychological emotional well‐being; HIV/AIDS knowledge; Hepatitis B and C knowledge.
We have summarised these data narratively, as reported by the authors.
Peterson 2006 (1 & 3 months): Number of days of binge drinking; Number of standard drink units (last 30 days), and Drug use consequences.
Rew 2007 (T1, T2, T3; up to 6 weeks): AIDS/STD knowledge; Future time perspective; Condom self‐efficacy; Self‐efficacy to perform breast/ testicular self‐examination; Assertive communication; Help‐seeking for STDs; Safe sex practices, and Risky sexual behaviour.
For these, we report p‐values as calculated by the authors. The data refer to T1‐T2, T2‐T3, and/ or T1‐T3.
Rotheram‐Borus 2003 (3, 6, 12, 18, 24 months): Number of sexual partners; Number of unprotected sex acts; Abstinence from vaginal/ anal sexual acts; Used alcohol; Used marijuana, and Number of drugs used.
For these, we report odds ratios, p‐values and confidence intervals, as calculated by the authors.
Slesnick 2005 (3, 6 & 12 months): Percentage days used tobacco; Percentage days used marijuana; Percentage days used cocaine; Percentage days used opiates; HIV knowledge and High‐risk behaviours.
Slesnick 2007/08 (3 and/ or 6 months): Percentage days of drug/ alcohol use; High‐risk behaviours, Coping styles (CISS); Social stability; HIV risk behaviour (total); Number of people shared needles to inject drugs; Number of people having sexual intercourse with; Condom use frequency (self/ partner); HIV knowledge; Injected drug use; Shared needles to inject any drugs; Engaged in casual sex; Had sex with more than one partner within 24h; Had sex with high‐risk sex partners; Engaged in anal sex; Engaged in survival sex; and Condom attitude scale total score
Slesnick 2013/Guo 2014 CRA; Slesnick 2013/Guo 2014 EBFT; Slesnick 2013/Guo 2014 MET (3, 6, 9, 12, 18 and 24 months): Parent‐reported CBCL internalising and externalising problems scores.
Appendix 4. Table of scales information
| Scale | Classification | Scoring | Interpretation | Source | ||||
| YSR (Youth Self‐Report from CBCL, Child Behaviour Checklist)
| On the YSR activities and social scale |
| T scores of 31 – 35 (3rd to 7th percentiles) are considered to be in the border line range T scores below 31 (<3rd percentile) are in the clinical range | Watson T. S & Skinner C. H. (2004) Encyclopaedia of School Psychology. Kluwer Academic/ Plunem Publishers New York
| ||||
| On YSR total competence |
| T scores of 37 to 40 (10th – 16th percentiles) are in the borderline range T scores below 37th (<10th percentiles) are in the clinical range | ||||||
| YSR syndrome and DSM oriented
|
| T scores of 65 – 69 (93rd to 97th percentiles) are in the borderline range T scores above 69(>97th percentiles) are in the clinical range | ||||||
| For total problems internalising and externalising
|
| T scores of 60 – 63 (84th – 90th percentiles) are in the borderline T scores above 63 (>90th percentiles) are in the clinical range | ||||||
| Form 90, Project Match (percent days of use)
| Blood alcohol concentration (BAC)
| 0‐60mg% ‐ low tolerance 61‐ 120mg%‐ medium tolerance 120‐ 180mg% ‐ High tolerance 181mg% + ‐ very high tolerance | Higher scores on these scales are associated with greater risk and severity of alcohol related problems. The higher the projected BAC the higher the individual’s tolerance | Motivational therapy manual; a Clinical Research Guide for Therapists Treating Individuals with Alcohol Abuse and Dependence. US Department of Health and Human Services | ||||
|
| Other drug risks
| Any use of cocaine or crack Or any use of heroine, methadone or other opiates Or frequent use (more than 3 months of at least once per week) of any other drug class except tobacco: Marijuana, hash, THC; Amphetamines, stimulants, diet pills; Tranquillizers, Barbiturates
| HIGH RISK
|
| ||||
|
| Any lifetime non prescription use, but not frequent use (i.e. 3 months or less weekly use) of any drug class except tobacco, opiates or cocaine: Marijuana, hash, THC; Amphetamines, stimulants, diet pills; Tranquillizers, Barbiturates
| MEDIUM RISK
| ||||||
|
| No use of other drugs (code= 0 for all 10 drug classes except tobacco)
| LOW RISK
| ||||||
| Conflict Tactic Scale
| Prevalence
Frequency:
Severity and mutuality
| Indication of one or more of the acts in the scale have been committed
No of times the act has occurred
None, minor or severe Severity of violence is also measured by the frequency of the acts and by whether an injury results
| Because even one instance of physical assault is a behaviour that calls for remedial steps, a basic clinical assessment indicates whether there is a score of 1 or higher on the physical assault scale
| Straus, Murray A. 2007. "Conflict Tactics Scales." Pp. 190 ‐ 197 in Encyclopedia of Domestic Violence, N. A. Jackson. New York: outledge: Taylor & Francis Group.
| ||||
| Family Environment Scale
| 1. Family members really help and support one another. 2. We often seem to be killing time at home. 3. We put a lot of energy into what we do at home. 4. There is a feeling of togetherness in our family. 5. We rarely volunteer when something has to be done at home. 6. Family members really back each other up. 7. There is little group spirit in our family. 8. We really get along well with each other. 9. There is plenty of time and attention for everyone in our family.
| 0=Mostly True and 1= Mostly False | · Reverse coding is necessary. Items 1, 3, 4, 6, 8, and 9 are reverse coded. · Responses are summed to create a total score. A higher score indicates a more cohesive family environment.
| Moos, R., & Moos, B. (2009). Family Environment Scale Manual and Sampler Set: Development, Applications and Research (Fourth Edition). Palo Alto, CA: Mind Garden, Inc. | ||||
| Parental Bonding Instrument
| Care Items: 1, 5, 6, 11, 12, 17:
Items: 2, 4, 14, 16, 18, 24
Overprotection Items: 8, 9, 10, 13, 19, 20, 23
Items: 3, 7, 15, 21, 22, 25 | Very like = 3 Moderately like = 2 Moderately unlike = 1 Very unlike = 0
Very unlike = 3 Moderately unlike = 2 Moderately like = 1 Very like = 0
Very like = 3 Moderately like = 2 Moderately unlike = 1 Very unlike = 0
Very unlike = 3 Moderately unlike = 2 Moderately like = 1 Very like = 0 | Assignment to “high” or “low” categories is based on the following cut‐off scores:
For mothers, a care score of 27.0 and a protection score of 13.5. For fathers, a care score of 24.0 and a protection score of 12.5.
| Gordon Parker, Hilary Tupling And L.B. Brown, Parental Bonding Instrument (PBI) Black Dog Institute
| ||||
|
| In addition to generating care and protection scores for each scale, parents can be effectively “assigned” to one of four quadrants: | |||||||
|
| affectionate constraint |
| = high care and high protection |
| ||||
| optimal parenting” | = high care and low protection | |||||||
| affectionless control | = high protection and low care | |||||||
| neglectful parenting | = low care and low protection | |||||||
| BDI (Beck Depression Index)
| depression's severity | · 0–9: indicates minimal depression · 10–18: indicates mild depression · 19–29: indicates moderate depression · 30–63: indicates severe depression | Higher total scores indicate more severe depressive symptoms | Wikipedia, the free encyclopaedia | ||||
| Health Risk Questionnaire
| Health risks | High risk criteria
|
|
|
| |||
| Alcohol | > 14 drinks/week | |||||||
| Blood pressure | Systolic > 139 and/or Diastolic > 89 mm Hg
| |||||||
| Body weight | BMI ≥ 27.5 | |||||||
| Cholesterol | Total cholesterol > 239 mg/dl
| |||||||
| Existing medical problem | Heart Disease, Cancer, Diabetes, Stroke, Chronic Bronchitis/Emphysema | |||||||
| HDL cholesterol | < 35 mg/dl
| |||||||
| Absent days from regular activity due to illness | > 5 days during the past year
| |||||||
| Life Satisfaction | Partly satisfied or not satisfied | |||||||
| Job Satisfaction | Disagree or disagree strongly | |||||||
| Perception of Health | Fair or poor
| |||||||
| Physical Activity | < once a week | |||||||
| Safety Belt Usage | Using safety belt < 100% of time | |||||||
| Smoking | Current smoker | |||||||
| Stress | High (stress scale score > 18)
| |||||||
| Health Age Index | Appraised Health Age – Achievable Age > 4 | |||||||
|
| Drug Use (for relaxation) | almost every day or sometimes |
| Low Risk = 0 to 2 risk factors present
Medium Risk = 3 to 4 risk factors present High Risk = 5 or more risk factors present | David M. Ferriss, 2008. Health Risk Assessment (HRA) and Trend Management System™ (TMS). University of Michigan | |||
| POSIT |
Substance use/ abuse (17) |
0‐17 | Low risk | Middle risk | High risk | Lange, J. & Marques, P., Problem Oriented Screening Instrument for Teenagers. National Institute on Drug Abuse National Institutes of Health | ||
| 0 | 1‐6 | 7‐17 | ||||||
|
| Physical Health (10) | 0‐10 | 0‐1 | 2‐3 | 4‐10 | |||
| Mental Health (22) | 0‐22 | 0‐4 | 5‐10 | 11‐22 | ||||
| Family Relationships (11 items) | 0‐11 | 0‐1 | 2‐4 | 5‐11 | ||||
| Peer Relationships (10) | 0‐10 | 0‐1 | 2‐5 | 6‐10 | ||||
| Educational Status (26) | 0‐26 | 0‐5 | 6‐10 | 12‐26 | ||||
| Vocational Status (18) | 0‐18 | 0‐3 | 4 | 5‐18 | ||||
| Social Skills (11) | 0‐11 | 0‐2 | 3‐4 | 5‐11 | ||||
| Leisure Recreation (12) | 0‐12 | 0‐3 | 4‐5 | 6‐12 | ||||
| Aggressive Behaviour/ Delinquency (16) | 0‐16 | 0‐2 | 3‐9 | 10‐16 | ||||
| PBS (Problem Behaviour Scale)
| Never | 1 | Point values are summed for each subscale. High scores indicate higher levels of aggressive behaviour/ delinquency | Jessor, R., & Jessor, S.L. (1977). Problem behaviour and psychological development: a longitudinal study of youth. New York: Academic Press | ||||
| 1‐2 times | 2 | |||||||
| 3‐5 times | 3 | |||||||
| 6‐9 times | 4 | |||||||
| 10‐19 times | 5 | |||||||
| 6‐20 or more times | 6 | |||||||
| RSES (Rosenberg Self‐Esteem Scale)
| On the whole, I am satisfied with myself. | SA=3, A=2, D=1, SD=0 | The higher the score, the higher the self esteem | Rosenberg, M. (1965). Society and the adolescent self‐image. Princeton, NJ: Princeton University Press.
| ||||
| At times, I think I am no good at all. | ||||||||
| I feel that I have a number of good qualities. | ||||||||
| I am able to do things as well as most other people. | ||||||||
| I feel I do not have much to be proud of. | ||||||||
| I certainly feel useless at times. | ||||||||
| I feel that I’m a person of worth, at least on an equal plane with others. | ||||||||
| I wish I could have more respect for myself. | ||||||||
| All in all, I am inclined to feel that I am a failure. | ||||||||
| I take a positive attitude toward myself. | ||||||||
| LDS (Life Domains Scale)
|
| 30 – 35 Very high score; highly satisfied | Respondents who score in this range love their lives and feel that things are going very well. Their lives are not perfect, but they feel that things are about as good as lives get. | Ed Diener, Robert A. Emmons, Randy J. Larsen and Sharon Griffin as noted in the 1985 article in the Journal of Personality Assessment. | ||||
|
| 25‐ 29 High score | Individuals who score in this range like their lives and feel that things are going well. Of course their lives are not perfect, but they feel that things are mostly good. | ||||||
|
| 20 – 24 Average score | The average of life satisfaction in economically developed nations is in this range – the majority of people are generally satisfied, but have some areas where they very much would like some improvement | ||||||
|
| 15 – 19 Slightly below average in life satisfaction | People who score in this range usually have small but significant problems in several areas of their lives, or have many areas that are doing fine but one area that represents a substantial problem for them. If a person has moved temporarily into this level of life satisfaction from a higher level because of some recent event, things will usually improve over time and satisfaction will generally move back up.
| ||||||
|
| 10 – 14 Dissatisfied | People who score in this range are substantially dissatisfied with their lives. People in this range may have a number of domains that are not going well, or one or two domains that are going very badly | ||||||
|
|
| 5 – 9 Extremely Dissatisfied | Individuals who score in this range are usually extremely unhappy with their current life. In some cases this is in reaction to some recent bad event such as widowhood or unemployment. In other cases, it is a response to a chronic problem such as alcoholism or addiction.
| |||||
|
| (Note: If we divide by the number of questions, rather than use the summed aggregate score, then the cut offs below instead should be: 6‐7 5‐6 4‐5 3‐4 2‐3 1‐2
| *To understand life satisfaction scores, it is helpful to understand some of the components that go into most people’s experience of satisfaction. One of the most important influences on happiness is social relationships. People who score high on life satisfaction tend to have close and supportive family and friends, whereas those who do not have close friends and family are more likely to be dissatisfied | ||||||
| PESQ (Personal Experience Screening Questionnaire) | Drug use problem severity (18 items) | mean score is calculated by summing up all items related to problem severity | Higher mean scores are indicative of higher chemical dependence A score in the low risk category indicates no problems with alcohol or drug use, while a score in the high risk category (1½ SD above the mean of a general school sample) suggest the need for a comprehensive chemical dependence.
|
| ||||
|
| Psychosocial problem (8 items)
|
| PESQ includes questions considered to be indicators of stress. Items reflect emotional distress (e.g. worry a lot about things for no reason), though problems (e.g. bothered by unusual thoughts) and abuse (physical and sexual abuse) |
| ||||
|
| Drug use frequency and onset (6 items)
|
|
|
| ||||
|
| Faking tendencies (8 items) | PESQ incorporates two validity scales which measure response distortion, specifically tendencies to fake good ( defensiveness) or “fake bad’’ (infrequency) | High scores on these scales generally indicate a questionable profile and suggest the need for caution in interpreting the participant’s responses – particularly those related to problem severity. | Winters, K. C. (1992). Development of an adolescent alcohol and other drug abuse screening scale: Personal Experience Screening Questionnaire. Addictive Behaviours, 17, 479–490
| ||||
| TLFB number of days (in last 30 days, Sobell & Sobell) | Quantitative estimations of daily alcohol consumption. | TLFB provides a variety of variables and different estimations of individual consumption levels. | The TLFB involves asking clients to retrospectively estimate their daily alcohol consumption over a time period ranging from 7 days to 24 months prior to the interview. The TLFB can generate variables to portray pattern, variability, and level of drinking |
| ||||
| FTP inventory (Heimberg 1968; not published) | 25 items on which participants respond on 1 (completely disagree) to 7 (completely agree) | The composite score is a measure of the strength of an individual’s cognitive‐motivational future time orientation | A higher score indicates a greater future orientation
| Future Orientation of Adolescents in Foster Care: Relationship to Trauma, Mental Health, and HIV Risk Behaviors. Peter Cabrera a; Wendy Auslander a; Michael Polgar a Washington University in St. Louis, Online publication date: 17 November 2009 | ||||
| Self‐Esteem Inventory (Coopersmith)
| Like me: Items 2, 4, 5, 10, 11, 14, 18, 19, 21, 23, 24, 28, 29, 32, 36, 45, 47, 55, 57
| Men | Women | To calculate the score, the number of times responses match those in the classification column is added up. To determine how the level of self‐esteem compares to that of others, find the value closest to the score in the appropriate column of the table below | Ryden, M. B. 1978. An adult version of the Coopersmith Self‐Esteem Inventory: Test‐retest reliability and social desirability. Psychological Reports 43:1189–1190. Copyright © 1978 Muriel | |||
| 33 | 32 | significantly below average
| ||||||
| 36 | 35 | somewhat below average | ||||||
| Unlike me: Items 3, 7, 8, 9, 12, 15, 16, 17, 22, 25, 26, 30, 31, 33, 35, 37, 38, 39, 40, 42, 43, 44, 46, 49, 50, 51, 52, 53, 54, 56, 58 | 40 | 39 | Average
| |||||
| 44 | 43 | somewhat above average | ||||||
| 47 | 46 | significantly above average | ||||||
| Self‐Esteem Inventory (Coopersmith) Children’s version | 25 items relating to three areas, to be answered on a yes/no scale: 1. Global self‐esteem: “I can make up my mind without too much trouble,” and “I often wish I were someone else”; 2. Relations with parents, “My parents usually consider my feelings,” and “My parents expect too much of me”; 3. Relations with peers, “I’m popular with kids [of] my own age,” and “Most people are better liked than I am.” | Self‐esteem scores are calculated from the aggregating item scores | higher scores indicate greater self‐esteem | Peter R. Hills, Leslie J. Francis and Penelope Jennings (2011) The School Short‐Form Coopersmith Self‐Esteem Inventory: Revised and Improved.Canadian Journal of School Psychology 2011 26: 62, DOI: 10.1177/0829573510397127 | ||||
| SEUCS (Self‐Efficacy to Use Condom Scale)
| The SEUCS contains 17 items scored using a Likert scale that rates the degree to which respondents agree with statements that assess an individual's ability to correctly use a condom | Strongly disagree = 0 Disagree = 1 Undecided = 2 Agree = 3 Strongly agree = 4 After reversing for negatively worded items, scores are summed. | The possible range of scores is 0–112, with higher scores indicating greater condom use self‐efficacy | Brafford, L. J. and Beck, K. H. (1991) Development and validation of a condom self‐efficacy scale for college students. Journal of American College Health, 39, 219–225.
| ||||
| 45‐Minute interview protocol (Gruen et al) | The interview protocol is developed for the study. Gruen et al (1989) described a programme designed to optimise rapport between interviewer and subject and to minimize specific biases in this value‐laden and emotionally charged area of assessment
|
|
| Gruen RS, Calderwood M, Meyer‐Bahlburg HF, Ehrhardt AA; HIV Center for Clinical and Behavioral Studies, NY, A Psychosexual assessment in AIDS research: interviewer selection, training, and monitoring. Int Conf AIDS 1989 Jun 4‐9; 5:739 (abstract no. T.D.P.73)
| ||||
| RADS (Reynolds Adolescent Depression Scale)
| 30 items on the RADS weighted from 1 to 4 | 1= almost never 2= hardly ever 3 = sometimes 4= most of the time
| There is a total score range of 30 to 120 and higher scores indicate depression symptoms. A level of 77 or above indicates that clinically significant depression may be present. It is recommended that those who reach critical level in at least four of the six items that discriminate between depressed and non‐depressed adolescents should be viewed as needing professional assessment regardless of their overall score
| Milfont, T L, Merry, S., Robinson, E., Denny, S., Crengle, S., Ameratunga, S,. 2008 Evaluation the short Term of the Reynolds Adolescent Depression Scale in New Zealand Adolescents. Australian and New Zealand Journal of Psychiatry; 42:950‐ 954
| ||||
| Sexual Self‐Care Behaviours Scale (SSCBS)
|
| 1 = Never 2 = Sometimes 3 = Most of the Time 4 = Always
| Possible scores on the scale range from 12 to 60, with a low score indicating good self‐care/ practice of safe sex.
| Gardner LH, Frank D, Amankwaa LI. 1998. A comparison of sexual behaviour and self‐esteem in young adult females with positive and negative tests for sexually transmitted diseases. Florida State University, School of Nursing, Tallahassee 32306‐4310, USA
| ||||
| ACS (Assertive Communication Scale)
| The ACS contains five items that measures the ability to be assertive with sexual partners concerning the use of a condom. | 5‐point Likert scale ranging from "definitely not", "in the middle" to "definitely yes | High scores indicate the ability to be more assertive with sexual partners concerning condom use (possible range of scores is 5 to 25). | Hanna, K.M. (1999). An adolescent and young adult condom self‐efficacy scale. Journal of Pediatricpediatric /pe·di·at·ric/ (pe?de‐at´rik) pertaining to the health of children. pe·di·at·ric
| ||||
| Intention to Use Condoms Scale (Jemmott & Jemmott)
|
| 1 = not at all likely 2= not likely 3= undecided 4= likely 5 = extremely likely | Men scoring above the median were more likely to intend to use condoms in the next month.
| Harvey,S. M. andHenderson, J. T.2006. Correlates of Condom Use Intentions and Behaviours among a Community‐Based Sample of Latino Men in Los Angeles J Urban Health. 2006 July; 83(4): 558–574.
| ||||
| CISS (Coping Inventory for Stressful Situations)
| This scale has 48 items, Sixteen items load on three basic subscales:1. Task‐oriented, 2. Emotion‐oriented & 3. Avoidance‐oriented coping: ‐ Distraction (eight items) ‐ Social Diversion (five items).
| rated on a five‐point Likert scale, with end‐point designations ‘Not at all’ (1) and ‘Very much’ (5) Scores are summed across each of the subscales, including distraction and social diversion | The potential range of these scores on the Task, Emotion, and Avoidance scales is from 16 to 80. The possible range for the Distraction subscale is from 8 to 40; for Social Diversion the range is 5 to 25
Individuals who score high on Task Oriented Coping use behavioural or cognitive problem‐solving techniques when confronted with stress. Emotion Oriented Copers respond to stressful situations with emotional outbursts, self‐preoccupation, or fantasy. Avoidance Copers rely on social supports or distract themselves with other activities. Mean scores are calculated, and a higher score indicates a greater use of the coping style. | Resilience in response to life stress: the effects of coping style and cognitive hardiness Margaret Beasley, Ted Thompson*, John Davidson School of Psychology, University of Tasmania, GPO Box 252‐30, Hobart, 7001, Tasmania, Australia Received 1 June 2001; received in revised form 18 December 2001; accepted 21 January 2002
And (Coping Inventory for Stressful Situations, Norman Endler and James Parker) | ||||
| CAS (Condom Attitude Scale) | 187‐item questionnaire assessed demographic information, condom attitudes, intention to use condoms, perceived personal vulnerability to AIDS and STDs and past experiences (if any) with condoms | Intercourse‐ a scale ranging from never (1) to always (7) intention questions and condom attitude‐ scale ranging from strong disagreement (1) to strong agreement (7) all scores for negatively worded items were reversed | high scores reflect positive attitudes toward condoms or greater intention of future condom use | Helweg‐Larsen, Marie; Collins, Barry E. 1994 The UCLA Multidimensional Condom Attitudes Scale: Documenting the complex determinants of condom use in college students American Psychological Association and the Division of Health Psychology
| ||||
| CDISC (Computerized Diagnostic Interview Schedule for Children)
| 13 psychiatric disorders—Simple Phobia, Social Phobia, Agoraphobia, Panic Disorder, Avoidant Disorder, Generalized Anxiety Disorder, Obsessive‐Compulsive Disorder, Major Depressive Disorder, Mania, Psychotic Disorder, ADHD, Oppositional Defiant Disorder, and Conduct Disorder youth (98 items) parents (92 items) | No (0), Yes (1), Not Applicable (8), or Don't know (9). both Not applicable and Don't know responses are rescored as No's | The DISC generates symptoms counts and diagnoses Diagnosis variables are scored 1=meet diagnosis criteria, 0=does not meet the diagnosis criteria.
Diagnosis + impairment variables are scored 1=subject has disorder and it caused some type of impairment in his/her life. 0=either did not meet the criteria, or met the criteria but had no impairment to his/her life. Finally, a criterion (or symptom) count variable is created that indicates the number of diagnostic criteria a subject met for a given disorder.
|
Godwin, J. (2010). Young Adult Diagnostic Interview Schedule for Children: Youth (Technical Report) [On‐line]. Available: http://www.fasttrackproject.org/ | ||||
| Self‐Efficacy Scale (Sherer et al 1982)
| 17‐item scale (e.g. of items include: “When I make plans, I am certain I can make them work“, “I give up easily“, “I am a self‐reliant person“, “I avoid facing difficulties” | a 5‐point scale 1 = strongly disagree 2= Disagree, 3= Neither agree or disagree 4= Agree 5 = strongly agree | Sum of item scores reflects general self‐efficacy. The higher the total score is, the more self efficacious the respondent.
Sherer et al. developed the GSE scale to measure a general set of expectations that the individual carries into new situations | Sherer et al General Self‐Efficacy Scale: Dimensionality, Internal Consistency, And Temporal StabilityProceedings of the Redesigning Pedagogy: Culture, Knowledge and Understanding Conference, Singapore, May 2007
| ||||
| Rutgers Alcohol Problem Index (RAPI) | 23 items focus on negative consequences that the adolescents attribute to their substance, such as “kept drinking when you promised yourself not to. | a 5‐point Likert scale Never = 0 1‐2 times = 1 3‐5 times = 2 6‐10 times = 3 more than 10 times = 4 | High scores indicate greater difficulties with alcohol. A cut‐off score of 15 on the RAPI is used to classify the adolescents’ drinking status 15 > = heavy drinkers
15 ≤ = light drinkers and non drinkers
This cut‐off score has been recommended as a relatively conservative approach to identifying “high‐consequence” drinkers so as to reduce the number of false positives in a sample | Carla Kmett Danielson, James C Overholser, Zeeshan (2003) A Butt Association of Substance Abuse and Depression Among Adolescent Psychiatric Inpatients, Can J Psychiatry, Vol 48, No 11, December
| ||||
| National Youth Survey Delinquency Scale (NYSDS)
| 23 items assess adolescent criminal behaviour on five subscales: 1) Total Delinquency 2) General Theft 3) Crimes Against Persons, 4) Index Offenses 5) Drug Scales.
|
| The NYSDS shows the prevalence and incidence of delinquent behaviour | Elliott DS. Interview schedule, National Youth Survey. Boulder, CO: Behavioral Research Institute; 1983 | ||||

Intervention and context logic model.
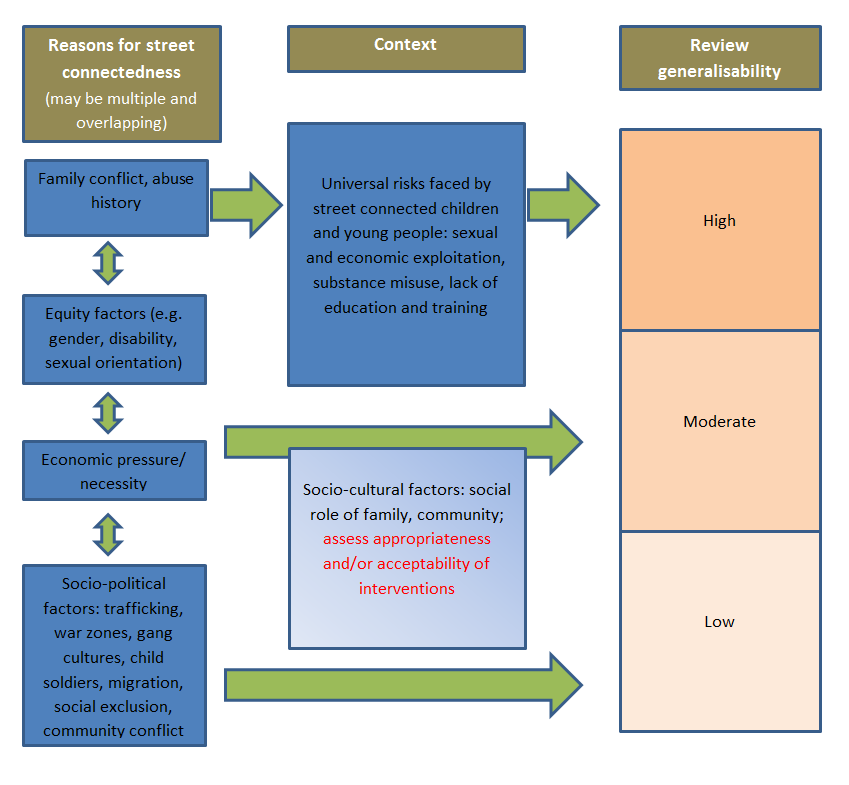
Generalisability logic model.

Study flow diagram.
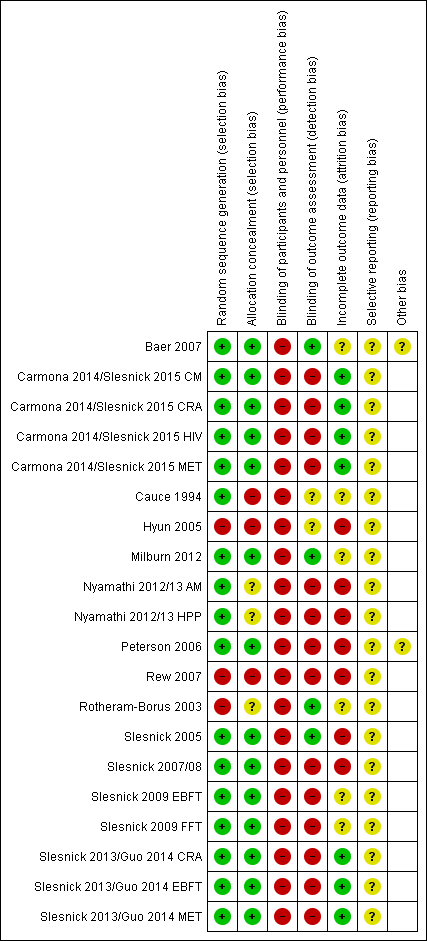
Risk of bias summary: review authors' judgements about each risk of bias item for each included study.

Risk of bias graph: review authors' judgements about each risk of bias item presented as percentages across all included studies.

Comparison 1 Safer or reduced sexual activity, Outcome 1 Number of times had sex ‐ 3 months.

Comparison 1 Safer or reduced sexual activity, Outcome 2 Number of times had sex ‐ 6 months.
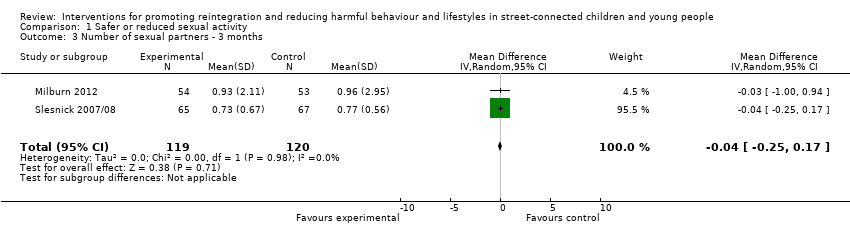
Comparison 1 Safer or reduced sexual activity, Outcome 3 Number of sexual partners ‐ 3 months.

Comparison 1 Safer or reduced sexual activity, Outcome 4 Number of sexual partners ‐ 6 months.
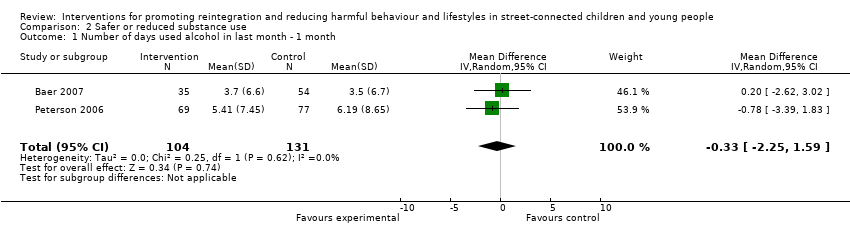
Comparison 2 Safer or reduced substance use, Outcome 1 Number of days used alcohol in last month ‐ 1 month.
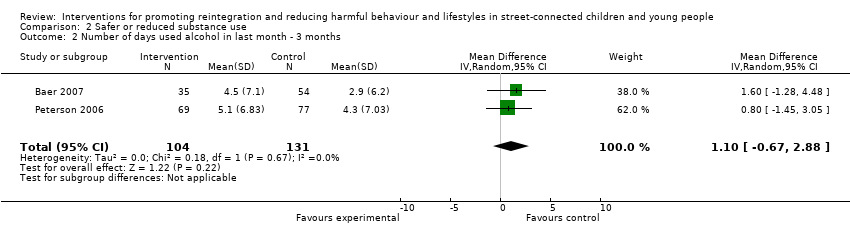
Comparison 2 Safer or reduced substance use, Outcome 2 Number of days used alcohol in last month ‐ 3 months.
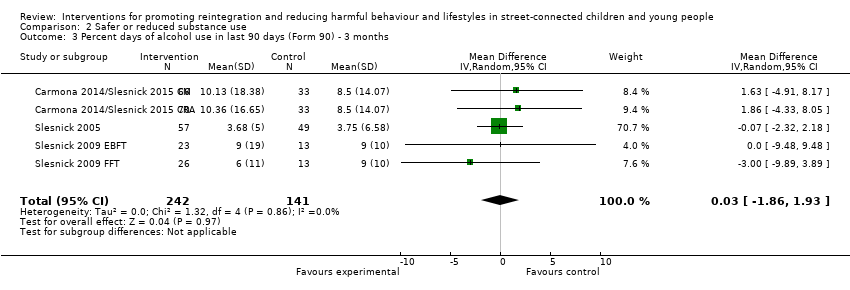
Comparison 2 Safer or reduced substance use, Outcome 3 Percent days of alcohol use in last 90 days (Form 90) ‐ 3 months.

Comparison 2 Safer or reduced substance use, Outcome 4 Percent days of alcohol use in last 90 days (Form 90) ‐ 6 months.
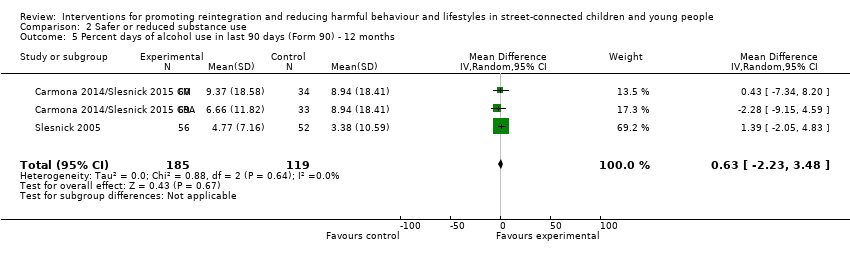
Comparison 2 Safer or reduced substance use, Outcome 5 Percent days of alcohol use in last 90 days (Form 90) ‐ 12 months.
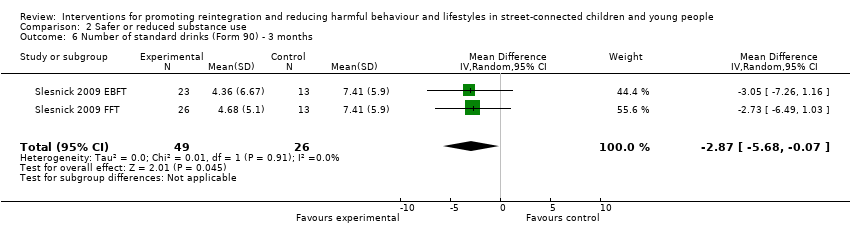
Comparison 2 Safer or reduced substance use, Outcome 6 Number of standard drinks (Form 90) ‐ 3 months.

Comparison 2 Safer or reduced substance use, Outcome 7 Adolescent Drinking Index ‐ 3 months.

Comparison 2 Safer or reduced substance use, Outcome 8 Percent days of alcohol/drug use (excl tobacco) (Form 90) ‐ 3 months.

Comparison 2 Safer or reduced substance use, Outcome 9 Percent days of alcohol/drug use (excl tobacco) (Form 90) ‐ 6 months.
Comparison 2 Safer or reduced substance use, Outcome 10 Percent days of alcohol/drug use (excl tobacco) (Form 90) ‐ 12 months.

Comparison 2 Safer or reduced substance use, Outcome 11 Percent days only/any drug use (Form 90) ‐ 3 months.
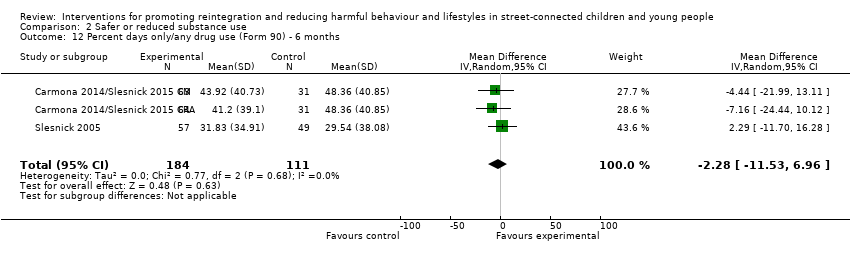
Comparison 2 Safer or reduced substance use, Outcome 12 Percent days only/any drug use (Form 90) ‐ 6 months.
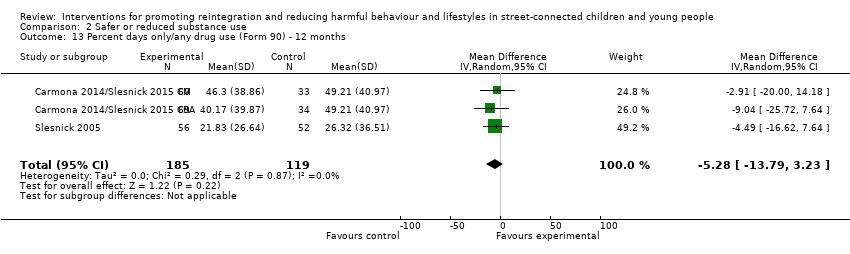
Comparison 2 Safer or reduced substance use, Outcome 13 Percent days only/any drug use (Form 90) ‐ 12 months.
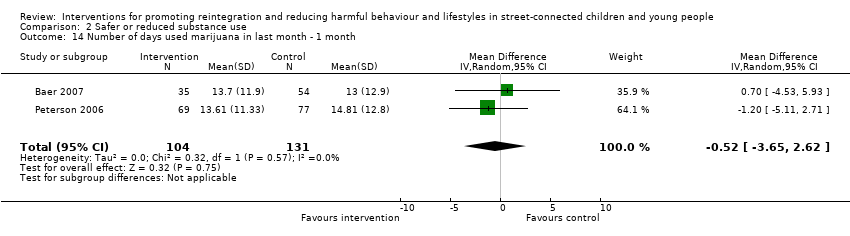
Comparison 2 Safer or reduced substance use, Outcome 14 Number of days used marijuana in last month ‐ 1 month.
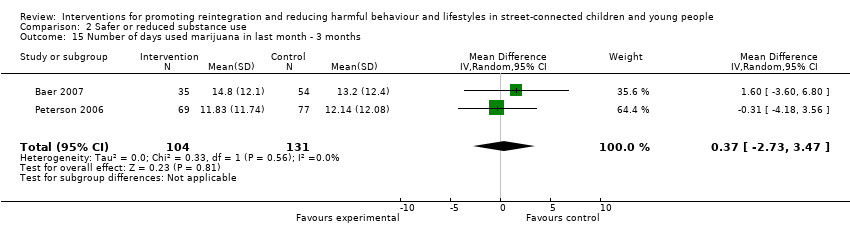
Comparison 2 Safer or reduced substance use, Outcome 15 Number of days used marijuana in last month ‐ 3 months.
Comparison 2 Safer or reduced substance use, Outcome 16 Number of days used other drugs in last month ‐ 1 month.

Comparison 2 Safer or reduced substance use, Outcome 17 Number of days used other drugs in last month ‐ 3 months.

Comparison 2 Safer or reduced substance use, Outcome 18 Number of problem consequences ‐ 3 months.

Comparison 2 Safer or reduced substance use, Outcome 19 Number of problem consequences ‐ 6 months.

Comparison 2 Safer or reduced substance use, Outcome 20 Number of substance use diagnoses (CDISC) ‐ 3 months.

Comparison 2 Safer or reduced substance use, Outcome 21 Number of categories of drug use (Form 90) ‐ 6 months.

Comparison 3 Self esteem, Outcome 1 Self esteem at endpoint.

Comparison 4 Depression, Outcome 1 Depression at 3 months.

Comparison 4 Depression, Outcome 2 Depression at 6 months.

Comparison 4 Depression, Outcome 3 Depression at 12 months.

Comparison 5 Reduced use of violence, Outcome 1 Verbal aggression (Conflict Tactic Scale) ‐ 3 months.
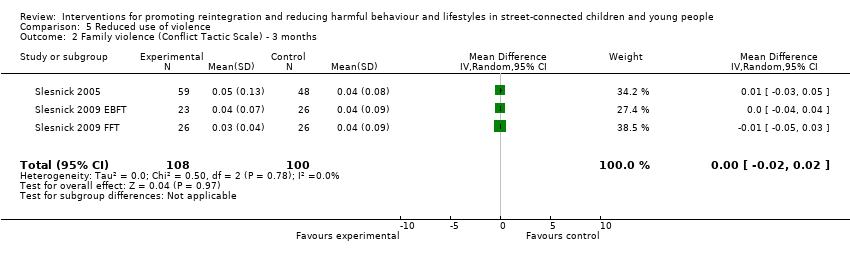
Comparison 5 Reduced use of violence, Outcome 2 Family violence (Conflict Tactic Scale) ‐ 3 months.
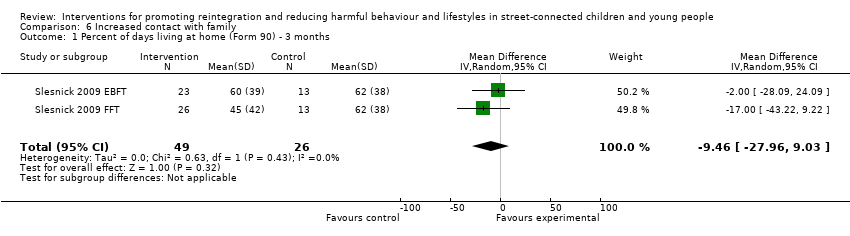
Comparison 6 Increased contact with family, Outcome 1 Percent of days living at home (Form 90) ‐ 3 months.

Comparison 7 Social functioning, Outcome 1 Delinquent behaviours at 3 months.
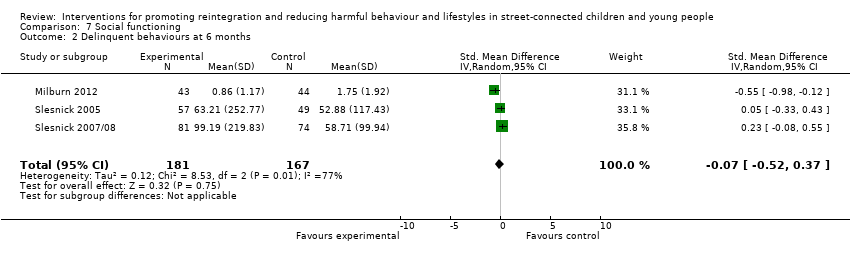
Comparison 7 Social functioning, Outcome 2 Delinquent behaviours at 6 months.
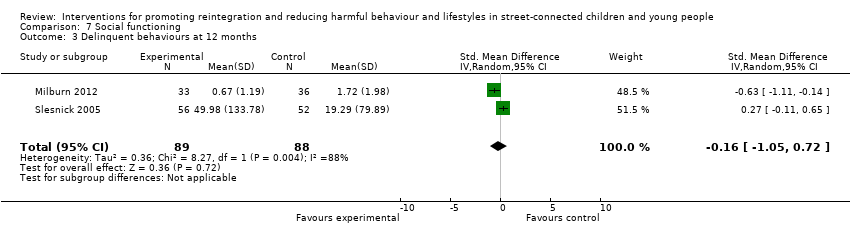
Comparison 7 Social functioning, Outcome 3 Delinquent behaviours at 12 months.

Comparison 8 Psychological functioning, Outcome 1 Internalising behaviours at 3 months.
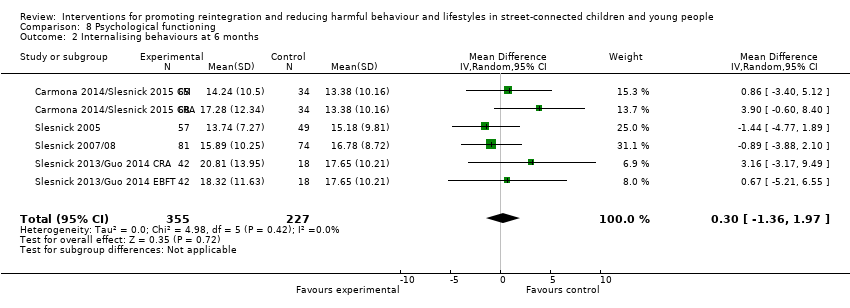
Comparison 8 Psychological functioning, Outcome 2 Internalising behaviours at 6 months.

Comparison 8 Psychological functioning, Outcome 3 Internalising behaviours at 12 months.
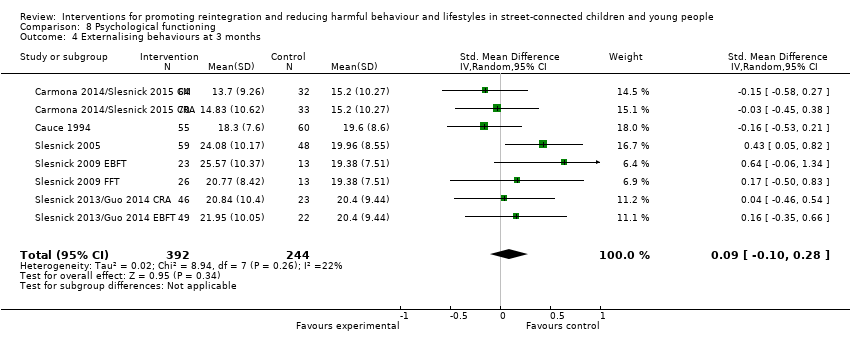
Comparison 8 Psychological functioning, Outcome 4 Externalising behaviours at 3 months.

Comparison 8 Psychological functioning, Outcome 5 Externalising behaviours at 6 months.

Comparison 8 Psychological functioning, Outcome 6 Externalising behaviours at 12 months.

Comparison 8 Psychological functioning, Outcome 7 Number of psychiatric diagnoses.
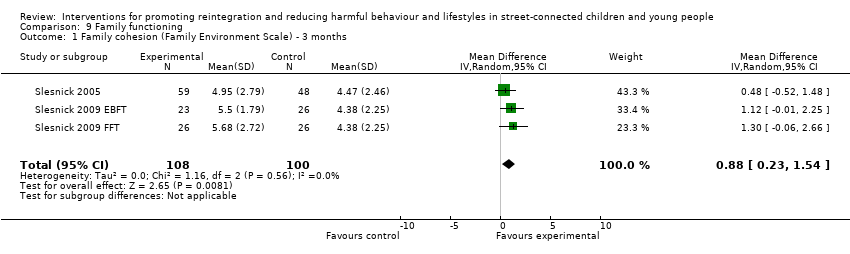
Comparison 9 Family functioning, Outcome 1 Family cohesion (Family Environment Scale) ‐ 3 months.

Comparison 9 Family functioning, Outcome 2 Family conflict (Family Environment Scale) ‐ 3 months.
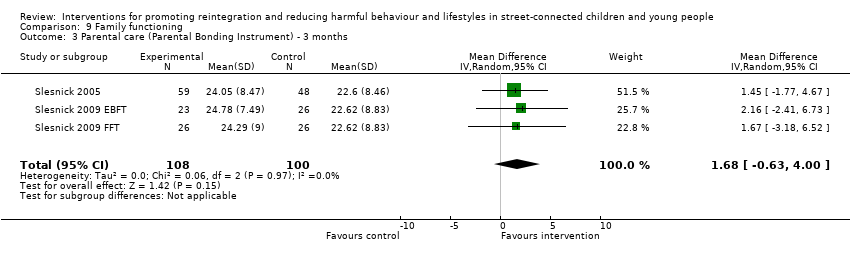
Comparison 9 Family functioning, Outcome 3 Parental care (Parental Bonding Instrument) ‐ 3 months.

Comparison 9 Family functioning, Outcome 4 Parental overprotection (Parental Bonding Instrument) ‐ 3 months.
| Therapeutic intervention compared with service as usual for street‐connected children and young people | |||
| Patient or population: street‐connected children and young people Settings: shelters and drop‐in centres Intervention: various specific therapeutic types of interventions Comparison: shelter/drop‐in service as usual | |||
| Outcome categories (summarised) | Impact | Number of | Quality of the evidence |
| Primary outcome ‐ reintegration
| Reintegration was not measured in any of the studies. Similarly, access to literacy, numeracy, education and employment were not measured in any of the studies that met the criteria for inclusion. However, social stability was measured in 1 study and delinquent behaviours in 4 studies. Social stability outcomes measured in 1 study showed benefit for the intervention group. Delinquent behaviour results were mixed across studies; investigators used different types and constructs of measurement, so findings cannot be summarised | 1 4 | Moderatea |
| Promotion of mental health, including self esteem | Outcomes included in this category included depression, internalising and externalising behaviours, self esteem and psychiatric diagnoses measured on various scales. None of these measures showed overall differences between intervention and control groups, and change score calculations demonstrated that for the most part, both groups improved from baseline. These results indicate that for mental health promotion outcomes, the therapeutic intervention did not obtain significantly better outcomes than the service as usual/control condition in the studies included in this review | 8 | Moderatea |
| Reduction in harms associated with substance misuse | Substance misuse was measured in a wide variety of ways and includes alcohol misuse and different categories of non‐prescription drugs, as well as a scale measuring 'problem consequences'. The overall picture emerging form the included studies on these outcomes is unclear, possibly because of the array of measurement types and tools that measure subtly different constructs and differing time windows that were impossible to combine statistically. Results are mixed across studies, with some showing marginal or no differences between groups, and others showing clear benefit for intervention or control. Improvements in some substance misuse measures were noted in all 3 family intervention studies | 8 | Moderatea |
| Reduction in harms associated with early sexual activity | Sexually risky behaviour was similarly measured in different ways, including numbers of partners, numbers of times had sex, HIV knowledge, unprotected sex, condom use and rates of abstinence. Again, the picture across studies is mixed. Some studies showed benefit in 1 or another group, but it is difficult to untangle whether this shows benefit of a particular intervention or control condition, or whether this reflects differences in measurement approach | 5 | Lowb |
| Family functioning | These outcomes were measured by two studies that utilised family‐based approaches to providing intervention. No differences were found between intervention and control conditions on most of the outcome measures used. These included various aspects of family life such as parenting style, aggression and violence, family conflict and percent days living at home | 2 | Lowc |
| Overall picture | Participants in studies remained for the most part at a similar level or improved on outcomes measured. Assessment of the grade of evidence is moderate overall, as whilst some domains of bias (e.g. allocation concealment) were assessed mostly as having low risk of bias, other domains such as blinding, were assessed consistently as high risk, whilst selective reporting was consistently assessed as unclear. No clear examples showed deteriorated outcomes. Findings may be more generalisable to young people in low‐ and middle‐income countries with circumstances more similar to those included in the studies (i.e. those who have left home because of abuse or family conflict | Total studies included = 13 | Moderatea |
| GRADE Working Group grades of evidence | |||
| Summarised outcome categories used in Summary of findings (SoF) table in the interest of space aOverall, the quality of the evidence was assessed as 'moderate' in the context of typical study quality in comparable areas (psychosocial interventions with at‐risk populations), and standard quality criteria were used in Cochrane reviews (in particular, the GRADE evaluation framework as utilised here). Quality of evidence for all available outcome categories was upgraded because they were based on robust study designs (RCTs); reasonably low drop‐out rates (for the study population involved); some analysis of major confounders including age and gender, and publication of data for a broad range of outcomes, including non‐significant outcomes, measured over reasonably long follow‐up periods, in most included studies. Quality of evidence was downgraded for the following reasons: heterogeneity of study outcomes, measures and types of statistical analysis used; inconsistency in measures, findings and analyses across outcomes and across studies with similar interventions; reliance on self report; use of convenience samples; over‐representation of studies from one study team; and questions over study generalisability. Further, few studies involved a control condition receiving no services, and some did not involve a service as usual condition, reducing comparability across studies. Finally, the relationship between intervention theories and outcomes measured remained unclear, and clinical and subjective significance of outcomes was explored in a small number of included studies. No participatory or process evaluations were available bAs above, but the quality of the evidence was further downgraded because of the relatively small number of heterogeneous studies cAs above, but the quality of the evidence was further downgraded because of the small number of studies available. The two included studies were conducted by the same study team. | |||
| Number* | Outcome name | Study | Measure | ≤1 month | 3 months | 6 months | 12 months |
| Number of times participant had sex in last 90 days | HRQ | x | x | ||||
| Own | x | x | |||||
| Number of sexual partners | HRQ | x | x | ||||
| Own | x | x | |||||
| Alcohol use (number of days in last 30 days) | TLFB | x | x | ||||
| TLFB | x | x | |||||
| Alcohol use (% days in last 90 days) | Form 90 | x | x | x | |||
| Form 90 | x | ||||||
| Form 90 | x | ||||||
| Form 90 | x | x | x | ||||
| Form 90 | x | x | x | ||||
| Form 90 | x | x | x | ||||
| Number of standard drinks (in last 90 days) | Form 90 | x | |||||
| Form 90 | x | ||||||
| Alcohol use (total score) | ADI | x | |||||
| ADI | x | ||||||
| Alcohol/drug use (% days in last 90 days) | Form 90 | x | |||||
| Form 90 | x | ||||||
| Form 90 | x | ||||||
| Form 90 | x | x | x | ||||
| Form 90 | x | x | x | ||||
| Form 90 | x | x | x | ||||
| Only/any drug use (% days in last 90 days) | Form 90 | x | x | x | |||
| Form 90 | x | ||||||
| Form 90 | x | ||||||
| Form 90 | x | x | x | ||||
| Form 90 | x | x | x | ||||
| Form 90 | x | x | x | ||||
| Marijuana use (number of days in last 30 days) | TLFB | x | x | ||||
| TLFB | x | x | |||||
| Drug use other than marijuana (number of days in last 30 days) | TLFB | x | x | ||||
| TLFB | x | x | |||||
| Number of problem consequences | POSIT | x | x | ||||
| POSIT | x | ||||||
| POSIT | x | ||||||
| POSIT | x | ||||||
| Number of substance use diagnoses | CDISC | x | |||||
| CDISC | x | ||||||
| Number of categories of drug use (last 90 days) | Form 90 | x | |||||
| Form 90 | x | ||||||
| Self esteem | RSES | x | |||||
| SEI | x | ||||||
| Depression | RADS | x | |||||
| BDI | x | ||||||
| BDI | x | x | x | ||||
| BDI | x | ||||||
| BDI | x | ||||||
| BDI | x | ||||||
| BDI | x | x | x | ||||
| BDI | x | x | x | ||||
| BDI | x | x | x | ||||
| BDI | x | x | x | ||||
| BDI | x | x | x | ||||
| BDI | x | x | x | ||||
| Verbal aggression (youth) | CTS | x | |||||
| CTS | x | ||||||
| CTS | x | ||||||
| Family violence (youth) | CTS | x | |||||
| CTS | x | ||||||
| CTS | x | ||||||
| Days living at home (% days in last 90 days) | Form 90 | x | |||||
| Form 90 | x | ||||||
| Delinquent behaviours | YSR | x | |||||
| DSM‐IV | x | x | x | ||||
| NYSDS | x | x | x | ||||
| NYSDS | x | ||||||
| NYSDS | x | ||||||
| NYSDS | x | ||||||
| Internalising problems | YSR | x | |||||
| YSR | x | x | x | ||||
| YSR | x | ||||||
| YSR | x | ||||||
| YSR | x | ||||||
| YSR | x | x | x | ||||
| YSR | x | x | x | ||||
| YSR | x | x | x | ||||
| YSR | x | x | x | ||||
| YSR | x | x | x | ||||
| YSR | x | x | x | ||||
| Externalising problems | YSR | x | |||||
| YSR | x | x | x | ||||
| YSR | x | ||||||
| YSR | x | ||||||
| YSR | x | ||||||
| YSR | x | x | x | ||||
| YSR | x | x | x | ||||
| YSR | x | x | x | ||||
| YSR | x | x | x | ||||
| YSR | x | x | x | ||||
| YSR | x | x | x | ||||
| Number of psychiatric diagnoses | CDISC | x | |||||
| CDISC | x | ||||||
| CDISC | x | ||||||
| Family cohesion | FES | x | |||||
| FES | x | ||||||
| FES | x | ||||||
| Family conflict | FES | x | |||||
| FES | x | ||||||
| FES | x | ||||||
| Parental care | PBI | x | |||||
| PBI | x | ||||||
| PBI | x | ||||||
| Parental overprotectiveness | PBI | x | |||||
| PBI | x | ||||||
| PBI | x | ||||||
| Number | Outcome name | Study | Measure | ≤1 month | 3 months | 6 months | 12 months |
| Gaps occur when absence of relevant data was noted in relation to particular outcomes defined in the protocol | |||||||
| Outcome or subgroup title | No. of studies | No. of participants | Statistical method | Effect size |
| 1 Number of times had sex ‐ 3 months Show forest plot | 2 | 239 | Mean Difference (IV, Random, 95% CI) | ‐0.56 [‐1.13, 0.01] |
| 2 Number of times had sex ‐ 6 months Show forest plot | 2 | 242 | Mean Difference (IV, Random, 95% CI) | 0.73 [‐2.97, 4.43] |
| 3 Number of sexual partners ‐ 3 months Show forest plot | 2 | 239 | Mean Difference (IV, Random, 95% CI) | ‐0.04 [‐0.25, 0.17] |
| 4 Number of sexual partners ‐ 6 months Show forest plot | 2 | 242 | Mean Difference (IV, Random, 95% CI) | ‐0.04 [‐0.22, 0.13] |
| Outcome or subgroup title | No. of studies | No. of participants | Statistical method | Effect size |
| 1 Number of days used alcohol in last month ‐ 1 month Show forest plot | 2 | 235 | Mean Difference (IV, Random, 95% CI) | ‐0.33 [‐2.25, 1.59] |
| 2 Number of days used alcohol in last month ‐ 3 months Show forest plot | 2 | 235 | Mean Difference (IV, Random, 95% CI) | 1.10 [‐0.67, 2.88] |
| 3 Percent days of alcohol use in last 90 days (Form 90) ‐ 3 months Show forest plot | 5 | 383 | Mean Difference (IV, Random, 95% CI) | 0.03 [‐1.86, 1.93] |
| 4 Percent days of alcohol use in last 90 days (Form 90) ‐ 6 months Show forest plot | 3 | 295 | Mean Difference (IV, Random, 95% CI) | 1.05 [‐1.76, 3.86] |
| 5 Percent days of alcohol use in last 90 days (Form 90) ‐ 12 months Show forest plot | 3 | 304 | Mean Difference (IV, Random, 95% CI) | 0.63 [‐2.23, 3.48] |
| 6 Number of standard drinks (Form 90) ‐ 3 months Show forest plot | 2 | 75 | Mean Difference (IV, Random, 95% CI) | ‐2.87 [‐5.68, ‐0.07] |
| 7 Adolescent Drinking Index ‐ 3 months Show forest plot | 2 | 75 | Mean Difference (IV, Random, 95% CI) | 1.08 [‐4.42, 6.57] |
| 8 Percent days of alcohol/drug use (excl tobacco) (Form 90) ‐ 3 months Show forest plot | 4 | 214 | Mean Difference (IV, Random, 95% CI) | ‐0.70 [‐9.09, 7.70] |
| 9 Percent days of alcohol/drug use (excl tobacco) (Form 90) ‐ 6 months Show forest plot | 3 | 278 | Mean Difference (IV, Random, 95% CI) | ‐2.15 [‐9.82, 5.53] |
| 10 Percent days of alcohol/drug use (excl tobacco) (Form 90) ‐ 12 months Show forest plot | 2 | 127 | Mean Difference (IV, Random, 95% CI) | 5.87 [‐5.06, 16.79] |
| 11 Percent days only/any drug use (Form 90) ‐ 3 months Show forest plot | 5 | 384 | Mean Difference (IV, Random, 95% CI) | 0.67 [‐6.82, 8.15] |
| 12 Percent days only/any drug use (Form 90) ‐ 6 months Show forest plot | 3 | 295 | Mean Difference (IV, Random, 95% CI) | ‐2.28 [‐11.53, 6.96] |
| 13 Percent days only/any drug use (Form 90) ‐ 12 months Show forest plot | 3 | 304 | Mean Difference (IV, Random, 95% CI) | ‐5.28 [‐13.79, 3.23] |
| 14 Number of days used marijuana in last month ‐ 1 month Show forest plot | 2 | 235 | Mean Difference (IV, Random, 95% CI) | ‐0.52 [‐3.65, 2.62] |
| 15 Number of days used marijuana in last month ‐ 3 months Show forest plot | 2 | 235 | Mean Difference (IV, Random, 95% CI) | 0.37 [‐2.73, 3.47] |
| 16 Number of days used other drugs in last month ‐ 1 month Show forest plot | 2 | 204 | Mean Difference (IV, Random, 95% CI) | 1.21 [‐0.68, 3.10] |
| 17 Number of days used other drugs in last month ‐ 3 months Show forest plot | 2 | 204 | Mean Difference (IV, Random, 95% CI) | 0.22 [‐1.84, 2.28] |
| 18 Number of problem consequences ‐ 3 months Show forest plot | 3 | 182 | Mean Difference (IV, Random, 95% CI) | 1.51 [0.56, 2.47] |
| 19 Number of problem consequences ‐ 6 months Show forest plot | 2 | 261 | Mean Difference (IV, Random, 95% CI) | 0.34 [‐0.67, 1.34] |
| 20 Number of substance use diagnoses (CDISC) ‐ 3 months Show forest plot | 2 | 75 | Mean Difference (IV, Random, 95% CI) | ‐0.70 [‐1.27, ‐0.14] |
| 21 Number of categories of drug use (Form 90) ‐ 6 months Show forest plot | 2 | 261 | Mean Difference (IV, Random, 95% CI) | 0.14 [‐0.33, 0.61] |
| Outcome or subgroup title | No. of studies | No. of participants | Statistical method | Effect size |
| 1 Self esteem at endpoint Show forest plot | 2 | 142 | Std. Mean Difference (IV, Random, 95% CI) | 0.11 [‐0.22, 0.44] |
| Outcome or subgroup title | No. of studies | No. of participants | Statistical method | Effect size |
| 1 Depression at 3 months Show forest plot | 9 | 661 | Std. Mean Difference (IV, Random, 95% CI) | ‐0.03 [‐0.22, 0.17] |
| 2 Depression at 6 months Show forest plot | 6 | 586 | Mean Difference (IV, Random, 95% CI) | 0.83 [‐0.88, 2.55] |
| 3 Depression at 12 months Show forest plot | 5 | 441 | Mean Difference (IV, Random, 95% CI) | 1.28 [‐0.36, 2.92] |
| Outcome or subgroup title | No. of studies | No. of participants | Statistical method | Effect size |
| 1 Verbal aggression (Conflict Tactic Scale) ‐ 3 months Show forest plot | 3 | 208 | Mean Difference (IV, Random, 95% CI) | ‐0.00 [‐0.07, 0.06] |
| 2 Family violence (Conflict Tactic Scale) ‐ 3 months Show forest plot | 3 | 208 | Mean Difference (IV, Random, 95% CI) | ‐0.00 [‐0.02, 0.02] |
| Outcome or subgroup title | No. of studies | No. of participants | Statistical method | Effect size |
| 1 Percent of days living at home (Form 90) ‐ 3 months Show forest plot | 2 | 75 | Mean Difference (IV, Random, 95% CI) | ‐9.46 [‐27.96, 9.03] |
| Outcome or subgroup title | No. of studies | No. of participants | Statistical method | Effect size |
| 1 Delinquent behaviours at 3 months Show forest plot | 5 | 404 | Std. Mean Difference (IV, Random, 95% CI) | ‐0.29 [‐0.54, ‐0.03] |
| 2 Delinquent behaviours at 6 months Show forest plot | 3 | 348 | Std. Mean Difference (IV, Random, 95% CI) | ‐0.07 [‐0.52, 0.37] |
| 3 Delinquent behaviours at 12 months Show forest plot | 2 | 177 | Std. Mean Difference (IV, Random, 95% CI) | ‐0.16 [‐1.05, 0.72] |
| Outcome or subgroup title | No. of studies | No. of participants | Statistical method | Effect size |
| 1 Internalising behaviours at 3 months Show forest plot | 8 | 634 | Mean Difference (IV, Random, 95% CI) | 0.73 [‐0.87, 2.34] |
| 2 Internalising behaviours at 6 months Show forest plot | 6 | 582 | Mean Difference (IV, Random, 95% CI) | 0.30 [‐1.36, 1.97] |
| 3 Internalising behaviours at 12 months Show forest plot | 5 | 433 | Mean Difference (IV, Random, 95% CI) | 0.31 [‐1.58, 2.20] |
| 4 Externalising behaviours at 3 months Show forest plot | 8 | 636 | Std. Mean Difference (IV, Random, 95% CI) | 0.09 [‐0.10, 0.28] |
| 5 Externalising behaviours at 6 months Show forest plot | 6 | 583 | Mean Difference (IV, Random, 95% CI) | 0.83 [‐0.74, 2.41] |
| 6 Externalising behaviours at 12 months Show forest plot | 5 | 434 | Mean Difference (IV, Random, 95% CI) | 0.04 [‐2.89, 2.97] |
| 7 Number of psychiatric diagnoses Show forest plot | 3 | 182 | Mean Difference (IV, Random, 95% CI) | ‐0.06 [‐0.50, 0.37] |
| Outcome or subgroup title | No. of studies | No. of participants | Statistical method | Effect size |
| 1 Family cohesion (Family Environment Scale) ‐ 3 months Show forest plot | 3 | 208 | Mean Difference (IV, Random, 95% CI) | 0.88 [0.23, 1.54] |
| 2 Family conflict (Family Environment Scale) ‐ 3 months Show forest plot | 3 | 208 | Mean Difference (IV, Random, 95% CI) | ‐0.05 [‐0.91, 0.81] |
| 3 Parental care (Parental Bonding Instrument) ‐ 3 months Show forest plot | 3 | 208 | Mean Difference (IV, Random, 95% CI) | 1.68 [‐0.63, 4.00] |
| 4 Parental overprotection (Parental Bonding Instrument) ‐ 3 months Show forest plot | 3 | 208 | Mean Difference (IV, Random, 95% CI) | ‐0.82 [‐4.75, 3.10] |