مداخلاتی برای ارتقای همبستگی مجدد و کاهش رفتارها و سبک زندگی آسیبرسان در کودکان و جوانان خیابانی
چکیده
پیشینه
میلیونها کودک و افراد جوان خیابانی در سراسر دنیا در فضاهای خیابانی زندگی یا کار میکنند. آنها صرف نظر از اینکه ارتباط خود را با خانوادههای اصلی خود حفظ کرده یا نکرده باشند، در معرض آسیب خطرهای زیادی قرار دارند و علیرغم داشتن بسیاری تواناییها و مقاومتها، از ساختارها و فرصتهای اجتماعی مهم کنار گذاشته میشوند.
اهداف
اهداف اولیه پژوهش
ارزیابی و خلاصه کردن اثربخشی مداخلات صورت گرفته در مورد کودکان و جوانان خیابانی که با اهداف زیر صورت گرفتهاند:
• ارتقای جامعهپذیری (inclusion) و همبستگی مجدد (reintegration)؛
• افزایش سواد و توان محاسباتی؛
• تسهیل دسترسی به تحصیل و اشتغال؛
• ارتقای سلامت روان، شامل عزت نفس؛
• کاهش آسیبهای ناشی از فعالیت جنسی زودهنگام و سوءمصرف مواد مخدر.
اهداف ثانویه پژوهش
• بررسی اینکه تاثیرات ناشی از مداخلات صورت گرفته درون جمعیتها تفاوت میکند یا خیر، و اینکه شیب برابری (equity gradient)، این تاثیرات را متاثر میسازد یا خیر، از طریق تعمیم یافتههای مرتبط با شرایط کشورهای با سطح درآمد پائین و متوسط (LMICs) (Peters 2004).
• توصیف سایر تاثیرات رفتاری، روانیاجتماعی، آموزشی و سلامت، زمانی که پیامدهای مناسب گزارش میشوند.
• بررسی تاثیر ویژگیهای زمینهای در طراحی، ارائه خدمت و پیامدهای مداخلات.
• بررسی روابط بین تعداد مولفهها و طول دوره و تاثیرات مداخلات.
• نشان دادن دستاوردهای این یافتهها برای پژوهش و روشهای پژوهش آتی به منظور توسعه شواهد در رابطه با اهداف اولیه پژوهش.
• در نظر گرفتن پیامدهای جانبی یا ناخواسته.
روشهای جستوجو
در بانکهای اطلاعاتی کتابشناختی که در زیر آورده شدهاند، برای دستیابی به مرور اصیل از آغاز سال 2012، و وبسایتهای غیر‐دولتی و سازمانی متنوع مرتبط، به جستوجو پرداختیم: پایگاه مرکزی ثبت کارآزماییهای بالینی کاکرین (CENTRAL)؛ MEDLINE و Pre‐MEDLINE؛ EMBASE و EMBASE Classic؛ Cumulative Index to Nursing and Allied Health Literature (CINAHL)؛ PsycINFO؛ مرکز اطلاعات منابع آموزشی (ERIC)؛ چکیده منابع با موضوع روانیاجتماعی، چکیده منابع با موضوع خدمات اجتماعی، چکیده منابع با موضوع اقدامات اجتماعی، Healthstar، منابع علمی سلامت آمریکای لاتین و کارائیب (LILACS)؛ سیستم منابع علمی منتشر نشده در اروپا (OpenGrey)، پایاننامهها و رسالههای ProQuest؛ EconLit؛ تحقیقات اقتصاد و دارایی IDEAS، کاتالوگ کتابخانه JOLIS در خصوص هولدینگهای گروه بانک جهانی و کتابخانههای صندوق بینالمللی پول (IMF)، کتابخانه ویژه مطالعات توسعه بریتانیا (BLDS)، موتور جستجوی Google و Google Scholar. جستوجو را در اپریل 2015 برای بهروز کردن مرور، با استفاده از روشهای مشابه، بهروز کردیم.
معیارهای انتخاب
این مرور دادههای مربوط به مطالعات مداخلهای صورت گرفته را با هدف کاهش آسیب یا همبستگی مجدد که از طرح مطالعاتی با یک گروه مقایسه استفاده کرده بودند، دربرمیگیرد؛ تمامی مطالعات از نوع تصادفیسازی شده یا شبه‐تصادفیسازی شده بودند. مطالعات تنها در صورتی وارد مرور میشدند که به ارزیابی مداخلات تدارک دیده شده برای کودکان و جوانان، از بدو تولد تا 24 سالگی، از تمامی مناطق با ویژگیهای زمینهای مختلف پرداخته بودند.
گردآوری و تجزیهوتحلیل دادهها
دو نویسنده مرور بهطور مستقل از هم نسبت به استخراج دادهها و ارزیابی خطر سوگیری (bias) و سایر عوامل ارائه شده در ارزیابی کیفیت خلاصه و بحث (روش درجهبندی توصیه، ارزیابی، توسعه و ارزشیابی (GRADE)) اقدام کردند. دادههای مربوط به اعمال مداخلات، ویژگی زمینهای، عوامل مرتبط با فرآیند، برابری و پیامدها را استخراج کرده و پیامدها را ذیل پیامدهای روانیاجتماعی، رفتارهای جنسی خطرناک یا سوءمصرف مواد گروهبندی کردیم. در جاهایی که معیارهای استفاده شده برای معیارهای پیامد به اندازه کافی شبیه بودند، نسبت به انجام متاآنالیز (meta‐analysis) اقدام کردیم. سایر پیامدها را به صورت نقل قول (narrative) ارزیابی کردیم.
نتایج اصلی
13 مطالعهای را که به ارزیابی 19 مداخله صورت گرفته در کشورهای با سطح درآمد بالا (HICs) پرداخته بودند، وارد این مرور کردیم. در مرحله بهروز کردن مرور (از جستوجوی ما در سال 2015)؛ مطالعه وارد شده قبلی حذف شد و سه مطالعه جدید اضافه شد (از جستوجوی ما در سال 2012). هیچ ارزیابی صورت گرفته در کشورهای با سطح درآمد پائین و متوسط (LMICs) را که به اندازه کافی قوی باشد، نیافتیم. کیفیت مطالعه به طور کلی پائین بود و معیارهای مورد استفاده در مطالعات متغیر بود. شرکتکنندگان به دو دسته گذری (drop‐in) و مبتنی بر پناهگاه (shelter‐based) تقسیم شده بودند. هیچ مطالعهای، پیامد اولیه یعنی همبستگی مجدد را اندازهگیری نکرد، هیچ مطالعهای گزارشی از بروز عوارض جانبی ارائه نکرد. ما هیچ گونه نتایج همسو و سازگار را به صورت یک طیف از پیامدهای مرتبط، درون حوزههای سلامت روانیاجتماعی، سوءمصرف مواد و رفتارهای خطرناک جنسی نیافتیم. مداخلاتی که ارزیابی شده بودند، عبارتند از برنامههای مبتنی بر درمان زماندار که ثابت کرد نسبت به خدمات گذری (drop‐in) یا حمایتی (shlter) استاندارد و سایر مداخلات کنترلی اعمال شده در رابطه با اکثر پیامدها در بیشتر مطالعات، اثربخشتر نبودند. تغییرات مورد علاقه از سطح پایه برای پیامدها در مورد شرکتکنندگانی که تحت مداخلات درمانی و دریافت خدمات استاندارد قرار گرفتند، گزارش شدند. ما شاهد ناهمگونی قابل توجهی میان مطالعات و روش گزارشدهی غیر‐منسجم دادههای مربوط به برابری (equity) بودیم. هیچ یک از مطالعات به اندازهگیری پیامد اولیه همبستگی مجدد یا گزارش عوارض جانبی نپرداخته بودند.
نتیجهگیریهای نویسندگان
آنالیزها، هیچ مزیت معنیدار و همسو و سازگار در رابطه با مداخلات درمانی متمرکز در مقایسه با خدمات استاندارد از جمله مراکز گذری، مدیریت موارد خاص و سایر مداخلات قابل مقایسه در مورد کودکان و جوانان خیابانی نشان نداد. با وجود این، خدمات در دسترس متداول به طور دقیق ارزیابی نشده بودند. ارزیابی قوی مداخلات، شامل مقایسه با عدم‐مداخله، مبنای شواهد قابل اتکاتری برای تاثیرگذاری بر اجرای خدمات به دست میدهد. برای بررسی مداخلات مربوط به کودکان و جوانان خیابانی با پیشینه و نیازمندیهای خدماتی متفاوت، به پژوهشهای قوی بیشتری در LMICها نیاز است.
PICO
خلاصه به زبان ساده
نقش مداخلات برای کاهش خطرات و ارتقای جامعهپذیری کودکان و جوانان خیابانی
تخمین زده میشود که میلیونها کودک و جوان در سراسر جهان در خیابانها زندگی و کار میکنند. بسیاری از این افراد از خود در برابر مشکلات مقاومت نشان داده و دارای مهارتهای قوی مقابله با مسائل هستند، اما همواره در برابر انواع خطرات آسیبپذیر هستند. برای فراهم کردن بهترین فرصتها در زندگی برای این افراد، به خدماتی برای کاهش خطرات و پیشگیری از به حاشیه راندن آنها از متن اصلی جامعه نیاز است. سیزده مطالعه به طور دقیق به ارزیابی 19 مداخله از قبیل خدمات برای حمایت از کودکان و جوانان خیابانی پرداختهاند (همه آنها در کشورهای با سطح درآمد بالا انجام شدهاند). بیشتر آنها به مقایسه خدمات مبتنی بر درمان در برابر خدمات گذری (drop‐in) و حمایتی (shelter) یا در برابر سایر مداخلات درمانی/سلامتمحور پرداخته بودند. نتایج متنوع و درهمی میان این مطالعات به دست آوردیم، اما در مجموع یافتهها نشان میدادند مزیت برای شرکتکنندگانی که درمان دریافت کرده بودند و آنهایی که خدمات عادی برای آنها تدارک دیده شده بود، به یک اندازه بود. بهتر است پژوهش بیشتری به بررسی مزایای خدمات گذری و حمایتی به ویژه در کشورهای با سطح درآمد پائین و متوسط پرداخته و بهتر است تمرکز آنها روی کودکان و جوانان خیابانی باشد. هیچ یک از مطالعات، شرکتکنندگان قابل مقایسه با کودکان خیابانی کشورهای با سطح درآمد پائین را که ممکن است در وهله اول برای گذران زندگی یا در نتیجه جنگ، مهاجرت یا شهری شدن در خیابان به سر برده باشند را در بر نمیگرفتند. در مجموع، کیفیت شواهد وارد شده به این مرور را در سطح پائین/متوسط ارزیابی کردیم.
Authors' conclusions
Summary of findings
| Therapeutic intervention compared with service as usual for street‐connected children and young people | |||
| Patient or population: street‐connected children and young people Settings: shelters and drop‐in centres Intervention: various specific therapeutic types of interventions Comparison: shelter/drop‐in service as usual | |||
| Outcome categories (summarised) | Impact | Number of | Quality of the evidence |
| Primary outcome ‐ reintegration
| Reintegration was not measured in any of the studies. Similarly, access to literacy, numeracy, education and employment were not measured in any of the studies that met the criteria for inclusion. However, social stability was measured in 1 study and delinquent behaviours in 4 studies. Social stability outcomes measured in 1 study showed benefit for the intervention group. Delinquent behaviour results were mixed across studies; investigators used different types and constructs of measurement, so findings cannot be summarised | 1 4 | Moderatea |
| Promotion of mental health, including self esteem | Outcomes included in this category included depression, internalising and externalising behaviours, self esteem and psychiatric diagnoses measured on various scales. None of these measures showed overall differences between intervention and control groups, and change score calculations demonstrated that for the most part, both groups improved from baseline. These results indicate that for mental health promotion outcomes, the therapeutic intervention did not obtain significantly better outcomes than the service as usual/control condition in the studies included in this review | 8 | Moderatea |
| Reduction in harms associated with substance misuse | Substance misuse was measured in a wide variety of ways and includes alcohol misuse and different categories of non‐prescription drugs, as well as a scale measuring 'problem consequences'. The overall picture emerging form the included studies on these outcomes is unclear, possibly because of the array of measurement types and tools that measure subtly different constructs and differing time windows that were impossible to combine statistically. Results are mixed across studies, with some showing marginal or no differences between groups, and others showing clear benefit for intervention or control. Improvements in some substance misuse measures were noted in all 3 family intervention studies | 8 | Moderatea |
| Reduction in harms associated with early sexual activity | Sexually risky behaviour was similarly measured in different ways, including numbers of partners, numbers of times had sex, HIV knowledge, unprotected sex, condom use and rates of abstinence. Again, the picture across studies is mixed. Some studies showed benefit in 1 or another group, but it is difficult to untangle whether this shows benefit of a particular intervention or control condition, or whether this reflects differences in measurement approach | 5 | Lowb |
| Family functioning | These outcomes were measured by two studies that utilised family‐based approaches to providing intervention. No differences were found between intervention and control conditions on most of the outcome measures used. These included various aspects of family life such as parenting style, aggression and violence, family conflict and percent days living at home | 2 | Lowc |
| Overall picture | Participants in studies remained for the most part at a similar level or improved on outcomes measured. Assessment of the grade of evidence is moderate overall, as whilst some domains of bias (e.g. allocation concealment) were assessed mostly as having low risk of bias, other domains such as blinding, were assessed consistently as high risk, whilst selective reporting was consistently assessed as unclear. No clear examples showed deteriorated outcomes. Findings may be more generalisable to young people in low‐ and middle‐income countries with circumstances more similar to those included in the studies (i.e. those who have left home because of abuse or family conflict | Total studies included = 13 | Moderatea |
| GRADE Working Group grades of evidence | |||
| Summarised outcome categories used in Summary of findings (SoF) table in the interest of space aOverall, the quality of the evidence was assessed as 'moderate' in the context of typical study quality in comparable areas (psychosocial interventions with at‐risk populations), and standard quality criteria were used in Cochrane reviews (in particular, the GRADE evaluation framework as utilised here). Quality of evidence for all available outcome categories was upgraded because they were based on robust study designs (RCTs); reasonably low drop‐out rates (for the study population involved); some analysis of major confounders including age and gender, and publication of data for a broad range of outcomes, including non‐significant outcomes, measured over reasonably long follow‐up periods, in most included studies. Quality of evidence was downgraded for the following reasons: heterogeneity of study outcomes, measures and types of statistical analysis used; inconsistency in measures, findings and analyses across outcomes and across studies with similar interventions; reliance on self report; use of convenience samples; over‐representation of studies from one study team; and questions over study generalisability. Further, few studies involved a control condition receiving no services, and some did not involve a service as usual condition, reducing comparability across studies. Finally, the relationship between intervention theories and outcomes measured remained unclear, and clinical and subjective significance of outcomes was explored in a small number of included studies. No participatory or process evaluations were available bAs above, but the quality of the evidence was further downgraded because of the relatively small number of heterogeneous studies cAs above, but the quality of the evidence was further downgraded because of the small number of studies available. The two included studies were conducted by the same study team. | |||
Background
Description of the condition
The number of street‐connected children and young people worldwide has been estimated at around 100 million (UNICEF 2002), although this figure is widely contested. It is recognised that exact numbers are unknown and estimates vary, in part as the result of political motivations (Thomas de Benitez 2011). Numbers differ depending on whether they are estimated by governments or by non‐government organisations (NGOs). The definition and status of the problem have traditionally differed for European and other high‐income countries (HICs), although structural antecedents such as inequalities or social exclusions may be similar (Karabanow 2014; Karabanow 2010). For example, a minimum of 66,000 first‐time runaways per year has been recorded in England (CSC 2009), and data for the United States estimate 1 to 2 million ‘street involved youth’. The difficulty in estimating numbers is due in part to wide variations in definitions of which young people are included and lack of formal identity papers for most street‐connected children and young people, particularly in low‐ and middle‐income countries (LMICs).
In the historic United Nations International Children's Emergency Fund (UNICEF) definition, ‘children of the street’ are homeless children who live and sleep on the streets in predominantly urban areas, living with other street‐connected children and young people or homeless adults. ‘Children on the street’ earn their living or beg for money on the street and may return home at night to maintain contact with their families. Such definitions may include children who are stateless or migrating, with or without their families. The definition of ‘street‐connected children and young people’ can also overlap with categories such as runaways and homeless youth, children who have been trafficked, child labourers, children who live in slums and children living in institutions (Ennew 2003; UNICEF 2005). Many commentators argue that issues prevalent in the lives of street‐connected children, including risks, do not differ for other children living in urban or rural poverty, and that approaches to the issue of street‐connected children and young people should not be disconnected from approaches to amelioration of poverty and social exclusion more generally (Panter‐Brick 2002; Thomas de Benitez 2011). This review, however, focuses on street‐connected children.
Definitions too are much debated, with varying emphasis on young people’s agency and resilience (Beazley 2003; Van Blerk 2006). Agency typically is conceptualised as an element of young people's resilience that enables street‐connected children and youth, for example, to negotiate for their basic needs, draw on social support networks and explore pathways to achieve their personal goals in a resourceful manner (e.g. Theron 2010). In an overview by the Consortium for Street Children (CSC), de Thomas Benitez states: "street children are recognized to be young people who experience a combination of multiple deprivations and street‐connectedness" (Thomas de Benitez 2011b). Children and young people may live and work on the street or in public spaces, may work on the street and return to family homes or hostels at night or may combine these lifestyles at different times.
In our systematic review, we use the term ‘street‐connected children and young people’ to refer to children who work or sleep, or both, on the streets, and who may or may not necessarily be adequately supervised or directed by responsible adults. It includes (but not exclusively) the co‐existing categories referred to by UNICEF as those ‘on the street’ and those ‘of the street’ ‐ children for whom the street is a reference point and has a central role in their lives (Redes Rio Crianca 2007; Thomas de Benitez 2011; UNICEF 2001a). Current thinking sees this process as non‐linear, with many street‐connected children and young people transitioning off the streets (Panter‐Brick 2002). This definition opens the door to studies of young people living in slums, in squatter settlements and in hostels who also are working on the street.
Important risks faced by street‐connected children and young people include physical, psychological and sexual exploitation; violence; economic exploitation; social exclusion; no skills‐based employment; substance misuse; widespread addiction; and human immunodeficiency virus (HIV) infection (Ennew 2000; West 2003). Many street‐connected children and young people experience health difficulties (Woan 2013), coercion and control by adult gangs, criminality and lack of education (West 2003). However, street‐connected children and young people are not a homogenous group. Current research demonstrates that girls and young women may experience risks differently from boys and young men (Beazley 2003; Van Blerk 2006). Other groups, such as disabled youth and those from ethnic or sexual minority groups, may have different experiences. Children live and work on the streets in different ways and for different reasons (UNICEF 2005). Most street‐connected children and young people are not orphaned but are in contact with their families and may augment the household income (UNICEF 2005). Current research emphasises the resilience of street‐connected children and young people and the fact that children and young people use agency and citizenship and make their own decisions with a need for participation ‐ not solely for protection (Panter‐Brick 2002; Thomas de Benitez 2011).
Description of the intervention
Interventions aiming to improve the situations of street‐connected children and young people include educational projects (Malindi 2012; Ouma 2004), vocational training (Ali 2004; Ferguson 2007), harm reduction (Ferguson 2006; Poland 2002), HIV prevention (Kasirye 2004), family therapeutic intervention (Roberts 2010) and multi‐disciplinary programmes (Scivoletto 2011; Souza 2010). Interventions may take the form of single projects, drop‐in centres or peer education interventions, and many will be underpinned by the ‘children’s rights’ discourse, more recently taking a holistic approach to the needs of young people (Ennew 2000; Thomas de Benitez 2011). Indeed, it has been argued that interventions may not succeed if they ignore children’s voices and do not include their participation in planning and management (Panter‐Brick 2002; Paterson 2008). Understanding of family reintegration is also evolving, and emerging evidence describes holistic, child‐centred approaches to family reintegration in LMICs (Mann 2014; Wedge 2013).
Educational projects offer street‐connected children opportunities to break out of the cycle of poverty. Occasionally these projects help children and youth to sit for formal examinations and obtain recognised certificates (Ouma 2004), and vocational training aims to develop skills to lead children and youth into the world of non‐exploitative work. Some programmes aim, through health and nutrition components, to increase the 'educatability’ of children and youth before or during school attendance. They can take the form of non‐formal education, consisting of any form of systematic learning activity outside the framework of the formal system. Such instruction may be run alongside formal schooling, or may be provided separately.
Several considerations are relevant to interventions and programmes provided for the relevant population. So far, we have particularly identified gender, ethnicity, religion, disability, citizenship, legal status and age of street‐connected children and young people as relevant individual factors that may impact outcomes of interventions. Relevant contextual factors include the experience of sexual abuse, violence, addiction, low literacy, migration (including rural‐to‐urban), poverty and mechanisms of exclusion (such as negative community responses to children's migratory or refugee status, and labelling of individuals as ‘vagrants’, ‘illegal vendors’ or ‘truants’).
It is also important to consider the nature of strategies for engaging young people at street level that, according to a wealth of qualitative literature drawing on ethnographic data and practitioner perspectives, form the basis of successful intervention programmes (Ennew 2000; Karabanow 2004; Panter‐Brick 2002; Thomas de Benitez 2011). "To determine the ‘type’ of intervention needed, engagement enables a relationship and trust to be built. Participatory models of engagement ensure that sufficient time and space is given to children to demonstrate to outsiders why they came to the street, and what their background is. Participatory engagement allows children themselves to tell their histories rather than have to directly answer questions about their past" (Walker 2011 [pers comm]).
How the intervention might work
Logic models offer a particularly useful tool for analysis of complex interventions that operate at individual, group and social system levels (Anderson 2010). We found the logic model a useful tool for capturing on one hand the heterogeneity of intervention types, background variables and research contexts relevant to the review topic, and on the other hand the core elements of successful interventions. In our primary intervention logic model (Figure 1), we divided such intervention components (second column) into micro‐, meso‐ and exo‐level factors, drawing on Bronfenbrenner's analytical model (Bronfenbrenner 1979). These factors interact with factors relevant to recruitment and engagement (first column), again with features relevant at different levels of analysis, including macro‐level factors such as culture and religion. The third column indicates potential intermediate outcomes at these four levels, followed by longer‐term outcomes in the fourth column. Our generalisability logic model (Figure 2) provides a more concise model for assessing the generalisability of a particular intervention across socio‐economic and cultural contexts.

Intervention and context logic model.

Generalisability logic model.
Outcomes identified in the literature include negative effects of poorly planned or forced interventions (Thomas de Benitez 2011) and detrimental outcomes frequently documented in association with reintegration of children in non‐family care into their families of origin (Feeny 2005; Thoburn 2009). However, a possible adverse outcome that may not be captured easily in study evaluations of street‐connected children and young people is their increased mistrust of adults in the context of interventions that may be ad hoc and short‐lived due to lack of funding and other structural support. Some researchers consider that study designs that do not provide genuine opportunities for children and young people to participate throughout the research process are most likely to show failure when the full range of outcomes of an intervention is assessed (Panter‐Brick 2002; Paterson 2008; Slesnick 2009).
A final point to be made is that the circumstances of street‐connected children and young people, as noted above, may be non‐linear, and young people may continue to live and work on the streets whilst engaging with interventions, thus taking many years to reintegrate fully or become reincluded within mainstream society.
Why it is important to do this review
We conducted this review to assess the effectiveness of interventions for improving outcomes among street‐connected children and young people, and for reducing risks of the most adverse outcomes; and to promote access to and integration into education, training and employment opportunities and more healthy and settled lifestyles. Such lifestyles include access to universal human rights such as survival, development, participation and inclusion, although these may be difficult to measure.
By addressing the above‐mentioned outcomes, we explicitly aimed to synthesise the evidence on reintegration approaches, including harm‐reduction programmes. We propose to focus on inclusion, reintegration and harm‐reduction interventions targeted at children and young people while they are living on, or closely connected to, the streets.
We used the World Health Organization (WHO) definition of inclusion. Although a little dated, its principles remain valid in that primary aims of policies and actions aimed at reversing exclusionary processes should be to:
-
promote full and equal inclusion in social systems;
-
provide universal access to living standards that are socially acceptable to all members of a society, including access to the same level and quality of health and educational services, safe water, sanitation and ‘decent work’, as defined by the International Labour Organization (ILO);
-
respect and promote cultural diversity; and
-
address unequal inclusion as well as situations of extreme exclusion (WHO SEKN 2008).
We believe that the results of this systematic review are relevant to a large number of street‐connected children and young people worldwide. We examined interventions that enable children to live safe and healthy lives that promote their rights and support their pathways to adulthood. We highlighted gaps in the current evidence base. For the purposes of this review, we defined reintegration as entry of children and young people into a residential or educational environment that has the potential to provide them with elements of physical safety, medical care, nutrition, counselling, education, inclusion in social and economic opportunities and room for recreation and personal and spiritual growth that may impact positively on longer‐term life chances. Reintegration does not mean returning children to situations from which they may have escaped. Family reintegration is potentially a highly valuable outcome for many street‐connected children and young people. However, the effectiveness and the ethical implementation of interventions aimed at family reintegration are based on access to appropriate resources for assessment, support and follow‐up, in recognition of the potentially significant risks associated with processes of family reintegration (Feeny 2005; Thoburn 2009).
‘Harm reduction’ is an umbrella term that is used to describe interventions aimed at reducing harms associated with lifestyles of street‐connected children and young people, including, for example, those associated with early or risky sexual activity and substance use (UNICEF 2001b). Expressed in general terms, these would include interventions aimed at street‐connected children and young people to protect and promote their welfare and well‐being while they are on the street, so that they can benefit from more focused reintegration approaches when it is appropriate and possible for them to do so. All long‐term recommendations that we found at the UNICEF evaluation database are structural. However, short term recommendations from UNICEF are based on principles of child protection that can be described as matching the harm‐reduction approach. This theory is open to interpretation but seems to be in line with the opinions of people working with street‐connected children and young people who were consulted by members of our team; protection may be a necessary stage on the path to reintegration, alongside development and participation.
We identified through a scoping search few rigorous reviews on the effectiveness of interventions to support street‐connected children and young people. Descriptive reviews of interventions that incorporate literature on lower/middle‐income and low‐income countries include Dybicz 2005, Karabanow 2004, Peters 2004, Slesnick 2009 and Thomas de Benitez 2011. Moore 2005 and Sanabria 2006 present descriptive reviews focused exclusively on interventions based in the United States. These reviews provide useful analyses and classifications of the literature, but their search strategies often are poorly described or limited in scope. Furthermore, they do not provide rigorous evaluations of studies.
We identified one review described as systematic (Altena 2010) that included interventions for ‘homeless youth’, in which studies were reported to have been systematically rated for quality with a consistent tool. This review is recent and sought to include literature from developing countries (language criteria not specified). It searched the following databases ‐ PsycINFO, Education Resource Information Center (ERIC), MEDLINE, The Cochrane Library, Google Scholar, EMBASE and Cumulative Index to Nursing and Allied Health Literature (CINAHL) ‐ for studies conducted between 1985 and 2008. Of 557 unique search results, we included 12 studies for final evaluation, none of which were conducted in LMICs. In comparison, the current systematic review was considerably broader in scope, in terms of both the number of databases searched and the breadth of our search terms. However, to avoid duplication, our systematic review takes into account the existence of a Cochrane review on HIV/acquired immunodeficiency syndrome (AIDS) prevention with homeless youth (Naranbhai 2011), as discussed below.
Review update
This review update identified seven descriptive reviews or systematic reviews of relevance to street‐connected children and young people, as well as 16 reviews focused on interventions of some relevance to the review populations. Xiang 2013 focused on substance abuse interventions and largely concurred with the conclusions of our original systematic review. Berckmans 2013 focused on services provided in LMICs and included qualitative literature similar to our thematic synthesis of engagement‐related factors discussed in LMIC qualitative literature (Coren 2014; Coren 2015). We searched a recent systematic review of non‐formal education for street‐connected children and youth (Shephard 2014) to find studies eligible for our review, but we identified none.
In addition to our thematic synthesis, we conducted an exploratory summary of quantitative data related to service engagement in relevant HIC interventions included in our systematic review and identified through a search update (Hossain 2014), complementing a systematic review of outreach strategies for street‐connected youth (Connolly 2012).
The growing evidence base on interventions for homeless and street families with children in HICs led us to the decision to consider this population in a separate Cochrane review, for which the title registration is being prepared.
Objectives
Primary research objectives
To evaluate and summarise the effectiveness of interventions for street‐connected children and young people that aim to:
-
promote inclusion and reintegration;
-
increase literacy and numeracy;
-
facilitate access to education and employment;
-
promote mental health, including self esteem; and
-
reduce harms associated with early sexual activity and substance misuse.
Furthermore, to explore processes of successful intervention and models of change in this area with the goal of explaining how effectiveness of interventions may vary in different contexts.
Secondary research objectives
-
To explore whether effects of interventions differ within and between populations, and whether an equity gradient influences these effects, by extrapolating from all findings relevance for low‐ and middle‐income countries (LMICs) (Peters 2004).
-
To describe other health, educational, psychosocial and behavioural effects, when appropriate outcomes are available.
-
To explore the influence of context in design, delivery and outcomes of interventions.
-
To explore the relationship between number of components and duration and effects of interventions.
-
To highlight implications of these findings for further research and research methods to improve knowledge of interventions in relation to the primary research objective.
This review also aimed to consider potential adverse or unintended outcomes.
Methods
Criteria for considering studies for this review
Types of studies
Interventions targeting (and measuring) outcomes for street‐connected children and young people have used a variety of approaches and designs. We included randomised controlled trials (RCTs), clinical controlled trials (CCTs), controlled before‐and‐after trials (CBAs) and quasi‐randomised trials. Quasi‐randomised trials are studies that allocated children and young people to treatment or control conditions depending on methods determined as not truly randomised, for example, on their date of birth or the day of the month they entered the intervention site. Some other quasi‐randomised designs, such as regression discontinuity designs, were also eligible for inclusion in this review.
We did not include qualitative data in our outcomes synthesis. However, we used qualitative intervention evaluations to design the original logic model and continued to develop the logic model with the help of qualitative data and identified included studies as the review progressed. We also sought qualitative data, including sibling or companion studies of included quantitative studies, to illuminate the impact of context and mechanisms of change and process factors. We did not conduct separate searches for qualitative literature other than for companion studies of included studies and those needed to highlight particular questions arising in relation to context, mechanisms, process, etc., according to themes outlined in the logic models. We sought some materials from studies retrieved by the search but not included in the review to discuss process and contextual factors, as well as issues of generalisability of findings to LMIC contexts.
For this review, included studies required a comparator, such as groups that did not receive an intervention, received standard practice interventions, or received a different type of intervention.
Types of participants
We included all studies that focused on street‐connected children and young people between birth and 24 years of age (inclusive), consistent with the United Nations (UN) definition of youth as those 15 to 24 years of age, regardless of location, reason for street connectedness or gender. Potential research participants included street‐connected children and young people; their families and carers; professionals working with children, young people and their families; the police; and employers.
Street‐connected children and young people and, in cases of family‐focused interventions their families and carers, were the recipients of interventions. We did not include studies unless they reported separate outcomes data on street‐connected children and young people in the context of systemic interventions.
Families and carers, the community, employers and professionals can be an important part of the ‘input’ component of the intervention to the extent that they are needed to support the intervention and are part of it. Our definition of professionals and the community included non‐governmental organisations (NGOs), faith‐based organisations, orphanages, social workers and police.
For the purposes of this review, we defined street‐connected children as in the Description of the condition section above: children and young people who live and work on the street or in public spaces, work on the street and return to family homes or hostels at night or live both ways at different times. For the most part, individuals experienced complex social and economic circumstances that ‘defy easy definition’ (Thomas de Benitez 2011). Current thinking sees this process as non‐linear, with many street‐connected children and young people transitioning off the streets more than once, with this also a non‐linear process.
Types of interventions
The intention was to include any interventions that:
-
involved harm‐reduction, inclusion or reintegration programmes for street‐connected children and young people, were intended to reduce harms associated with risky sexual activity and substance misuse and promoted inclusion and reintegration;
-
increased literacy, numeracy and self esteem;
-
increased participation in education and skills‐based employment; and
-
provided shelter, housing and drop‐in support.
We planned to include any type of intervention including behavioural, social, policy, structural or other interventions explicitly aimed at reducing risky sexual activity and substance misuse. Interventions may be delivered to individuals, families, small groups or entire communities. Furthermore, with increased recognition of the complexity of the issues facing many street‐connected young people, researchers have focused on multi‐faceted interventions that incorporate a range of approaches, including housing, education, training and health (Thomas de Benitez 2008).
Types of outcome measures
A recent Cochrane review and a systematic review conducted for the World Health Organization (WHO) have evaluated AIDS and HIV as target outcomes (Naranbhai 2011; Ross 2006); therefore, we did not include AIDS and HIV risks as outcome variables. However, we assessed the degree to which the studies included in these reviews overlapped with our scope and population and, when relevant, we considered the trends apparent in the results of these reviews when interpreting the results of our review.
Primary outcomes
Primary outcomes were inclusion and reintegration. We define reintegration as the children and young people entering a residential and/or educational environment that has the potential to provide them with elements of physical safety, medical care, nutrition, counselling, education, inclusion in social and economic opportunities and room for recreation and personal and spiritual growth that may impact positively on longer‐term life chances. According to this definition, reintegration does not mean returning children to situations from which they may have escaped, even when this may allow family reintegration.
Secondary outcomes
We also extracted analysable data for the following related measures of health, well‐being and educational and occupational achievement.
-
Safer or reduced sexual activity.
-
Safer or reduced substance use (e.g. reduced sharing of injection equipment).
-
Increased use of hostel or shelter‐type services.
-
Literacy.
-
Numeracy.
-
Self esteem.
-
Depression.
-
Participation in education.
-
Participation in skills‐based (rather than exploitative) employment.
-
Reduced use of violence.
-
Increased contact with family.
-
Participation in intervention planning and delivery.
We included intervention studies if they aimed to achieve any of the listed primary or secondary outcomes, or both. We found secondary objectives to be particularly relevant, as most interventions were administered within an existing service setting.
Process measures
We extracted measures related to the process of implementing an intervention and intervention approaches, when reported. We also extracted information consistent with the process characteristics listed in the original logic model with the goal of developing an explanatory framework.
We have included a descriptive map of all studies considered for eligibility for inclusion in the review, to present as fully as possible a description of the existing evidence base on this topic. This map is included as an adjunct to the main review in the interest of ensuring completeness of data, rather than for use as a tool for narrowing the focus of the review (Appendix 1).
Search methods for identification of studies
We worked with information specialists from Campbell’s International Development Co‐ordinating Group and the Cochrane Musculoskeletal Group, which is co‐located with the Cochrane Campbell Equity Methods Group, and, informed by their search expertise, we developed a search strategy. We used guidance from Chapter 6 of the Cochrane Handbook for Systematic Reviews of Interventions (Higgins 2011) and methods from the guide to information retrieval for systematic reviews of the Information Retrieval Methods Group of the Campbell Collaboration (Hammerstrøm 2010). We applied no language restrictions.
We developed the search for Ovid MEDLINE and modified it for use in other databases. We identified 44,800 items from all relevant databases (see Appendix 2). We imported all references into RefWorks and tagged each with the name of the database. We removed duplicates within RefWorks, leaving the final total of studies obtained from the electronic databases at 25,906. See the PRISMA (Preferred Reporting Items for Systematic Reviews and Meta‐Analyses) diagram in Figure 3. We last updated the search in April 2015.
Electronic searches
We searched the following bibliographic databases for eligible empirical studies.
-
Cochrane Central Register of Controlled Trials (CENTRAL) (database inception to search date).
-
MEDLINE and Pre‐MEDLINE (1948 to search date).
-
EMBASE and EMBASE Classic (1947 to search date).
-
Cumulative Index to Nursing and Allied Health Literature (CINAHL) (1966 to search date).
-
PsycINFO (1806 to search date).
-
Education Resource Information Center (ERIC) (1950 to search date).
-
Sociological Abstracts (1952 to search date).
-
Social Services Abstracts (1979 to search date).
-
Social Work Abstracts (1977 to search date).
-
HealthSTAR (1966 to search date).
-
Latin American Caribbean Health Sciences Literature (LILACS) (database inception to search date).
-
System for Grey Literature in Europe (OpenGrey) (database inception to search date).
-
ProQuest Dissertations and Theses (database inception to search date).
-
EconLit (1969 to search date).
-
IDEAS Economics and Finance Research (database inception to search date).
-
JOLIS Library Catalog of the holdings of the World Bank Group and International Monetary Fund (IMF) Libraries (database inception to search date).
-
British Library for Development Studies (BLDS) (1987 to search date).
-
Google, Google Scholar.
Searching other resources
We screened items suggested by experts, advisory group members and authors of included studies, including companion studies. We also checked reference lists of included studies obtained from the electronic database search and contacted all authors of included studies to ask about unpublished or ongoing studies. We used search terms from the electronic search that described our population and adapted them as appropriate to search the Internet‐based resources. We used included studies to perform a citing studies search using SCOPUS or Web of Science and the related article function of PubMed to track references to included articles, relevant reviews and annotated bibliographies.
We conducted a targeted Internet search at the following relevant sites.
-
Abdul Latif Jameel Poverty Action Lab (J‐PAL) website.
-
United Nations Children's Fund (UNICEF) database of evaluations.
-
Eldis (http://www.eldis.org/).
-
Department for International Development (http://www.dfid.gov.uk/).
-
Inter‐American Development Bank (http://www.iadb.org).
-
Asian Development Bank (http://www.adb.org).
-
African Development Bank (http://www.afdb.org).
Data collection and analysis
Selection of studies
We screened the results of the original search using EROS (Encyclopedia of Reagents for Organic Synthesis) software according to the following categories: Effectiveness study: probability of inclusion; Evaluation study with other study designs; Ethnography or other qualitative studies; Excluded: related to street children but not evaluating effectiveness; Narrative review; Excluded: not related to street children; Non‐English language studies (which were assessed separately for inclusion). Most studies were excluded because they clearly did not meet eligibility criteria for the review. Of all studies screened in EROS, at least one review author assessed 57 as potentially eligible (the first category), and at least two review authors screened their full‐text articles (when available) according to the criteria specified in the protocol. We resolved disagreements through discussion with a third review author (EC). Of these, we included 10 studies in the review.
Additionally, the review authors classified a total of 50 of the original 15,995 records as narrative reviews. Two review authors obtained and scanned full‐text documents for these. Through this process, we identified 108 references as potentially eligible for inclusion. After comparison with the existing database, we reviewed 40 records by full text and included one of these in the review.
The PRISMA flowchart, now updated with total figures from the original review together with the 2015 update, displays this process visually (Figure 3).
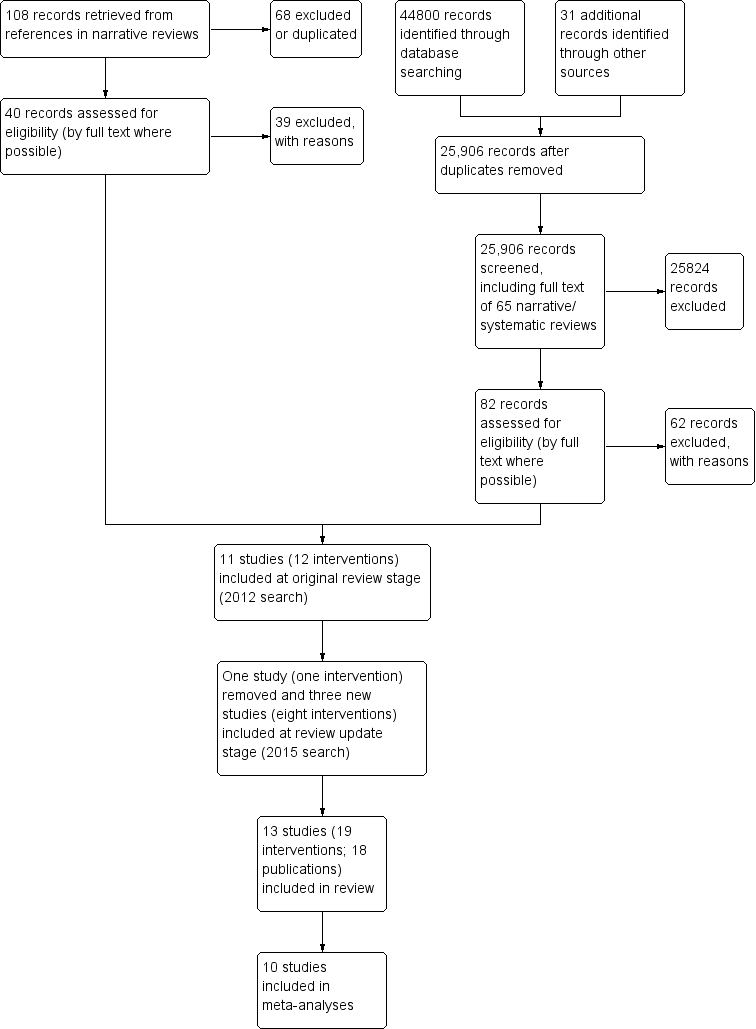
Study flow diagram.
We could not obtain the full text for most of the MA and PhD theses, so we screened only abstracts for these.
Companion studies
We also undertook a separate search of the databases specified in the review to look for qualitative and quantitative studies associated with the 14 studies included in the review. This search strategy consisted of the following.
-
A search for qualitative studies solely by subject (street children) and topic terms (evaluation of interventions) with study type(s) of interest not specified.
-
A search for qualitative or quantitative studies by authors and co‐authors of included studies on ‘street children’ to find directly related studies (e.g. same study but measuring different outcomes), as well as follow‐up and ongoing studies.
Data extraction and management
We included all studies considered eligible for the review. Two independent review authors (of RH, HH, AM, MV at original review and RH and BB at update) extracted data from eligible studies and inserted them onto standardised data collection forms; we then entered the data into Review Manager 5 via double‐data entry (RevMan 2011). We tailored data extraction to the requirements of the review, using the PROGRESS II checklist as developed by the Cochrane‐Campbell Equity Methods Group (Kavanagh 2008), while working within the logic model. We assembled and compared multiple reports and publications of the same study for completeness and possible contradictions. We found no companion studies that reported findings on evaluation of the intervention process. Three review authors had piloted the data extraction form to assess its ability to capture study data and inform assessment of study quality. We resolved identified problems through discussion and revised the form appropriately.
Assessment of risk of bias in included studies
Two review authors assessed risk of bias using the Cochrane 'Risk of bias' tool with retrieved study reports and raised additional queries with study authors when further information was required. Review authors resolved disagreements in risk of bias assessments by discussion. We assessed the risk of selection, performance, attrition and detection bias. We evaluated and rated as ‘high’, ‘low’ or ‘unclear’ the risk associated with sequence generation; allocation concealment; blinding of participants, personnel and outcomes; incomplete outcome data; selective outcome reporting; and other sources of bias. We produced a 'Summary of findings' table that describes the quality of the evidence as assessed by GRADE (Grades of Recommendation, Assessment, Development and Evaluation) criteria. It was not possible to include individually in the summary of findings Table for the main comparison the large number of outcomes reported, so we have presented only some summaries. We have also discussed risk of bias assessments in the main text discussion.
Measures of treatment effect
Only one study reported dichotomous outcomes (Nyamathi 2012/13 AM; Nyamathi 2012/13 HPP). We used the mean difference (MD) between post‐test values of intervention and control groups to analyse the size of intervention effects for continuous outcomes. For outcomes measured on different scales, we used the standardised mean difference (SMD).
When possible, we reported continuous outcomes on the original scale. We standardised outcomes measured on different scales as required for the analysis. We conducted a meta‐analysis only when the data were sufficiently similar. When data were available, sufficiently similar in outcomes and time points and of sufficient quality, we performed statistical analyses using Review Manager 5 software (RevMan 2011). We did not combine in the same forest plot evidence derived from studies using different study designs and outcome types.
Unit of analysis issues
To avoid double‐counting when studies presented results for several periods of follow‐up, we undertook separate meta‐analyses for various time points: immediate post‐test, six‐month follow‐up and 12‐month follow‐up. When a study presented data from a time point different from that of other studies, we presented these data separately.
When multiple treatment and control group types were presented in study reports, we aimed to present the data from each study as consistently as possible by presenting the primary comparison of treatment group versus control group. When a study compared two interventions against one control group, the control group number was halved for each comparison to avoid double‐counting of participants. We found no eligible cluster designs during searches for this review, although Rotheram‐Borus 2003 randomly assigned shelters rather than individuals. We included no data from this study in meta‐analyses.
None of the studies at update stage included a service as usual (SAU) or no treatment control group (Carmona 2014/Slesnick 2015 CM; Carmona 2014/Slesnick 2015 CRA; Carmona 2014/Slesnick 2015 HIV; Carmona 2014/Slesnick 2015 MET; Nyamathi 2012/13 AM; Nyamathi 2012/13 HPP; Slesnick 2013/Guo 2014 CRA; Slesnick 2013/Guo 2014 EBFT; Slesnick 2013/Guo 2014 MET). For each of these, we selected a group receiving an intervention deemed closest to SAU conditions in the original review, and we split the numbers in the identified group between intervention groups. We made this decision in consultation with the Cochrane Public Health Review Group and the Cochrane Central Editorial Unit.
Dealing with missing data
As a result of the fluctuating nature of attendance at likely programmes, we did not exclude studies according to extent of incomplete data for assessment. We incorporated this information both narratively and in the risk of bias assessment. At the data extraction stage, if missing data were unclear or were not fully reported, we contacted the study authors. In general, we reported the occurrence of missing data both on the data extraction form and in the risk of bias table; the data extraction form also captured when missing data were retrieved.
Assessment of heterogeneity
We assessed heterogeneity mainly by gathering extensive details of the characteristics of included studies. We assessed statistical heterogeneity by using the I2 statistic and by visually inspecting graphs. We learned details of mixed intervention effects and have discussed sources of heterogeneity extensively in the review text (discussion), with emphasis on equity‐relevant factors.
Assessment of reporting biases
We have narratively addressed the imbalance between HICs and LMICs within included studies in both conduct of evaluations and publication of reports. We found insufficient studies for preparation of a useful funnel plot, so we did not prepare this.
Studies selected included randomised controlled trials (RCTs), as well as controlled before‐and‐after studies (CBAs) and other non‐randomised designs that included a control or comparison group (but not those with a convenience comparison group; all control groups were randomly assigned or propensity scores were used to balance baseline differences). We assessed risk of bias by using the Cochrane 'Risk of bias' tool. We have discussed in the Discussion section confounding aspects of populations, interventions and settings.
Data synthesis
When data were available, and when outcomes of sufficient quality were measured in similar ways, we performed statistical analyses using Review Manager 5 software (RevMan 2011) and a random‐effects model. We did not combine in the same forest plot evidence from studies using different designs and outcome types. We assessed similarity of data according to types of outcomes measured and time points of measurement. For this review, we included all interventions in the same meta‐analyses.
We analysed data from all studies, including those not included in the meta‐analysis, according to features of the logic model as extracted through the data extraction process. We grouped data according to outcomes of interventions and discussed contexts, particularly regarding income status and cultural environment of different countries included in the review. We further considered groupings around age, gender, ethnicity and, when possible, reasons why children and young people were street‐connected (e.g. migration status, economic activity, history of abuse).
We made the decision to include all endpoint data up to six months with data from more than one study across outcomes. Most frequently, these data were collected at three months and six months from the start of the intervention. We reported narratively longer‐term follow‐up data, measured across studies at nine, 15 or 24 months following the intervention, as we identified an insufficient number of studies for inclusion in the meta‐analysis. We added 12‐month data at update as new studies included this time point, and when sufficient data were available, we included data from relevant time points for other studies included in the original iteration of the review.
None of the studies at update stage included an SAU or no treatment control group (Carmona 2014/Slesnick 2015 CM; Carmona 2014/Slesnick 2015 CRA; Carmona 2014/Slesnick 2015 HIV; Carmona 2014/Slesnick 2015 MET; Nyamathi 2012/13 AM; Nyamathi 2012/13 HPP; Slesnick 2013/Guo 2014 CRA; Slesnick 2013/Guo 2014 EBFT; Slesnick 2013/Guo 2014 MET). For each of these, we selected a group receiving an intervention deemed closest to SAU conditions in the original review, and we split the numbers for the identified group between intervention groups, as previously. We discussed this approach with the Cochrane Public Health Review Group and with the Cochrane Central Editorial Unit.
When the same scale was used, we performed a random‐effects model analysis of mean differences (MDs). When different scales were used, the effect size was based on a random‐effects model analysis of standardised mean differences (SMDs). We have summarised in Table 1 details of included outcomes, including measures used and time points measured.
| Number* | Outcome name | Study | Measure | ≤1 month | 3 months | 6 months | 12 months |
| Number of times participant had sex in last 90 days | HRQ | x | x | ||||
| Own | x | x | |||||
| Number of sexual partners | HRQ | x | x | ||||
| Own | x | x | |||||
| Alcohol use (number of days in last 30 days) | TLFB | x | x | ||||
| TLFB | x | x | |||||
| Alcohol use (% days in last 90 days) | Form 90 | x | x | x | |||
| Form 90 | x | ||||||
| Form 90 | x | ||||||
| Form 90 | x | x | x | ||||
| Form 90 | x | x | x | ||||
| Form 90 | x | x | x | ||||
| Number of standard drinks (in last 90 days) | Form 90 | x | |||||
| Form 90 | x | ||||||
| Alcohol use (total score) | ADI | x | |||||
| ADI | x | ||||||
| Alcohol/drug use (% days in last 90 days) | Form 90 | x | |||||
| Form 90 | x | ||||||
| Form 90 | x | ||||||
| Form 90 | x | x | x | ||||
| Form 90 | x | x | x | ||||
| Form 90 | x | x | x | ||||
| Only/any drug use (% days in last 90 days) | Form 90 | x | x | x | |||
| Form 90 | x | ||||||
| Form 90 | x | ||||||
| Form 90 | x | x | x | ||||
| Form 90 | x | x | x | ||||
| Form 90 | x | x | x | ||||
| Marijuana use (number of days in last 30 days) | TLFB | x | x | ||||
| TLFB | x | x | |||||
| Drug use other than marijuana (number of days in last 30 days) | TLFB | x | x | ||||
| TLFB | x | x | |||||
| Number of problem consequences | POSIT | x | x | ||||
| POSIT | x | ||||||
| POSIT | x | ||||||
| POSIT | x | ||||||
| Number of substance use diagnoses | CDISC | x | |||||
| CDISC | x | ||||||
| Number of categories of drug use (last 90 days) | Form 90 | x | |||||
| Form 90 | x | ||||||
| Self esteem | RSES | x | |||||
| SEI | x | ||||||
| Depression | RADS | x | |||||
| BDI | x | ||||||
| BDI | x | x | x | ||||
| BDI | x | ||||||
| BDI | x | ||||||
| BDI | x | ||||||
| BDI | x | x | x | ||||
| BDI | x | x | x | ||||
| BDI | x | x | x | ||||
| BDI | x | x | x | ||||
| BDI | x | x | x | ||||
| BDI | x | x | x | ||||
| Verbal aggression (youth) | CTS | x | |||||
| CTS | x | ||||||
| CTS | x | ||||||
| Family violence (youth) | CTS | x | |||||
| CTS | x | ||||||
| CTS | x | ||||||
| Days living at home (% days in last 90 days) | Form 90 | x | |||||
| Form 90 | x | ||||||
| Delinquent behaviours | YSR | x | |||||
| DSM‐IV | x | x | x | ||||
| NYSDS | x | x | x | ||||
| NYSDS | x | ||||||
| NYSDS | x | ||||||
| NYSDS | x | ||||||
| Internalising problems | YSR | x | |||||
| YSR | x | x | x | ||||
| YSR | x | ||||||
| YSR | x | ||||||
| YSR | x | ||||||
| YSR | x | x | x | ||||
| YSR | x | x | x | ||||
| YSR | x | x | x | ||||
| YSR | x | x | x | ||||
| YSR | x | x | x | ||||
| YSR | x | x | x | ||||
| Externalising problems | YSR | x | |||||
| YSR | x | x | x | ||||
| YSR | x | ||||||
| YSR | x | ||||||
| YSR | x | ||||||
| YSR | x | x | x | ||||
| YSR | x | x | x | ||||
| YSR | x | x | x | ||||
| YSR | x | x | x | ||||
| YSR | x | x | x | ||||
| YSR | x | x | x | ||||
| Number of psychiatric diagnoses | CDISC | x | |||||
| CDISC | x | ||||||
| CDISC | x | ||||||
| Family cohesion | FES | x | |||||
| FES | x | ||||||
| FES | x | ||||||
| Family conflict | FES | x | |||||
| FES | x | ||||||
| FES | x | ||||||
| Parental care | PBI | x | |||||
| PBI | x | ||||||
| PBI | x | ||||||
| Parental overprotectiveness | PBI | x | |||||
| PBI | x | ||||||
| PBI | x | ||||||
| Number | Outcome name | Study | Measure | ≤1 month | 3 months | 6 months | 12 months |
| Gaps occur when absence of relevant data was noted in relation to particular outcomes defined in the protocol | |||||||
In addition, we performed a change from baseline calculation for each included outcome at each included time point by subtracting the group mean at follow‐up from the group mean at baseline for both intervention and control groups. Review authors rather than study authors calculated all change scores reported in the review (Appendix 2). These figures should be interpreted with caution as they do not account for standard deviation or group size and the number of missing participants.
Additionally, although most studies presented relevant outcome data for the same number of participants at each time point, including baseline (i.e. missing cases were excluded from the analyses), in some studies, numbers varied between time points. Our change scores do not account for these discrepancies. Nevertheless, we believe they give a reasonable indication of certain important effects not captured by comparisons of means and standard deviations at fixed follow‐up time points. In particular, they help to demonstrate that in many cases, the scores for both groups improved from baseline, which may appear as no difference between groups in a meta‐analysis of endpoint data, or indeed as a benefit for the control group.
Outcomes not included in meta‐analysis
Numerous outcomes reported in the included studies were not included in the meta‐analysis because of differences in types of measurements or time points or because we were unable to access the data; however, they are listed under outcomes in the Results section of this review and in Appendix 3. When possible, we have added these outcomes to the narrative report of outcome data included in the review to enable better cross‐referencing of more synthesised results across studies.
Subgroup analysis and investigation of heterogeneity
We hoped to include subgroups for analysis by age, gender, location of studies, HICs and LMICs and intervention approaches, to inform logic models and the development of possible theories arising from the review. However, data were insufficient for this.
Sensitivity analysis
We conducted sensitivity analyses at update stage to assess the impact on study results at update stage, given that none of these included an SAU condition. We conducted meta‐analyses in each case without each new study in turn to assess the impact of the lack of SAU on study results. Results of these analyses at update seemed to show benefit for the control group when the new (update stage) studies were added, and a smaller overall effect. One possible reason for this may have been that 'control' group numbers in these studies were split between the different intervention groups to avoid double‐counting of participants in the analyses, potentially explaining the reduced weight attributed to these studies in the meta‐analysis. Relevant meta‐analyses from which data from new studies were added included Analysis 2.3; Analysis 2.4; Analysis 2.5; Analysis 2.8; Analysis 2.9; Analysis 2.10; Analysis 2.11; Analysis 2.12; Analysis 2.13; Analysis 4.1; Analysis 4.2; Analysis 4.3; Analysis 8.1; Analysis 8.2; Analysis 8.3; Analysis 8.4; Analysis 8.5; and Analysis 8.6.
Results
Description of studies
Relevant tables can be found under Characteristics of included studies and Characteristics of excluded studies.
Results of the search
Our search yielded a total of 44,800 records, leaving 25,906 records after removal of duplicates.
For the original review, at least one review author independently classified 57 studies in the first classification category of EROS ('probability of inclusion'), according to the categories described under Selection of studies.
At update stage, we screened search results using Eppi Reviewer‐4 software, and similarly coded 25 references as potentially eligible. We reviewed potentially eligible records by full text, when possible, and included 13 studies (18 publications) in the review. Of these, three studies (eight interventions) were included at review update stage (Carmona 2014/Slesnick 2015 CM; Carmona 2014/Slesnick 2015 CRA; Carmona 2014/Slesnick 2015 HIV; Carmona 2014/Slesnick 2015 MET; Slesnick 2013/Guo 2014 CRA; Slesnick 2013/Guo 2014 EBFT; Slesnick 2013/Guo 2014 MET; Slesnick 2013/Guo 2014 CRA; Slesnick 2013/Guo 2014 EBFT; Slesnick 2013/Guo 2014 MET). One previously included study (Tischler 2002) was removed (see Differences between protocol and review). We included two studies as ongoing at the review update stage (see Ongoing studies).
We originally identified 108 additional records from 68 records classified in EROS as narrative reviews. After removing duplicates, screening by abstract and checking against the search database, we sought the full text for 40 of these, one of which was included in the review and one was included as an ongoing study (included in the review at update).
At update stage, we scanned 16 systematic reviews for references but found none that were eligible. We obtained from the study authors contacted no additional relevant references for ongoing studies. We also reviewed 231 non‐English language records and sought full text for 10 of these. One was eligible for inclusion in the review, but we were not able to obtain a full translation of the study in time (Dousti 2014) (see also PRISMA flow diagram at Figure 3).
For the original version of this review, all records reviewed by full text were also considered for eligibility for a descriptive map (Appendix 1), with selection criteria allowing inclusion of a broader range of study designs. Unlike the review, this map included several studies from LMICs. Of 60 references considered potentially eligible, we included 30 in the mapping exercise (including the 11 studies included in the original version of this review) and excluded 30. Of the 60 references, we excluded 48 references from this review (see Characteristics of excluded studies). In effect, the descriptive map described in greater detail included and excluded studies described in the original version of this review. We did not conduct mapping at update stage.
In total, we included 13 studies in the review. Data from 10 studies were available for meta‐analysis, and we described narratively findings from the three remaining studies.
The search for companion studies revealed two relevant publications (Slesnick 2006; Slesnick 2006c). Both papers present post hoc quantitative analyses of combinations of data from Slesnick 2005, Slesnick 2009 EBFT and Slesnick 2009 FFT.
Included studies
Study characteristics
Thirteen studies (18 publications; 19 interventions) met the inclusion criteria of the review (Baer 2007; Carmona 2014/Slesnick 2015 CM; Carmona 2014/Slesnick 2015 CRA; Carmona 2014/Slesnick 2015 HIV; Carmona 2014/Slesnick 2015 MET; Cauce 1994; Hyun 2005; Milburn 2012; Nyamathi 2012/13 AM; Nyamathi 2012/13 HPP; Peterson 2006; Rew 2007; Rotheram‐Borus 2003; Slesnick 2005; Slesnick 2007/08; Slesnick 2009 EBFT; Slesnick 2009 FFT; Slesnick 2013/Guo 2014 CRA; Slesnick 2013/Guo 2014 EBFT; Slesnick 2013/Guo 2014 MET). Of these, 11 studies were classed as RCTs, one as a CBA (Rotheram‐Borus 2003) and one as a quasi‐RCT (Rew 2007). The first two published studies appeared with a gap of eight years. The remaining studies were published at relatively even intervals between 2002 and 2015.
We successfully contacted all first authors. However, authors for the Nyamathi 2012/13 AM, Nyamathi 2012/13 HPP, Rotheram‐Borus 2003 and Rew 2007 studies were not able to provide relevant raw data on measured outcomes. Therefore, we did not include data from these three studies in our analysis, but we referred to relevant findings in our discussion. Also of note is the fact that five of the included studies were conducted by research teams headed by Professor N. Slesnick (Carmona 2014/Slesnick 2015 CM; Carmona 2014/Slesnick 2015 CRA; Carmona 2014/Slesnick 2015 HIV; Carmona 2014/Slesnick 2015 MET; Slesnick 2005; Slesnick 2007/08; Slesnick 2009 EBFT; Slesnick 2009 FFT; Slesnick 2013/Guo 2014 CRA; Slesnick 2013/Guo 2014 EBFT; Slesnick 2013/Guo 2014 MET). As three of these (Carmona 2014/Slesnick 2015 CM; Carmona 2014/Slesnick 2015 CRA; Carmona 2014/Slesnick 2015 HIV; Carmona 2014/Slesnick 2015 MET; Slesnick 2009 EBFT; Slesnick 2009 FFT; Slesnick 2013/Guo 2014 CRA; Slesnick 2013/Guo 2014 EBFT; Slesnick 2013/Guo 2014 MET) involved two or more separate intervention groups, 10 of the 19 intervention groups included in the analysis were described in studies directed by Slesnick, with exclusion of two HIV‐related co‐interventions.
All studies were conducted in the United States, with the exception of Hyun 2005, which took place in Korea. We were not able to identify any studies in LMICs that met all of our inclusion criteria, although two studies met some of our criteria (Crombach 2014; Olley 2007). Slesnick interventions were located in inner‐city Ohio or Albuquerque, New Mexico (Slesnick 2005; Slesnick 2007/08; Slesnick 2009 EBFT; Slesnick 2009 FFT). Other US studies were located in Seattle, Washington (Cauce 1994; Peterson 2006); Los Angeles and San Bernardino, California (Milburn 2012); Santa Monica, California (Nyamathi 2012/13 AM; Nyamathi 2012/13 HPP); Texas (Rew 2007); and New York (Rotheram‐Borus 2003). Baer 2007 specified no location, but similar to Peterson 2006, the study authors (who included the first author of Peterson 2006) were based at the University of Washington. Hyun 2005 was conducted in Seoul, Korea.
Interventions consisted of individual‐oriented (Baer 2007; Carmona 2014/Slesnick 2015 CM; Carmona 2014/Slesnick 2015 CRA; Carmona 2014/Slesnick 2015 HIV; Carmona 2014/Slesnick 2015 MET; Cauce 1994; Peterson 2006; Slesnick 2007/08; Slesnick 2013/Guo 2014 CRA; Slesnick 2013/Guo 2014 MET), group‐based (Hyun 2005; Nyamathi 2012/13 AM; Nyamathi 2012/13 HPP; Rew 2007; Rotheram‐Borus 2003; ) and family‐based (Milburn 2012; Slesnick 2005; Slesnick 2009 EBFT; Slesnick 2009 FFT; Slesnick 2013/Guo 2014 EBFT; Slesnick 2013/Guo 2014 EBFT) approaches. Several interventions (Cauce 1994; Rotheram‐Borus 2003; EBFT intervention in Slesnick 2005; Slesnick 2009 EBFT; Slesnick 2013/Guo 2014 EBFT) consisted of multiple components and involved liaison with external service providers. Intervention length ranged from a single brief session to ‘on‐going’ treatment. In many cases, considerable variation between participants was noted for treatment attendance, duration of the intervention or both.
Baer 2007, Peterson 2006, Carmona 2014/Slesnick 2015 MET and Slesnick 2013/Guo 2014 MET adopted a motivational framework; Slesnick 2007/08, Carmona 2014/Slesnick 2015 CRA and Slesnick 2013/Guo 2014 CRA, a community reinforcement framework (incorporating behavioural, motivational and systemic approaches); Hyun 2005, a cognitive‐behavioural therapy (CBT) framework; Cauce 1994 and Carmona 2014/Slesnick 2015 CM, a multi‐component case management framework including individual therapy sessions; Slesnick 2005, Slesnick 2009 EBFT, Slesnick 2013/Guo 2014 EBFT, Slesnick 2009 FFT.and Milburn 2012, different forms of behavioural family intervention frameworks (ecologically based family therapy (EBFT), functional family therapy (FFT) and a cognitive‐behavioural family intervention, respectively); Rew 2007, a social cognitive framework; and Rotheram‐Borus 2003, a social cognitive, multi‐component framework. Some interventions by Slesnick's team offered an HIV intervention (Carmona 2014/Slesnick 2015 HIV; Slesnick 2007/08) in addition to the main intervention, which we have not counted as separate interventions. As no control group raw data were available for this intervention, we did not include in the review HIV‐related outcomes from this study. The study by Nyamathi compared a nurse‐delivered health intervention (Nyamathi 2012/13 HPP) versus an innovative, participatory arts‐based intervention (Nyamathi 2012/13 AM).
Most studies recruited participants through a shelter (Hyun 2005; Slesnick 2005; Slesnick 2009 EBFT; Slesnick 2009 FFT; Slesnick 2013/Guo 2014 CRA; Slesnick 2013/Guo 2014 EBFT; Slesnick 2013/Guo 2014 MET) or drop‐in service (Baer 2007; Carmona 2014/Slesnick 2015 CM; Carmona 2014/Slesnick 2015 CRA; Carmona 2014/Slesnick 2015 HIV; Carmona 2014/Slesnick 2015 MET; Cauce 1994; Nyamathi 2012/13 AM; Nyamathi 2012/13 HPP; Slesnick 2007/08). Three studies employed multiple strategies to engage a more representative population of street‐connected children and youth: Milburn 2012 recruited newly homeless youth from community‐based organisations (e.g. shelters, schools) as well as through direct recruitment (e.g. by flyers); Rew 2007 recruited participants via a street outreach centre and ‘word‐of‐mouth’, started by youth with a connection to the service; and Peterson 2006 recruited participants from street intercept locations (38%), through agencies (58%) and by methods such as flyers or ‘word‐of mouth’ (8%). Rotheram‐Borus 2003 did not provide information on the recruitment method used.
In the CBA study (Rotheram‐Borus 2003), the control group was based in an ‘equivalent’ setting (two shelters) that provided similar services to the agency or agencies from which the intervention population was recruited. In six studies (Baer 2007; Cauce 1994; Hyun 2005; Slesnick 2005; Slesnick 2007/08; Slesnick 2009 EBFT; Slesnick 2009 FFT), the control group and the intervention group were drawn from the same agency‐based population, and the control condition consisted of ‘service as usual’ provided by the agency. Furthermore, the agency also served as the intervention setting in all of the above studies, with the exception of Slesnick 2009 EBFT and Slesnick 2009 FFT (the two interventions in this study comprised functional family therapy (FFT), which was provided in an office location; or ecologically based family therapy (EBFT), which typically took place in the participant's parental home).
Three recent studies did not involve a service‐as‐usual (SAU) group but instead compared different interventions (Carmona 2014/Slesnick 2015 CM; Carmona 2014/Slesnick 2015 CRA; Carmona 2014/Slesnick 2015 HIV; Carmona 2014/Slesnick 2015 MET; Nyamathi 2012/13 AM; Nyamathi 2012/13 HPP; Slesnick 2013/Guo 2014 CRA; Slesnick 2013/Guo 2014 EBFT; Slesnick 2013/Guo 2014 MET). In each case, we selected one intervention group to be treated as the control condition in our meta‐analyses. For studies from Slesnick's group, we selected the motivational enhancement therapy (MET) intervention as the control because the intervention was briefer and narrower in scope than the others. This 'control' condition is similar to the interventions described in Baer 2007 and Peterson 2006. However, results of these studies are not directly comparable because different outcome measurement tools and time points were used. For the study by Nyamathi and colleagues, we selected the Health Promotion Programme (HPP) as the control condition because it was more conventional than the arts‐based intervention (AM).
In the three studies that recruited participants from mixed settings (Milburn 2012; Peterson 2006; Rew 2007), the intervention took place in ‘field‐site offices’ (Peterson 2006); at a site selected by the family, usually their home (Milburn 2012); or at an unspecified location organised through the street outreach programme (Rew 2007). These studies did not specify details of the control condition. Relevant background data, for example, on recruitment type, may have been collected in some pretest and post‐test assessments, but they were not systematically analysed or accounted for in these papers.
The total numbers of participants randomly assigned in the included studies were as follows (in ascending order): 32 (Hyun 2005); 115 (Cauce 1994)*; 117 (Baer 2007); 119 (Slesnick 2009 EBFT; Slesnick 2009 FFT); 124 (Slesnick 2005); 151 (Milburn 2012); 154 (Nyamathi 2012/13 AM; Nyamathi 2012/13 HPP); 179 (Slesnick 2013/Guo 2014 CRA; Slesnick 2013/Guo 2014 EBFT; Slesnick 2013/Guo 2014 MET); 180 (Slesnick 2007/08); 270 Carmona 2014/Slesnick 2015 CM; Carmona 2014/Slesnick 2015 CRA; Carmona 2014/Slesnick 2015 HIV; Carmona 2014/Slesnick 2015 MET); 285 (Peterson 2006); 311 (Rotheram‐Borus 2003)**; and 805 (Rew 2007)**.
*This figure represents the number of participants included in the analysis, as the total number was not provided for this study. **These participants were selected through quasi‐randomised methods.
All included studies were conducted in HICs. One study conducted in Iran and published in Farsi (Dousti 2014) is awaiting assessment at update stage, pending data extraction by a review author alongside a Farsi speaker. We assessed another study (Crombach 2014) conducted in Burundi for inclusion in the updated review, but clarification from study authors revealed that this study did not meet the inclusion criteria.
Population characteristics
Study populations were described in included studies as newly homeless youth (Milburn 2012), substance‐ or alcohol‐abusing runaway adolescents (Carmona 2014/Slesnick 2015 CM; Carmona 2014/Slesnick 2015 CRA; Carmona 2014/Slesnick 2015 HIV; Carmona 2014/Slesnick 2015 MET; Slesnick 2005; Slesnick 2009 EBFT; Slesnick 2009 FFT; Slesnick 2013/Guo 2014 CRA; Slesnick 2013/Guo 2014 EBFT; Slesnick 2013/Guo 2014 MET), runaways (Rotheram‐Borus 2003), runaway young men (Hyun 2005) and homeless adolescents or youth (Baer 2007; Cauce 1994; Peterson 2006; Rew 2007; Slesnick 2007/08). A diversity of inclusion and exclusion criteria were used across studies. For example, study populations in Slesnick 2005, Slesnick 2009 EBFT and Slesnick 2009 FFT were similar, except that the former investigators selected a population with a primary drug abuse profile, and the latter a population with a primary alcohol abuse profile.
Participant ages ranged from three to 25 years. Mean ages for participants were as follows (in ascending order): 14.8 (Milburn 2012); 14.8 (Slesnick 2005); 15.4 (Slesnick 2013/Guo 2014 CRA; Slesnick 2013/Guo 2014 EBFT; Slesnick 2013/Guo 2014 MET); 15.5 (Hyun 2005); 15.6 (Rotheram‐Borus 2003); 16.5 (Cauce 1994); 17.4 (Peterson 2006); 17.9 (Baer 2007); 18.7 (Carmona 2014/Slesnick 2015 CM; Carmona 2014/Slesnick 2015 CRA; Carmona 2014/Slesnick 2015 HIV; Carmona 2014/Slesnick 2015 MET); 19.2 (Slesnick 2007/08); 19.47 (Rew 2007) and 21.2 (Nyamathi 2012/13 AM; Nyamathi 2012/13 HPP). Participants in Slesnick 2009 EBFT and Slesnick 2009 FFT were between 12 and 17 years old.
The total percentages of male participants in these studies were as follows (in ascending order): 33.8% (Milburn 2012); 41.1% (Slesnick 2005); 47.5% (Slesnick 2013/Guo 2014 CRA; Slesnick 2013/Guo 2014 EBFT; Slesnick 2013/Guo 2014 MET); 51% (Rotheram‐Borus 2003); 52.6% (Carmona 2014/Slesnick 2015 CM; Carmona 2014/Slesnick 2015 CRA; Carmona 2014/Slesnick 2015 HIV; Carmona 2014/Slesnick 2015 MET); 54.7% (Peterson 2006); 55% (Slesnick 2009 EBFT; Slesnick 2009 FFT); 56% (Baer 2007); 57% (Cauce 1994); 61% (Rew 2007); 66% (Slesnick 2007/08); 70% (Nyamathi 2012/13 AM; Nyamathi 2012/13 HPP) and 100% (Hyun 2005). In summary, many studies had a majority population of young men. However, the intervention in Rew 2007 was gender specific.
The largest ethnic groups in each study, as described by study authors, were: 58% Caucasian (Baer 2007); 59% white (Cauce 1994); 74% Korean Christian (Hyun 2005); 61.6% Hispanic (Milburn 2012); 58% white (Nyamathi 2012/13 AM; Nyamathi 2012/13 HPP); 72.3% Caucasian (Peterson 2006); 58% white (Rew 2007); 59% African American (Rotheram‐Borus 2003); 41.1% Hispanic (Slesnick 2005); 41.1% Anglo‐American (Slesnick 2007/08); 44% Hispanic (Slesnick 2009 EBFT; Slesnick 2009 FFT); 65.9% African American (Slesnick 2013/Guo 2014 CRA; Slesnick 2013/Guo 2014 EBFT; Slesnick 2013/Guo 2014 MET); and 65.6% African American (Carmona 2014/Slesnick 2015 CM; Carmona 2014/Slesnick 2015 CRA; Carmona 2014/Slesnick 2015 HIV; Carmona 2014/Slesnick 2015 MET). Thus, in six studies the largest ethnic group was described as white, Caucasian, or Anglo‐American; in three studies the largest ethnic group was described as Hispanic; in three studies the largest ethnic group was described as African American; and in one study the majority represented a religious minority of majority ethnicity.
Other background information collected at baseline included abuse history, length of time on the streets or number of runaway episodes and reasons for leaving home.
Assessment of heterogeneity
Contrary to expectation, the included studies were considerably homogeneous in terms of location, study design and outcome categories. In contrast, these studies were considerably heterogeneous in terms of outcome measures and time points, confounders controlled for and, to a lesser degree, types of study populations. Meta‐analysis was possible for 11 included studies (for which raw data were available), although the number of studies considered under individual outcome items varied greatly (see Table 1 for a summary). Outcomes for which most data were available included percent days of alcohol use in the last 90 days, depression, internalising and externalising behaviours and delinquent behaviours. However, it should be noted that these data reflect the large number of studies/interventions reported from one study team.
Outcomes
The number of studies measuring primary and secondary outcomes as defined in our protocol is given here.
Primary outcomes
No studies measured the primary outcomes of inclusion and reintegration.
Secondary outcomes
-
Safer or reduced sexual activity: measured in five studies (Carmona 2014/Slesnick 2015 CM; Carmona 2014/Slesnick 2015 CRA; Carmona 2014/Slesnick 2015 HIV; Carmona 2014/Slesnick 2015 MET; Milburn 2012; Rew 2007; Rotheram‐Borus 2003; Slesnick 2007/08; ).
-
Safer or reduced substance use (e.g. reduced sharing of injection equipment): measured in 11 studies (Baer 2007; Carmona 2014/Slesnick 2015 CM; Carmona 2014/Slesnick 2015 CRA; Carmona 2014/Slesnick 2015 HIV; Carmona 2014/Slesnick 2015 MET; Cauce 1994; Milburn 2012; Nyamathi 2012/13 AM; Nyamathi 2012/13 HPP; Peterson 2006; Rotheram‐Borus 2003; Slesnick 2005; Slesnick 2007/08; Slesnick 2009 EBFT; Slesnick 2009 FFT; Slesnick 2013/Guo 2014 CRA; Slesnick 2013/Guo 2014 EBFT; Slesnick 2013/Guo 2014 MET; ).
-
Increased use of hostel‐ or shelter‐type services: measured in one study (Baer 2007).
-
Literacy: not measured in included studies.
-
Numeracy: not measured in included studies.
-
Self esteem: measured in two studies (Cauce 1994; Hyun 2005).
-
Depression: measured in seven studies (Carmona 2014/Slesnick 2015 CM; Carmona 2014/Slesnick 2015 CRA; Carmona 2014/Slesnick 2015 HIV; Carmona 2014/Slesnick 2015 MET; Cauce 1994; Hyun 2005; Nyamathi 2012/13 AM; Nyamathi 2012/13 HPP; Slesnick 2005; Slesnick 2009 EBFT; Slesnick 2009 FFT; Slesnick 2013/Guo 2014 CRA; Slesnick 2013/Guo 2014 EBFT; Slesnick 2013/Guo 2014 MET).
-
Participation in education: not measured in included studies.
-
Participation in skills‐based (rather than exploitative) employment: not measured in included studies.
-
Reduced use of violence: measured in two studies (Slesnick 2005; Slesnick 2009 EBFT; Slesnick 2009 FFT).
-
Increased contact with family: measured in one study (Slesnick 2009 EBFT; Slesnick 2009 FFT).
-
Participation in intervention planning and delivery: not measured in included studies.
Other outcomes (not included in the above)
-
Social functioning: measured in six studies (Carmona 2014/Slesnick 2015 CM; Carmona 2014/Slesnick 2015 CRA; Carmona 2014/Slesnick 2015 HIV; Carmona 2014/Slesnick 2015 MET; Cauce 1994; Milburn 2012; Slesnick 2005; Slesnick 2007/08; Slesnick 2009 EBFT; Slesnick 2009 FFT).
-
Psychological functioning: measured in five studies (Carmona 2014/Slesnick 2015 CM; Carmona 2014/Slesnick 2015 CRA; Carmona 2014/Slesnick 2015 HIV; Carmona 2014/Slesnick 2015 MET; Cauce 1994; Nyamathi 2012/13 AM; Nyamathi 2012/13 HPP; Slesnick 2007/08; Slesnick 2009 EBFT; Slesnick 2009 FFT).
-
Family functioning: measured in two studies (Slesnick 2005; Slesnick 2009 EBFT; Slesnick 2009 FFT).
Adverse outcomes
No studies explicitly measured adverse outcomes.
Outcome items included in meta‐analyses
Heterogeneity of outcome definitions, measures and time points for follow‐up used in these studies allowed us to include in the meta‐analysis only a selection of reported outcome items. Some of these represented individual items on a measure, for example, an item on a questionnaire, but others represented total scores, for example, an aggregate of individual items on a particular scale or subscale. For 23 such items, data were available for more than one intervention. Numbers of participants included in each meta‐analysis ranged from 75 to 404. For a list of outcome items included in the meta‐analysis, including study references, time points and measures used, see Table 1.
Outcome items not included in meta‐analyses
We excluded from the meta‐analysis more than 70 reported outcome items reported in the included studies because they were measured in only one study (e.g. due to differences in measures used) or at a time point not overlapping with any other study; because we did not have access to relevant data (mean and standard deviation scores); or because they were not within the remit of this review. We have presented a full list of these outcomes according to study in Appendix 3. In the Effects of interventions section, we have reported relevant outcomes narratively (according to authors' own analyses, when data were not available).
Time points
The following time points were reported in these studies (in ascending order): three and six weeks (Rew 2007); eight weeks (Hyun 2005); one and three months (Baer 2007; Peterson 2006); three months (Cauce 1994); three and six months (Slesnick 2007/08); three, six and 12 months (Milburn 2012; Slesnick 2005); six months (Nyamathi 2012/13 AM; Nyamathi 2012/13 HPP); three, nine and 15 months (Slesnick 2009 EBFT; Slesnick 2009 FFT); three, six and 12 months (Carmona 2014/Slesnick 2015 CM; Carmona 2014/Slesnick 2015 CRA; Carmona 2014/Slesnick 2015 HIV; Carmona 2014/Slesnick 2015 MET); three, six, 12, 18 and 24 months (Rotheram‐Borus 2003); and three, six, nine, 12, 18 and 24 months (Slesnick 2013/Guo 2014 CRA; Slesnick 2013/Guo 2014 EBFT; Slesnick 2013/Guo 2014 MET). See also Table 1 for time points included in meta‐analyses.
Confounders and process factors
Of demographic confounders, age, gender and ethnicity were most frequently accounted for in outcome analyses and are detailed in Effects of interventions. Sexual and physical abuse history was examined separately (Slesnick 2006) in relation to Slesnick 2005, Slesnick 2009 EBFT and Slesnick 2009 FFT, and primary alcohol versus primary drug abuse (in interaction with gender) in relation to Slesnick 2005 and Slesnick 2009 EBFT (Slesnick 2006c).
Potentially relevant service delivery factors included engagement of young people, treatment attendance, length of intervention, therapeutic relationship and compliance. Some included interventions were manualised, and observer ratings or transcript records were used to ensure treatment fidelity by intervention providers. Process data collected in these studies included service‐user satisfaction (for intervention conditions only) (Baer 2007; Peterson 2006 (quantitative); Rew 2007), counsellor‐rated 'level of engagement' (Baer 2007; Peterson 2006), 'stage of change' (Peterson 2006) and counsellor effects and treatment attendance (Slesnick 2007/08; Slesnick 2009 EBFT; Slesnick 2009 FFT). We did not report on all data relevant to service delivery confounders because of the heterogeneity of interventions and measures used in this area, but we refer in the discussions below to analyses conducted by study authors.
Drop‐out rates
Follow‐up rates at longest follow‐up were as follows (in ascending order): 43% (intervention), 49% (control) at 12 months (Milburn 2012); 62% (EBFT), 65% (FFT), 62% (control) at 15 months (Slesnick 2009 EBFT; Slesnick 2009 FFT); 65% (total) (Nyamathi 2012/13 AM; Nyamathi 2012/13 HPP); 66% (intervention), 74% (control) at 24 months (Rotheram‐Borus 2003); 71% (total included in analysis) at T3 (Rew 2007); 74% (total) at 24 months (Slesnick 2013/Guo 2014 CRA; Slesnick 2013/Guo 2014 EBFT; Slesnick 2013/Guo 2014 MET); 76% (total) at 12 months (Carmona 2014/Slesnick 2015 CM; Carmona 2014/Slesnick 2015 CRA; Carmona 2014/Slesnick 2015 HIV; Carmona 2014/Slesnick 2015 MET); 80% (total) at three months (Peterson 2006); 84% (control), 88% (intervention) at six months (Slesnick 2007/08); 88% (intervention), 81% (control) at six weeks (Hyun 2005); 89% (intervention), 88% (control) at 12 months (Slesnick 2005) and 92% (total) at three months (Baer 2007) (no attrition reported in Baer 2007; 10 participants were excluded from the analysis on the basis of exclusion criteria).
Measures
In the following paragraphs, we give a brief overview of measures used for outcome items included in the meta‐analysis. We found further information on scales used in the included studies, including scoring, and compiled this into a large table, which can be found at Appendix 4.
Sexual health and risk behaviour‐related outcomes were the most varied, and we could include only two outcome items in our meta‐analyses, both measured in Milburn 2012 and Slesnick 2007/08. We measured outcomes in this category in Slesnick 2007/08 using the Homeless Youth Questionnaire, and in Milburn 2012 using the authors' own research instrument, which was similar to the one used in Slesnick, although more limited in the scope and precision of questions asked.
Substance use‐related outcomes were also varied. Peterson 2006 and Baer 2007 measured frequency of substance use using a Time‐Limited Follow‐Back interview (TLFB) developed by Sobell 1992, and Professor Slesnick's team used a derivation of the TLFB, Form 90, which was developed for ‘Project MATCH’, a large‐scale RCT conducted by the US National Institute on Alcohol Abuse and Alcoholism. The time scale in the TLFB is the last 30 days, as opposed to the last 90 days in Form 90; these tools also differ in how they quantify days of substance use. Milburn 2012 did not use a standardised tool of measurement but employed the same time scale as Form 90, along with a unit of measurement similar to the TLFB. Two different measures were also used for 'problem consequences': Peterson 2006 administered the 23‐item Rutgers Alcohol Problem Index (RAPI) with revised instructions (to cover any relevant form of substance abuse), and the Slesnick studies used the Problem Oriented Screening Instrument for Teenagers (POSIT), which targets substance abuse in general. Only one study (Slesnick 2009 EBFT; Slesnick 2009 FFT) used the Adolescent Drinking Index (ADI), for which no detailed scoring guidance was available.
Investigators usually used standardised tools to measure depression, self esteem and other psychological functioning outcomes. Studies by Professor Slesnick's team and by Hyun 2005 used the Beck Depression Index (BDI) (score range 0 to 63) to measure depression, and Cauce 1994 used the Reynolds Adolescent Depression Scale (RADS) (score range 30 to 120). Nyamathi 2012/13 AM and Nyamathi 2012/13 HPP used the Center for Epidemiologic Studies Depression Scale (CES‐D). Professor Slesnick's studies measured internalising and externalising behaviours; and Cauce 1994 used the Youth Self‐Report (YSR). Hyun 2005 measured self esteem using the Self‐Esteem Inventory, and Cauce 1994 used the Rosenberg Self‐Esteem Scale (RSES). Slesnick 2005, Slesnick 2009 EBFTand Slesnick 2009 FFT used the Computerized Diagnostic Interview Schedule (CDISC) to measure numbers of psychiatric diagnoses.
Form 90 was used to measure percent days living at home (Slesnick 2009 EBFT; Slesnick 2009 FFT).
Six studies measured social functioning. The only outcome item in this category included in a meta‐analysis was delinquent behaviours, as measured by the YSR (Cauce 1994), Diagnostic and Statistical Manual Fourth Edition (DSM‐IV) criteria (Milburn 2012) and the National Youth Survey Delinquency Scale (NYSDS) (Slesnick 2005; Slesnick 2007/08; Slesnick 2009 EBFT; Slesnick 2009 FFT).
Two studies (Slesnick 2005; Slesnick 2009 EBFT; Slesnick 2009 FFT) measured family functioning by using the outcomes of verbal aggression (youth) and family violence (youth) as measured on relevant subscales of the Conflict Tactics Scales (CTS); family cohesion and family conflict as measured on relevant subscales of the Family Environment Scale (FES); and parental care and parental overprotectiveness as measured on the Parental Bonding Instrument (PBI). Scores reported reflect the youths' own perceptions of, for example, use of aggression to resolve family conflicts.
Excluded studies
We excluded 15,984 studies in a two‐step process described under Selection of studies and Results of the search (see also Figure 3). We excluded most following screening by title and abstract.
Reasons for excluding 47 studies initially classified as 'potentially eligible' are listed in the Characteristics of excluded studies table. The most common reason was lack of a comparable control group, for example, because of convenience sampling. Nine studies included no control or comparison group; we excluded them from the review for this reason.
We selected 30 studies for meeting most of the objectives of the review even if they failed to meet all the criteria specified under research design. We have presented a descriptive overview of these studies in Appendix 1.
We used screening software to classify another 616 records as ethnographic or descriptive studies on street‐connected children and youth, and we excluded them from the review for not evaluating effectiveness; we categorised 117 as about street children but not evaluating effectiveness, and 230 as non‐English language. We will include in a larger mapping exercise the first two categories and, if feasible, the non‐English language studies.
All included studies were conducted in HICs. One study conducted in Iran and published in Farsi (Dousti 2014) is awaiting assessment at update stage, pending data extraction by a review author alongside a Farsi speaker. We assessed for inclusion in the updated review another study (Crombach 2014) conducted in Burundi, but clarification by study authors revealed that this study did not meet the inclusion criteria.
Risk of bias in included studies
We assessed risk of bias for sequence generation, allocation concealment, blinding of participants and personnel including outcome analysis, incomplete outcome data and selective reporting. We have presented risk of bias assessments graphically in Figure 4 and Figure 5 (see also Characteristics of included studies and summary of findings Table for the main comparison).

Risk of bias summary: review authors' judgements about each risk of bias item for each included study.

Risk of bias graph: review authors' judgements about each risk of bias item presented as percentages across all included studies.
Allocation
We did not gain sufficient information on potential randomisation or allocation methods for Rotheram‐Borus 2003 , but allocation in this study occurred at the level of shelters rather than at the level of individual participants. Researchers used propensity scores at a later stage to render intervention and control groups comparable. Study authors described their study design as 'quasi‐experimental'. Similarly for Rew 2007, data on randomisation and allocation procedures were not available, and study authors described their study design as a 'quasi‐experimental repeated measures design'. We have classified these studies as high risk both for sequence generation and allocation.
We classified sequence generation as low risk for 10 studies (16 interventions). In Baer 2007 , Milburn 2012 , Peterson 2006 , Nyamathi 2012/13 AM , Nyamathi 2012/13 HPP and Slesnick studies, investigators performed randomisation by computer (computerised coin toss was used in Milburn 2012 , Nyamathi 2012/13 AM and Nyamathi 2012/13 HPP; a computerised urn randomisation programme was utilised in the remaining studies); Cauce 1994 used sequential envelopes. We classified sequence generation for one study (Hyun 2005) as high risk because it was based on consecutive recruitment and even and odd number allocation, respectively.
For allocation concealment, we classified eight studies (13 interventions) as low risk (Baer 2007; Milburn 2012; Peterson 2006; Slesnick 2005; Slesnick 2007/08; Slesnick 2009 EBFT; Slesnick 2009 FFT). In these, allocation took place at a location separate from recruitment and was performed by a different person, commonly the study director or a member of the intervention team. We classified three studies as high risk (Cauce 1994; Hyun 2005; Rew 2007 ). In these studies, randomisation took place at the assessment site or not at all (the Rew 2007 study used a 'quasi‐experimental' study design whereby participants were assigned to three different groups, but we were unable to gain a clear picture of the allocation procedure). We assigned one study as having unclear risk for lack of information (Nyamathi 2012/13 AM; Nyamathi 2012/13 HPP).
Blinding
All studies showed high risk of bias in relation to blinding, as it was not possible to blind participants to such interventions. Most outcome items used self report mechanisms and so were subjective; thus the inability of researchers to blind participants or intervention staff added a potentially high risk of bias. On blinding of outcome assessment, seven studies (13 interventions) were considered to represent high risk, four low risk and two unclear risk of bias.
Incomplete outcome data
We considered attrition rates good to very good in the light of typical characteristics of research populations, their lifestyles and drop‐out rates for interventions in general. Although relevant information was available for each study, drop‐out rates generally appeared similar for intervention and control groups . However, high attrition rates may reflect drop‐out of self selecting subsets of the population, and as such add strong risk for biased outcome measurements. In the population included in this review, which typically had chaotic unsettled lives, participants retained might be more representative of the young people ready to make changes in their lives than of those who dropped out. For a small number of studies, study authors presented attrition analyses, as detailed below. Of these, only one study (Slesnick 2009 EBFT; Slesnick 2009 FFT) reported no differences between the demographic profiles of drop‐outs and those of retained participants. However, investigators did not assess motivation to change. Consequently, we rated most studies as having high risk in this area, and rated some as having unclear risk.
Selective reporting
All studies appeared to report on all outcomes, although study authors sometimes provided descriptive data only for statistically significant or favourable outcomes. With the exception of Rew 2007, Rotheram‐Borus 2003, Nyamathi 2012/13 AM and Nyamathi 2012/13 HPP, study authors were able to provide us with unreported raw data on outcome items reported in their papers. They provided no additional outcome data for any studies. However, we noted some variation between individual outcome items reported across the Slesnick studies, even when the same research tools appeared to have been used. For example, although all of these outcome items were measured on Form 90, the number of categories of drugs used was reported for the EBFT intervention in Slesnick 2005 but not in Slesnick 2009 EBFT; the number of days living at home was reported in Slesnick 2009 EBFT and Slesnick 2009 FFT but not in Slesnick 2005; and social stability was reported only in Slesnick 2007/08. We noted variation in the way substance use was reported across studies. This could have been due to a different study focus or to progressive adjustment of the measure used and could suggest reporting bias. Assessments of risk in this area of bias were unclear in all cases, but this determination was based on available information, and, as reported above, discrepancies were apparent, so risk may have been greater than originally assessed.
Other potential sources of bias
We noted that 10 of the 19 included interventions were described by studies conducted by one research team (Slesnick 2005; Slesnick 2007/08; Slesnick 2009 EBFT; Slesnick 2009 FFT; Carmona 2014/Slesnick 2015 CM; Carmona 2014/Slesnick 2015 CRA; Carmona 2014/Slesnick 2015 HIV; Carmona 2014/Slesnick 2015 MET; Slesnick 2013/Guo 2014 CRA; Slesnick 2013/Guo 2014 EBFT; Slesnick 2013/Guo 2014 MET), which showed similarities in study design, types of interventions provided, location and population characteristics.This is a potential source of bias in the review, as similarities between these studies might lead to weighting of the results in favour of those studies.
Incentives for participation in assessment are often used in research but can be a potential source of bias because providing incentives could result in influence of these incentives on participant behaviour and on outcome reporting. Most of the included studies reported incentives, with the exception of Hyun 2005 and Rotheram‐Borus 2003 . In Baer 2007, youth in the intervention condition received $10 vouchers for each completed session, and intervention participants in Rotheram‐Borus 2003 received minor incentives (food, $1 notes and tokens of appreciation) as rewards for participation and other positive behaviours. Upon finding no positive intervention effects (in contrast to Peterson 2006), Baer 2007 speculated that payment for session attendance could have undermined intrinsic motivation for participation. However, outcome trends across interventions were generally mixed; thus we were unable to draw firm conclusions about potential effects of incentives on outcome findings. For potential impact on follow‐up rates, see the discussion on attrition analyses below.
Effects of interventions
See: Summary of findings for the main comparison
In this section, we detail intervention effects primarily on the basis of our meta‐analyses, data provided by the study and change score calculations. Following this, we highlight heterogeneity and process factors in the included studies, drawing on both our meta‐analyses and statistical analyses provided by study authors. Readers should note the great variation in types of measurement tools used by investigators, making comparison difficult for some outcomes. We recommend that readers look into the original included studies to discover details on some aspects of measurement when it has not been possible for authors of this review to describe them in detail.
None of the studies included in this review reported relative effects of different intervention components. In our meta‐analyses, we compared the (standardised) mean difference between intervention and control groups for each included outcome at the same time point (three, six or 12 months) (see also Measures of treatment effect). One study (Hyun 2005) used a shorter endpoint of eight weeks but was included in the meta‐analysis. Additionally, we have presented other relevant data for outcome items not included in the meta‐analyses as presented by study authors.
We calculated change scores for outcome items included in the meta‐analysis, outcome items not included in the meta‐analysis and time points not included in the meta‐analysis (utilising the longest follow‐up data available). It must be noted that these data do not account for standard deviation or standard error. We used these change scores as indicators, primarily to illustrate the fact that for most outcomes, a positive change (as opposed to deterioration) was evident in both intervention and comparison intervention groups. Change scores with comments can be found in Appendix 2, and brief summaries are provided in the section below.
Primary outcomesÂÂ
Inclusion
Not measured in included studies.
Reintegration
Not measured in included studies.
Secondary outcomes ÂÂ
Safer or reduced sexual activity
Summary
Overall, results for this outcome were uncertain, with sexual behaviour in both intervention and control groups changing at different time points. From the data below, it was unclear whether intervention or service as usual (SAU) services impacted sexual behaviour. In summary, results across studies were mixed with regard to changing sexual risk behaviour practices. Raw data for Rew 2007 and Rotheram‐Borus 2003 were not available, and we referred instead to the data reported by study authors.
The following outcome items were included in the meta‐analysis.
-
Number of times participants had sex in last 90 days (three, six months).
-
Number of sexual partners in last 90 days (three, six months).
Number of times participants had sex in last 90 days
We included in the meta‐analysis three‐month data for Slesnick 2007/08 and Milburn 2012 (Analysis 1.1). We found no important or statistically significant effects (combined mean difference (MD) ‐0.04, 95% confidence interval (CI) ‐0.25 to 0.17). We included six‐month data for Slesnick 2007/08 and Milburn 2012 (Analysis 1.2). Again, effects were small and were not statistically significant (combined MD ‐0.04, 95% CI ‐0.22 to 0.13).
Number of sexual partners in last 90 days
We included in the meta‐analysis three‐month data for Slesnick 2007/08 and Milburn 2012 (Analysis 1.3). In Milburn 2012 , the data were highly skewed (MD 0.27, 95% CI ‐4.55 to 5.09). Slesnick 2007/08 reported a small, statistically significant effect in favour of the intervention group (MD ‐0.57, 95% CI ‐1.14 to 0.00). The combined MD was ‐0.56 (95% CI ‐1.13 to 0.01). We included six‐month data for Slesnick 2007/08 and Milburn 2012 (Analysis 1.4). At six months, the data in Milburn 2012 were less skewed and favoured the control group, possibly reflecting evening out of patterns of sexual behaviour within the group over time, although in our comparative analysis, no statistically significant effects were present for either study (combined MD 0.73, 95% CI ‐2.97 to 4.43).
In Rotheram‐Borus 2003, study authors reported that the number of recent sexual partners among young women had increased in the control group compared with the intervention group at 24 months (odds ratio (OR) 0.68, 90% CI 0.47 to 0.98; P value = 0.084). Among young men, the number of recent sexual partners was similar at 24 months (OR 0.96, 90% CI 0.56 to 1.66), and a marginal decrease was evident between 12 and 24 months in the intervention group, along with a marginal increase between 12 and 24 months in the control group (these were references to figures presented by study authors).
Unprotected sex, condom use
Study authors presented data in the following sections differently in their studies, and raw data were not made available to the review team. Therefore, we have presented data as reported in the studies.
In Rotheram‐Borus 2003, the frequency of unprotected sexual acts among young women was lower in the intervention group than in the control group at 24 months (OR 0.35, 90% CI 0.17 to 0.71; P value = 0.018). Among young men, the number of unprotected sexual acts was similar in both groups across all time points (OR 1.62, 90% CI 0.53 to 4.96).
In Rew 2007, data on self efficacy for condom use as presented by study authors showed statistically significant (P value < 0.001) changes in mean scores over time, but trends within both groups were mixed. Study authors also reported data on intention to use condoms, similarly indicating statistically significant (P value = 0.25) changes in mean scores. They presented no further evidence to support the study hypothesis, so the results must be seen as unclear.
Other sexual risk behaviour
In Rotheram‐Borus 2003, rates of abstinence from vaginal and anal sex among young women were higher in the intervention group at 24 months (OR 2.41, 90% CI 0.77 to 7.62; P value = 0.088). Rates of abstinence from vaginal and anal sex among young men showed an increase at 12 months (somewhat sharper in the control group) followed by an equivalent decrease at 24 months (OR 1.28, 90% CI 0.24 to 6.99). Again, these findings reflected uncertainty and did not show a clear trend.
In Rew 2007, AIDS and sexually transmitted disease (STD) knowledge scores indicated a statistically significant difference between T1 and T3 (1.309, 95% CI 0.575 to 2.042; P value < 0.001) and between T2 and T3 (1.658, 95% CI 0.873 to 2.443; P value < 0.001)ÂÂ in the intervention condition, showing a stable pattern between T1 and T2 followed by a decrease in T3. In the control condition, a statistically significant difference between T1 and T2 (1.217, 95% CI 0.650 to 1.785; P value < 0.001) and between T1 and T3 (1.553, 95% CI 0.899 to 2.207; P value < 0.001) showed a decrease followed by a stable pattern. At T2, a statistically significant difference between groups (P value = 0.003) showed that the intervention mean was higher than the control mean. For sexual self care behaviour, both groups showed an overall pattern of decrease. For safe sex behaviour, data showed no statistically significant time effects in the intervention group (P value = 0.598) but in the control group a statistically significant (P value = 0.010) time effect for a decrease in levels of safe sex behaviour. No statistically significant changes in mean scores for sexual risk‐taking behaviour were observed over time, overall (P value = 0.167) or in either group (P value > 0.5 for both). Again, these findings reflect uncertainty and do not show a clear trend.
In Nyamathi 2012/13 AM and Nyamathi 2012/13 HPP, HIV/AIDS total knowledge scores increased from baseline to six‐month follow‐up in both groups. Increases on some subscales were found to be statistically significant (P value < 0.001) for both groups or for the HHP (control) group only. No effect sizes were reported for this outcome.
Summary of change scores (Appendix 2)
Change scores indicated very mixed results. Overall, this category of outcomes demonstrated very limited, if any, intervention effects across studies. However, it should be noted that baseline levels of sexual activity varied considerably across studies. Some trends favouring the control group were indicated in the Slesnick 2007/08 study.
Safer or reduced substance use (e.g. reduced sharing of injection equipment)
Summary
Results on this outcome were similarly uncertain and showed mixed direction.
We included the following outcome items in the meta‐analysis, representing a wide range of measurement types with different interpretations and different reference points.
-
Number of days of alcohol use in last 30 days (one, three months).
-
Percent days of alcohol use in last 90 days (three, six, 12 months).
-
Number of standard drinks in last 90 days (three months).
-
Adolescent drinking index score (three months).
-
Percent days of alcohol/drug use in last 90 days (three, six, 12 months).
-
Percent days of only/any drug use in last 90 days (three, six, 12 months).
-
Number of categories of drug use in last 90 days (six months).
-
Number of days of marijuana use in last 30 days (one, three months).
-
Number of days of illicit drug use other than marijuana in last 30 days (one, three months).
-
Number of problem consequences (three, six months).
-
Number of substance use diagnoses (three months).
Number of days of alcohol use in last 30 days
We included one‐month data for Baer 2007 and Peterson 2006 (Analysis 2.1). We found no statistically significant or important effect, and the mixed findings reflected uncertainty (total MD ‐0.3, 95% CI ‐2.25 to 1.59). We included three‐month data for Baer 2007 and Peterson 2006 (Analysis 2.2). The combined MD was 1.10 (95% CI ‐0.67 to 2.88) favouring the comparison intervention.
Percent days of alcohol use in last 90 days
We included three‐month data for Slesnick 2005 , Slesnick 2009 EBFT , Slesnick 2009 FFT , Carmona 2014/Slesnick 2015 CM and Carmona 2014/Slesnick 2015 CRA .
Number of standard drinks in last 90 days
We included three‐month data for Slesnick 2009 EBFT and Slesnick 2009 FFT (Analysis 2.6). A small non‐statistically significant effect favoured both the EBFT intervention group (MD ‐3.05, 95% CI ‐7.26 to 1.16) and the FFT intervention group (MD ‐2.73, 95% CI ‐6.49 to 1.03). The combined MD was similarly small but statistically significant and favoured the intervention group (MD ‐2.87, 95% CI ‐5.68 to ‐0.07).
Adolescent drinking index (ADI) score
We included three‐month data for Slesnick 2009 EBFT and Slesnick 2009 FFT (Analysis 2.7). A small, statistically non‐significant and uncertain effect favoured the control group for the EBFT intervention (MD 2.97, 95% CI ‐4.48 to 10.42). FFT showed a more negligible impact that favoured the intervention group (MD ‐1.19, 95% CI ‐9.43 to 6.96). The combined MD was 1.08 (95% CI ‐4.42 to 6.57).
Percent days of alcohol/drug use in last 90 days
The difference in findings from this scale compared with the others used in studies in this review may reflect the fact that this scale aggregated drug and alcohol use data rather than keeping them separate. Furthermore, the precise definition of drug and alcohol use used in this scale was unclear.
We included three‐month data for Slesnick 2009 EBFT , Slesnick 2009 FFT , Slesnick 2013/Guo 2014 CRA , Slesnick 2013/Guo 2014 EBFT and Slesnick 2013/Guo 2014 MET (Analysis 2.8). A larger effect favoured the control group over the EBFT intervention group (MD 8.00, 95% CI ‐12.89 to 28.89), but this finding was not statistically significant and therefore reflected uncertainty. Similarly, but in the opposite direction, a larger but non‐statistically significant effect favoured the FFT intervention (MD ‐10.00, 95% CI ‐26.72 to 6.72). Effects for interventions from the most recent study were small. The combined MD was 0.70 (95% CI ‐9.09 to 7.70 ). We included six‐month data (Analysis 2.9) for Slesnick 2007/08 , Slesnick 2013/Guo 2014 CRA , Slesnick 2013/Guo 2014 EBFT and Slesnick 2013/Guo 2014 MET. The combined MD was ‐2.15 (95% CI ‐9.82 to 5.53). We included 12‐month data (Analysis 2.10) for Slesnick 2013/Guo 2014 CRA , Slesnick 2013/Guo 2014 EBFT and Slesnick 2013/Guo 2014 MET. The combined MD was 5.87 (95% CI ‐5.06 to 16.79). At six months, a marginal but statistically non‐significant effect favoured the intervention group in Slesnick 2007/08. At 12 months, effects favoured the control intervention, with Slesnick 2013/Guo 2014 EBFT showing the largest mean difference, but the data were not statistically significant.
Percent days of only/any drug use in last 90 days
We included three‐month data for Slesnick 2005, Slesnick 2009 EBFT , Slesnick 2009 FFT, Carmona 2014/Slesnick 2015 CM , Carmona 2014/Slesnick 2015 CRA and Carmona 2014/Slesnick 2015 MET (Analysis 2.11). We found small and non‐statistically significant effects. The MD for the FFT intervention was ‐7.00 (95% CI ‐23.72 to 9.72), with the mean favouring the intervention group, and the MD for Carmona 2014/Slesnick 2015 CRA favouring the control intervention (7.93, 95% CI ‐9.64 to 25.50). Other mean differences were smaller and showed mixed directions. The combined MD was 0.67 (95% CI ‐6.82 to 8.15). We included six‐month data (Analysis 2.12) for Carmona 2014/Slesnick 2015 CM , Carmona 2014/Slesnick 2015 CRA , Carmona 2014/Slesnick 2015 MET and Slesnick 2005. The combined MD was ‐2.28 (95% CI ‐11.53 to 6.96). We included 12‐month data (Analysis 2.13) for Carmona 2014/Slesnick 2015 CM , Carmona 2014/Slesnick 2015 CRA , Carmona 2014/Slesnick 2015 MET and Slesnick 2005. The combined MD was ‐5.28 (95% CI ‐13.79 to 3.23). At both time points, most of the interventions appeared to favour the intervention groups, although the data are not statistically significant. We noted an exception in Slesnick 2005 , for which the data slightly favoured the control group.
Number of days of marijuana use in last 30 days
We included one‐month data for Baer 2007 and Peterson 2006 (Analysis 2.14). Small and statistically non‐significant effects favoured the control group in Baer 2007 and the intervention group in Peterson 2006. The combined MD was ‐0.52 (95% CI ‐3.65 to 2.62). Three‐month data for Baer 2007 and Peterson 2006 (Analysis 2.15) showed a slightly larger effect favouring the control group in Baer 2007 (MD 1.60, 95% CI ‐3.60 to 6.80), and a decreased (statistically non‐significant) effect slightly in favour of the intervention group in Peterson 2006. The combined MD was 0.37 (95% CI ‐2.73 to 3.47). These results showed mixed direction of effects and reflected uncertainty.
In Rotheram‐Borus 2003, data as reported by study authors showed that marijuana use among young women was less in the intervention group at 12 months (OR 0.19, P value = 0.005) but greater at 24 months (OR 2.51, 90% CI 0.61 to 10.38). Among young men, marijuana use was less in the intervention group at three months (OR 0.31, P value = 0.050) but identical at 24 months (OR 1.08, 90% CI 0.17 to 6.93). These results showed that gains at one month did not appear to be maintained over time.
In Nyamathi 2012/13 AM and Nyamathi 2012/13 HPP, according to data reported by study authors, marijuana use declined in both HHP (88% to 73%) and AM (96% to 77%) programmes (P value < 0.10; McNemar’s test of symmetry).
Number of days of illicit drug use other than marijuana in last 30 days
We included one‐month data for Baer 2007 and Peterson 2006 (Analysis 2.16). A small, statistically non‐significant effect favoured the control group in Baer 2007 (MD 1.50, 95% CI ‐0.70 to 3.70), but no statistically significant effect was noted in Peterson 2006. The combined MD was 1.21 (95% CI ‐0.68 to 3.10). Three‐month data for Baer 2007 and Peterson 2006 showed no statistically significant effects (Analysis 2.17). The combined MD was 0.22 (95% CI ‐1.84 to 2.28). These results again were mixed and reflected uncertainty.
Other substance use measures
In Rotheram‐Borus 2003, investigators measured alcohol use dichotomously. Results were uncertain and may reflect a short‐term positive change but no maintenance of gains over the longer term. Alcohol use among young women was less in the intervention group at 12 months (OR 0.43, P value = 0.053) but was slightly greater at 24 months (OR 1.72, 90% CI 0.54 to 5.49). Alcohol use among young men was less in the intervention group at three months (OR 0.25, P value = 0.1000) but was similar at 24 months (OR 1.16, 90% CI 0.24 to 6.99).
Nyamathi 2012/13 AM and Nyamathi 2012/13 HPP showed lack of clarity regarding the measure used (TCU drug history form). Study authors reported results in dichotomous form and described significant reductions in alcohol use in both intervention groups (from 78% to 59% for the HHP programme, and from 91% to 68% for the AM programme) (P value < 0.05; McNemar’s test of symmetry). Study authors also reported statistically significant reductions in the HHP programme only for cocaine use (from 17% to 2%), methamphetamine use (from 42% to 24%) and use of hallucinogens (from 27% to 7%). They found no significant reductions in crack use, heroin use or sedative use in either group.
We included three‐month data for Slesnick 2005 , Slesnick 2009 EBFT and Slesnick 2009 FFT (Analysis 2.18). Small effects favoured the control group in all three studies. The combined MD was 1.51 (95% CI 0.56 to 2.47); this finding was statistically significant and showed overall benefit for the control group. The largest effect in favour of the control group was noted for the EBFT intervention (MD 2.21, 95% CI ‐0.02 to 3.68). We included six‐month data for Slesnick 2005 and Slesnick 2007/08 (Analysis 2.19) and found no statistically significant effect at this time point. The combined MD was 0.34 (95% CI ‐0.67 to 1.34).
For Peterson 2006, data on drug use consequences (RAPI) were not available. Study authors reported that they found no reduction in drug use consequences at three months across groups. Further, no evidence suggested that the intervention had changed the consequences of drug use.
Number of substance use diagnoses (CDISC)
We included three‐month data for Slesnick 2009 EBFT and Slesnick 2009 FFT (Analysis 2.20). Effects were marginal and were statistically non‐significant, although the combined MD reached statistical significance (MD ‐0.70, 95% CI ‐1.27 to ‐0.14); a very small benefit favoured the intervention group.
Number of categories of drug use in last 90 days
We included six‐month data for Slesnick 2005 and Slesnick 2007/08 (Analysis 2.21) and found no statistically or clinically significant effect. The combined MD was 0.14 (95% CI ‐0.33 to 0.61).
In Rotheram‐Borus 2003, only data provided by study authors indicated that fewer drugs were used among young women in the intervention group at 12 months (OR 0.36, P value = 0.019) but similar numbers were used at 24 months (OR 1.34, 90% CI 0.59 to 3.05). Among young men, fewer drugs were used in the intervention group at three months (OR 0.59, P value = 0.085) but similar numbers at 24 months (OR 0.90, 90% CI 0.38 to 2.12). This finding indicates that in this population, changes in substance use behaviour may not be sustained over time.
Summary of change scores for substance use (Appendix 2)
Change scores in this category were also mixed, as is discussed in greater detail in the summary of results. We found longer‐term change scores (without standard deviation (SD) and thus with no estimate of precision) favouring the intervention group in Slesnick 2009 EBFT and Slesnick 2009 FFT for percent days of alcohol use in the last three months, number of standard drinks, percent days of alcohol or drug use and percent days of only drug use. We found similar trends across all groups for percent days of alcohol in Slesnick 2005 , Carmona 2014/Slesnick 2015 CRA and Carmona 2014/Slesnick 2015 MET, with smaller reductions for Carmona 2014/Slesnick 2015 CM. Results at 12 months favoured the control group in Slesnick 2005 and favoured control and one of two interventions in Carmona 2014/Slesnick 2015 CM , Carmona 2014/Slesnick 2015 CRA , Carmona 2014/Slesnick 2015 HIV and Carmona 2014/Slesnick 2015 MET. Longer‐term change scores in Milburn 2012 were mixed but appeared to favour intervention for 'times had alcohol' in the last three months. Results for drug and alcohol outcomes across the remaining studies were mixed, with few showing more than marginal changes, most of which were not sustained over time. Benefits for control groups (e.g. number of days of abstinence in Baer 2007; percent days used tobacco in Slesnick 2005) may reflect greater benefit of the comparison SAU intervention than of the index intervention being evaluated. The longest follow‐up point in this category was for percent days of alcohol or drug use at 24 months in Slesnick 2013/Guo 2014 CRA , Slesnick 2013/Guo 2014 EBFT and Slesnick 2013/Guo 2014 MET. Change scores indicated small reductions across all intervention groups, with the largest reduction observed in the control intervention group (MET), and the smallest reduction in the CRA group.
Increased use of hostel‐ or shelter‐type services
Only one study (Baer 2007) measured this outcome of service use and results appear mixed, with little indication of lasting improvement (see change scores, Appendix 2).
Literacy
Not measured in included studies.
Numeracy
Not measured in included studies.
Self esteem
Summary
Results for self esteem show no statistically significant benefit.
Self esteem: We included endpoint data for Cauce 1994 (three months) and Hyun 2005 (eight weeks) (Analysis 3.1) and found no statistically significant or clinically important effect (combined SMD 0.11, 95% CI ‐0.22 to 0.44).
Summary of change scores (Appendix 2)
Trends based on change scores appeared similar for all groups, indicating marginal to slight improvement.
Depression
Summary
Results for depression were mixed and demonstrated no clear benefit.
Depression: We included three‐month data for Cauce 1994, Hyun 2005, Slesnick 2005, Slesnick 2009 EBFT , Slesnick 2009 FFT, Slesnick 2013/Guo 2014 CRA , Slesnick 2013/Guo 2014 EBFT , Slesnick 2013/Guo 2014 MET , Carmona 2014/Slesnick 2015 CM , Carmona 2014/Slesnick 2015 CRA and Carmona 2014/Slesnick 2015 MET (Analysis 4.1). Results demonstrated no combined effect for depression at three months and results from individual studies were mixed (combined standardised mean difference (SMD) ‐0.03, 95% CI ‐0.22 TO 0.17). We included six‐month data for Slesnick 2005, Slesnick 2007/08, Slesnick 2013/Guo 2014 CRA , Slesnick 2013/Guo 2014 EBFT , Slesnick 2013/Guo 2014 MET , Carmona 2014/Slesnick 2015 CM , Carmona 2014/Slesnick 2015 CRA and Carmona 2014/Slesnick 2015 MET (Analysis 4.2 ). The combined MD was 0.32 (95% CI ‐0.88 to 2.55), revealing no statistical significance. We included 12‐month data for Carmona 2014/Slesnick 2015 CM , Carmona 2014/Slesnick 2015 CRA , Carmona 2014/Slesnick 2015 MET , Slesnick 2005 , Slesnick 2013/Guo 2014 CRA , Slesnick 2013/Guo 2014 EBFT and Slesnick 2013/Guo 2014 MET. The combined MD was 1.28 (95% CI ‐0.36 to 2.92). These results were not statistically significant.
With the addition of studies with an SAU condition, the statistical power of the included interventions may have diminished because we split the numbers in the control condition. Generally, the SMD appeared larger for studies in which the control group was not split. For studies without an SAU condition, the meta‐analysis indicated a small (statistically non‐significant) effect favouring the control intervention (MET) at six and twelve months and more mixed effects at three months.
We were not able to include in meta‐analyses data from Nyamathi 2012/13 AM and Nyamathi 2012/13 HPP . Study authors reported no significant changes in depressive symptoms for either intervention group.
Summary of change scores (Appendix 2)
Reductions in depression were indicated across all groups, with the exception of the control group in Hyun 2005.
Participation in education
Not measured in included studies (but see aggregate measure of 'social stability' under 'social functioning').
Participation in skills‐based (rather than exploitative) employment
Not measured in included studies.
Reduced use of violence
Summary
No statistically significant effects were demonstrated.
We included the following outcome items in the meta‐analysis.
-
Verbal aggression (youth) (three months).
-
Family violence (youth) (three months).
It should be noted that only one group of studies (Slesnick 2005; Slesnick 2009 EBFT; Slesnick 2009 FFT) included this category of outcomes.
Verbal aggression (youth) (CTS)
We found no effect on this measure (combined MD ‐0.00, 95% CI ‐0.07 to 0.06) (Analysis 5.1).
Family violence (youth) (CTS)
We found no effect on this measure (combined MD ‐0.00, 95% CI ‐0.02 to 0.02) (Analysis 5.2).
Summary of change scores (Appendix 2)
Baseline mean scores on these measure were low in all groups, and similarly small reductions were apparent for both outcome items across groups.
Increased contact with family
Summary
No statistically significant effects were demonstrated.
Percent days living at home
We included three‐month data for Slesnick 2009 EBFT and Slesnick 2009 FFT (Analysis 6.1). We noted no statistically significant effects on this measure because CIs were considerably wide, numbers of participants were small or effects were uncertain. The MD for the EBFT comparison was ‐2.00 (95% CI ‐28.09 to 24.09) favouring the control group, and for the FFT comparison ‐17.00 (95% CI ‐43.22 to 9.22), again favouring the control group. The combined MD was ‐9.46 (95% CI ‐27.96 to 9.03) in favour of the control condition. This may have indicated benefit for those in the comparison condition.
Summary of change scores (Appendix 2)
The trend for the intervention groups was mixed at different time points, but overall trends appeared to favour the control group while indicating improvement across all groups at 12 months.
Participation in intervention planning and delivery
Not measured in included studies.
Other outcomes
The following outcomes were relevant to the secondary outcomes as stated in our protocol but did not correspond to predefined secondary outcome measures. We have grouped them into the following categories: social functioning, psychological functioning and family functioning. As above, we have reported on data included in the meta‐analysis, change scores (calculated by review authors) and other data (as presented by study authors).
Social functioning
We included the following outcome item in the meta‐analysis.
-
Delinquent behaviours (at three, six and 12 months).
Summary
For this outcome item, we found some statistically significant effects but overall results were inconclusive.
We included three‐month data for Cauce 1994, Milburn 2012, Slesnick 2005, Slesnick 2009 EBFT and Slesnick 2009 FFT (Analysis 7.1). The combined point estimate showed a marginal effect that was statistically significant (combined SMD ‐0.29, 95% CI ‐0.54 to ‐0.03). Of the individual studies, only results from the Milburn 2012 showed statistical significance, although the effect was very small. We included six‐month data for Milburn 2012, Slesnick 2005 and Slesnick 2007/08 (Analysis 7.2) and found a marginal and statistically non‐significant effect (combined SMD ‐0.07, 95% CI ‐0.52 to 0.37), although again Milburn 2012 showed a statistically significant but small result. We included 12‐month data for Milburn 2012 and Slesnick 2005 (Analysis 7.3). The combined SMD was ‐0.16 (95% CI ‐1.05 to 0.72). However, a small statistically significant effect favoured the intervention group in Milburn 2012 (MD ‐0.63, 95% CI ‐1.11 to ‐0.14).
Summary of change scores (Appendix 2)
Change scores for delinquent behaviours were mixed and were difficult to interpret because of information on the various scales used was limited. One study (Slesnick 2007/08) appeared to show an increase in scores for the intervention group against a reduction in scores for the control group. Other studies reported reductions in both groups ‐ slightly larger in intervention groups in Cauce 1994 and Peterson 2006 , and larger in the control group in the Slesnick studies. Measurements in Slesnick 2007/08 suggested some benefit for the intervention group for social stability. .
Psychological functioning
Summary
For this outcome category, we found no statistically significant effects in meta‐analyses.
We included the following outcome items in the meta‐analysis.
-
Internalising problems (at three, six months).
-
Externalising problems (at three, six months).
-
Number of psychiatric diagnoses (at three months).
Internalising problems
We included three‐month data for Cauce 1994, Slesnick 2005, Slesnick 2009 EBFT , Slesnick 2009 FFT, Carmona 2014/Slesnick 2015 CM , Carmona 2014/Slesnick 2015 CRA , Carmona 2014/Slesnick 2015 MET , Slesnick 2013/Guo 2014 CRA , Slesnick 2013/Guo 2014 EBFT and Slesnick 2013/Guo 2014 MET (Analysis 8.1). We noted no clinically or statistically significant effects for internalising problems at three months (combined MD 0.73, 95% CI ‐0.87 to 2.34). We included six‐month data for Slesnick 2005, Slesnick 2007/08, Carmona 2014/Slesnick 2015 CM , Carmona 2014/Slesnick 2015 CRA , Carmona 2014/Slesnick 2015 MET , Slesnick 2013/Guo 2014 CRA , Slesnick 2013/Guo 2014 EBFT and Slesnick 2013/Guo 2014 MET (Analysis 8.2). The forest plot showed little evidence of effect, with the combined MD of 0.30 (95% CI ‐1.36 to 1.97). We included 12‐month data (Analysis 8.3) for Carmona 2014/Slesnick 2015 CM , Carmona 2014/Slesnick 2015 CRA , Carmona 2014/Slesnick 2015 MET , Slesnick 2005 , Slesnick 2013/Guo 2014 CRA , Slesnick 2013/Guo 2014 EBFT and Slesnick 2013/Guo 2014 MET. The combined MD was 0.31 (95% CI ‐1.58 to 2.20). As for depression, effects were relatively small, possibly because of split numbers in the control intervention group. Effects were largest (but were not statistically significant) for studies with an SAU group, and favoured the intervention. Overall, effects for individual studies were mixed and inconsistent across time points. This may reflect participant drop‐out. Within change scores, studies showed a consistent reduction across time points and intervention types (including control groups), which may reflect an overall positive 'intervention effect' on mental health. Alternatively, this may reflect changes over time. (For change scores, see Appendix 3 .)
Externalising problems
We included three‐month data for Cauce 1994, Slesnick 2005, Slesnick 2009 EBFT , Slesnick 2009 FFT, Carmona 2014/Slesnick 2015 CM , Carmona 2014/Slesnick 2015 CRA , Carmona 2014/Slesnick 2015 MET , Slesnick 2013/Guo 2014 CRA , Slesnick 2013/Guo 2014 EBFT and Slesnick 2013/Guo 2014 MET (Analysis 8.4). We noted no statistically significant effects for externalising problems at three months (combined SMD 0.09, 95% CI ‐0.10 to 0.28). We included six‐month data for Slesnick 2005, Slesnick 2007/08, Carmona 2014/Slesnick 2015 CM , Carmona 2014/Slesnick 2015 CRA , Carmona 2014/Slesnick 2015 MET , Slesnick 2013/Guo 2014 CRA , Slesnick 2013/Guo 2014 EBFT and Slesnick 2013/Guo 2014 MET (Analysis 8.5). The combined MD was 0.83 (95% CI ‐2.89 to 2.97). Slesnick 2005 reported a small MD of 2.59 (95% CI ‐1.34 to 6.52) favouring the control group. In contrast, Slesnick 2007/08 showed a slight but similarly statistically non‐significant effect (MD ‐1.21, 95% CI ‐3.93 to 1.51) favouring the intervention group. We included 12‐month data (Analysis 8.6) for Carmona 2014/Slesnick 2015 CM , Carmona 2014/Slesnick 2015 CRA , Carmona 2014/Slesnick 2015 MET , Slesnick 2005 , Slesnick 2013/Guo 2014 CRA , Slesnick 2013/Guo 2014 EBFT and Slesnick 2013/Guo 2014 MET. The combined MD was 0.04 (95% CI ‐2.89 to 2.97). Although results for individual interventions were mixed, combined effect sizes appeared to favour the control group at three and six months (although this finding was not statistically significant). This may have been a statistical artefact following from the reasons described above. Again, effects for individual interventions were inconsistent across time points. As above, change scores,imply that longer‐term follow‐up showed a reduction in symptoms across all interventions. (For change scores, see Appendix 3 .)
Number of psychiatric diagnoses (CDISC)
We included three‐month data for Slesnick 2005, Slesnick 2009 EBFT and Slesnick 2009 FFT (Analysis 8.7) and found no statistically significant effect (combined SMD ‐0.06, 95% CI ‐0.50 to 0.37).
Summary of change scores for psychological functioning (Appendix 2)
Change scores in this category suggested little change or improvement in all groups, with the scale of the change appearing to favour different groups in different studies and at different time points.
Other psychological well‐being measures
In Nyamathi 2012/13 AM and Nyamathi 2012/13 HPP, study authors reported that psychological well‐being scores rose significantly in the total sample. They were reported to have risen significantly in the HHP group, but not in the AM group. Investigators provided no P values and no effect sizes for this outcome.
Family functioning
Summary
We found no statistically significant effects apart from a small effect favouring the intervention group for family cohesion at three months.
We included the following outcome items in the meta‐analysis.
-
Family cohesion (three months).
-
Family conflict (three months).
-
Parental care (three months).
-
Parental overprotectiveness (three months).
It should be noted that only one group of studies (Slesnick 2005 ; Slesnick 2009 EBFT; Slesnick 2009 FFT) included this category of outcomes.
Family cohesion (FES)
We noted a small, clinically marginal but statistically significant effect on this measure (combined MD 0.88, 95% CI 0.23 to 1.54) (Analysis 9.1). A slight non‐significant effect favoured the intervention groups (EBFT and FFT) in Slesnick 2009 EBFT and Slesnick 2009 FFT (MD 1.12, 95% CI ‐0.01 to 2.25; and MD 1.30, 95% CI ‐0.06 to 2.66, respectively).
Family conflict (FES)
We observed no effect on this measure (combined MD ‐0.05, 95% CI ‐0.91 to 0.81) (Analysis 9.2).
Parental care (PBI)
We found no statistically significant effect on this measure (combined MD 1.68, 95% CI ‐0.63 to 4.00) (Analysis 9.3) but marginal effects for all intervention groups: MD 1.45 (95% CI ‐1.77 to 4.67) in Slesnick 2005, 2.16 (95% CI ‐2.41 to 6.73) for Slesnick 2009 EBFT and 1.67 (95% CI ‐3.18 to 6.52) for Slesnick 2009 FFT.
Parental overprotectiveness (PBI)
We noted no statistically significant effect on this measure (combined MD ‐0.13, 95% CI ‐2.58 to 2.43) (Analysis 9.4) but small non‐statistically significant effects in differential directions: MD 2.34 (95% CI ‐0.99 to 5.67) in Slesnick 2005 favouring the control group, and ‐3.39 (95% CI ‐8.52 to 1.74) for Slesnick 2009 EBFT and ‐2.69 (95% CI ‐7.78 to 2.40) for Slesnick 2009 FFT in favour of the intervention groups. Results for this outcome were mixed and thus uncertain, with some benefit reported for control groups, thus indicating potential benefit of the comparison SAU condition.
Summary of change scores (Appendix 2)
According to change scores (longest follow‐up 15 months), trends appeared similar for all groups, indicating improvement, apart from an increase in parental overprotection at three months in the control group in Slesnick 2009 FFT. The magnitude of change appeared to be similar to or to favour different groups at different time points.
Service evaluations
Researchers in four studies conducted these evaluations. Participants in Peterson 2006 and Baer 2007 rated their satisfaction with the intervention on a 5‐point scale. Evaluations were mainly positive (even when actual outcomes were mixed); Peterson 2006 reported scores that were so consistently positive that we excluded the data from the analysis. Rew 2007 also reported positive feedback on their qualitative evaluations.
Heterogeneity
Most of the statistical meta‐analyses in this review show 0% as the I2 statistic, indicating no heterogeneity. Several analyses show I2 around the 50% (moderate heterogeneity) mark for depression at three months (54%), percent days of alcohol use (three months) (42%), number of times participant had sex (six months) (47%), parental overprotection (three months) (57%), externalising behaviours at six months (59%), externalising behaviours at three months (54%) and delinquent behaviours at three months (35%). Some of these studies reported small numbers and varied measurements, and this may explain some of the differences. Also, some of these analyses included only two studies, reducing the precision of the I2 calculation.
Two analyses showed high I2 values: delinquent behaviours at six months (77%), and delinquent behaviours at 12 months (88%). The Slesnick studies showed very high standard deviations for measures included in these analyses, and the high I2 might be accounted for by this extreme skew. Delinquent behaviours were measured differently between Milburn 2012 and the Slesnick studies.
However, overall populations did differ between studies, and this might explain some of the variation (see below).
Heterogeneous factors
Studies collected a wide range of demographic data; however, the data collected were not consistent across studies and were not consistently utilised in data analyses. In this section, we have discussed the most commonly assessed demographic confounders. As we did not gain access to raw data specific to subpopulations, we relied here on study authors' own analyses.
Overall demographic analyses
According to Baer 2007, demographic factors and treatment exposure did not moderate outcomes. Slesnick 2009 EBFT and Slesnick 2009 FFT found that the level of (HIV‐related) high‐risk behaviours in which participants engaged at baseline was a stronger predictor of change in HIV risk behaviours than was the treatment condition, Beck Depression Inventory‐rated depression and other demographic variables (those with a higher score were more likely to show statistically significant improvement).
Attrition analyses
For practical reasons, transient children and youth sometimes were excluded from participation or were lost to follow‐up, although some studies actively tried to minimise attrition rates (see Incomplete outcome data (attrition bias)), for example, by contacting absent participants. Most studies used incentives for assessment attendance for both groups, which ranged from practical items such as toothbrushes to vouchers or money. Participants in all studies by Slesnick were paid the most in absolute value ($50 at each follow‐up). Participants in a similar study by Milburn 2012 received $30 to $40 at follow‐up. Participation rates varied across these studies, with Milburn 2012 having the lowest follow‐up rate among all included studies. Whilst Rotheram‐Borus 2003 reported no assessment incentives, follow‐up rates were relatively good even at 24 months (as above). On the whole, follow‐up rates in the included studies were relatively good (see Description of studies).
The studies detailed below examined characteristics of drop‐outs.
Slesnick 2007/08 found that drop‐outs differed on alcohol abuse, marijuana dependence and HIV risk for the past three months. Youth who completed all assessments had greater prevalence of marijuana dependence, lower prevalence of alcohol abuse and lower HIV risk score. They did not differ significantly by gender, ethnicity, treatment modality or baseline depression. This may be contrasted with the finding of study authors showing that baseline HIV risk behaviour scores were the strongest predictor of improvement on the same outcome measure.
In Slesnick 2009 EBFT , Slesnick 2009 FFT, Slesnick 2013/Guo 2014 CRA , Slesnick 2013/Guo 2014 EBFT , Slesnick 2013/Guo 2014 MET , Carmona 2014/Slesnick 2015 CM , Carmona 2014/Slesnick 2015 CRA , Carmona 2014/Slesnick 2015 HIV and Carmona 2014/Slesnick 2015 MET , those lost to follow‐up did not differ in demographic and/or dependent variables from participants retained in the study for most outcomes. Attrition also did not differ by treatment modality. However, in Slesnick 2013/Guo 2014 CRA , Slesnick 2013/Guo 2014 EBFT and Slesnick 2013/Guo 2014 MET , males were more likely to have missing Beck Depression Inventory‐II scores; thus gender was controlled for in relevant analyses.
In Peterson 2006, attrition was associated with age, recruitment during spring or summer, recruitment area and frequency of drug use. Among intervention and assessment‐only groups, longer time on the street, male gender, recruitment during spring or summer and more frequent use of alcohol increased the likelihood of missing one or more follow‐up interviews.
In Nyamathi 2012/13 AM and Nyamathi 2012/13 HPP, participants lost to follow‐up were more likely to be African American or Hispanic and to have had no intimate partners. Cocaine users at baseline were particularly more likely to have been lost to follow‐up. Researchers reported no differences with respect to age, education or use of other substances.
In summary, the profile for drop‐out participants varied across studies, possibly depending on recruitment methods, engagement strategies and types of interventions (see also Patton 2011). Available data were too limited to permit overall conclusions.
Gender analyses
Slesnick 2005 , Slesnick 2007/08 , Slesnick 2009 EBFT , Slesnick 2009 FFT , Rew 2007 and Rotheram‐Borus 2003 conducted gender analyses.
Slesnick 2005 found no treatment interactions by gender. Slesnick 2009 EBFT and Slesnick 2009 FFT reported some gender differences at baseline. EBFT was found to be effective for both young men and young women in reducing substance use, and FFT was reported to decrease substance use among young men (and older adolescents) only. Neither young men nor young women in the SAU group significantly reduced their substance use, and young men in SAU were reported to have increased their alcohol use by 50% by 15 months. However, in an analysis in Slesnick 2006c, which apparently combined data from Slesnick 2005 and Slesnick 2009 EBFT, primary drug‐using young men (Slesnick 2005 sample) in the intervention group increased their use of alcohol by 30% while decreasing their drug use, as did participants in both intervention and control groups regardless of gender or of whether they were primary alcohol or drug users (Slesnick 2005 ; Slesnick 2009 EBFT sample).
In Slesnick 2007/08, young women reported higher overall HIV risk behaviours at baseline. Also, young women were more likely to engage in HIV risk behaviours (main effect). No gender effects were reported in Slesnick 2007/08.
In Slesnick 2005, 47% of female participants reported that they had been sexually abused, compared with only 8% of male participants. Abuse history was found to moderate certain outcomes (problem consequences and number of drugs used) in favour of youth assigned to the EBFT intervention. Slesnick 2006 combined data from the included Slesnick 2005 and Slesnick 2009 EBFT studies (which involved the same intervention) for analysis with a focus on history of abuse. Contrary to expectations, study authors found no association between abuse history and level of substance use or between abuse history and treatment outcome.
In Rew 2007, young women scored higher on various positive sexual health measures (e.g. AIDS and STD knowledge). Study results suggest that young women benefited from the gender‐specific intervention with increased confidence and improved self care behaviours compared with those in the control condition.
In Rotheram‐Borus 2003, the number of sexual partners and the number of unprotected sexual acts were lower at 24 months for young women in the intervention group ‐ according to study authors significantly so (raw data were unavailable for this study). Studyauthors suggested that young women were more likely to find a degree of stability and protection in romantic relationships, limiting the need to participate in harmful sexual and drug use behaviours for survival, whereas young men were more continually exposed to high‐risk environments and events such as incarceration.
Slesnick 2007/08 was the only study to assess whether participants had engaged in 'survival sex', defined as 'trading sex for money, food or shelter' (p 5). In the intervention group, the percent of participants who had engaged in 'survival sex' remained at 3.1% to 3.7% of the population across the three time points (baseline, three months, six months). In the SAU group, the percent dropped from 8.3% at baseline to 3.0% at three months and 0% at six months. Although the numbers are small, this result could be interpreted in different ways, depending on whether participants in SAU reduced their engagement in 'survival sex' or simply dropped out of the study.
In Carmona 2014/Slesnick 2015 CM , Carmona 2014/Slesnick 2015 CRA , Carmona 2014/Slesnick 2015 HIV and Carmona 2014/Slesnick 2015 MET, sex and childhood abuse were found to have more moderating effects than age and gender. Also, females showed greater gains for both primary and secondary outcomes, although some were present only in the intention‐to‐treat (ITT) group ‐ not in the treated sample.
Slesnick 2013/Guo 2014 CRA , Slesnick 2013/Guo 2014 EBFT and Slesnick 2013/Guo 2014 MET found gender differences at baseline on psychological measures but reported no other differences.
Ethnicity analyses
Investigators in the Slesnick studies ( Slesnick 2005 ; Slesnick 2007/08 ; Slesnick 2009 EBFT ; Slesnick 2009 FFT ) conducted ethnicity analyses to compare Anglo‐American versus non‐Anglo‐American or Hispanic participants. They found few differences between ethnic groups at baseline. In Slesnick 2005, Anglo‐American youth were more likely to report at least one previous suicide attempt; in Slesnick 2007/08, more Anglo‐American youths reported that they had sex with more than one partner in the last 24 hours; and in Slesnick 2009 EBFT and Slesnick 2009 FFT , Anglo‐American youth reported higher conflict tactics with verbal aggression. Treatment interaction by ethnicity was found for the number of DSM‐IV Axis I diagnoses in Slesnick 2005 that showed an opposing pattern for the two groups for changes at three and six months. At 12 months, both groups obtained similar scores. Primary treatment outcomes were not moderated by ethnicity. Carmona 2014/Slesnick 2015 CM , Carmona 2014/Slesnick 2015 CRA , Carmona 2014/Slesnick 2015 HIV and Carmona 2014/Slesnick 2015 MET found an interaction between ethnicity and percent days of homelessness. In Slesnick 2013/Guo 2014 CRA , Slesnick 2013/Guo 2014 EBFT and Slesnick 2013/Guo 2014 MET, minority adolescents were found to show significantly greater reduction in substance use compared with white adolescents across all interventions, followed by quicker relapse.
Age analyses
Researchers in the Slesnick studies conducted age analyses.In Slesnick 2007/08, older (19‐ to 22‐year‐old) participants reported higher mean overall HIV risk behaviour scores, had greater HIV knowledge and were more likely to report intravenous drug use than younger (14‐ to 18‐year‐old) participants. A slight increase in condom use was the only positive outcome related to reduction in sexual risk behaviours in this study. This was observed for all participants in the intervention group, as well as for older participants in SAU, whereas younger participants in SAU decreased their use of condoms. Change patterns at three and six months differed according to age group within each treatment condition. Further, for age‐moderated treatment outcomes for depression, participants of all ages in the intervention group showed significantly reduced depression, and younger youth in SAU exhibited reduced depression in contrast to older youth in SAU. Older participants (in all intervention groups) showed greater reductions in depressive symptoms in Carmona 2014/Slesnick 2015 CM , Carmona 2014/Slesnick 2015 CRA , Carmona 2014/Slesnick 2015 HIV and Carmona 2014/Slesnick 2015 MET.
Other demographic factors
No study exclusively compared young people receiving a service with those on the street who were not engaged in any way with services. As a result of the study methods most commonly used, research participants in the intervention and SAU groups may have represented a self selected sample with relatively high levels of help‐seeking attitudes and motivation to change, as many measured outcomes showed a positive change from baseline in both groups (see change scores in Appendix 2). Included studies provided very limited evidence that could be used to test this hypothesis.
In Peterson 2006, the study counsellor rated intervention participants' 'level of engagement'. This was found to not differ by age, gender, length of time on the street, baseline drug use, history of injection drug use, sexual and physical abuse history or recruitment method, which included recruitment of some participants directly from the street. Some degree of correlation with 'stage of change' was found (see below).
Peterson 2006 was the only study to measure participants' 'stage of change'. This measurement was based on the conceptualisation of Prochaska et al (1992) (cited in Peterson 2006) and was assessed at baseline only with an algorithm based on intention to change alcohol or drug use, whether changes had already been made and the time frame of those intentions or changes. Stage of change was found to moderate outcome results for drug use ('summed drug use other than marijuana') but not for alcohol or marijuana use. Study authors presented no analysis of correlation of this variable with other demographic variables.
As reported above under the section on gender analyses, Slesnick 2006 examined the relationship between abuse history, substance abuse at baseline and family functioning as a treatment outcome, apparently combining data from Slesnick 2005 , Slesnick 2009 EBFT and Slesnick 2009 FFT. Slesnick 2006c, which combined data from Slesnick 2005 and Slesnick 2009 EBFT , examined the relationship between primary drug versus primary alcohol substance abuse profiles at baseline, gender and substance abuse as a treatment outcome (also reported above under 'Gender analyses').
Nyamathi 2012/13 AM and Nyamathi 2012/13 HPP provided evidence suggesting that being motivated to improve and having a partner were associated with improved HIV/AIDS and HCV (Hepatitis C knowledge) scores.
Process evaluations
None of the included studies reported on a separate process evaluation component. However, some service delivery factors were accounted for in individual analyses.
In Peterson 2006, the study counsellor rated participants for their perceived 'level of engagement'. For analyses, investigators grouped intervention participants into those with 'high' and those with 'low' levels of engagement. Participants classed as ‘high engagement’ as opposed to 'low engagement' had significantly lower scores on 'summed drug use other than marijuana' (but not on the other two outcomes) at one month, although the contrast had been reduced to non‐significant levels at three months. Mean scores for control group participants' were between the scores of these two groups. The result was not replicated in a later study (Baer 2007).
In comparing treatment attendance rates in their two family therapy interventions, Slesnick 2009 EBFT and Slesnick 2009 FFT speculated that the physical setting of the family therapy intervention (e.g. home rather than office) rather than the particular style of therapy (i.e. EBFT vs FFT) may have been a critical factor for successful treatment engagement (defined as responsiveness to the therapy approach, leading to more positive outcomes). Moderating effects of gender and age on some outcomes were hypothetically linked to treatment engagement.
Treatment attendance was easier to measure than the more qualitative concept of treatment engagement. According to statistical analyses in Slesnick 2009 EBFT and Slesnick 2009 FFT, two demographic variables (higher externalising behaviours and sexual abuse) were associated with increased treatment attendance in the EBFT condition only. However, no moderating effects were reported for treatment attendance. In another Slesnick study (Slesnick 2008; not included in the review), a sexual abuse history and a history of suicide attempts were found to predict higher levels of treatment attendance, and higher treatment attendance in turn was associated with greater reduction in alcohol use but not with other substance use outcomes.
Although some interventions did appear effective in certain outcome measures, the reasons for their effectiveness remained unclear. For example, Peterson 2006 (p 259 to 260) reported that although use of illicit drugs (other than marijuana) was reduced in the intervention group relative to the control group, "there was nothing in the data to suggest that the [motivational enhancement] intervention had even a small effect on drug use through influencing stage of change." The most consistently positive results for substance use outcomes were found for the two types of family therapy interventions evaluated in Slesnick 2005, Slesnick 2009 EBFT and Slesnick 2009 FFT. In contrast, none of these interventions had a significant differential impact on family functioning, which improved for both groups, or on percent days living at home (reported only in Slesnick 2009 EBFT and Slesnick 2009 FFT), for which a relatively greater increase was apparent in the control group.
According to the composite analysis provided in Slesnick 2006, family cohesion, number of diagnoses other than substance‐related ones at time point one and number of drugs used at baseline emerged as the three potentially most significant predictors of change in substance use in the intervention group. Together they accounted for around 39% of the variability in change across time. Self reported family cohesion was the only treatment‐relevant factor, defined as perceived commitment, mutual help and support within the family. Although family cohesion also improved in the SAU groups, it was not associated with change in substance use for SAU participants according to this analysis.
Although these findings may reflect some of the inadequacies of outcome measures, they also suggest that interventions did not necessarily or primarily achieve change in the anticipated manner, that is, by enhancing motivation to change or by improving family functioning. Population characteristics, pre‐existing motivation to change, level of engagement or treatment attendance, setting, counsellor style and length or intensity of intervention emerged as possible contributors to the findings obtained. For example, Slesnick 2007/08 reported on significant therapist effects on reductions in substance use, although what distinguished the more successful therapist styles was not examined. Although some of these factors were controlled for in individual analyses, studies did not provide sufficient evidence to permit robust overall conclusions (see Hossain 2014 for a more detailed discussion). Overall, the range of potentially confounding factors makes such analyses very difficult.
Discussion
Summary of main results
Synthesis
Longer‐term intervention effects for family therapy interventions with runaway adolescents or for newly homeless youth in studies in both the original review and update (Slesnick 2005, Slesnick 2009 EBFT; Slesnick 2009 FFT; Milburn 2012; Slesnick 2013/Guo 2014 CRA; Slesnick 2013/Guo 2014 EBFT; Slesnick 2013/Guo 2014 MET) appeared on average relatively strong for certain outcome items (mainly related to substance use), although these interventions did not outperform other interventions in all studies. Overall, findings of the review suggest that use of structured services in itself predicts positive change in a range of outcomes. Further, the service as usual (SAU) conditions included in this review may have been more effective than specialised interventions in certain outcome categories, for example, reduction of sexual risk behaviours and increased contact with family. However, because of methodological limitations discussed here, we draw this conclusion with caution.
In our primary logic model (Figure 1), we outlined the broad components that appear to contribute most to intervention success with street‐connected children and youth based on our review of the research literature, including qualitative research. Most of the interventions included in this review focused on behaviour change related to participants' current lifestyle or reduction in associated harms, or both. We did not evaluate longer‐term outcomes beyond narrowly defined problem areas, and we did not identify studies from low‐ and middle‐income countries (LMICs) that could be included.
Overview of studies
Most of the 13 included studies were comparisons of two different interventions ‐ a specialised, therapeutic intervention versus SAU (three studies did not detail comparison conditions, but research populations were recruited largely from shelters rather than from the street). In most cases, the comparison intervention could also be considered a co‐intervention because intervention participants were not excluded from taking part in SAU. At the review update, we added three studies (measuring eight interventions) to the analysis. All of the most recent studies compared interventions with one another, and we selected the briefest/most conventional intervention to represent the control condition.
All specialised interventions were based on therapeutic models, including social, emotional, cognitive, behavioural and systemic orientations. Four interventions represented a multi‐component approach that also included liaison with external service providers (e.g. housing departments, legal bodies), and six were delivered within a peer or family group setting. Participatory methods were not utilised in any study, although one arts‐based intervention tested in Nyamathi 2012/13 AM and Nyamathi 2012/13 HPP was initially developed through participatory means. Not all of the included studies provided information on SAU characteristics. It is clear, however, that some of the usual services were provided at a high standard and, in light of the similarities in outcomes achieved, may have been comparable with many of the specialised therapeutic interventions evaluated (see Quality of the evidence section). None of the included studies included long‐term residential settings as a control condition.
Although study populations varied somewhat between studies and interventions were reasonably heterogeneous, selected outcomes were notably homogeneous across the included studies, falling primarily into the categories of substance abuse (drug or alcohol), individual psychological functioning, social functioning and sexual health behaviours. In contrast, outcome measures and, consequently, individual outcome items were considerably varied. Little information was available to permit interpretation of the clinical or subjective significance of results reported for the study population in question or the potential impact of differences between constructs on outcomes.
In terms of the aims of the review, no studies explicitly targeted the primary outcomes defined in our protocol ‐ inclusion and reintegration. In summary, all included interventions were relevant mainly to our secondary outcomes, although only a small proportion of the elements covered in our secondary outcomes or logic models were covered by any of the included interventions. In contrast, comparison interventions, that is, SAU, often appeared broader in scope.
Secondary outcomes for which data were included in the meta‐analysis included safer or reduced sexual activity; safer or reduced substance use; self esteem; depression; reduced use of violence; and increased contact with family. We presented data from one study on increased use of hostel‐ or shelter‐type services. No data were available for literacy; numeracy; participation in education; participation in skills‐based (rather than exploitative) employment; or participation in intervention planning and delivery. Other outcomes measured in the included studies fell into the categories of social functioning, psychological functioning and family functioning. No studies reported on adverse outcomes.
Only a limited number of studies could be included in meta‐analyses because of the extreme heterogeneity of outcome measures and time points used. To complement the meta‐analyses, we calculated change scores for all outcome items for which we had raw data (see Appendix 2), primarily to highlight the fact that in many cases intervention effects appeared to be paralleled by positive changes of similar scale in the control group. Instances in which the control group showed greater improvement than the intervention group, or improved in opposition to a deteriorating trend in the intervention group, were rarely highlighted by study authors. We wished to draw attention to such instances, as they may provide some evidence of the comparative strengths of the SAU condition. However, because of the nature of the data available to us, we could not calculate standard deviations or standard errors for change scores. We therefore refer to them as indications only.
Even in cases in which some statistically significant effects were indicated through meta‐analyses (or when change scores suggested statistically or clinically significant changes), most interventions achieved mixed results in relation to different outcome categories or items and different time points. No consistent pattern was found for these differential impacts across studies. Also, the clinical and practical significance of these findings was often unclear.
Methodological limitations of the included studies are detailed elsewhere in the review (e.g. Risk of bias in included studies; Quality of the evidence; summary of findings Table for the main comparison), but tentatively the data appear to support the conclusion that services need not be highly specialised or technical to foster some degree of positive change among street‐connected children and youth recruited through shelters or drop‐ins. A specialised intervention offering some therapeutic programme has not proved consistently better than usual shelter or drop‐in service in these studies. On the basis of longer‐term change scores from four comparable studies (Carmona 2014/Slesnick 2015 CM; Carmona 2014/Slesnick 2015 CRA; Carmona 2014/Slesnick 2015 HIV; Carmona 2014/Slesnick 2015 MET; Milburn 2012; Slesnick 2005; Slesnick 2009 EBFT; Slesnick 2009 FFT; Slesnick 2013/Guo 2014 CRA; Slesnick 2013/Guo 2014 EBFT; Slesnick 2013/Guo 2014 MET), benefits achieved in the intervention and control groups appeared in some cases substantial and relatively long‐lasting (12 to 24 months). Data from comparable studies (e.g. suite of studies by Slesnik teams) included at update reinforce this pattern. These studies did not include SAU but showed little difference between longer‐ and shorter‐term intervention groups.
As a result of the limitations of the study designs employed, generic maturational effects underlying positive trends cannot be ruled out. As noted in one study, substance use patterns are characterised more often by change than by stability, and 'there appear to be natural developmental processes toward moderation of use' (Baer et al 1998, cited in Peterson 2006, p 261). Longitudinal data on homeless young people living on the street in the United States offer some support for this trend (Whitbeck 2009, Chapter 15). However, the latter authors also argue that on the level of individual diagnoses, longitudinal data demonstrate long‐term stability across a range of mental health indicators including diagnoses for substance abuse, as well as continued social marginalisation. Findings support the notion of complementing overall analyses with individual‐level analyses, as discussed below in the section on Quality of the evidence (statistical analyses).
In our analyses, some of the most consistent improvements (in intervention and control groups) in substance abuse outcomes took place among participants residing at runaway shelters. Runaways are a distinct subpopulation of street‐connected children and youth who may never have lived on the street (Robertson and Toro 1999, cited in Slesnick 2007/08). Thus, they are likely to have relatively stronger family ties and limited engagement with street life. Participant scores on a range of risk measures (e.g. HIV risk behaviours, sexual activity, family violence) were usually relatively low on average in the included studies. However, even with these populations, results were mixed on the level of individual outcome items, as discussed below. Overall, we have limited knowledge of the process factors contributing to positive outcomes.
Outcome findings
Our meta‐analyses showed statistically significant changes in either direction for five outcome items. These included number of standard drinks at three months (favouring the intervention) (see Analysis 2.6), number of problem consequences at three months (favouring the comparison intervention) (see Analysis 2.18), number of substance use diagnoses at three months (favouring the intervention) (see Analysis 2.20), delinquent behaviours at three months (favouring the intervention) (see Analysis 7.1) and family cohesion at three months (favouring the intervention) (see Analysis 9.1). Each analysis relates to secondary outcome measures in a small number of studies (among these analyses, the greatest number of interventions was included for 'delinquent behaviours at three months', which also shows the smallest effect). Overall, these findings appear mixed and inconsistent. No data at update stage changed the significance of the original findings.
As noted above, a limitation of our primary analyses is that we were unable to include in the meta‐analysis a large quantity of relevant data because investigators used different measurement types and time points. Therefore, for the evaluation summary below, we also draw on change scores (Appendix 2) and authors' own analyses.
Safer or reduced sexual activity
Outcome measures and findings in this category were very mixed, with limited to no statistically significant or consistent intervention effects apparent. Moreover, we did not gain access to raw data from four of five relevant studies in this category, and data for some of the outcome items were considerably skewed. In Rotheram‐Borus 2003, which had the longest follow‐up period in any study, study authors reported that despite initial improvements in certain areas, in particular substance use, relapse had occurred by between three and six months for young men, and by 12 months for young women. The only long‐term effect reported in their study was that for young women, both sexual partners and unprotected sexual acts were fewer at 24 months. Among young men, intervention and control groups followed a broadly similar pattern, but among women the patterns were more mixed.
Safer or reduced substance use
This was the category for which the largest quantity of data were available for comparison; therefore we report on the outcomes at some length.
In two studies (Baer 2007; Peterson 2006), change scores indicated improvement in both groups, with some appearing to favour the control group in terms of the scale of the change (e.g. number of days of alcohol use in Peterson 2006). Study authors reported a statistically significant intervention effect on 'summed drug use other than marijuana' at one month but not at three months in Peterson 2006.
According to the authors of three studies, family therapy interventions for runaway adolescents appear to have achieved some statistically significant and lasting (12 to 15 month) benefits in reducing alcohol or drug use, somewhat above the similarly positive benefits for participants receiving SAU (Milburn 2012; Slesnick 2005; Slesnick 2009 EBFT; Slesnick 2009 FFT). Changes in both groups also appear clinically significant. Overall, however, results from these studies were mixed, as is discussed below. It should be noted that Milburn 2012 had the highest rate of attrition among the included studies; approximately half of the participants were missing at 12 months. Furthermore, research participants in all three studies were shelter‐residing runaways with some family contact, and most were of Hispanic background. In a later study with a 24‐month follow‐up (Slesnick 2013/Guo 2014 CRA; Slesnick 2013/Guo 2014 EBFT; Slesnick 2013/Guo 2014 MET), the family therapy intervention did not outperform the two other types of interventions examined, although some differences by treatment modality emerged in a latent trajectory analysis when participants were grouped into change classes according to their individual substance use trajectories. Significant reductions for some substance use outcomes were indicated in both groups, but particularly in the nurse‐led (control) intervention group, in Nyamathi 2012/13 AM and Nyamathi 2012/13 HPP.
Even data from the relatively most successful interventions (Milburn 2012; Slesnick 2009 EBFT; Slesnick 2009 FFT ; Carmona 2014/Slesnick 2015 CM; Carmona 2014/Slesnick 2015 CRA; Carmona 2014/Slesnick 2015 MET) suggest that interventions may to some degree change the pattern of substance abuse rather than reduce it. For example, in Milburn 2012, intervention participants (with a primarily alcohol‐using profile) increased their use of marijuana while reducing use of alcohol and hard drugs. Similarly, although demonstrating an opposite trend, an analysis in Slesnick 2006c, which combined data from Slesnick 2005 and Slesnick 2009 EBFT, suggested that unlike primary alcohol‐abusing participants (both young men and young women), primary drug‐abusing young men in the ecologically based family therapy (EBFT) intervention group increased their use of alcohol by 32% while decreasing drug use similarly to other groups (including the control group). Among the studies by Slesnick, separate data on marijuana use were available for only one study (Slesnick 2005), in which marijuana use followed a similar downward trend as other drug use in both groups. However, change scores on tobacco use in this study indicated a small increase in the intervention group as opposed to a decrease in the control group.
Some contradictions in the data on substance abuse‐related outcomes were also apparent in Slesnick 2009 EBFT and Slesnick 2009 FFT upon review of change scores (mean scores only). For example, although intervention groups showed a significantly greater reduction in mean scores for days of alcohol and drug use compared with SAU groups, problem consequences of substance use (POSIT) showed a similar downward trend for all three groups, and the largest longer‐term reduction in substance use diagnoses and the largest longer‐term increase in percent of days living at home according to change scores appeared to occur in the SAU group (however, see also above meta‐analyses on number of substance use diagnoses (Analysis 2.20) and number of problem consequences (Analysis 2.18), favouring different groups at three months). At update, the two new Slesnik studies reported a narrower range of substance use outcomes and thus provided no evidence to corroborate or refute the original findings.
Self esteem and depression
In this category also, participants in both groups in all studies appeared to improve apart from an increase in depression among control participants in Hyun 2005 (this study had a very small study population). With reduced depression, change scores offered some support for the intervention in Hyun 2005, Slesnick 2007/08, Slesnick 2009 EBFT and Slesnick 2009 FFT; however, our meta‐analysis did not indicate any statistically significant differences at three or six months. In contrast to Slesnick 2009 EBFT and Slesnick 2009 FFT, the Slesnick 2005 control participants appeared to improve slightly more on psychological outcome measures, including depression, according to the change scores. Similarly, in Carmona 2014/Slesnick 2015 CM, Carmona 2014/Slesnick 2015 CRA, Carmona 2014/Slesnick 2015 HIV, Carmona 2014/Slesnick 2015 MET, Slesnick 2013/Guo 2014 CRA, Slesnick 2013/Guo 2014 EBFT and Slesnick 2013/Guo 2014 MET, participants in the control intervention group did not appear to do worse than participants in other intervention groups. Indeed in the later Slesnick studies, all participants in all groups appeared to improve on mental health symptoms over time. However, it is notable that with drop‐out over time, this may reflect a somewhat different participant group than was assessed at earlier time points. The Nyamathi study at update showed no change in depression.
Reduced use of violence
This was measured in only two studies, and baseline scores on this measure were low (Slesnick 2005; Slesnick 2009 EBFT; Slesnick 2009 FFT). We found no significant differences in meta‐analyses, and our change scores indicated that self reported verbal aggression and family violence were reduced similarly in all groups at all included time points (longest follow‐up 15 months).
Increased contact with family
Data on this outcome were reported in only one study (with two intervention groups) (Slesnick 2009 EBFT; Slesnick 2009 FFT), and results were mixed. Although our meta‐analysis shows no statistically significant change, change scores indicate that percent days living at home was reduced in both intervention groups at three months but was increased in the control group. At 15 months, increases were evident across the three groups, but the largest overall increase was noted in the control group.
Other outcomes
Outcomes beyond those outlined in our protocol and showing statistically significant effects in our meta‐analyses included delinquent behaviours at three months (favouring the intervention) (see Analysis 7.1) and family cohesion (favouring the intervention) (see Analysis 9.1). Measures used to capture delinquent behaviours were diverse, and some of the data were skewed. The overall effect was small and was no longer present at later time points (six and 12 months). Change scores for this outcome item were mixed. For family cohesion, three intervention groups and two control groups (from two studies) were included. A statistically significant (if small) effect favoured the intervention groups receiving family therapy. However, longer‐term change scores indicate that differences between the three groups appear to have diminished by 12 to 15 months.
Overall completeness and applicability of evidence
Implications for generalisability (in particular to LMIC contexts) and equity factors
In the following discussion, we focus on the applicability of evidence to other populations of street‐connected children and youth, particularly in LMICs, drawing on a brief overview of comparative data. For the purposes of this discussion, mechanisms for consideration of these questions centre on similarity of interventions, populations and contexts, LMIC and high‐income country (HIC) settings and populations and interventions and contexts of the studies included in this review, as discussed below. Similarly, a discussion by Lavis 2009 on assessing applicability focuses on similarities and differences between populations, contexts and 'on the ground realities'.
The extrapolation tool promoted within Cochrane groups promotes examination of studies for generalisability to more disadvantaged populations according to the following questions: Is there good reason to think that this treatment would work with the disadvantaged? It might work for the disadvantaged, no idea if it would work for the disadvantaged, it might be harmful to the disadvantaged or good reason to think it will be harmful to the disadvantaged, where working (benefit) is defined as benefit outweighing harm, and harm is defined as harm outweighing benefit (Pottie 2010). For the purposes of this review, we have replaced the more disadvantaged populations in this model with LMIC contexts.
In this section, we examine equity‐related issues in the 13 included studies, focusing on ethnicity, socio‐economic status, gender, sexual orientation and disability. We argue that all of the above factors are applicable across HIC and LMIC contexts, and that judgements of generalisability need to be made on a case‐by‐case basis (see our logic model for HIC and LMIC generalisability; Figure 2).
Interventions
Lavis 2009, in discussing applicability, highlights differences in service delivery contexts as of crucial importance for considering generalisability. As noted here, SAU and therapeutic interventions in several included studies incorporate specialist referrals and multi‐agency approaches. An important recent UN report (UN High Commission on Human Rights 2012) on street children recommends to governments many structural factors that might help to promote the rights of street children. Among these are co‐ordinated child protection and welfare systems; consistent birth registration; multi‐agency working partnerships; adequate financial provision for structures, services and co‐ordination; and ways to addressing stigma and discrimination among street children. Clearly, contexts in which such structures currently exist differ in many ways from contexts in which they do not. Many non‐government organisation (NGO) street children interventions in LMICs currently incorporate interventions similar to the SAU services offered in the included studies, but caution should be exercised when applying the results of this review to contexts that lack protective structural arrangements, and generalisability should be assessed on a context‐by‐context basis.
Provision of a drop‐in or shelter service is perhaps the most typical form of intervention available for this population in both HICs and LMICs, and is the SAU received by comparison groups in the included studies. Such services commonly provide for basic physical and psychological needs, and sometimes facilitate access to specialist services. However, none of the included studies explicitly set out to examine the effectiveness of such services in themselves. Instead, they focused on highly specialised, time‐limited interventions drawing on psychological therapies, which inevitably have higher costs and may not be typical of service provision in HICs or LMICs, although they are arguably more readily available for street‐connected populations in the former group. Other interventions available in both HICs and LMICs include longer‐term residential settings for street‐connected children and youth. Such services were not represented in the included studies.
The highly specialised therapeutic interventions examined in the included studies are not typical of interventions offered in HICs or in LMICs to support street‐connected children and young people while promoting reintegration‐type outcomes. SAU comparison interventions are more similar to services offered across the world. The overall finding that in many cases SAU participants improved from baseline on the measures used supports the use of these interventions, although a 'measurement effect' whereby repeated assessments conducted during the studies may in themselves trigger greater awareness and contribute to the outcomes obtained cannot be ruled out (Godin 2008; Morwitz 2004).
Population characteristics
Key issues in consideration of the generalisability of this review ‐ which includes studies conducted in HICs ‐ to populations of street‐connected children and young people in LMICs focus on a number of issues. These issues are identified as crucial in the introductory and background sections of this review, in particular, issues of risk faced by street‐connected children and young people, the role of resilience and reasons why young people are street‐connected.
All included studies, except for Peterson 2006, Milburn 2012 and Rew 2007 , recruited participants exclusively through drop‐in centres or shelters. Although drop‐in youth may be considered more at risk than shelter‐based youth (Slesnick 2007/08), comparison of baseline characteristics among participants in the Baer 2007 and Peterson 2006 studies showed significant differences between a sample of drop‐in recruits and a sample recruited from mixed locations, including those from the street (with the latter more likely to exhibit high‐risk behaviours such as heroin use). Only a small minority in the included studies were recruited directly from the street, especially among studies included in the meta‐analysis, of which only Milburn 2012 and Peterson 2006 recruited a portion of the research population directly from the street (42% in Peterson 2006; proportion not reported in Milburn 2012). These two studies differed in an important respect. In Peterson 2006, 'parental contact' was the most commonly used exclusion criterion (applied to 60% of youth screened for participation). As the Milburn 2012 study employed a family intervention, not being away from home for longer than six months and having the potential to return home were used as inclusion criteria. Other studies excluded young people with or without significant substance abuse problems. In summary, although the interventions served varied subpopulations of street‐connected children and youth, only around 120 participants from one study (Peterson 2006) could be said to have represented a population that may not have had contact with their families or with an agency. Therefore, results may not be broadly generalisable to children and youth who live on the streets and do not access services ‐ whether in HIC or LMIC contexts.
Reasons for being on the street within the included studies
Of the 13 studies included in this review, only one study (Cauce 1994) explicitly asked participants to state their reasons for leaving home. Five additional studies reported histories or experiences of physical and sexual abuse and family conflict or violence before leaving home (Hyun 2005; Rew 2007; Slesnick 2005; Slesnick 2007/08; Slesnick 2009 EBFT; Slesnick 2009 FFT). Four studies (Baer 2007; Peterson 2006; Rotheram‐Borus 2003; Slesnick 2007/08) did not report on historical factors such as physical or sexual abuse or family conflict. One study (Milburn 2012) specifically excluded participants who reported abuse, neglect at home or mental health problems. It may be that because reasons for leaving home are widespread throughout the broader literature base on youth who are homeless in HICs, studies that are focused on treatment programmes for youth who are already street‐connected, such as the 11 studies in this review, do not discuss this information in terms of relevance of their evaluations. Nevertheless, this must be acknowledged as a limitation of the review with regard to enabling identification of specific therapies linked to specific psychosocial histories of the population in question (Rew 2007; Slesnick 2005).
Given the lack of specific and consistent reporting of factors contributing to young people leaving home within the included studies, it is difficult to generalise about which risk factors cause or trigger exit from home. A limitation of these studies was the absence, apart from one study (Cauce 1994), of explicit questions regarding reasons for leaving home. Nevertheless, among the group of participants whose family histories were reported in this study, order, physical abuse, family violence or conflict and sexual abuse were reported in the lives of participants, in particular. This does correspond with the wider literature on homeless children and adolescents, which reports higher rates of family conflict or violence and physical and sexual abuse among homeless and runaway youth than among non‐runaway and homeless populations (Hyun 2005; Rew 2007; Slesnick 2009 EBFT; Slesnick 2009 FFT ). Higher rates of substance or alcohol use and high‐risk behaviours are also found within this population in comparison with the domiciled youth population, as is acknowledged within all 11 included studies. It is this aspect of homeless youth experience that is predominantly the focus of evaluation studies. It has been acknowledged that the adverse impact of street life for young people is important for achieving good outcomes in this population, and research must focus on these family contexts and earlier prevention strategies that aim to re‐engage young people with their families, as identified by Milburn 2012 and Slesnick 2005: "Because research suggests that family disturbance is highly correlated to the act of running away (Finkelhor 1990 ; Kufeldt 1992), family therapy is identified as the most important first treatment to evaluate with this population" (p 3).
All included studies aimed to impact high‐risk behaviour and lifestyles of street‐connected children and young people. Among those that report reasons for street‐connectedness, family breakdown and abuse histories feature highly in the backgrounds of included children and young people. Therefore, populations in the included studies may be seen as comparable with the many street‐connected children and young people in high‐ and middle‐income countries (HMICs) in which family fragility and breakdown and abuse history are among the reasons for young people leaving home. Evidence from some LMIC street children projects shows that child runaways are high among their priorities. As such, comparability of this subset of LMIC street‐connected children and young people with much of the population included in this review is clear, as is discussed in greater detail below.
Reasons for being on the street in low‐income countries (LICs)
With regard to comparability of HICs and LICs, we drew a sample of seven studies from a selection of excluded qualitative studies on street children in LICs. Selection criteria were that studies specifically stated within the abstract reasons for children leaving home, studies were published in peer‐reviewed journals and geographical locations included Africa, Asia and South America.Â
Although poverty is, arguably, a major trigger for children to come out onto the streets to work in LICs (Abebe 2008), it has been suggested that poverty is not the primary reason for children being ‘pushed’ onto the street (Conticini 2007). As with children and young people in HICs, these studies state that young people leave home because of family conflict, parental abuse and family disintegration (Henley 2010; Plummer 2007; Praharaj 2008; Raffaelli 2000; Tyler 1986). However, investigators have reported a significant difference between populations of street‐connected youth in HICs and those in LICs. Although contested, some literature on homeless children and young people in LICs has distinguished between ‘working street children’ and ‘street children’ (Plummer 2007). ‘Working street children’ are children who have been pushed onto the street as a result of economic hardship but who return home at night after spending their days working on the streets; ‘street children’ are children and young people who both work and live on the streets (Abebe 2008; Plummer 2007). The Plummer 2007 study, which drew on a sample of 1217 working children and 432 street children in the Sudan, found that the reasons for being on the streets were different between working children and street children. Working boys and girls reported poverty and financial hardship as their primary reasons for working; in contrast, this initial qualitative research has found that family dysfunction was very widely reported by street children, and that substance use (glue sniffing) was more highly correlated with street boys and girls than with working boys and girls, with street boys and girls generally reporting more experience with war, familial abuse and parental death or homelessness.
Similarly, Henley 2010 , which drew on a sample population of 1098 children and youth visible on the streets in northern Tanzania, noted a clear trend between ‘part‐time’ and ‘full‐time’ street children, with full‐time street children having higher abuse scores than part‐time street children. The Abebe 2008 study of 60 working street children in Addis Ababa found that approximately 80% returned home at night. This suggests that although poverty is a significant trigger for children’s migration to the street in LICs, it is also likely that these children are working but returning home. On the other hand, children who leave as a result of abuse or family disintegration tend to live on the street and do not return home. However, other researchers have considered such categorisations overly rigid in the light of complex and shifting circumstances characteristic of the lives of street‐connected children and young people (Ennew 2003; Glauser 1997).  Â
Conticini 2007 reports their main finding that the breakdown of social relationships within the household, not economic poverty, is the primary cause of child migration to the street (p 207), and this is supported by the other studies in LICs cited here. Thus the similarities between HICs and LICs appear strong in relation to family dysfunction as a causal factor for children and young people leaving home. Studies in HICs do not postulate that poverty is a prominent factor in youth homelessness, and the scope for research into specific links between economic hardship within families and the economic activities of homeless youth is clear. However, the common ground that is emerging for HICs and LICs does appear to lie within the sphere of family fragility and dysfunction as a trigger into homelessness and street life.
For street‐connected children and young people from LMICs whose reasons for being on the street include earning a living or contributing to family income, the intervention approach may need to be different, allowing for both ongoing economic support and skills training and education such as that offered by some NGOs, for example, conditional cash transfer schemes, as well as other support. Income deprivation may not be the usual focus for interventions in HICs but clearly has relevance in the context of insecure labour markets, growing (youth) unemployment and reduced welfare funding, which affect children and youth in HICs worldwide (see, for example, Karabanow 2010). Similarly, for children and young people who are on the streets for reasons of war, urbanisation or migration, particularly but not exclusively in LMIC contexts (see, for example, Altanis 2003), the optimal intervention approach would address outcomes related to these experiences, in addition to harm reduction and reintegration and educational input (Figure 2 ).
Risks faced by street‐connected children and young people in HICs and LMICs
The literature on street children differs between developing worlds and developed worlds. HICs have conducted more systematic and scientific studies, reviews of interventions and support services for developed world street children, often referred to as ‘homeless children’. Conversely, many more ethnographic research studies have been conducted to examine developing world ‘street children’ in HICs and LMICs (McAdam‐Crisp 2005; Panter‐Brick 2002). Given that the nature of these studies is different, and that researchers are often looking for or at different things, it is interesting to note that risks faced by street‐connected children and young people on the street are similar, that is, they are at greater risk of increased substance abuse (Towe 2009; Wanzela 2010), sexual exploitation, risky sexual behaviour and sexually transmitted infections (STIs) (Gaetz 2004 ; Kacker 2007; Kombarakaran 2004), mental health issues (Thabet 2010; Whitbeck 2004) and violence (United Nations 2006). It should be noted here that according to the data collected, study populations in the included studies generally represent street‐connected children and youth with low to moderate risk profiles.
However, something must be said about specific risks resulting from socio‐geographical and political situations and contexts. In nations in which trafficking of children is evident, street‐connected children and young people may be at higher risk of being trafficked (see Adepoju 2005), although previous assumptions about the high prevalence of trafficking risk have been contested by some researchers (Thomas de Benitez 2011b). In places where use of child soldiers is not uncommon, street children may be at risk of being recruited into warfare (Singer 2010). Although the latter two examples are prevalent in the developing world, street children in the developed world are often homeless young people who ‘sleep rough’ in cars or with friends and often do so without their families. This differs from many developing world spaces where children are on the streets with their families, working and living together. In some developing world countries, this is changing, potentially putting children at greater risk of greater exploitation than they would have when with their families (Adepoju 2005).
It is important to note that processes such as rapid urbanisation, slum clearance and rural‐urban migration ‐ more prevalent in LMICs than in HICs, particularly against backdrops of rapid economic growth and social change ‐ can lead to situations in which children and young people find themselves in street‐connected circumstances (e.g. Xue 2009 , Young 2004). It is beyond the scope of this review to consider mechanisms for prevention of 'street children creation' that arise from rapid urbanisation and population movements, although this topic could be the focus of meaningful future research.
Ethnicity and ethnic minorities
All of the included studies were conducted in HICs, and only one was conducted outside the USA (South Korea). Twelve of the 13 included studies were conducted in the USA ‐ at two US locations in particular: Albuquerque, New Mexico (Slesnick 2005; Slesnick 2007/08; Slesnick 2009 EBFT; Slesnick 2009 FFT) and Seattle, Washington (Baer 2007 (location inferred but not explicitly stated); Cauce 1994; Peterson 2006), were over‐represented in the sample. Studies from the USA represent a variety of ethnic populations, largely white and Hispanic. Although data on ethnic background of participants were commonly provided, they usually provided no information on how representative the study populations were of the general population of the study locality (e.g. the city or neighbourhood from which the research population was drawn) and on which ethnic groups could be considered ethnic minorities in their local, as opposed to national, context. Participants in the Korean study reportedly represented a religious (Christian) minority.
Peterson 2006 mentioned that participants who were not fluent in English were excluded from the study. No other study presented this criterion, but investigators also have not indicated that they used translators or multi‐lingual recruitment methods. Without relevant contextual information, it is difficult to judge how significant this fact may be. However, in some cities and areas from which participants were recruited (e.g. in three studies (Milburn 2012; Slesnick 2005; Slesnick 2009 EBFT; Slesnick 2009 FFT), the dominant ethnic identity among participants was Hispanic), fluency in English as an inclusion criterion could potentially exclude a significant proportion of participants otherwise eligible and representative of street‐connected children and youth in that particular area, including recent migrants. Language profiles and citizenship status may have important implications for outreach and service provision. For example, in HICs, service users' lack of legal status may restrict the ability or willingness of some NGOs to provide appropriate services for them.
The ethnic profile for the three family interventions (Milburn 2012; Slesnick 2005; Slesnick 2009 EBFT; Slesnick 2009 FFT) was distinct from that for other types of interventions, in that Hispanics represented the largest ethnic minority for each. In the earlier Slesnick studies, the second largest ethnic group was Anglo‐American and was close in size to the Hispanic populations, whereas in Milburn 2012 the Hispanic population represented 62% and African Americans 21% of the total study population. One hypothesis as to why this might occur is the high premium placed on family connectedness within this community compared with the Anglo‐American population in general (see also Slesnick 2002). In later Slesnick studies (which compared different types of interventions), the largest ethnic group was African American.
Depending on the socio‐cultural contexts of interventions, particular interventions may be more or less acceptable. Similarly, family‐focused interventions might specifically be less popular in some cultural contexts for the inverse of these reasons. Depending on the levels of stigma associated with substance use and sexual behaviour in some cultural contexts, assessments would have to be performed to determine whether interventions that were focused on these behaviours in particular might be more or less acceptable and appropriate. For example, family conflict involving social exclusion or stigmatisation of individuals with minority sexual identities may be better tackled at the community level. This is not an HIC/LMIC distinction but rather one that must be made on a context‐by‐context basis.
Socio‐economic background
Most of the included studies did not report on socio‐economic or educational status, social capital or acculturation indicators among participants or the communities that they represented, despite research indicating the importance of such factors in predicting risk behaviours (e.g. Bantchevska 2008; Slesnick 2002). The only exceptions are Slesnick 2005 , Slesnick 2009 EBFT , Slesnick 2009 FFT, Slesnick 2013/Guo 2014 CRA , Slesnick 2013/Guo 2014 EBFT and Slesnick 2013/Guo 2014 MET (total group data only), in which investigators reported on mean family income at baseline. Slesnick 2005 reported no significant differences between control and intervention groups. In the 2009 study, mean income for the control group was relatively low compared with that of both intervention groups. Educational level was included in a discriminant analysis in Slesnick 2007/08. The absence of collection and analysis of socio‐economic data in intervention evaluation research is prominent.
Gender and parenthood
Young men have been slightly over‐represented in research studies. This may reflect greater visibility of young men over young women in street situations, and may indicate greater likelihood of help‐seeking.
Apart from engagement in survival sex, none of the included studies, including those involving street‐based (as opposed to shelter‐based) populations, appeared to measure potential harms predominantly although not exclusively (see, for example, Muhrisun 2004) affecting young women, such as unwanted pregnancies, abortions, miscarriages, intimate partner violence, sexual harassment and rape. Similar harms may predominantly affect young men, such as physical assault, incarceration and involvement in gang‐related violence, and this may confound intervention effects. Such outcomes have not been explored in any study, possibly because the risk profile of included study populations may be relatively low.
Forming of intimate relationships was also not examined in the included studies. Some qualitative data suggest that forming intimate relationships and starting a family may have a stabilising influence on some street‐connected youth (e.g. Karabanow 2008). Other studies (e.g. Whitbeck 2009) highlight the often mixed effects of relationships among street‐living homeless youth, who often come from a background of dysfunctional family relations, including backgrounds of sexual and physical abuse. Even when intimate relationships meet their protection needs, such relationships may have complex implications for young women in particular. For example, relationships may further prevent young women from pursuing different pathways of integration through educational and vocational opportunities.
Having children or being pregnant was not examined in any of the included studies, although a paper by Slesnick 2006b appears to report on parenthood among a subsample of the Slesnick 2005 study. Within their sample of 201 adolescents, 24% (23 young men and 25 young women) had children or were expecting. Longitudinal data on homeless adolescents in the United States show that 46.8% of young homeless women were or had been pregnant at the end of the first follow‐up period, and 77% at the end of three years (Whitbeck 2009). Most pregnancies reported at first follow‐up were not carried to term. In one study (Slesnick 2006b), homeless adolescent parents reported increased runaway episodes and engaged in more high‐risk sexual and drug behaviours than did non‐parents. Mothers engaged in more overall HIV risk behaviours than non‐parents and fathers, and fathers engaged in more intravenous drug use.
Sexual orientation
Five studies (Carmona 2014/Slesnick 2015 CM ; Carmona 2014/Slesnick 2015 CRA ; Carmona 2014/Slesnick 2015 HIV ; Carmona 2014/Slesnick 2015 MET ; Milburn 2012; Peterson 2006; Rew 2007; Slesnick 2007/08 ) reported on participants' sexual orientation. Data from these studies were not used in analyses.
Disability
No studies reported on any type of disability among participant populations.
Quality of the evidence
Study designs
Most of the included studies were randomised controlled trials (RCTs); thus their study methods can be considered relatively robust. Another strength of the included studies was seen in the relatively high retention rates for this population across studies. However, we highlight below several limitations of these studies. For further assessment of limitations, we refer to the summary of findings Table for the main comparison , which presents a quality assessment that draws on the GRADE (Grades of Recommendation, Assessment, Development and Evaluation) framework. The large number of relevant secondary outcomes reported by the included studies meant that we could not report on all of them in the 'Summary of findings' table without making that table very lengthy and unwieldy. Therefore, we have included as much summary as was possible, along with an overall summary section in the table that conveys the flavour of the evidence as a whole.
One considerable limitation of these studies was the absence of comparison groups that did not have regular access to services; nine of 13 studies recruited participants for both intervention and control groups exclusively from drop‐in centres or shelters, and the remaining three studies (Milburn 2012; Peterson 2006; Rew 2007) included participants from mixed settings. Thus, no study in this review compared an intervention versus 'nothing' or 'no service', which is the condition lived by most street‐connected children and young people around the world. Given the limited scope of such SAU services in most countries, including the USA (e.g. at the time of the Rotheram‐Borus 2003 study, only four shelters were identified in the New York area), the study populations are not necessarily widely representative of street‐connected children and youth even in HICs. Many commentators believe that it would be unethical to offer no service to vulnerable populations. This ethical stance may account for the absence of no treatment control groups.
Most studies provided limited information for assessment of control conditions. Thus, significant variance in the quality and quantity of services offered by different types of agencies in SAU conditions was suggested, the data provided were not sufficient for robust comparisons across interventions. For example, Milburn 2012, Peterson 2006 and Rew 2007, who recruited participants from mixed settings, including streets, did not specify the control condition.
In many cases, however, SAU appeared to be of relatively high quality. For instance, the drop‐in centre that served as the SAU condition in Cauce 1994 offered street‐involved youth "a drop‐in room, free meals, food and clothing banks, health services, a school program, and recreation programs" (p 22). Additionally, the centre offered drug and alcohol counselling and group sessions on self esteem, sexuality, parenting and job skills, as well as individual case management. Several of the SAU conditions provided counselling services. Given the fact that interventions were usually narrow in scope, participants in the intervention groups were likely to access SAU to meet other needs. However, few of the included studies reported that investigators systematically controlled for similarity between the two groups in terms of using 'control' services, apart from limited data in some studies (e.g. number of counselling sessions). Furthermore, it is impossible to know to what extent positive outcomes in the intervention group were contingent upon simultaneous receipt of SAU. At update, motivational enhancement therapy (MET) was assessed as sufficiently similar to SAU conditions in the original studies to be included as comparable, given that SAU is also an active intervention.
Furthermore, in so far as many interventions were time‐limited and specialised, as opposed to more permanent and comprehensive services, which may have been more familiar to the research population, it could be argued that control conditions may have offered distinct advantages vis‐à‐vis intervention conditions. However, service delivery‐related confounders (e.g. service satisfaction, level of engagement) usually were examined only in the context of the intervention condition. A further potentially confounding factor in some studies was the fact that, as in the case of several interventions, some agency‐based services were contained within their location, but others involved referrals or joined‐up working with external service providers, depending on individual needs. The impact of external services was not examined in any relevant studies.
Finally, as interventions commonly took place in the shelter or drop‐in centre from which participants were recruited, a high likelihood of contamination between intervention and control groups was noted in most studies. Several study authors drew attention to this fact. Participants in intervention and control groups were likely to belong to the same peer network and therefore could affect each other's behaviours in either direction. In summary, it is very difficult to isolate intervention effects from effects of SAU, especially in studies in which the two conditions operated under the same roof. (Contamination similarly has been recognised as a problematic issue when street‐based participants share living quarters; Rew 2007 .)
Notably, studies added at update stage (Carmona 2014/Slesnick 2015 CM; Carmona 2014/Slesnick 2015 CRA; Carmona 2014/Slesnick 2015 HIV; Carmona 2014/Slesnick 2015 MET; Nyamathi 2012/13 AM; Nyamathi 2012/13 HPP; Slesnick 2013/Guo 2014 CRA; Slesnick 2013/Guo 2014 EBFT; Slesnick 2013/Guo 2014 MET) did not involve an SAU condition and thus were not directly comparable with previously included studies (see Sensitivity analysis).
Six studies had a follow‐up period exceeding six months (Carmona 2014/Slesnick 2015 CM ; Carmona 2014/Slesnick 2015 CRA ; Carmona 2014/Slesnick 2015 HIV ; Carmona 2014/Slesnick 2015 MET ; Milburn 2012; Rotheram‐Borus 2003, Slesnick 2005; Slesnick 2009 EBFT; Slesnick 2009 FFT; Slesnick 2013/Guo 2014 CRA; Slesnick 2013/Guo 2014 EBFT; Slesnick 2013/Guo 2014 MET), and five had a follow‐up period of three months or longer (Baer 2007; Cauce 1994; Hyun 2005; Peterson 2006; Rew 2007). The longest follow‐up was 24 months (Rotheram‐Borus 2003; Slesnick 2013/Guo 2014 CRA; Slesnick 2013/Guo 2014 EBFT; Slesnick 2013/Guo 2014 MET). The longest follow‐up with raw data from more than one study and one outcome was six months, which further limits the robustness of predictions on the basis of included data.
It is important to note that the evidence base does not yet include robust studies from LMICs. LMIC studies assessed for inclusion at update could not be included for the reasons noted above.
Outcome measures
Although outcome categories were considerably homogeneous across studies, as noted above, consistency was lacking between types of interventions and types of outcomes measured. When combined with the heterogeneity of outcome measures discussed above, this further limited the quantity of data available for meaningful comparison. For example, among studies involving a social cognitive or behavioural intervention, two (Rew 2007; Rotheram‐Borus 2003) measured exclusively cognitive‐behavioural outcomes, one (Hyun 2005) exclusively psychological outcomes and three (Baer 2007; Milburn 2012; Peterson 2006 ) exclusively behavioural outcomes. Studies by Slesnick measured both psychological and social functioning outcomes irrespective of the type of intervention provided (i.e. family therapy, community reinforcement approach and HIV prevention) and also measured family functioning or cognitive‐behavioural outcomes depending on the intervention. Cauce 1994 , who evaluated a multi‐component intervention, measured psychological and social adjustment outcomes. Further, outcomes within these broader categories varied. For example, family interventions focused on different behavioural outcomes (Milburn 2012 on substance use, delinquent behaviour and sexual risk behaviour; Slesnick 2005; Slesnick 2009 EBFT; Slesnick 2009 FFT on substance use, delinquent behaviour and family functioning). Thus, consistency is lacking in the choice of outcomes across studies.
Irrespective of theoretical orientation, appropriate relevant measurable effects of an intervention are not obvious. In addition, the line between outcomes and process factors is blurred. For example, although several interventions included a motivational element, defined as encouraging ‘readiness to change’ (Peterson 2006), they did not treat motivation to change as an outcome. For example, Peterson 2006 measured ‘stage of change’ only at baseline. Other relevant factors identified in the research literature include, among many others, goal setting and decision making (Lightfoot 2011). These appear to be target elements of interventions included in the review but were not treated as outcomes. Some interventions, such as the community reinforcement approach (CRA) employed in Slesnick 2007/08, define concrete behavioural targets, such as an increase in positive (as opposed to risk‐inducing) social activities and peer relationships, which were not translated into outcomes apart from the aggregate measure of 'social stability'. Few studies measured factors specific to street‐connected populations and highlighted by both ethnographic (e.g. Karabanow 2008) and quantitative or mixed methods studies (e.g. Whitbeck 2009) as crucial for exit from street life.
We can infer that many of these potential ‘process factors’ were nevertheless relevant to most interventions, as well as to SAU. Although they may be considered moderating or mediating factors in relation to concrete outcomes such as reduced substance use, they do not appear to differ in a fundamental sense from constructs such as self esteem. Furthermore, to evaluate intervention effectiveness, it might be considered important to measure whether the intervention appeared valid as a method used with a particular research population (e.g. whether a motivational intervention in fact increased motivation). One of the challenges of evaluating the effectiveness of psycho‐social interventions derives from the fact that they typically consist of multiple treatment components, which are difficult to quantify. Meta‐analyses of common psychological therapies have shown that common process factors, especially therapeutic relationship variables, may account for 30% of the variance in treatment outcomes for adults, above and beyond the 15% of variance accounted for by therapeutic techniques (Lambert and Barley 2002, cited in Karver 2006). None of the included studies controlled for treatment variables such as quality of the therapeutic relationship or group cohesion.
Viewing outcomes in a narrow context or in isolation from each other, without locating them in the real, everyday experiences of study participants, may lead to misleading conclusions. For example, Ferguson 2008 found an increased number of sexual partners among youth taking part in a social enterprise intervention, in marked contrast to a (non‐randomised) control group from the same drop‐in centre that significantly reduced numbers of sexual partners over the same period. Some of their qualitative data suggest that this fact could be explained by increased self confidence among intervention participants, which by itself may be considered a desired outcome. Similarly, a cross‐sectional study by Booth 1999 could not confirm an expected relationship between increased knowledge about HIV/AIDS or perceived likelihood of infection and sexual risk behaviours; on the contrary, youth with higher levels of knowledge engaged in more risk behaviours, possibly reflecting "a realistic appraisal of their increased risk" (p 1302). Of the included studies, those by Slesnick (Slesnick 2007/08; Slesnick 2009 EBFT; Slesnick 2009 FFT) enable the most comprehensive comparisons across a relatively broad range of outcome categories. However, contradictory outcome findings were explored to a limited extent.
In summary, although these studies covered important outcomes, predefined outcomes often directly transposed from research with very different study populations, usually with limited relevance to a particular intervention, may not adequately reflect the full range of risks that street‐connected children and youth are likely to encounter. Conversely, important intervention benefits may go undocumented. More work is required to develop appropriate research tools for this area of research, ideally drawing on both bottom‐up participatory methods (as exemplified, for example, in Ferguson 2008b) and broader theories of change.
As depicted above, despite overall homogeneity of measured outcomes, the measurement tools and, consequently, the outcome components reported in these studies were highly heterogeneous. Most of the measures used were validated, and data on their reliability were made available in study publications. However, measures were not commonly validated in the context of studying homeless or street‐connected young people. The measurement tools employed were typically self report for practical and ethical reasons. Potential biases inherent in self report measures are well known and were highlighted by several study authors. For example, under‐reporting and over‐reporting may occur as the result of social desirability or trust issues. This fact is compounded by potential problems of recall. For instance, it could have been challenging for some youth to calculate and report the numbers of times they 'used alcohol' or 'had sex' in the past three months (Milburn 2012 [pers comm]) in part because their chaotic lives are marked by high rates of substance abuse, which may impact negatively on accurate recall (e.g. Rew 2007).
The quality of reporting of outcomes for review purposes was varied. Mean and standard deviation data for some outcomes were included for most study publications. However, some publications included only raw data for outcomes favouring the intervention (other outcomes were reported narratively). Unpublished data were available on request in all instances. In some instances, different studies using the same measures reported different outcome items; this raises the possibility of selective reporting (it should be noted that the number of outcome items measured was very large in some studies). Four publications presented data in graph or composite form (Milburn 2012; Rotheram‐Borus 2003; Slesnick 2005; Slesnick 2013/Guo 2014 CRA; Slesnick 2013/Guo 2014 EBFT; Slesnick 2013/Guo 2014 MET), and we were able to obtain relevant raw data for three of these (Milburn 2012; Slesnick 2005;Slesnick 2013/Guo 2014 CRA; Slesnick 2013/Guo 2014 EBFT; Slesnick 2013/Guo 2014 MET). No other unpublished data from past or ongoing studies were made available to us.
Statistical analyses
It has been argued that analysis of data from complex social interventions calls for sufficiently sophisticated statistical methods to produce meaningful evidence of "how programs affect individuals, who is most affected, and under what circumstances" (Lipsey 2000, p 362). Although statistical methods used to capture this level of complexity have been evolving in recent decades, research practice is lagging behind methodological advances (see Lipsey 2000). Included studies were considerably varied in their choice of statistical methods. Below we highlight some examples.
Population heterogeneity may significantly contribute to variance in outcomes, and street‐connected children and youth typically represent a diverse population with multiple needs and relatively high levels of co‐morbidity (Slesnick 2006). Most included studies provided some analysis of baseline differences. One way of accounting for variance in the study population is to use propensity scores, as exemplified in Rotheram‐Borus 2003 (non‐randomised study sample). These authors calculated propensity scores for each participant on the basis of 45 baseline characteristics, which were used to classify participants into five subgroups. As significant differences between control and intervention groups emerged in terms of risk profile, those with the fewest and those with the greatest number of sexual and substance use risk acts were excluded from the analyses. The remaining three groups were pooled for data analysis purposes.
Grouping individual participants according to their change profile (e.g. positive, negative, no change) and performing analyses on predictors of a particular direction of change, as exemplified in Slesnick 2007/08 , Slesnick 2013/Guo 2014 CRA , Slesnick 2013/Guo 2014 EBFT and Slesnick 2013/Guo 2014 MET described below, would seem to be a particularly useful form of analysis. The value of such analyses is evident, particularly in the context of psychosocial interventions with heterogeneous, non‐clinical populations (Lipsey 2000), and can usefully complement interpretations based on group level mean scores and standard deviations.
Among the included studies, Slesnick 2005 , Slesnick 2009 EBFT and Slesnick 2009 FFT stand out positively in terms of their comparative research design (replicating the same intervention with two different populations, comparing two different interventions) as well as their comprehensive and longitudinal outcome evaluations, combined with statistical analyses of potentially moderating factors (including both demographic variables and process factors such as treatment attendance). However, these studies did not report on qualitative process evaluation, and analyses as well as outcome measures used or reported were not entirely consistent across studies. For example, different portions of the data (sometimes combining data from two studies) are subject to highly varied types of analyses, which are reported across several publications (e.g. Slesnick 2006; Slesnick 2006c) and are not always cross‐referenced. Moreover, discrepancies between individual and composite analyses are not discussed. Professor Slesnick has directed several large projects measuring varied outcomes, reportedly including process factors not included in analyses published so far (Slesnick 2012), and future research publications might address current gaps in the data. However, we were not able to confirm whether any of the studies were ongoing.
Interpretation of results
Analyses usually were based on mean scores and standard deviations of participant scores on a particular scale. Most studies reported findings in terms of statistical significance or non‐significance. Despite utilising several clinical scales, investigators provided little discussion around the clinical significance of particular scores, with the exception of Slesnick 2013/Guo 2014 CRA , Slesnick 2013/Guo 2014 EBFT and Slesnick 2013/Guo 2014 MET. Furthermore, no attempts were made to evaluate outcomes within real‐life contexts or subjective perspectives of study participants in any of the included studies. For some measurement tools (e.g. delinquency scales), little information was available, making interpretation of results difficult. Outcome scores were also not compared with those of not street‐connected populations, although some studies (e.g. Milburn 2012) did offer such comparisons for baseline scores. Finally, as recognised by several authors, ambiguity of findings within this study population highlights the need for more extensive qualitative and quantitative process evaluations to help explain and interpret results. Evaluations need to go beyond mere assessment of service‐user satisfaction.
Potential biases in the review process
The three studies included at update stage in 2015 (Carmona 2014/Slesnick 2015 CM; Carmona 2014/Slesnick 2015 CRA; Carmona 2014/Slesnick 2015 HIV; Carmona 2014/Slesnick 2015 MET; Nyamathi 2012/13 AM; Nyamathi 2012/13 HPP; Slesnick 2013/Guo 2014 CRA; Slesnick 2013/Guo 2014 EBFT; Slesnick 2013/Guo 2014 MET) did not include SAU conditions, and none of the included studies included no treatment control groups. For the purposes of this review, at update, in each of these studies, the intervention deemed by review authors closest to SAU conditions in the original studies was selected as the comparator. It was agreed with the Cochrane Editorial Unit that it is reasonable to consider these studies comparable, given that SAU is also an intervention, but that the possible source of bias should be highlighted, In consideration of this, sensitivity analyses were performed with all new studies to assess the impact of the absence of SAU and the comparison between several interventions on study results. Results of the sensitivity analysis at update seemed to show benefit for the control group when new studies were included, along with a smaller overall effect. One possible reason for this may have been that the 'control' groups in these studies were split between different intervention groups, potentially explaining the reduced weight attributed to these studies in the meta‐analysis.
Agreements and disagreements with other studies or reviews
Our literature search identified two relevant reviews with inclusion criteria sufficiently similar to those of the current review (Altena 2010; Slesnick 2009). However, these reviews also included non‐randomised studies and studies without a control group. Nine of the 13 studies included in the current review were included in Slesnick 2009 (Baer 2007; Cauce 1994; Hyun 2005; Peterson 2006; Rew 2007; Rotheram‐Borus 2003; Slesnick 2005; Slesnick 2007/08; Slesnick 2009 EBFT; Slesnick 2009 FFT), and five in Altena 2010 (Baer 2007; Cauce 1994; Hyun 2005; Peterson 2006; Slesnick 2007/08). Studies included in the current review but not in either of the other two reviews were and Milburn 2012. Similar to Altena 2010, we did not identify relevant studies from LMICs. The broad conclusions of the current review are consistent with those presented in Altena 2010 and Slesnick 2009.
We also agree with the overall conclusions provided in Naranbhai 2011, which included three studies overlapping with this review (Rotheram‐Borus 2003; Slesnick 2005; Slesnick 2007/08). Ross 2006 identified only two studies with street‐connected children and youth in LMICs. These studies, similar to the Ross 2006 review, had a primarily HIV/AIDS prevention focus and therefore were not considered for inclusion in this review. With regard to substance use outcomes, we concur with the conclusions presented in Xiang 2013.

Intervention and context logic model.
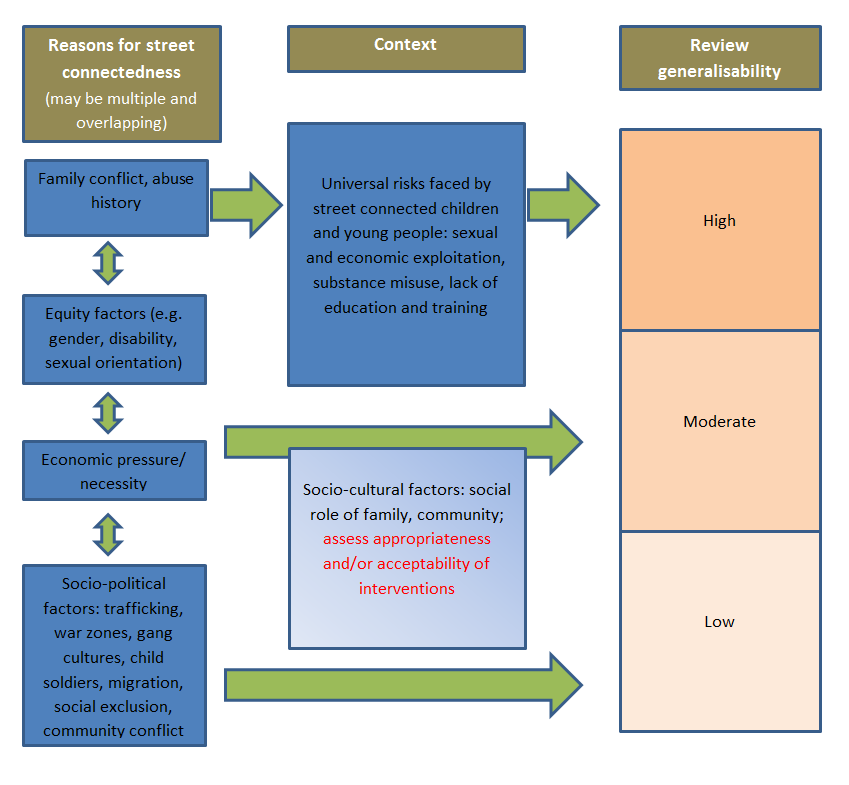
Generalisability logic model.

Study flow diagram.
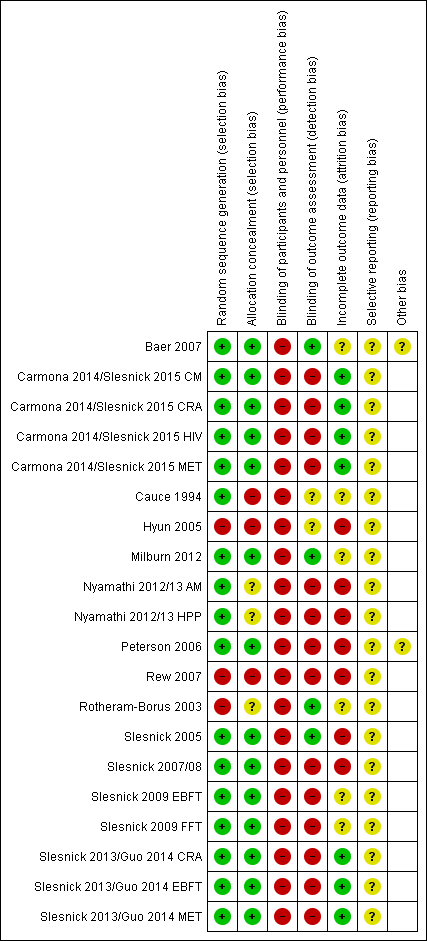
Risk of bias summary: review authors' judgements about each risk of bias item for each included study.

Risk of bias graph: review authors' judgements about each risk of bias item presented as percentages across all included studies.

Comparison 1 Safer or reduced sexual activity, Outcome 1 Number of times had sex ‐ 3 months.

Comparison 1 Safer or reduced sexual activity, Outcome 2 Number of times had sex ‐ 6 months.
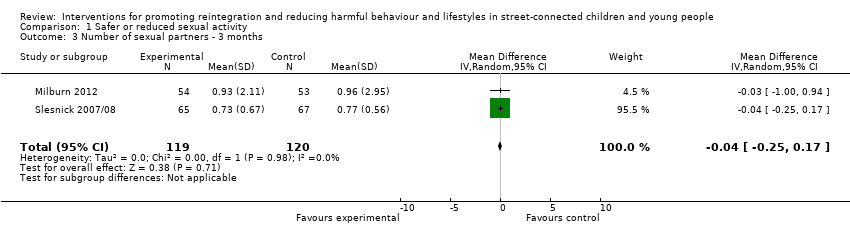
Comparison 1 Safer or reduced sexual activity, Outcome 3 Number of sexual partners ‐ 3 months.

Comparison 1 Safer or reduced sexual activity, Outcome 4 Number of sexual partners ‐ 6 months.
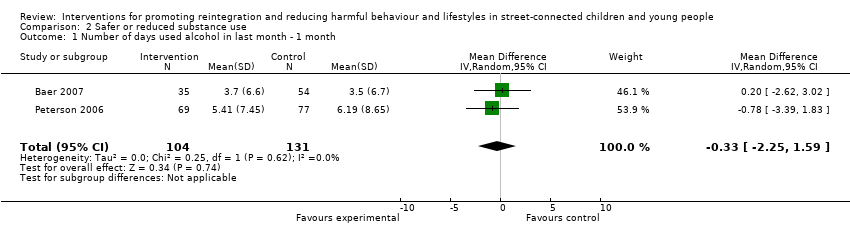
Comparison 2 Safer or reduced substance use, Outcome 1 Number of days used alcohol in last month ‐ 1 month.
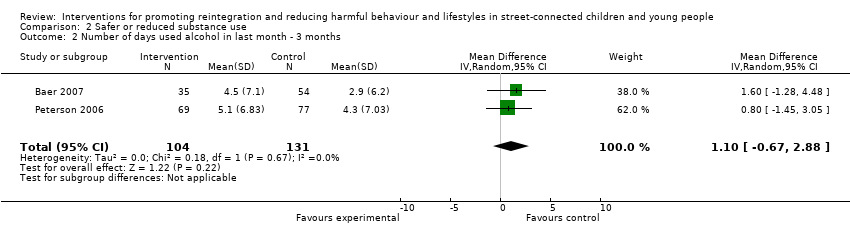
Comparison 2 Safer or reduced substance use, Outcome 2 Number of days used alcohol in last month ‐ 3 months.
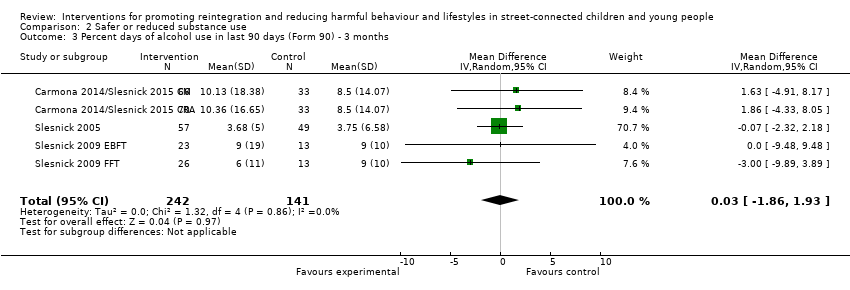
Comparison 2 Safer or reduced substance use, Outcome 3 Percent days of alcohol use in last 90 days (Form 90) ‐ 3 months.

Comparison 2 Safer or reduced substance use, Outcome 4 Percent days of alcohol use in last 90 days (Form 90) ‐ 6 months.
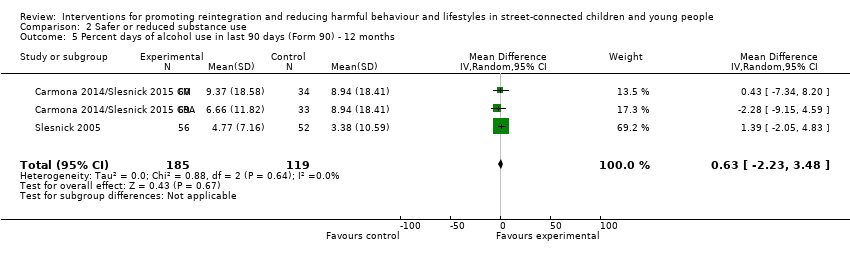
Comparison 2 Safer or reduced substance use, Outcome 5 Percent days of alcohol use in last 90 days (Form 90) ‐ 12 months.
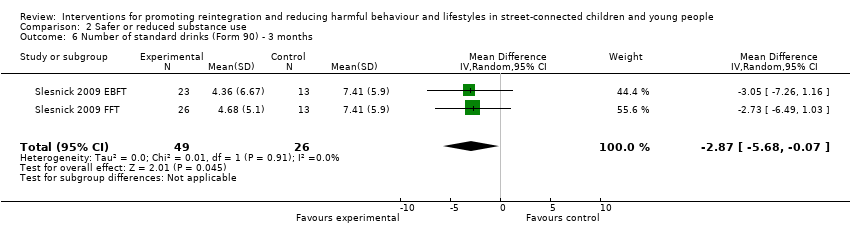
Comparison 2 Safer or reduced substance use, Outcome 6 Number of standard drinks (Form 90) ‐ 3 months.

Comparison 2 Safer or reduced substance use, Outcome 7 Adolescent Drinking Index ‐ 3 months.

Comparison 2 Safer or reduced substance use, Outcome 8 Percent days of alcohol/drug use (excl tobacco) (Form 90) ‐ 3 months.

Comparison 2 Safer or reduced substance use, Outcome 9 Percent days of alcohol/drug use (excl tobacco) (Form 90) ‐ 6 months.
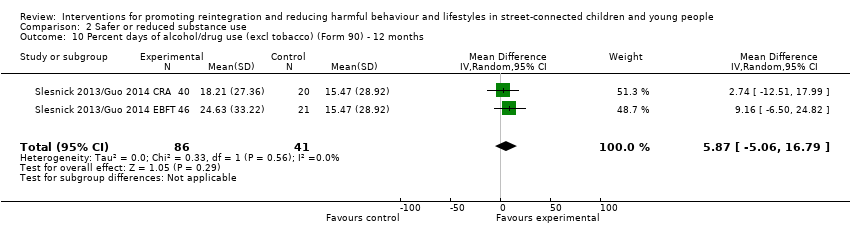
Comparison 2 Safer or reduced substance use, Outcome 10 Percent days of alcohol/drug use (excl tobacco) (Form 90) ‐ 12 months.

Comparison 2 Safer or reduced substance use, Outcome 11 Percent days only/any drug use (Form 90) ‐ 3 months.
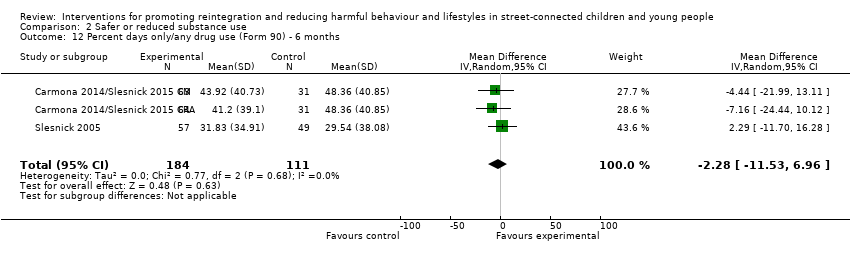
Comparison 2 Safer or reduced substance use, Outcome 12 Percent days only/any drug use (Form 90) ‐ 6 months.
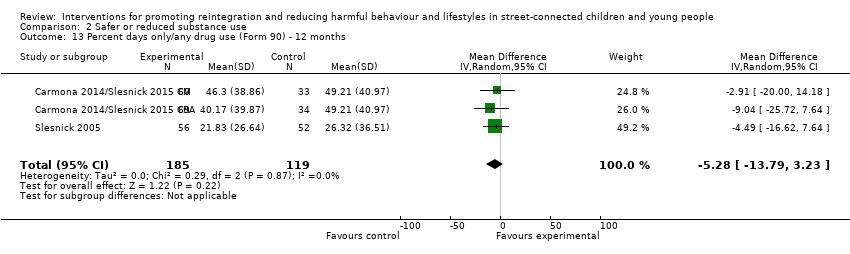
Comparison 2 Safer or reduced substance use, Outcome 13 Percent days only/any drug use (Form 90) ‐ 12 months.
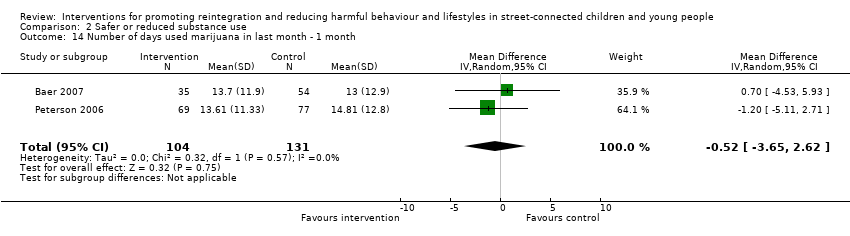
Comparison 2 Safer or reduced substance use, Outcome 14 Number of days used marijuana in last month ‐ 1 month.
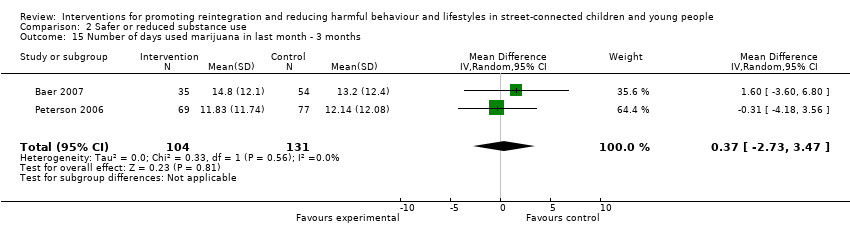
Comparison 2 Safer or reduced substance use, Outcome 15 Number of days used marijuana in last month ‐ 3 months.
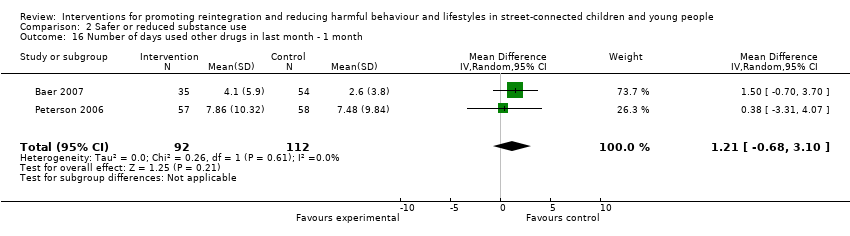
Comparison 2 Safer or reduced substance use, Outcome 16 Number of days used other drugs in last month ‐ 1 month.

Comparison 2 Safer or reduced substance use, Outcome 17 Number of days used other drugs in last month ‐ 3 months.

Comparison 2 Safer or reduced substance use, Outcome 18 Number of problem consequences ‐ 3 months.

Comparison 2 Safer or reduced substance use, Outcome 19 Number of problem consequences ‐ 6 months.

Comparison 2 Safer or reduced substance use, Outcome 20 Number of substance use diagnoses (CDISC) ‐ 3 months.

Comparison 2 Safer or reduced substance use, Outcome 21 Number of categories of drug use (Form 90) ‐ 6 months.

Comparison 3 Self esteem, Outcome 1 Self esteem at endpoint.

Comparison 4 Depression, Outcome 1 Depression at 3 months.

Comparison 4 Depression, Outcome 2 Depression at 6 months.

Comparison 4 Depression, Outcome 3 Depression at 12 months.

Comparison 5 Reduced use of violence, Outcome 1 Verbal aggression (Conflict Tactic Scale) ‐ 3 months.
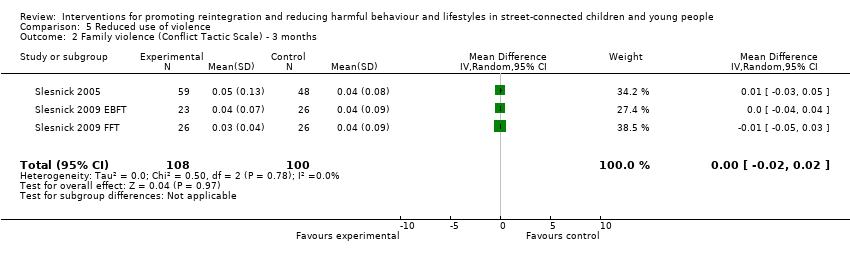
Comparison 5 Reduced use of violence, Outcome 2 Family violence (Conflict Tactic Scale) ‐ 3 months.
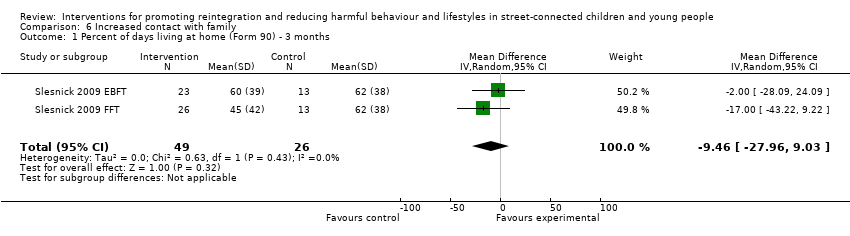
Comparison 6 Increased contact with family, Outcome 1 Percent of days living at home (Form 90) ‐ 3 months.

Comparison 7 Social functioning, Outcome 1 Delinquent behaviours at 3 months.
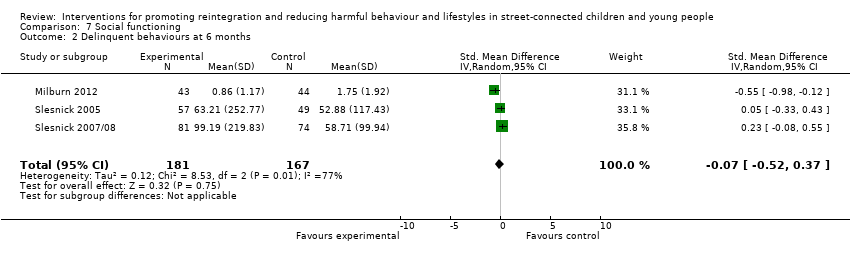
Comparison 7 Social functioning, Outcome 2 Delinquent behaviours at 6 months.
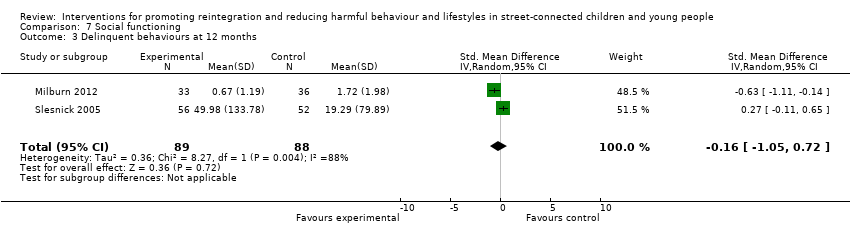
Comparison 7 Social functioning, Outcome 3 Delinquent behaviours at 12 months.

Comparison 8 Psychological functioning, Outcome 1 Internalising behaviours at 3 months.
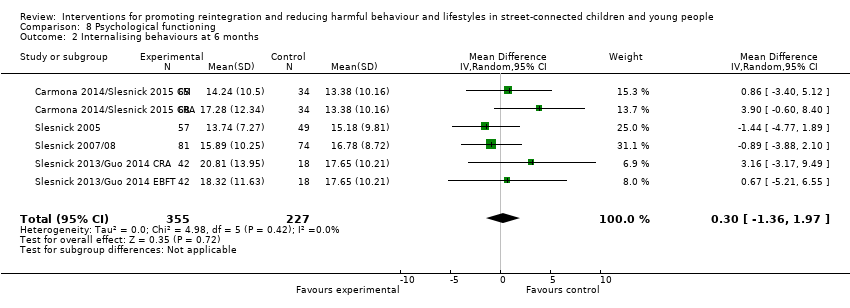
Comparison 8 Psychological functioning, Outcome 2 Internalising behaviours at 6 months.

Comparison 8 Psychological functioning, Outcome 3 Internalising behaviours at 12 months.
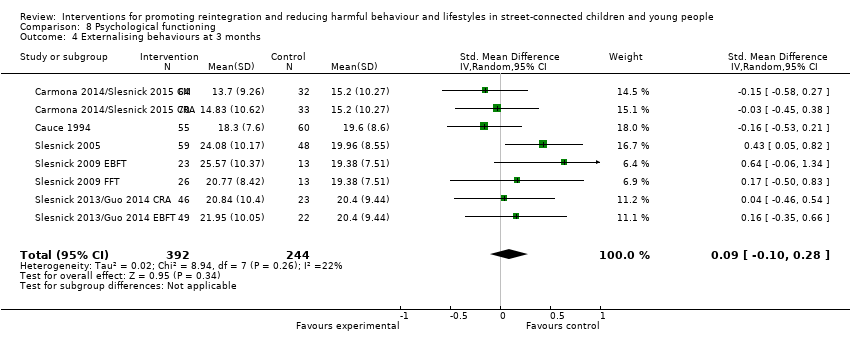
Comparison 8 Psychological functioning, Outcome 4 Externalising behaviours at 3 months.

Comparison 8 Psychological functioning, Outcome 5 Externalising behaviours at 6 months.

Comparison 8 Psychological functioning, Outcome 6 Externalising behaviours at 12 months.

Comparison 8 Psychological functioning, Outcome 7 Number of psychiatric diagnoses.
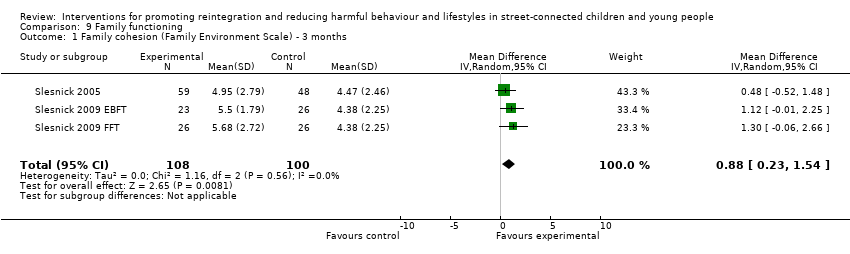
Comparison 9 Family functioning, Outcome 1 Family cohesion (Family Environment Scale) ‐ 3 months.

Comparison 9 Family functioning, Outcome 2 Family conflict (Family Environment Scale) ‐ 3 months.
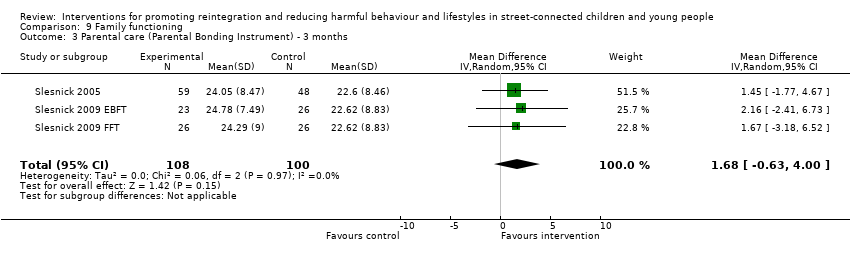
Comparison 9 Family functioning, Outcome 3 Parental care (Parental Bonding Instrument) ‐ 3 months.

Comparison 9 Family functioning, Outcome 4 Parental overprotection (Parental Bonding Instrument) ‐ 3 months.
| Therapeutic intervention compared with service as usual for street‐connected children and young people | |||
| Patient or population: street‐connected children and young people Settings: shelters and drop‐in centres Intervention: various specific therapeutic types of interventions Comparison: shelter/drop‐in service as usual | |||
| Outcome categories (summarised) | Impact | Number of | Quality of the evidence |
| Primary outcome ‐ reintegration
| Reintegration was not measured in any of the studies. Similarly, access to literacy, numeracy, education and employment were not measured in any of the studies that met the criteria for inclusion. However, social stability was measured in 1 study and delinquent behaviours in 4 studies. Social stability outcomes measured in 1 study showed benefit for the intervention group. Delinquent behaviour results were mixed across studies; investigators used different types and constructs of measurement, so findings cannot be summarised | 1 4 | Moderatea |
| Promotion of mental health, including self esteem | Outcomes included in this category included depression, internalising and externalising behaviours, self esteem and psychiatric diagnoses measured on various scales. None of these measures showed overall differences between intervention and control groups, and change score calculations demonstrated that for the most part, both groups improved from baseline. These results indicate that for mental health promotion outcomes, the therapeutic intervention did not obtain significantly better outcomes than the service as usual/control condition in the studies included in this review | 8 | Moderatea |
| Reduction in harms associated with substance misuse | Substance misuse was measured in a wide variety of ways and includes alcohol misuse and different categories of non‐prescription drugs, as well as a scale measuring 'problem consequences'. The overall picture emerging form the included studies on these outcomes is unclear, possibly because of the array of measurement types and tools that measure subtly different constructs and differing time windows that were impossible to combine statistically. Results are mixed across studies, with some showing marginal or no differences between groups, and others showing clear benefit for intervention or control. Improvements in some substance misuse measures were noted in all 3 family intervention studies | 8 | Moderatea |
| Reduction in harms associated with early sexual activity | Sexually risky behaviour was similarly measured in different ways, including numbers of partners, numbers of times had sex, HIV knowledge, unprotected sex, condom use and rates of abstinence. Again, the picture across studies is mixed. Some studies showed benefit in 1 or another group, but it is difficult to untangle whether this shows benefit of a particular intervention or control condition, or whether this reflects differences in measurement approach | 5 | Lowb |
| Family functioning | These outcomes were measured by two studies that utilised family‐based approaches to providing intervention. No differences were found between intervention and control conditions on most of the outcome measures used. These included various aspects of family life such as parenting style, aggression and violence, family conflict and percent days living at home | 2 | Lowc |
| Overall picture | Participants in studies remained for the most part at a similar level or improved on outcomes measured. Assessment of the grade of evidence is moderate overall, as whilst some domains of bias (e.g. allocation concealment) were assessed mostly as having low risk of bias, other domains such as blinding, were assessed consistently as high risk, whilst selective reporting was consistently assessed as unclear. No clear examples showed deteriorated outcomes. Findings may be more generalisable to young people in low‐ and middle‐income countries with circumstances more similar to those included in the studies (i.e. those who have left home because of abuse or family conflict | Total studies included = 13 | Moderatea |
| GRADE Working Group grades of evidence | |||
| Summarised outcome categories used in Summary of findings (SoF) table in the interest of space aOverall, the quality of the evidence was assessed as 'moderate' in the context of typical study quality in comparable areas (psychosocial interventions with at‐risk populations), and standard quality criteria were used in Cochrane reviews (in particular, the GRADE evaluation framework as utilised here). Quality of evidence for all available outcome categories was upgraded because they were based on robust study designs (RCTs); reasonably low drop‐out rates (for the study population involved); some analysis of major confounders including age and gender, and publication of data for a broad range of outcomes, including non‐significant outcomes, measured over reasonably long follow‐up periods, in most included studies. Quality of evidence was downgraded for the following reasons: heterogeneity of study outcomes, measures and types of statistical analysis used; inconsistency in measures, findings and analyses across outcomes and across studies with similar interventions; reliance on self report; use of convenience samples; over‐representation of studies from one study team; and questions over study generalisability. Further, few studies involved a control condition receiving no services, and some did not involve a service as usual condition, reducing comparability across studies. Finally, the relationship between intervention theories and outcomes measured remained unclear, and clinical and subjective significance of outcomes was explored in a small number of included studies. No participatory or process evaluations were available bAs above, but the quality of the evidence was further downgraded because of the relatively small number of heterogeneous studies cAs above, but the quality of the evidence was further downgraded because of the small number of studies available. The two included studies were conducted by the same study team. | |||
| Number* | Outcome name | Study | Measure | ≤1 month | 3 months | 6 months | 12 months |
| Number of times participant had sex in last 90 days | HRQ | x | x | ||||
| Own | x | x | |||||
| Number of sexual partners | HRQ | x | x | ||||
| Own | x | x | |||||
| Alcohol use (number of days in last 30 days) | TLFB | x | x | ||||
| TLFB | x | x | |||||
| Alcohol use (% days in last 90 days) | Form 90 | x | x | x | |||
| Form 90 | x | ||||||
| Form 90 | x | ||||||
| Form 90 | x | x | x | ||||
| Form 90 | x | x | x | ||||
| Form 90 | x | x | x | ||||
| Number of standard drinks (in last 90 days) | Form 90 | x | |||||
| Form 90 | x | ||||||
| Alcohol use (total score) | ADI | x | |||||
| ADI | x | ||||||
| Alcohol/drug use (% days in last 90 days) | Form 90 | x | |||||
| Form 90 | x | ||||||
| Form 90 | x | ||||||
| Form 90 | x | x | x | ||||
| Form 90 | x | x | x | ||||
| Form 90 | x | x | x | ||||
| Only/any drug use (% days in last 90 days) | Form 90 | x | x | x | |||
| Form 90 | x | ||||||
| Form 90 | x | ||||||
| Form 90 | x | x | x | ||||
| Form 90 | x | x | x | ||||
| Form 90 | x | x | x | ||||
| Marijuana use (number of days in last 30 days) | TLFB | x | x | ||||
| TLFB | x | x | |||||
| Drug use other than marijuana (number of days in last 30 days) | TLFB | x | x | ||||
| TLFB | x | x | |||||
| Number of problem consequences | POSIT | x | x | ||||
| POSIT | x | ||||||
| POSIT | x | ||||||
| POSIT | x | ||||||
| Number of substance use diagnoses | CDISC | x | |||||
| CDISC | x | ||||||
| Number of categories of drug use (last 90 days) | Form 90 | x | |||||
| Form 90 | x | ||||||
| Self esteem | RSES | x | |||||
| SEI | x | ||||||
| Depression | RADS | x | |||||
| BDI | x | ||||||
| BDI | x | x | x | ||||
| BDI | x | ||||||
| BDI | x | ||||||
| BDI | x | ||||||
| BDI | x | x | x | ||||
| BDI | x | x | x | ||||
| BDI | x | x | x | ||||
| BDI | x | x | x | ||||
| BDI | x | x | x | ||||
| BDI | x | x | x | ||||
| Verbal aggression (youth) | CTS | x | |||||
| CTS | x | ||||||
| CTS | x | ||||||
| Family violence (youth) | CTS | x | |||||
| CTS | x | ||||||
| CTS | x | ||||||
| Days living at home (% days in last 90 days) | Form 90 | x | |||||
| Form 90 | x | ||||||
| Delinquent behaviours | YSR | x | |||||
| DSM‐IV | x | x | x | ||||
| NYSDS | x | x | x | ||||
| NYSDS | x | ||||||
| NYSDS | x | ||||||
| NYSDS | x | ||||||
| Internalising problems | YSR | x | |||||
| YSR | x | x | x | ||||
| YSR | x | ||||||
| YSR | x | ||||||
| YSR | x | ||||||
| YSR | x | x | x | ||||
| YSR | x | x | x | ||||
| YSR | x | x | x | ||||
| YSR | x | x | x | ||||
| YSR | x | x | x | ||||
| YSR | x | x | x | ||||
| Externalising problems | YSR | x | |||||
| YSR | x | x | x | ||||
| YSR | x | ||||||
| YSR | x | ||||||
| YSR | x | ||||||
| YSR | x | x | x | ||||
| YSR | x | x | x | ||||
| YSR | x | x | x | ||||
| YSR | x | x | x | ||||
| YSR | x | x | x | ||||
| YSR | x | x | x | ||||
| Number of psychiatric diagnoses | CDISC | x | |||||
| CDISC | x | ||||||
| CDISC | x | ||||||
| Family cohesion | FES | x | |||||
| FES | x | ||||||
| FES | x | ||||||
| Family conflict | FES | x | |||||
| FES | x | ||||||
| FES | x | ||||||
| Parental care | PBI | x | |||||
| PBI | x | ||||||
| PBI | x | ||||||
| Parental overprotectiveness | PBI | x | |||||
| PBI | x | ||||||
| PBI | x | ||||||
| Number | Outcome name | Study | Measure | ≤1 month | 3 months | 6 months | 12 months |
| Gaps occur when absence of relevant data was noted in relation to particular outcomes defined in the protocol | |||||||
| Outcome or subgroup title | No. of studies | No. of participants | Statistical method | Effect size |
| 1 Number of times had sex ‐ 3 months Show forest plot | 2 | 239 | Mean Difference (IV, Random, 95% CI) | ‐0.56 [‐1.13, 0.01] |
| 2 Number of times had sex ‐ 6 months Show forest plot | 2 | 242 | Mean Difference (IV, Random, 95% CI) | 0.73 [‐2.97, 4.43] |
| 3 Number of sexual partners ‐ 3 months Show forest plot | 2 | 239 | Mean Difference (IV, Random, 95% CI) | ‐0.04 [‐0.25, 0.17] |
| 4 Number of sexual partners ‐ 6 months Show forest plot | 2 | 242 | Mean Difference (IV, Random, 95% CI) | ‐0.04 [‐0.22, 0.13] |
| Outcome or subgroup title | No. of studies | No. of participants | Statistical method | Effect size |
| 1 Number of days used alcohol in last month ‐ 1 month Show forest plot | 2 | 235 | Mean Difference (IV, Random, 95% CI) | ‐0.33 [‐2.25, 1.59] |
| 2 Number of days used alcohol in last month ‐ 3 months Show forest plot | 2 | 235 | Mean Difference (IV, Random, 95% CI) | 1.10 [‐0.67, 2.88] |
| 3 Percent days of alcohol use in last 90 days (Form 90) ‐ 3 months Show forest plot | 5 | 383 | Mean Difference (IV, Random, 95% CI) | 0.03 [‐1.86, 1.93] |
| 4 Percent days of alcohol use in last 90 days (Form 90) ‐ 6 months Show forest plot | 3 | 295 | Mean Difference (IV, Random, 95% CI) | 1.05 [‐1.76, 3.86] |
| 5 Percent days of alcohol use in last 90 days (Form 90) ‐ 12 months Show forest plot | 3 | 304 | Mean Difference (IV, Random, 95% CI) | 0.63 [‐2.23, 3.48] |
| 6 Number of standard drinks (Form 90) ‐ 3 months Show forest plot | 2 | 75 | Mean Difference (IV, Random, 95% CI) | ‐2.87 [‐5.68, ‐0.07] |
| 7 Adolescent Drinking Index ‐ 3 months Show forest plot | 2 | 75 | Mean Difference (IV, Random, 95% CI) | 1.08 [‐4.42, 6.57] |
| 8 Percent days of alcohol/drug use (excl tobacco) (Form 90) ‐ 3 months Show forest plot | 4 | 214 | Mean Difference (IV, Random, 95% CI) | ‐0.70 [‐9.09, 7.70] |
| 9 Percent days of alcohol/drug use (excl tobacco) (Form 90) ‐ 6 months Show forest plot | 3 | 278 | Mean Difference (IV, Random, 95% CI) | ‐2.15 [‐9.82, 5.53] |
| 10 Percent days of alcohol/drug use (excl tobacco) (Form 90) ‐ 12 months Show forest plot | 2 | 127 | Mean Difference (IV, Random, 95% CI) | 5.87 [‐5.06, 16.79] |
| 11 Percent days only/any drug use (Form 90) ‐ 3 months Show forest plot | 5 | 384 | Mean Difference (IV, Random, 95% CI) | 0.67 [‐6.82, 8.15] |
| 12 Percent days only/any drug use (Form 90) ‐ 6 months Show forest plot | 3 | 295 | Mean Difference (IV, Random, 95% CI) | ‐2.28 [‐11.53, 6.96] |
| 13 Percent days only/any drug use (Form 90) ‐ 12 months Show forest plot | 3 | 304 | Mean Difference (IV, Random, 95% CI) | ‐5.28 [‐13.79, 3.23] |
| 14 Number of days used marijuana in last month ‐ 1 month Show forest plot | 2 | 235 | Mean Difference (IV, Random, 95% CI) | ‐0.52 [‐3.65, 2.62] |
| 15 Number of days used marijuana in last month ‐ 3 months Show forest plot | 2 | 235 | Mean Difference (IV, Random, 95% CI) | 0.37 [‐2.73, 3.47] |
| 16 Number of days used other drugs in last month ‐ 1 month Show forest plot | 2 | 204 | Mean Difference (IV, Random, 95% CI) | 1.21 [‐0.68, 3.10] |
| 17 Number of days used other drugs in last month ‐ 3 months Show forest plot | 2 | 204 | Mean Difference (IV, Random, 95% CI) | 0.22 [‐1.84, 2.28] |
| 18 Number of problem consequences ‐ 3 months Show forest plot | 3 | 182 | Mean Difference (IV, Random, 95% CI) | 1.51 [0.56, 2.47] |
| 19 Number of problem consequences ‐ 6 months Show forest plot | 2 | 261 | Mean Difference (IV, Random, 95% CI) | 0.34 [‐0.67, 1.34] |
| 20 Number of substance use diagnoses (CDISC) ‐ 3 months Show forest plot | 2 | 75 | Mean Difference (IV, Random, 95% CI) | ‐0.70 [‐1.27, ‐0.14] |
| 21 Number of categories of drug use (Form 90) ‐ 6 months Show forest plot | 2 | 261 | Mean Difference (IV, Random, 95% CI) | 0.14 [‐0.33, 0.61] |
| Outcome or subgroup title | No. of studies | No. of participants | Statistical method | Effect size |
| 1 Self esteem at endpoint Show forest plot | 2 | 142 | Std. Mean Difference (IV, Random, 95% CI) | 0.11 [‐0.22, 0.44] |
| Outcome or subgroup title | No. of studies | No. of participants | Statistical method | Effect size |
| 1 Depression at 3 months Show forest plot | 9 | 661 | Std. Mean Difference (IV, Random, 95% CI) | ‐0.03 [‐0.22, 0.17] |
| 2 Depression at 6 months Show forest plot | 6 | 586 | Mean Difference (IV, Random, 95% CI) | 0.83 [‐0.88, 2.55] |
| 3 Depression at 12 months Show forest plot | 5 | 441 | Mean Difference (IV, Random, 95% CI) | 1.28 [‐0.36, 2.92] |
| Outcome or subgroup title | No. of studies | No. of participants | Statistical method | Effect size |
| 1 Verbal aggression (Conflict Tactic Scale) ‐ 3 months Show forest plot | 3 | 208 | Mean Difference (IV, Random, 95% CI) | ‐0.00 [‐0.07, 0.06] |
| 2 Family violence (Conflict Tactic Scale) ‐ 3 months Show forest plot | 3 | 208 | Mean Difference (IV, Random, 95% CI) | ‐0.00 [‐0.02, 0.02] |
| Outcome or subgroup title | No. of studies | No. of participants | Statistical method | Effect size |
| 1 Percent of days living at home (Form 90) ‐ 3 months Show forest plot | 2 | 75 | Mean Difference (IV, Random, 95% CI) | ‐9.46 [‐27.96, 9.03] |
| Outcome or subgroup title | No. of studies | No. of participants | Statistical method | Effect size |
| 1 Delinquent behaviours at 3 months Show forest plot | 5 | 404 | Std. Mean Difference (IV, Random, 95% CI) | ‐0.29 [‐0.54, ‐0.03] |
| 2 Delinquent behaviours at 6 months Show forest plot | 3 | 348 | Std. Mean Difference (IV, Random, 95% CI) | ‐0.07 [‐0.52, 0.37] |
| 3 Delinquent behaviours at 12 months Show forest plot | 2 | 177 | Std. Mean Difference (IV, Random, 95% CI) | ‐0.16 [‐1.05, 0.72] |
| Outcome or subgroup title | No. of studies | No. of participants | Statistical method | Effect size |
| 1 Internalising behaviours at 3 months Show forest plot | 8 | 634 | Mean Difference (IV, Random, 95% CI) | 0.73 [‐0.87, 2.34] |
| 2 Internalising behaviours at 6 months Show forest plot | 6 | 582 | Mean Difference (IV, Random, 95% CI) | 0.30 [‐1.36, 1.97] |
| 3 Internalising behaviours at 12 months Show forest plot | 5 | 433 | Mean Difference (IV, Random, 95% CI) | 0.31 [‐1.58, 2.20] |
| 4 Externalising behaviours at 3 months Show forest plot | 8 | 636 | Std. Mean Difference (IV, Random, 95% CI) | 0.09 [‐0.10, 0.28] |
| 5 Externalising behaviours at 6 months Show forest plot | 6 | 583 | Mean Difference (IV, Random, 95% CI) | 0.83 [‐0.74, 2.41] |
| 6 Externalising behaviours at 12 months Show forest plot | 5 | 434 | Mean Difference (IV, Random, 95% CI) | 0.04 [‐2.89, 2.97] |
| 7 Number of psychiatric diagnoses Show forest plot | 3 | 182 | Mean Difference (IV, Random, 95% CI) | ‐0.06 [‐0.50, 0.37] |
| Outcome or subgroup title | No. of studies | No. of participants | Statistical method | Effect size |
| 1 Family cohesion (Family Environment Scale) ‐ 3 months Show forest plot | 3 | 208 | Mean Difference (IV, Random, 95% CI) | 0.88 [0.23, 1.54] |
| 2 Family conflict (Family Environment Scale) ‐ 3 months Show forest plot | 3 | 208 | Mean Difference (IV, Random, 95% CI) | ‐0.05 [‐0.91, 0.81] |
| 3 Parental care (Parental Bonding Instrument) ‐ 3 months Show forest plot | 3 | 208 | Mean Difference (IV, Random, 95% CI) | 1.68 [‐0.63, 4.00] |
| 4 Parental overprotection (Parental Bonding Instrument) ‐ 3 months Show forest plot | 3 | 208 | Mean Difference (IV, Random, 95% CI) | ‐0.82 [‐4.75, 3.10] |