Interleukin‐2 sebagai tambahan kepada terapi antiretroviral untuk orang dewasa HIV‐positif
Abstract
Background
Human immunodeficiency virus (HIV) continues to be a leading cause of morbidity and mortality, particularly in sub‐Saharan Africa. Although antiretroviral drugs have helped to improve the quality of life and life expectancy of HIV‐positive individuals, there is still a need to explore other interventions that will help to further reduce the disease burden. One potential strategy is the use of interleukin‐2 (IL‐2) in combination with antiretroviral therapy (ART). IL‐2 is a cytokine that regulates the proliferation and differentiation of lymphocytes and may help to boost the immune system.
Objectives
To assess the effects of interleukin‐2 (IL‐2) as an adjunct to antiretroviral therapy for HIV‐positive adults.
Search methods
We searched the following sources up to 26 May 2016: the Cochrane Central Register of Controlled Trials (CENTRAL), published in the Cochrane Library; MEDLINE; Embase; the Web of Science; LILACS; the World Health Organization (WHO) International Clinical Trial Registry Platform (ICTRP); and ClinicalTrials.gov. We also checked conference abstracts, contacted experts and relevant organizations in the field, and checked the reference list of all studies identified by the above methods for any other potentially eligible studies.
Selection criteria
Randomized controlled trials (RCTs) that evaluated the effects of IL‐2 as an adjunct to ART in reducing the morbidity and mortality in HIV‐positive adults.
Data collection and analysis
Two review authors independently screened records and selected trials that met the inclusion criteria, extracted data, and assessed the risk of bias in the included trials. Where possible, we compared the effects of interventions using risk ratios (RR), and presented them with 95% confidence intervals (CI). We assessed the overall certainty of the evidence using the GRADE approach.
Main results
Following a comprehensive literature search up to 26 May 2016, we identified 25 eligible trials. The interventions involved the use of IL‐2 in combination with ART compared with ART alone. There was no difference in mortality apparent between the IL‐2 group and the ART alone group (RR 0.97, 95% CI 0.80 to 1.17; 6 trials, 6565 participants, high certainty evidence). Seventeen of 21 trials reported an increase in the CD4 cell count with the use of IL‐2 compared to control using different measures (21 trials, 7600 participants). Overall, there was little or no difference in the proportion of participants with a viral load of less than 50 cells/mL or less than 500 cells/mL by the end of the trials (RR 0.97, 95% CI 0.81 to 1.15; 5 trials, 805 participants, high certainty evidence) and (RR 0.96, 95% CI 0.82 to 1.12; 4 trials, 5929 participants, high certainty evidence) respectively. Overall there may be little or no difference in the occurrence of opportunistic infections (RR 0.79, 95% CI 0.55 to 1.13; 7 trials, 6141 participants, low certainty evidence). There was probably an increase in grade 3 or 4 adverse events (RR 1.47, 95% CI 1.10 to 1.96; 6 trials, 6291 participants, moderate certainty evidence). None of the included trials reported adherence.
Authors' conclusions
There is high certainty evidence that IL‐2 in combination with ART increases the CD4 cell count in HIV‐positive adults. However, IL‐2 does not confer any significant benefit in mortality, there is probably no difference in the incidence of opportunistic infections, and there is probably an increase in grade 3 or 4 adverse effects. Our findings do not support the use of IL‐2 as an adjunct to ART in HIV‐positive adults. Based on our findings, further trials are not justified.
PICO
Ringkasan bahasa mudah
Interleukin‐2 sebagai tambahan kepada terapi antiretroviral untuk orang dewasa HIV‐positif
Mengapakah kami melaksanakan ulasan ini?
HIV masih merupakan punca utama kematian di seluruh dunia, terutamanya di Afrika. HIV bertambah biak di dalam darah dan merosakkan sistem imun. Oleh itu jika HIV‐positif, seseorang adalah lebih senang terjangkit dengan penyakit. Rawatan ubat semasa, terapi antiretroviral (ART), menghentikan virus daripada bertambah, dan dengan itu, membolehkan sistem imun badan untuk pulih. Interleukin‐2 (IL‐2) adalah protein di dalam badan yang membantu proses penambahan sel darah putih iaitu sel‐sel yang melawan jangkitan. Walaupun IL‐2 meningkatkan jumlah sel‐sel putih kami tidak tahu jika dengan ini kami boleh menambah manfaat tambahan kepada penggunaan ART semata‐mata. Ulasan Cochrane ini bertujuan untuk mengetahui jika penggunaan rawatan tambahan dengan terapi antiretroviral (ART), iaitu IL‐2, berbanding dengan hanya menggunakan ART, boleh mengurangkan penyakit dan kematian dalam orang dewasa yang HIV‐positif.
Mesej utama
Kami mendapati bahawa IL‐2 boleh meningkatkan sel imun CD4 (bukti kepastian tinggi). Walau bagaimanapun, tidak terdapat perbezaan dalam kesan yang penting seperti kematian dan jangkitan‐jangkitan lain (bukti kepastian tinggi). Mungkin terdapat peningkatan kesan sampingan untuk orang‐orang yang menggunakan IL‐2 (bukti kepastian sederhana). Penemuan kami tidak menyokong penggunaan IL‐2 sebagai rawatan tambahan kepada ART dalam orang dewasa yang HIV‐positif.
Keputusan utama
Selepas menjalankan carian yang komprehensif pada 26 Mei 2016, kami telah melibatkan 25 ujian yang layak yang dilaksanakan di enam negara. Tidak ada perbezaan dalam jumlah kematian antara kumpulan IL‐2 dan kumpulan yang mendapat hanya ART (6 ujian, 665 peserta, bukti kepastian tinggi). Tujuh belas daripada 21 kajian melaporkan peningkatan dalam jumlah sel CD4 dengan penggunaan IL‐2 berbanding dengan hanya ART dengan menggunakan ukuran yang berbeza. Secara keseluruhannya, tidak ada perbezaan dalam jumlah peserta dengan beban virus tertahan kurang daripada 50 sel/mL (5 ujian, 805 peserta, bukti kepastian tinggi) atau kurang daripada 500 sel/mL pada penghujung kajian (4 ujian, 5029 peserta, bukti kepastian tinggi). Secara keseluruhan, mungkin ada sedikit atau tiada perbezaan dalam bilangan kejadian jangkitan oportunistik (7 ujian, 6141 peserta,bukti kepastian rendah). Mungkin ada pertambahan peristiwa kesan sampingan gred 3 atau 4 (6 ujian, 6291 peserta, bukti kepastian sederhana). Tiada kajian yang termasuk yang melaporkan mengenai pematuhan.
Authors' conclusions
Summary of findings
| Interleukin‐2 compared to control for HIV‐positive adults | ||||||
| Patient or population: HIV‐positive adults | ||||||
| Outcomes | Illustrative comparative risks* (95% CI) | Relative effect | Number of participants | Certainty of the evidence | Comments | |
| Assumed risk | Corresponding risk | |||||
| Control | IL‐2 | |||||
| All‐cause mortality | 60 per 1000 | 58 per 1000 | RR 0.97 | 6565 | ⊕⊕⊕⊕ | There is little or no effect on all cause mortality |
| CD4 cell count | Tended to increase in all but one study | 7600 (21 trials) | — | Tended to increase in all but one study | ||
| HIV RNA levels less than 50 cells/mL | 636 per 1000 | 617 per 1000 | RR 0.97 | 805 | ⊕⊕⊕⊕ | There is little or no effect on viral suppression |
| HIV RNA levels less than 500 cells/mL | 81 per 1000 | 77 per 1000 | RR 0.96 | 5929 | ⊕⊕⊕⊕ | |
| Opportunistic infections | 46 per 1000 | 39 per 1000 | RR 0.79 | 6141 | ⊕⊕⊝⊝ | There may be little or no effect on opportunistic infections |
| Adverse events (grade 3 or 4) | 197 per 1000 | 242 per 1000 | RR 1.47 | 6291 | ⊕⊕⊕⊝ | There is probably an increase in adverse events |
| *The basis for the assumed risk (for example, the median control group risk across studies) is provided in footnotes. The corresponding risk (and its 95% CI) is based on the assumed risk in the comparison group and the relative effect of the intervention (and its 95% CI). | ||||||
| GRADE Working Group grades of evidence | ||||||
| 1Downgraded by 2 for imprecision due to low event rate resulting in a wide 95% CI is wide. The overall meta‐analysis remains underpowered to confidently exclude effects. | ||||||
Background
Description of the condition
Human immunodeficiency virus (HIV) continues to be a major cause of morbidity and mortality globally (UNAIDS 2016). In 2015 there were 2.1 million people newly diagnosed as HIV‐positive with almost half of those from Southern and Eastern Africa (UNAIDS 2016). In addition to the decrease in life expectancy caused by the disease, there are substantial health costs that may impact on the economy of affected countries. This has all led to strategic efforts by world leaders and researchers to discover effective treatments for the condition and thus curtail loss of life and the related social and economic burden (UNAIDS 2016).
HIV harms the body's immune system, particularly the CD4 lymphocytes. It destroys the host immune system, making it susceptible to opportunistic infections (Grimwade 2009; Harari 2004). Though various interventions have helped to improve the quality of life and life expectancy of HIV‐positive individuals, interventions are needed that will alleviate the effects of the disease by restoring the immune system (Harari 2004). For instance, following the introduction of antiretroviral therapy (ART) including at least three antiretroviral agents, the treatment of HIV infection is highly potent and fairly well tolerated but not without limitations (Nachega 2011). ART, which is currently the mainstay of treatment, inhibits viral replication and does not reconstitute the immune system directly (Blankson 2000; Piliero 2003). Many HIV‐positive adults do not achieve normal CD4 counts despite suppressing viral replication (Pett 2010).
Long‐term ART use is associated with drug‐resistant HIV strains, as well as cumulative drug‐related toxicities, including abnormalities in substrate metabolism (Piliero 2003). In addition, prolonged ART exposure may result in adherence fatigue and increased morbidity. This has encouraged the exploration of novel strategies to reduce the infection by augmenting the immune system and if possible completely reconstituting the immune system (Horn 2002). One such novel potential strategy has been the use of interleukin‐2 (IL‐2) as an adjunct with ART (Horn 2002).
Description of the intervention
IL‐2 is a cytokine that regulates the proliferation and differentiation of lymphocytes. Cytokines are immunological proteins produced by lymphocytes which work to expand the pool of immunological cells and mobilize latent reservoirs of such cells in people with HIV and other infections (Pett 2001). IL‐2 is a T‐cell growth factor produced predominantly by CD4+ T‐cells(Pett 2001). Its production is decreased in HIV‐positive participants (Abrams 2009). A synthetic version of the protein has been produced as proleukin. It is an important factor in the proliferation of CD4 T lymphocytes, which is a major target of HIV (Pett 2010). It is also useful in the differentiation of CD4 and CD8 cells, natural killer cells, and macrophages (Horn 2002). These cells are depleted in HIV‐positive participants, and therefore there has been this interest in the use of IL‐2 as an adjuvant therapy in the treatment of HIV‐positive individuals (Horn 2002). The low dose formulation of proleukin is rarely known to cause side effects and appears to be well‐tolerated (Horn 2002). Earlier studies reported that, by helping the reconstitution of the immune system, IL‐2 may help to defer the commencement of ART in certain participants by up to 48 weeks (Molina 2007). However, little is known about its interaction with ART and the potential toxicities in adults, children, and unborn babies (Horn 2002).
How the intervention might work
IL‐2 may work by increasing the CD4 cell count and therefore assisting to reconstitute the immune system, and help in the control of viral replication thereby boosting the effect of ART (Horn 2002). By priming the immune system it might help protect it from the damage caused by HIV and lead to lower susceptibility to opportunistic infections (Horn 2002).
Why it is important to do this review
If there is proven benefit of using IL‐2 as an adjunct in terms of decreased viral load and adverse effects, increased CD4 counts, and other patient‐related important outcomes, there will be value in introducing the use of IL‐2 more systematically as a treatment adjunct aiming for an overall improvement in morbidity and mortality. This review aims to summarize the available evidence from randomized controlled trials (RCTs) on the use of IL‐2 as an adjunct to ART in the treatment of HIV‐positive participants.
Objectives
To assess the effects of interleukin‐2 (IL‐2) as an adjunct to antiretroviral therapy (ART) for HIV‐positive adults.
Methods
Criteria for considering studies for this review
Types of studies
Randomized controlled trials (RCTs).
Types of participants
Adults who were 18 years old and above, diagnosed as seropositive for HIV on finger prick or laboratory blood testing and eligible to receive antiretroviral treatment (ART).
These included ART‐naive (no prior ART exposure) and ART‐experienced (previously treated or currently on ART) participants. The safety of interleukin‐2 (IL‐2) in children is not yet proven.
Types of interventions
IL‐2 and any combination of ART.
Variations of interest included IL‐2 co‐administered with antiretroviral monotherapy or with dual therapy or with the standard recommended three drug regimens.
We included any dose of IL‐2 for this review.
Types of outcome measures
Primary outcomes
-
All‐cause mortality.
Secondary outcomes
-
Change in CD4 cell count.
-
Proportion of participants with undetectable viral load at any time point after initiation of IL‐2.
-
Opportunistic infections.
-
Adherence (as measured by the trial authors).
-
Adverse events.
Search methods for identification of studies
Electronic searches
We formulated a comprehensive and exhaustive search strategy in order to identify all relevant studies regardless of language or publication status (published, unpublished, in press, and in progress).
Journals and trial databases
We searched the following electronic databases from 1980 up to 26 May 2016.
-
The Cochrane Central Register of Controlled Trials (CENTRAL), published in the Cochrane Library (Appendix 1).
-
MEDLINE (Appendix 2).
-
Embase (Appendix 3).
Along with MeSH terms and relevant keywords, we used the Cochrane Highly Sensitive Search Strategy for identifying reports of RCTs in MEDLINE (Higgins 2008a). We also searched references of included studies for other potentially relevant studies. Using a variety of relevant terms, we also searched ClinicalTrials.gov (www.clinicaltrials.gov; Appendix 4) and the World Health Organization International Clinical Trials Registry Platform (WHO ICTRP) (http://apps.who.int/trialsearch/) for any ongoing trials.
Searching other resources
Conference abstract databases
We planned to search Aegis archive of HIV/AIDS conference abstracts (www.aegis.org). However, this database is no longer functional and was not searched.
We did search the CROI and International AIDS Society websites for abstracts presented at conferences subsequent to those listed above using different combinations of relevant search terms, such as antiretroviral, interleukin‐2, HIV, viral load, therapy, CD4 count, and other terms in combination. We contacted experts and relevant organizations in the field to identify any other potentially eligible studies, including unpublished and ongoing trials.
Data collection and analysis
Selection of studies
Two review authors (JO and CO) independently screened the titles and abstracts of the literature search results to identify potentially eligible studies. We resolved any discrepancies through discussion. We obtained the full‐text articles of all potentially eligible articles in order to formally assess eligibility using the prespecified eligibility criteria. If there was ambiguity we sought clarification from the study authors. We listed all excluded studies and their reasons for exclusion in a 'Characteristics of excluded studies' table. We also presented the study selection process in a PRISMA diagram.
Data extraction and management
Two review authors (JO and CO) independently extracted data from the included trials using a detailed data extraction form. We extracted the following information.
-
Study details: citation, start and end dates, location, study design, and details.
-
Participant details: study population eligibility (inclusion and exclusion) criteria, ages, population size, and attrition rate.
-
Details about the interventions: dose, duration of treatment, concomitant antiretroviral treatment (ART) regimens.
-
Details of the outcomes: CD4 cell count, viral load, death, adverse effects, and adherence.
For each dichotomous outcome, we extracted the number of participants experiencing the event and the number of participants in each treatment group. For each continuous outcome we extracted the mean or geometric mean values and standard deviations (SDs) (or information to estimate the SDs) for each treatment group, together with the numbers of participants in each group. We also extracted the median and range values if these were reported in place of mean and SDs values.
Assessment of risk of bias in included studies
Two review authors (JO and CO) performed the 'Risk of bias' assessments independently using the Cochrane 'Risk of bias' assessment tool (Higgins 2008b). The Cochrane approach assesses risk of bias in individual studies across the following six domains: sequence generation, allocation concealment, blinding, incomplete outcome data, selective outcome reporting, and other potential biases.
We resolved any differences in opinion through discussion. We presented the 'Risk of bias' assessments for individual trials in the 'Risk of bias' tables, and also in a 'Risk of bias' summary and 'Risk of bias' graph.
Measures of treatment effect
For dichotomous outcomes, we used risk ratios (RRs) to measure treatment effect. For continuous outcomes, we presented the mean or median and SD values or ranges. We presented RRs and mean differences with 95% confidence intervals (CIs).
Unit of analysis issues
All included trials were RCTs and we analysed the data at the level of the individual.
Dealing with missing data
We did not apply any imputation measures for missing data as there were no missing data. we planned to contact authors for missing data, but this was not required.
Assessment of heterogeneity
We assessed statistical heterogeneity by visually inspecting the forest plots to detect overlapping confidence intervals, applying the Chi2 test (P value < 0.10 considered statistically significant), and also by using the I2 test statistic to evaluate the degree of heterogeneity.
Assessment of reporting biases
Funnel plots describe the relationship between the standard error and the effect size and provide a graphic display of potential reporting bias. We had planned to evaluate reporting bias by assessing the symmetry of a funnel plot. However, as the recommended 10 study minimum was not met for any of the outcomes, we did not proceed with the funnel plot assessment.
Data synthesis
We analysed data using Review Manager 5 (RevMan 5) software (Review Manager 5), and conducted meta‐analysis using the random‐effects model. We assessed the certainty of the evidence across each outcome measure by using the GRADE approach. The certainty rating across studies has four levels: high, moderate, low, or very low certainty but can be downgraded after assessment of five criteria: risk of bias, consistency, indirectness, imprecision, and publication bias. Similarly, observational studies are initially categorized as low certainty and can be downgraded by these same criteria. In exceptional circumstances they may be upgraded by three further criteria: large effect size, all plausible confounders would act to reduce the effect size, and evidence of a dose‐response effect (Guyatt 2008)
Subgroup analysis and investigation of heterogeneity
We performed a subgroup analysis based on whether the participants were ART experienced or ART naive.
Sensitivity analysis
Several studies had unclear risk of bias due to unclear reporting on allocation concealment, but this was not adequate to prompt a sensitivity analysis based on the trial quality.
Results
Description of studies
Results of the search
We performed electronic literature searches up to 26 May 2016. We identified a total of 1007 records, which we screened by title/abstract. We identified 35 potentially eligible studies and obtained the full‐text articles of these studies. We excluded 10 studies, which we listed along with their reasons for exclusion in the 'Characteristics of excluded studies' table. Twenty‐five trials met the inclusion criteria of the review. We have presented the study selection process in a PRISMA flow diagram (Figure 1).
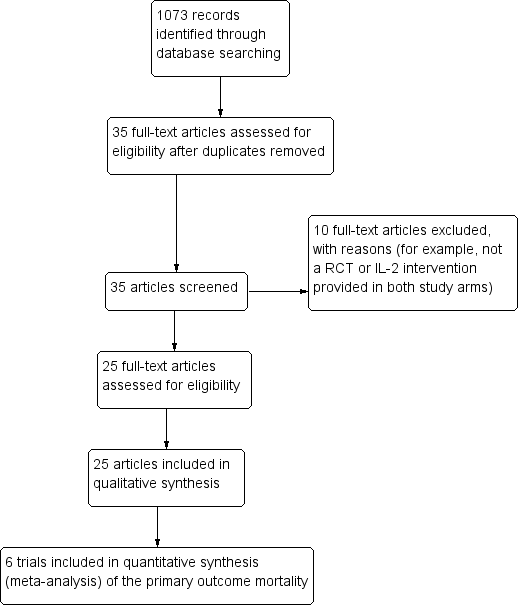
Study flow diagram
Included studies
See the 'Characteristics of included studies' and Table 1, which further describe the populations and interventions in the included trials.
| Number | Trial ID | Follow‐up duration | Dosing regimen for interleukin‐2 (IL‐2) | Comparisons | Outcomes | ART experienced or naive |
| 1 | 16 months | Dose: 2 doses (4.5 and 7.5 miu) Route: subcutaneous Duration: twice daily for 5 days every 8 weeks | ART not specified | Viral load CD4 cell count | ART experienced | |
| 2 | 7 years | Dose: 4.5 miu Route: subcutaneous Duration: twice daily, 6 cycles | ART not specified | Opportunistic infections Death from any cause Adverse events | Not specified | |
| 3 | 7 years | Dose: 7.5 miu Route: subcutaneous Duration: twice daily, 3 cycles | ART not specified | Opportunistic infections Death from any cause Adverse events | Not specified | |
| 4 | 28 weeks | Dose: 1 miu Route: subcutaneous Duration: daily for 5 days/week every alternate week for 3 months | Indinavir, stavudine, and lamivudine | CD4 cell count Viral load | ART naive | |
| 5 | 12 months | Dose: 12 miu Route: intravenous Duration: for 3, 4, or 5 days every 8 weeks for 6 cycles | ART not specified | CD4 cell count Viral load Adverse events and serious adverse events AIDS defining complex | ART experienced | |
| 6 | 12 months | Dose: 6 miu Route: subcutaneous Duration: from days 1 to 5 and days 8 to 12 of a 28‐day cycle for 6 cycles | 2 nucleoside reverse transcriptase inhibitors (NRTIs) or 2 NRTIs and indinavir | CD4 cell count Viral load | ART naive | |
| 7 | 12 months | Dose: 1 miu Route: subcutaneous and intravenous Duration: Group A: 12 miu daily for 5 days every 8 weeks (27 participants) Group B: 1 miu per cycle in equal divided doses in day 1 and 3 every 8 weeks (58 participants) | Zidovudine + didanosine + zalcitabine | CD4 cell count Adverse events Viral load Opportunistic infections | ART experienced | |
| 8 | 48 weeks | Dose: 7.5 miu Route: subcutaneous Duration: 6 cycles every 12 hours for 5 days every 8 weeks | ART not specified | CD4 cell count Viral load Adverse events | ART experienced | |
| 9 | 12 months | Dose: 7.5 miu Route: subcutaneous Duration: 3 cycles for 5 days every 8 week | ART not specified | CD4 cell count Viral load | Not specified | |
| 10 | 12 months | Dose: 9.6 miu Route: subcutaneous Duration: 5 cycles were given. One cycle was given every 6 weeks over a period of 52 weeks. Treatment group A : subcutaneous administered daily in cycles consisting of 5 days. Treatment group B: subcutaneous administered at a dose of 9.6 miu daily whenever CD4 counts dropped to below 1.25 fold of individual's baseline value | Saquinavir, lamivudine, and zidovudine | CD4 cell count Viral load Opportunistic infections | ART experienced | |
| 11 | 24 weeks with outcomes measured at weeks 1, 6, 12, 18, and 24 | Dose: 4.5 miu Route: subcutaneous Duration: every 6 weeks for 4 cycles, every 12 hours for 5 days | 2 nucleoside analogues and one PI | CD4 cell count Viral load Adverse events ART experienced | Not specified | |
| 12 | 48 weeks | Dose: 12 miu Route: intravenous Duration: Group A: 12.6 miu as continuous intravenous infusions for 5 days every 8 weeks for 6 cycles. Group B (IL‐2 linked to polyethylene glycol plus ART): subcutaneous injections on days 1 and 3 of each 8‐week cycles | ART included nucleoside analogues such as lamivudine | CD4 cell count Viral load | ART experienced | |
| 13 | 14 months | Dose: 18 miu Route: intravenous Duration: daily for 5 days every other month for 6 cycles from month 0 to 10 | ART included didanosine, zidovudine, zalcitabine, or stavudine | CD4 cell count Plasma HIV RNA | Not specified | |
| 14 | 6 months | Dose: 1.2 miu, and then increased by 0.3 miu every 2 weeks for 6 months until a participant experienced grade 2 or greater toxicity. Route: subcutaneous Duration: once daily for 2 weeks | ART not specified | CD4 cell count Viral load Adverse events | ART experienced | |
| 15 | 14 months | Dose: 12 miu and 3 miu Route: 12 miu intravenous and 3 miu subcutaneous intravenously (12 miu/day, N = 22) or subcutaneously (3 miu/m² twice daily, N = 24) for 5 days, or 2 miu/m² intravenous bolus, N = 22) administered every 2 months from week 2 to week 50 (7 cycles). | Zidovudine (600 mg/day) plus didanosine (400 mg/day) | CD4 cell count Viral load Adverse events | ART naive | |
| 16 | 18 months | Dose: 5 miu Route: subcutaneous Duration: twice daily for a 5 day cycle given every 4 weeks for the first 3 cycles and then subsequently every 8 weeks for the next 7 cycles | ART included lamivudine (300 mg/day), stavudine (60 to 80mg/day) and indinavir (2400 mg/day) | CD4 cell counts Viral load AIDS defining events | ART naive or naive to PIs alone | |
| 17 | 24 weeks | Dose: escalating doses of 1.5 miu, 4.5 miu, 7.5 miu Route: subcutaneous Duration: twice daily for 5 consecutive days every 8 weeks | ART not specified | CD4 cell counts . Viral load | Both naive and experienced participants were included in the study. | |
| 18 | 48 weeks | Dose: 3 miu Route: subcutaneous Duration: administered as a single subcutaneous injection at days 1 to 5 and 8 to 12 of a 4‐week cycle, for a total of 3 cycles | ART was either 2 nucleoside reverse transcriptase inhibitor | CD4 cell count Viral load Adverse events | ART experienced | |
| 19 | 48 weeks | Dose: 3 miu Route: subcutaneous Duration: administered at day 1 to 5 and 8 to 12 for 10 weeks | ART not specified | CD4 cell count | ART experienced | |
| 20 | 84 weeks | Dose: Group A 9 miu and Group B 7.5miu Route: intravenous and subcutaneous Duration: Group A: intravenous infusions 5 days every 8 weeks. Group B: subcutaneous injections 7.5 miu twice daily for 5 days every 8 weeks | Received ART alone, 2 nucleosides and a PI | CD4 cell count Viral load | Not specified | |
| 21 | 24 weeks | Dose: Group A 1.5 miu, Group B 4.5 miu, and Group C 7.5 miu Route: subcutaneous Duration: twice daily for 5 days, every 8 weeks for three cycles 8‐weekly | ART not specified | CD4 cell count Viral load | ART experienced | |
| 22 | 601 days | Dose: 9 miu Route: subcutaneous Duration: once daily (with an option to switch to 4.5 miu twice daily) for 5 consecutive days per cycle administered at 6‐weekly intervals | ART consisting of stavudine 30 to 40 mg twice daily, and lamivudine 150 mg twice daily, nelfinavir 750 mg 3 times daily and saquinavir 600 mg 3 times daily. | CD4 cell count Viral load | ART naive | |
| 23 | 12 months | Dose: 3 regimens of IL‐2 Route: intravenous and subcutaneous Duration:differed by group see details below Group A: 12 miu by continuous intravenous infusion followed by subcutaneous 7.5 miu twice a day for 5 days every 8 weeks for the remaining 4 cycles. Group B: subcutaneous 7.5 miu twice a day for 5 days every 8 weeks for 6 cycles. Group C: subcutaneous 3 miu twice a day every 4 weeks | 2 NRTIs and saquinavir | CD4 cell count Viral load | ART experienced | |
| 24 | 12 months | Dose: 7.5 miu Route: subcutaneous Duration: Group A: 7.5 miu twice daily for 5 days versus placebo plus ART. Group B: 7.5 miu twice a day for 5 days | Nucleosides analogue reverse transcriptase inhibitor and either a non‐nucleosides analogue reverse transcriptase inhibitor or PI | CD4 cell count Viral load | ART experienced | |
| 25 | 24 weeks | Dose: 1 miu Route: subcutaneous Duration: once daily | 2 nucleoside reverse transcriptase inhibitors | CD4 cell count Viral load | ART experienced |
Abbreviations: ART antiretroviral therapy; IL‐2 Interleukin 2; NRTI nucleoside reverse transcriptase inhibitors; PI protease inhibitor
Study design and setting
We included 25 parallel‐design RCTs in the review (Abrams 2002; Abrams 2009a; Abrams 2009b; Amendola 2000; Caggiari 2001; Carr 1998; Davey 2000; de Boer 2003; Dybul 2002; Hengge 1998; Katlama 2002; Kelleher 1998; Kovacs 1996; Lalezari 2000; Levy 1999; Levy 2003; Losso 2000; Marchetti 2002; Marchetti 2004; Mitsuyasu 2007; Ruxrungtham 2000; Stellbrink 2002; Tambussi 2001; Tavel 2003; Vogler 2004).
Eleven trials were conducted in academic centres in the USA (Abrams 2002; Davey 2000; Dybul 2002; de Boer 2003; Abrams 2009a; Abrams 2009b; Kovacs 1996; Lalezari 2000; Mitsuyasu 2007; Tavel 2003; Vogler 2004). The other 14 included trials were conducted in Argentina (Losso 2000), France (Katlama 2002; Levy 1999; Levy 2003), Italy (Amendola 2000; Caggiari 2001; Marchetti 2002; Marchetti 2004; Tambussi 2001), Australia (Carr 1998; Kelleher 1998), Germany (Hengge 1998; Stellbrink 2002), and Thailand (Ruxrungtham 2000).
Participants
All participants were HIV‐positive adults either ART experienced or who were commenced on ART during the trial, with CD4 cell counts of at least 50 cells/mm³. The number of participants per trial ranged from nine participants (Dybul 2002), to 4111 participants (Abrams 2009a).
Interventions
In all included trials, participants in the intervention group received IL‐2 and ART, while those in the control group received ART alone. The dose of IL‐2 and the ART regimen varied across the included trials. Some trials compared doses of either 4.5 miu of IL‐2 , 7.5 miu of IL‐2 with ART, or different subgroups of both doses with the control group (Abrams 2002; Abrams 2009a; Abrams 2009b; Davey 2000). Some trials had three trial arms that compared different routes of administration, including subcutaneous versus intravenous administration with the control group (ART alone) (Carr 1998; Mitsuyasu 2007; Tambussi 2001). Other included trials had three trial arms that compared IL‐2, a control group, and different modified forms of IL‐2, such as polyethylene glycol (PEG) modified IL‐2 (Carr 1998; Kelleher 1998; Levy 1999), and granulocyte stimulating factor‐modified IL‐2 (Amendola 2000), and prednisone‐modified IL‐2 (Vogler 2004).
Outcomes
Of the outcomes of interest in this Cochrane Review, the included trials reported the following outcomes: all‐cause mortality, change in CD4 cell, viral load, opportunistic infections, and adverse effects. However, none of the included trials reported on adherence.
Excluded studies
After considering the full‐text articles, we excluded 10 potentially eligible studies that did not meet our inclusion criteria. We have provided the reasons for excluding these trials in the 'Characteristics of excluded studies' table.
Risk of bias in included studies
We have provided a graphical summary of the 'Risk of bias' assessment results (Figure 2; Figure 3).

'Risk of bias' graph: review authors' judgements about each 'Risk of bias' item presented as percentages across all included trials

'Risk of bias' summary: review authors' judgements about each 'Risk of bias' item for each included trial
Allocation
Random sequence generation
There was adequate sequence generation in 11 of the 25 included trials (Abrams 2002; Abrams 2009a; Abrams 2009b; Davey 2000; de Boer 2003; Katlama 2002; Lalezari 2000; Levy 2003; Losso 2000; Mitsuyasu 2007; Ruxrungtham 2000). There was high risk of selection bias in Hengge 1998. The remaining 13 included trials poorly reported the method of sequence generation.
Allocation concealment
More than half of included studies did not report allocation concealment clearly and were judged as having unclear risk of bias. One study, Hengge 1998, had high risk of allocation concealment bias due to the manner in which participant selection was conducted. .
Blinding
The included trials were open label trials with no blinding of participants. However, all of the reported outcome measures are objective. Therefore we judged each of the included trials as at low risk of bias regarding blinding.
Incomplete outcome data
We considered the following trials to have a low risk of attrition bias with low or minimal loss to follow‐up: Abrams 2002; Abrams 2009a; Abrams 2009b; Carr 1998; Davey 2000; de Boer 2003; Hengge 1998; Katlama 2002; Kelleher 1998; Kovacs 1996; Levy 1999; Levy 2003; Losso 2000; Marchetti 2002; Marchetti 2004; Stellbrink 2002; Tambussi 2001; and Vogler 2004. There was high risk of attrition bias in Lalezari 2000 and Mitsuyasu 2007. Five trials had unclear risk of attrition bias (Amendola 2000; Caggiari 2001; Dybul 2002; Ruxrungtham 2000; Tavel 2003).
Selective reporting
All included trials were at low risk of selective reporting bias. The trials reported all outcomes that they described in the methods in the results.
Other potential sources of bias
We identified other potential sources of bias in the following three trials (Carr 1998; Losso 2000; Tambussi 2001). In Carr 1998, there was potential for both detection bias or performance bias due to the fact that the IL‐2 group were hospitalized for five to six days longer than the control group. However, as the outcomes reported are considered objective (i.e. CD4 count and viral load) the potential risk is probably low. Losso 2000 had more monitoring in the IL‐2 group than in the control group, which caused a potential for detection bias and performance bias since some adverse effects could be subjective. There was a high risk of performance bias in Tambussi 2001 due to differential treatment. Participants who were randomized to the continuous intravenous high dose and subcutaneous high dose groups received the first two cycles of IL‐2 as inpatients and the following cycles on an outpatient basis, whereas participants in the low dose and control groups were followed up as outpatients from the beginning of the trial.
Effects of interventions
See: Summary of findings for the main comparison 'Summary of findings' table 1
See summary of findings Table for the main comparison.
Primary outcomes
All‐cause mortality
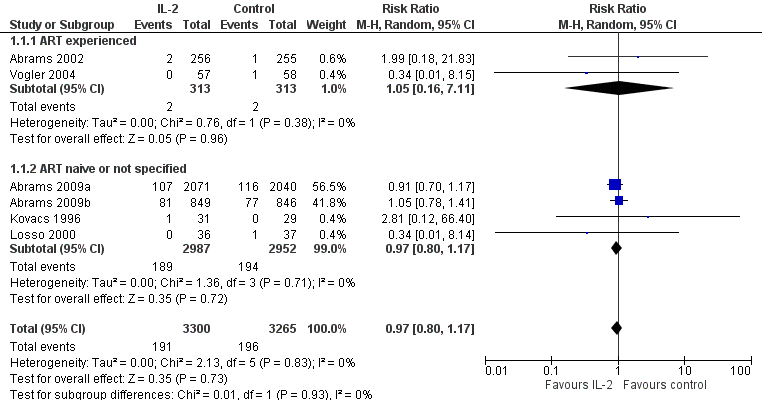
Eight trials reported on all‐cause mortality (Abrams 2002; Abrams 2009a; Abrams 2009b; Kovacs 1996; Levy 1999; Losso 2000; Mitsuyasu 2007; Vogler 2004). Trials reported mortality at six months (Vogler 2004), 12 months (Abrams 2002), 13 months (Levy 1999), 14 months (Kovacs 1996), 20 months (Mitsuyasu 2007), and seven years (Abrams 2009b; Abrams 2009a). Levy 1999 and Mitsuyasu 2007 had more than two trial arms, which we did not include in the pooled analysis. Therefore, we pooled results from six trials (Abrams 2002; Abrams 2009a; Abrams 2009b; Kovacs 1996; Losso 2000; Vogler 2004) (risk ratio (RR) 0.97, 95% confidence interval (CI) 0.80 to 1.17; 6 trials, 6565 participants, high certainty evidence; Analysis 1.1; Figure 4). There was no significant difference in the test for subgroup differences looking at ART experienced participants and others (ART naive or experienced or unclear ART status). We also did not find any significant subgroup differences with trials that reported the outcome at seven years and those that reported the outcome at less than 24 months.
Secondary outcomes
Change in CD4 cell count
Twenty‐one trials reported on change in CD4 cell count: (Abrams 2002; Abrams 2009a; Abrams 2009b; Amendola 2000; Carr 1998; Davey 2000; de Boer 2003; Dybul 2002; Hengge 1998; Katlama 2002; Kovacs 1996; Lalezari 2000; Levy 1999; Levy 2003; Losso 2000; Marchetti 2002; Mitsuyasu 2007; Tambussi 2001; Tavel 2003; Ruxrungtham 2000; Vogler 2004).
We did not pool the results because the included trials reported either means or median values differently (see Table 2 which describes the different reporting on CD4 count changes by the included trials).
| Increase in CD4 cell count with statistically significant difference | |
| (at 12 months follow‐up) n = 511 | The average difference change in CD4 cell count between the IL‐2 group and control group was 217.1 cells/mm³ (95% CI 188.6 to 245.5; P < 0.001) measured at 12 months. |
| (at 12 months follow‐up) n = 115 | Median CD4 cell count increases of 359 and 44 cells/mm³ and a decline of 46 cells/mm³ in the cyclical continuous intravenous IL‐2, subcutaneous IL‐2, and ART alone group, respectively, over 12 months (P < 0.0001 for each intergroup comparison). |
| (at 12 months follow‐up) n = 82 | The median increase in CD4 count at 12 months was 279 cells/mm³ in the IL‐2 group compared with 50 cells/mm³ in the control (P < 0.001). |
| n = 81 | The mean per cent increase in CD4 cell counts was 24.5% for IL‐2 recipients compared to a mean per cent decrease of 30.5% for control participants (P < 0.005). |
| (at 12 months follow‐up) n = 64 | The median CD4 cell counts increased from 363 to 485 (+ 33.6% standard deviation) in the IL‐2 group Group A (P < 0.01) and from 358 to 462 (+ 29.1%) in Group B (P < 0.01) and from 350 to 375 (+ 6.9% in the control group (not significant), respectively. |
| (at 24 weeks, that is 6 months follow‐up) n = 72 | The median increase in CD4 cells at week 24 was significantly higher in the IL‐2 group than in the control group (65 versus 18 cells/mm³; P < 0.0001). |
| (at 12 months follow‐up) n = 60 | There was an increase in the mean (± SE) CD4 count from 428 ± 25 cells/mm³ at baseline to 916 ± 128 in the IL‐2 group, compared to a decreased from 406 ± 29 cells/mm3 to 349 ± 41 cells/mm³ in the control group (P < 0.001). |
| (at 26 weeks follow‐up) n = 115 | The percentage increase in CD4 count from baseline of 3.59% in the IL‐2 group compared to 1.33% in the control group (P < 0.001). |
| (at 56 weeks follow‐up) n = 94 | The median increase in CD4 count from baseline at 56 weeks was 564 cells/mm³ (P > 0.0001), 105 cells/mm³ (P = 0.58), and 676 cells/mm³ (P = 0.0002) in the subcutaneous (SC), polyethylene glycol modified, and intravenous (IV) IL‐2 group respectively, compared to 55 cells/mm³ in the control group |
| (at 74 weeks follow‐up) n = 118 | The median increase in CD4 count from baseline at week was 865 cells/mm³ in the IL‐2 group compared to 262 cells/mm³ in the control group (P < 0.00001). |
| (at 24 weeks follow‐up) n = 73 | The mean increase in CD4 count from baseline at week 24 of 27 cells/mm³ (P = 0.105), 105 cells/mm³ (P = 0.006), and 492 cells/mm³ (P < 0.001) in the 1.5, 4.5, and 7.5 miu dose groups of IL‐2. Overall 14 out of 36 (41%) of the IL‐2 group and 3 out of 37 (8%) of the controls had a magnitude increase of ≥ 1000 cells/mm³. |
| (48 weeks follow‐up) n = 22 | IL‐2 treated participants had mean absolute CD4 T cell counts (S.E) significantly increase at the end of the IL‐2 treatment (week 48) from 147 (18) cells/mm³ at baseline to 298 (43.3) cells/mm³ (P=0001). The control participants also had a significant increase was observed 16 weeks 228 (29) cells/mm³ (P = 0.002). |
| (at 48 weeks follow‐up) n = 159 | Reported median increases of CD4 cell count were 459, 312, and 102 cells/mm³ in the intravenous, SC Il‐2, and control groups respectively at 48 weeks (P < 0.001 for both). |
| (at 12 months follow‐up) n = 19 | Reported a mean increase in CD4 count from baseline of 452 cells/mm3 in the IL‐2 group compared to 135 cells/mm3 in the control group (P < 0.05). |
| n = 82 | Reported an increase in the time weighted mean CD4 cell count 252 x 106 cells/mm³ over 24 weeks for the overall scIL‐2 group compared with 42 x 106 cell/mm³. |
| Increase in CD4 cell count but statistical significance not reported in the trials | |
| (at 12 months follow‐up) (at 6 years follow‐up) n = 4111 | Six trials measured at 1 year; median CD4 increase of 206 versus 21 cells/mm³ in the IL‐2 group versus the control group and reported an average median increase of 109 more in the IL‐2 group more than the control group over the entire 7 years (95% CI 40 to 60 over 6 years) |
| (at 12 months follow‐up) n = 1695 | Six trials measured at 1 year; median CD4 increase of 131 versus 32 cells/mm³ in the IL‐2 group versus the control group over 12 months and reported an average median increase of 53 more in the IL‐2 group more than the control group over the entire 7 years (95% CI 40 to 60 over 6 years) |
| Dybul 2002 (at 12 months follow‐up) n = 9 | Four participants treated with HAART plus 3 cycles of intermittent IL‐2 had an increase in median absolute CD4+ T cell count from 529 cells/mm³ (range: 502 to 738 cells/mm³) at enrolment to 1995 cells/mm³ (range: 1112 to 3064 cells/mm³; 268% increase) after 12 months of treatment (Figure 1A). Five participants treated with HAART alone had an increase in median CD4+ T cell count from 580 cells/mm³ (range: 416 to 662 cells) at enrolment to 712 cells/mm³ (range: 667 to 1160 cells/mm³; 52% increase) after 12 months of treatment |
| No significant increase in CD4 cell count | |
| (at 24 weeks) n = 115 | Mean change in CD4 count in the IL‐2 group and the control group was 40 and −1 respectively |
| n = 61 | Reports that there was a progressive increase in circulating CD4 cells, determined at the beginning of each IL‐2 cycle, was observed in all participants receiving ART plus IL‐2, in comparison with those receiving ART alone but gave the values for the within subgroup variation |
| (at 6 months follow‐up) n = 22 | No significant difference between changes in CD4 counts in both groups |
Abbreviations: ART: antiretroviral therapy; ESPIRIT: Evaluation of Subcutaneous Proleukin in a Randomised International Trial; IL‐2: interleukin‐2; SILICAAT: subcutaneous recombinant human interleukin‐2 in HIV‐infected patients low CD4 counts under active antiretroviral therapy
Significant increase in CD4 cell count with IL‐2
Fifteen trials reported a significant increase in CD4 cell count in the group assigned to IL‐2 treatment (Abrams 2002; Carr 1998; Davey 2000; de Boer 2003; Hengge 1998; Katlama 2002; Kovacs 1996; Lalezari 2000; Levy 1999; Levy 2003; Losso 2000; Marchetti 2002; Mitsuyasu 2007; Tavel 2003; Ruxrungtham 2000).
Increase in CD4 cell count but statistical significance not reported
Five trials provided results for a relative increase in CD4 count in the groups receiving IL‐2. Abrams 2009a reported this outcome at seven years; Abrams 2009b and Amendola 2000 reported at six months; Dybul 2002 and Tambussi 2001 reported this at 84 weeks. However, these trials did not provide further details of whether the difference was statistically significant.
No significant increase in CD4 cell count
Two trials reported that there was no significant difference in the CD4 cell count between groups over 24 weeks, Ruxrungtham 2000 and Vogler 2004; however in the Ruxrungtham 2000 trial the lack of difference depended on the dosing of IL‐2 with higher doses resulting in a significant difference in a dose‐response manner.
Proportion of participants with undetectable viral load at any time point
Plasma viral load less than 50 copies/mL
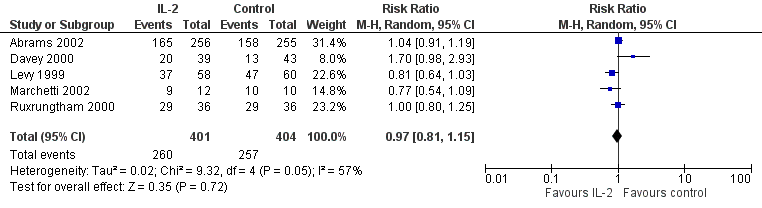
Seven trials reported on viral load of less than 50 copies/mL (Abrams 2002; Davey 2000; Lalezari 2000; Levy 2003; Marchetti 2002; Mitsuyasu 2007; Tavel 2003). None of the included trials found any significant difference between the two groups irrespective of the time when the viral load was measured. Overall, in the pooled analysis, there was no significant difference in the proportion of participants with a viral load of less than 50 copies/mL by the end of the trials (RR 0.97, 95% CI 0.81 to 1.15; 5 trials, 805 participants, high certainty evidence; Analysis 1.2; Figure 5).
Plasma viral load level less than 500 copies/mL
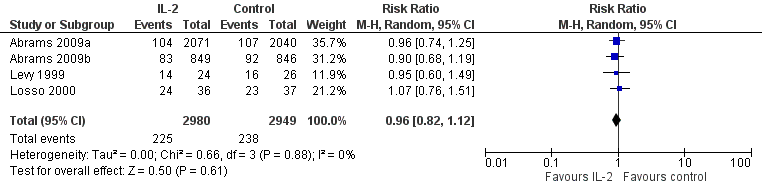
Four trials reported on plasma viral load of less that 500 copies/mL (Abrams 2009a; Abrams 2009b; Levy 1999; Losso 2000). None of the included trials found any significant difference between the two groups in viral load of less than 500 copies/mL irrespective of the time when the viral load was measured. The overall results did not show any significant difference in the two groups (RR 0.96, 95% CI 0.82 to 1.12; 4 trials, 5929 participants, high certainty evidence; Analysis 1.3; Figure 6).
Undetectable viral loads
In Amendola 2000, participants in both groups had HIV load levels below detection limit at the end of the study. Caggiari 2001 reported undetectable viral loads in six out of seven participants both the IL‐2 and ART only group. Carr 1998 did not report any difference in the mean viral load in any of the study arms. In Kovacs 1996, there were no significant differences between the groups in serial measurements of the plasma viral load or p24 antigen concentration during the 12 months of treatment.
Other viral load measurements
Six included trials found no significant difference in viral load (Hengge 1998; Katlama 2002; Levy 2003; Marchetti 2002; Tambussi 2001; Vogler 2004).
Opportunistic infections
Seven included trials reported the incidence of opportunistic infections (Abrams 2009a; Abrams 2009b; Carr 1998; Hengge 1998; Katlama 2002; Kovacs 1996; Mitsuyasu 2007). Overall there was no significant difference between the two groups (RR 0.79, 95% CI 0.55 to 1.13; 7 trials, 6141 participants, low certainty evidence; Analysis 1.4; Figure 7).

Adherence
None of the included trials reported on adherence.
Adverse events
Nine included trials reported on adverse events (Abrams 2009a; Abrams 2009b; Davey 2000; de Boer 2003; Katlama 2002; Lalezari 2000; Levy 2003; Marchetti 2002; Tavel 2003).
GRADE 3 or higher adverse events
In Abrams 2009a, a total of 203 participants receiving IL‐2 and 186 participants in the control group had a grade 4 adverse event. In Abrams 2009b, a total of 203/849 participants receiving IL‐2 and 186/846 participants in the control group had a grade 4 adverse event. Davey 2000 reported grade 3 or higher adverse events in 20/39 participants in the IL‐2 group and in 7/43 adverse events in the control group (RR 3.13, 95% CI 1.50 to 6.63). Lalezari 2000 reported grade 3 adverse events in 10/56 participants (18%) in the IL‐2 group and in 9/59 (15%) of the control group while grade 4 adverse events were 1 (2%) and 3 (5%) respectively. Levy 1999 reported that severe adverse effects, such as aspartate transaminase deficiency, were reported in 2/26 of the participants in the control group and 16 participants (25%), 2 participants (5%), and 4 participants (9%), in the subcutaneous, PEG‐modified, and intravenous IL‐2 groups respectively. Severe neutropenia (less than 1 x 10⁹/mL) was also seen in 2/26 (8%) participants in the control group and 9 participants (8%), 2 participants (9%), 3 participants (4.5%) in the subcutaneous, PEG‐modified, and intravenous IL‐2 groups. Levy 2003 reported that grade 3 or 4 adverse effects were noted in 34/53 participants (64%) in the IL‐2 group compared to 12/56 participants (22%) in the control group (P < 0.001).
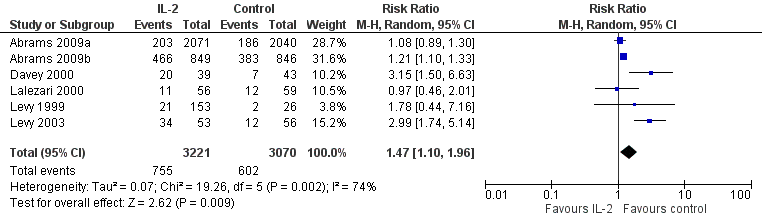
In Mitsuyasu 2007, both IL‐2 arms were associated with significantly more grade 3 or 4 clinical toxic effects usually associated with IL‐2 treatment (with values of 30%, 53%, and 67% for 57, 58, and 59 participants) in the ART only, intravenous IL‐2 group, and subcutaneous IL‐2 group respectively. Tavel 2003 reported episodes of severe toxicities, neutropenia, and orthostatic blood pressure respectively in 2/5 participants compared to 0/4 in the control participants. Vogler 2004 reported no statistical significant difference between both groups in grade 3 or worse adverse effects (P ≥ 0.12). By the end of the trial at 24 weeks, two grade 4 events had occurred: one case of grade 4 hypertriglyceridaemia, one case of agitation in the ART plus IL‐2 group, and none in the control. Overall there were greater adverse effects in those participants receiving IL‐2 (RR 1.47, 95% CI 1.10 to 1.96; six trials, 6291 participants, moderate certainty evidence; Analysis 1.5; Figure 8).
GRADE 2 or lower adverse events
In Lalezari 2000, grade 2 or lower adverse events were reported in 43/56 participants in the IL‐2 group and in 47/59 of the control group. Katlama 2002 reported that all participants receiving IL‐2 experienced at least one mild‐to‐moderate side‐effect, mainly constitutional symptoms such as fever, fatigue, malaise, and myalgias. Marchetti 2002 reported lower than grade 3 events in a total of 11 participants. Mild constitutional symptoms, such as fever (grade 1 to 2), fatigue, and myalgia were experienced by 10/12 participants receiving IL‐2, a reversible localized erythematous nodule at the site of injection was observed in 11/12 participants.
Discussion
Summary of main results
We identified 25 trials that met our inclusion criteria. The number of participants in the included trials varied from nine to 4111 participants. Interleukin‐2 (IL‐2) doses and the duration of follow‐up varied across the included trials. We judged the risk of bias due to methodological quality of the included studies to be low. There was no significant difference in mortality whether IL‐2 was added to the ART regimen or not (high certainty evidence). There was a significant increase in CD4 cell count in the IL‐2 group in most of the included trials (high certainty evidence). There was no statistically significant difference between viral load in both groups for measures less than 50 copies/mL or 500 copies/mL in most trials (high certainty evidence). IL‐2 probably causes an increase in adverse effects, particularly grade 3 or 4 adverse effects (moderate certainty evidence). Most of the included trials reported similar adverse events, neutropenia, and myalgia were most commonly reported. There is probably no difference in the incidence of opportunistic infections in the IL‐2 and control groups (low certainty evidence). Adherence was not reported in any of the included trials.
Overall completeness and applicability of evidence
We conducted a comprehensive search and included all relevant trials regardless of whether they reported the reviews outcomes of interest. Most included trials excluded participants who were previously on immunomodulators or steroids, or with an autoimmune disease, or with malignancy requiring them to be on immunomodulators. The trials were conducted in different settings: including high‐ and middle‐income countries. However, there is no plausible biological reason why the findings may not be applicable to low‐income settings.
Quality of the evidence
We assessed the certainty of the evidence using the GRADE methodology, and presented the basis for the judgements in a 'Summary of findings' table. The overall certainty of evidence on the effects of IL‐2 as an adjunct to ART for reducing morbidity and mortality in HIV‐infected adults individuals can be described as high, which means that we are confident in this result and further research is unlikely to change the direction of the effect. This finding was consistent across all the included trials that reported on the outcome. In addition, IL‐2 increases the CD4 cell count significantly and there is no difference in the proportion of participants with undetectable viral loads (high certainty evidence). IL‐2 probably does not cause any important difference in the rates of opportunistic infections (low certainty evidence). However, it probably causes increased grade 3 or 4 adverse effects (moderate certainty evidence).
Potential biases in the review process
We conducted a comprehensive search to ensure that we identified all relevant completed or ongoing studies. There were no language or publication restrictions. We also reduced the potential bias in the conduct of this review: two review authors independently screened the search output, extracted data, and assessed the methodological certainty of each included trial.
Agreements and disagreements with other studies or reviews
The findings of this review are similar to those of a literature review by Pett 2001, which showed that IL‐2 adjunctive therapy can significantly increase the CD4 pool of HIV‐positive participants compared to ART alone, however it has no significant effect on viral load, and has an increase in adverse effects, particularly grade 4 adverse effects in some trials and an acceptable adverse effect profile in others. Pett 2010 concluded that IL‐2 adjunctive therapy confers no clinical benefit on HIV‐positive participants and has no place in the therapeutic treatment of HIV. Three trials that we included in this Cochrane Review were also included in Pett 2010 (Abrams 2009a; Abrams 2009b; Stellbrink 2002).
The findings of this Cochrane Review differ from those of a pooled meta‐analysis of three randomized controlled trials (RCTs) by Emery 2000, which showed a significant decrease in viral load in participants on IL‐2 with ART compared to ART alone. However, Emery 2000 also showed no significant increase in mortality and concluded that despite substantial improvement in CD4 cell count and viral load there was no significant improvement in clinical outcomes.

Study flow diagram
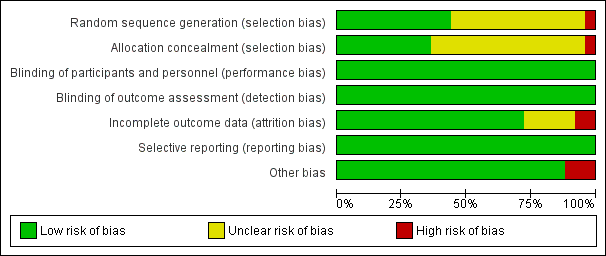
'Risk of bias' graph: review authors' judgements about each 'Risk of bias' item presented as percentages across all included trials
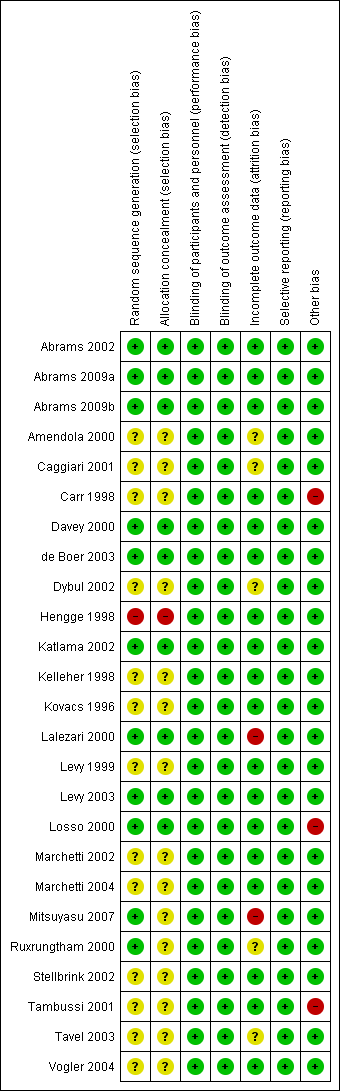
'Risk of bias' summary: review authors' judgements about each 'Risk of bias' item for each included trial


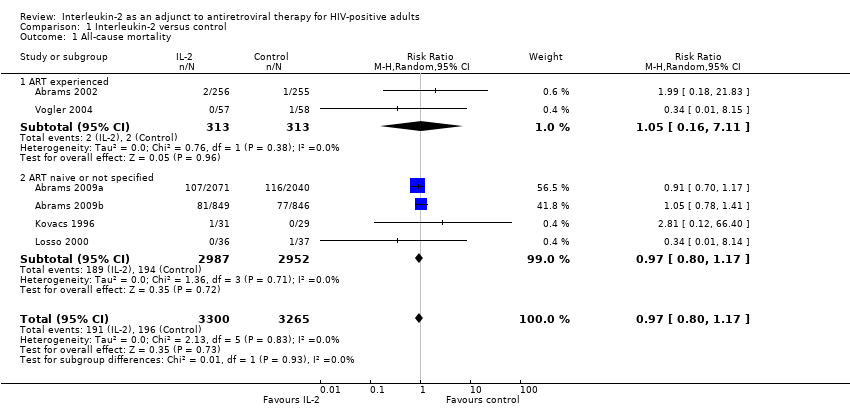
Comparison 1 Interleukin‐2 versus control, Outcome 1 All‐cause mortality.

Comparison 1 Interleukin‐2 versus control, Outcome 2 HIV RNA levels < 50 cells/mL.
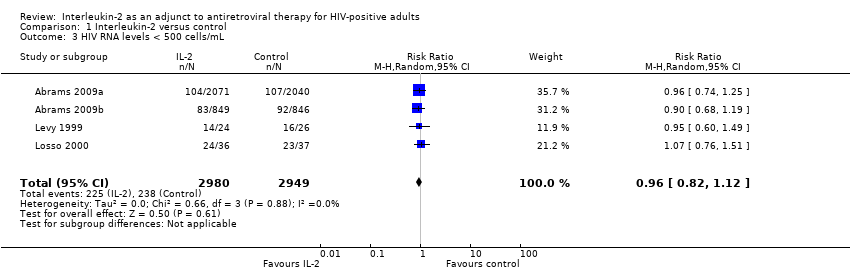
Comparison 1 Interleukin‐2 versus control, Outcome 3 HIV RNA levels < 500 cells/mL.

Comparison 1 Interleukin‐2 versus control, Outcome 4 Opportunistic infections.

Comparison 1 Interleukin‐2 versus control, Outcome 5 Adverse events (grade 3 or 4).
| Interleukin‐2 compared to control for HIV‐positive adults | ||||||
| Patient or population: HIV‐positive adults | ||||||
| Outcomes | Illustrative comparative risks* (95% CI) | Relative effect | Number of participants | Certainty of the evidence | Comments | |
| Assumed risk | Corresponding risk | |||||
| Control | IL‐2 | |||||
| All‐cause mortality | 60 per 1000 | 58 per 1000 | RR 0.97 | 6565 | ⊕⊕⊕⊕ | There is little or no effect on all cause mortality |
| CD4 cell count | Tended to increase in all but one study | 7600 (21 trials) | — | Tended to increase in all but one study | ||
| HIV RNA levels less than 50 cells/mL | 636 per 1000 | 617 per 1000 | RR 0.97 | 805 | ⊕⊕⊕⊕ | There is little or no effect on viral suppression |
| HIV RNA levels less than 500 cells/mL | 81 per 1000 | 77 per 1000 | RR 0.96 | 5929 | ⊕⊕⊕⊕ | |
| Opportunistic infections | 46 per 1000 | 39 per 1000 | RR 0.79 | 6141 | ⊕⊕⊝⊝ | There may be little or no effect on opportunistic infections |
| Adverse events (grade 3 or 4) | 197 per 1000 | 242 per 1000 | RR 1.47 | 6291 | ⊕⊕⊕⊝ | There is probably an increase in adverse events |
| *The basis for the assumed risk (for example, the median control group risk across studies) is provided in footnotes. The corresponding risk (and its 95% CI) is based on the assumed risk in the comparison group and the relative effect of the intervention (and its 95% CI). | ||||||
| GRADE Working Group grades of evidence | ||||||
| 1Downgraded by 2 for imprecision due to low event rate resulting in a wide 95% CI is wide. The overall meta‐analysis remains underpowered to confidently exclude effects. | ||||||
| Number | Trial ID | Follow‐up duration | Dosing regimen for interleukin‐2 (IL‐2) | Comparisons | Outcomes | ART experienced or naive |
| 1 | 16 months | Dose: 2 doses (4.5 and 7.5 miu) Route: subcutaneous Duration: twice daily for 5 days every 8 weeks | ART not specified | Viral load CD4 cell count | ART experienced | |
| 2 | 7 years | Dose: 4.5 miu Route: subcutaneous Duration: twice daily, 6 cycles | ART not specified | Opportunistic infections Death from any cause Adverse events | Not specified | |
| 3 | 7 years | Dose: 7.5 miu Route: subcutaneous Duration: twice daily, 3 cycles | ART not specified | Opportunistic infections Death from any cause Adverse events | Not specified | |
| 4 | 28 weeks | Dose: 1 miu Route: subcutaneous Duration: daily for 5 days/week every alternate week for 3 months | Indinavir, stavudine, and lamivudine | CD4 cell count Viral load | ART naive | |
| 5 | 12 months | Dose: 12 miu Route: intravenous Duration: for 3, 4, or 5 days every 8 weeks for 6 cycles | ART not specified | CD4 cell count Viral load Adverse events and serious adverse events AIDS defining complex | ART experienced | |
| 6 | 12 months | Dose: 6 miu Route: subcutaneous Duration: from days 1 to 5 and days 8 to 12 of a 28‐day cycle for 6 cycles | 2 nucleoside reverse transcriptase inhibitors (NRTIs) or 2 NRTIs and indinavir | CD4 cell count Viral load | ART naive | |
| 7 | 12 months | Dose: 1 miu Route: subcutaneous and intravenous Duration: Group A: 12 miu daily for 5 days every 8 weeks (27 participants) Group B: 1 miu per cycle in equal divided doses in day 1 and 3 every 8 weeks (58 participants) | Zidovudine + didanosine + zalcitabine | CD4 cell count Adverse events Viral load Opportunistic infections | ART experienced | |
| 8 | 48 weeks | Dose: 7.5 miu Route: subcutaneous Duration: 6 cycles every 12 hours for 5 days every 8 weeks | ART not specified | CD4 cell count Viral load Adverse events | ART experienced | |
| 9 | 12 months | Dose: 7.5 miu Route: subcutaneous Duration: 3 cycles for 5 days every 8 week | ART not specified | CD4 cell count Viral load | Not specified | |
| 10 | 12 months | Dose: 9.6 miu Route: subcutaneous Duration: 5 cycles were given. One cycle was given every 6 weeks over a period of 52 weeks. Treatment group A : subcutaneous administered daily in cycles consisting of 5 days. Treatment group B: subcutaneous administered at a dose of 9.6 miu daily whenever CD4 counts dropped to below 1.25 fold of individual's baseline value | Saquinavir, lamivudine, and zidovudine | CD4 cell count Viral load Opportunistic infections | ART experienced | |
| 11 | 24 weeks with outcomes measured at weeks 1, 6, 12, 18, and 24 | Dose: 4.5 miu Route: subcutaneous Duration: every 6 weeks for 4 cycles, every 12 hours for 5 days | 2 nucleoside analogues and one PI | CD4 cell count Viral load Adverse events ART experienced | Not specified | |
| 12 | 48 weeks | Dose: 12 miu Route: intravenous Duration: Group A: 12.6 miu as continuous intravenous infusions for 5 days every 8 weeks for 6 cycles. Group B (IL‐2 linked to polyethylene glycol plus ART): subcutaneous injections on days 1 and 3 of each 8‐week cycles | ART included nucleoside analogues such as lamivudine | CD4 cell count Viral load | ART experienced | |
| 13 | 14 months | Dose: 18 miu Route: intravenous Duration: daily for 5 days every other month for 6 cycles from month 0 to 10 | ART included didanosine, zidovudine, zalcitabine, or stavudine | CD4 cell count Plasma HIV RNA | Not specified | |
| 14 | 6 months | Dose: 1.2 miu, and then increased by 0.3 miu every 2 weeks for 6 months until a participant experienced grade 2 or greater toxicity. Route: subcutaneous Duration: once daily for 2 weeks | ART not specified | CD4 cell count Viral load Adverse events | ART experienced | |
| 15 | 14 months | Dose: 12 miu and 3 miu Route: 12 miu intravenous and 3 miu subcutaneous intravenously (12 miu/day, N = 22) or subcutaneously (3 miu/m² twice daily, N = 24) for 5 days, or 2 miu/m² intravenous bolus, N = 22) administered every 2 months from week 2 to week 50 (7 cycles). | Zidovudine (600 mg/day) plus didanosine (400 mg/day) | CD4 cell count Viral load Adverse events | ART naive | |
| 16 | 18 months | Dose: 5 miu Route: subcutaneous Duration: twice daily for a 5 day cycle given every 4 weeks for the first 3 cycles and then subsequently every 8 weeks for the next 7 cycles | ART included lamivudine (300 mg/day), stavudine (60 to 80mg/day) and indinavir (2400 mg/day) | CD4 cell counts Viral load AIDS defining events | ART naive or naive to PIs alone | |
| 17 | 24 weeks | Dose: escalating doses of 1.5 miu, 4.5 miu, 7.5 miu Route: subcutaneous Duration: twice daily for 5 consecutive days every 8 weeks | ART not specified | CD4 cell counts . Viral load | Both naive and experienced participants were included in the study. | |
| 18 | 48 weeks | Dose: 3 miu Route: subcutaneous Duration: administered as a single subcutaneous injection at days 1 to 5 and 8 to 12 of a 4‐week cycle, for a total of 3 cycles | ART was either 2 nucleoside reverse transcriptase inhibitor | CD4 cell count Viral load Adverse events | ART experienced | |
| 19 | 48 weeks | Dose: 3 miu Route: subcutaneous Duration: administered at day 1 to 5 and 8 to 12 for 10 weeks | ART not specified | CD4 cell count | ART experienced | |
| 20 | 84 weeks | Dose: Group A 9 miu and Group B 7.5miu Route: intravenous and subcutaneous Duration: Group A: intravenous infusions 5 days every 8 weeks. Group B: subcutaneous injections 7.5 miu twice daily for 5 days every 8 weeks | Received ART alone, 2 nucleosides and a PI | CD4 cell count Viral load | Not specified | |
| 21 | 24 weeks | Dose: Group A 1.5 miu, Group B 4.5 miu, and Group C 7.5 miu Route: subcutaneous Duration: twice daily for 5 days, every 8 weeks for three cycles 8‐weekly | ART not specified | CD4 cell count Viral load | ART experienced | |
| 22 | 601 days | Dose: 9 miu Route: subcutaneous Duration: once daily (with an option to switch to 4.5 miu twice daily) for 5 consecutive days per cycle administered at 6‐weekly intervals | ART consisting of stavudine 30 to 40 mg twice daily, and lamivudine 150 mg twice daily, nelfinavir 750 mg 3 times daily and saquinavir 600 mg 3 times daily. | CD4 cell count Viral load | ART naive | |
| 23 | 12 months | Dose: 3 regimens of IL‐2 Route: intravenous and subcutaneous Duration:differed by group see details below Group A: 12 miu by continuous intravenous infusion followed by subcutaneous 7.5 miu twice a day for 5 days every 8 weeks for the remaining 4 cycles. Group B: subcutaneous 7.5 miu twice a day for 5 days every 8 weeks for 6 cycles. Group C: subcutaneous 3 miu twice a day every 4 weeks | 2 NRTIs and saquinavir | CD4 cell count Viral load | ART experienced | |
| 24 | 12 months | Dose: 7.5 miu Route: subcutaneous Duration: Group A: 7.5 miu twice daily for 5 days versus placebo plus ART. Group B: 7.5 miu twice a day for 5 days | Nucleosides analogue reverse transcriptase inhibitor and either a non‐nucleosides analogue reverse transcriptase inhibitor or PI | CD4 cell count Viral load | ART experienced | |
| 25 | 24 weeks | Dose: 1 miu Route: subcutaneous Duration: once daily | 2 nucleoside reverse transcriptase inhibitors | CD4 cell count Viral load | ART experienced | |
| Abbreviations: ART antiretroviral therapy; IL‐2 Interleukin 2; NRTI nucleoside reverse transcriptase inhibitors; PI protease inhibitor | ||||||
| Increase in CD4 cell count with statistically significant difference | |
| (at 12 months follow‐up) n = 511 | The average difference change in CD4 cell count between the IL‐2 group and control group was 217.1 cells/mm³ (95% CI 188.6 to 245.5; P < 0.001) measured at 12 months. |
| (at 12 months follow‐up) n = 115 | Median CD4 cell count increases of 359 and 44 cells/mm³ and a decline of 46 cells/mm³ in the cyclical continuous intravenous IL‐2, subcutaneous IL‐2, and ART alone group, respectively, over 12 months (P < 0.0001 for each intergroup comparison). |
| (at 12 months follow‐up) n = 82 | The median increase in CD4 count at 12 months was 279 cells/mm³ in the IL‐2 group compared with 50 cells/mm³ in the control (P < 0.001). |
| n = 81 | The mean per cent increase in CD4 cell counts was 24.5% for IL‐2 recipients compared to a mean per cent decrease of 30.5% for control participants (P < 0.005). |
| (at 12 months follow‐up) n = 64 | The median CD4 cell counts increased from 363 to 485 (+ 33.6% standard deviation) in the IL‐2 group Group A (P < 0.01) and from 358 to 462 (+ 29.1%) in Group B (P < 0.01) and from 350 to 375 (+ 6.9% in the control group (not significant), respectively. |
| (at 24 weeks, that is 6 months follow‐up) n = 72 | The median increase in CD4 cells at week 24 was significantly higher in the IL‐2 group than in the control group (65 versus 18 cells/mm³; P < 0.0001). |
| (at 12 months follow‐up) n = 60 | There was an increase in the mean (± SE) CD4 count from 428 ± 25 cells/mm³ at baseline to 916 ± 128 in the IL‐2 group, compared to a decreased from 406 ± 29 cells/mm3 to 349 ± 41 cells/mm³ in the control group (P < 0.001). |
| (at 26 weeks follow‐up) n = 115 | The percentage increase in CD4 count from baseline of 3.59% in the IL‐2 group compared to 1.33% in the control group (P < 0.001). |
| (at 56 weeks follow‐up) n = 94 | The median increase in CD4 count from baseline at 56 weeks was 564 cells/mm³ (P > 0.0001), 105 cells/mm³ (P = 0.58), and 676 cells/mm³ (P = 0.0002) in the subcutaneous (SC), polyethylene glycol modified, and intravenous (IV) IL‐2 group respectively, compared to 55 cells/mm³ in the control group |
| (at 74 weeks follow‐up) n = 118 | The median increase in CD4 count from baseline at week was 865 cells/mm³ in the IL‐2 group compared to 262 cells/mm³ in the control group (P < 0.00001). |
| (at 24 weeks follow‐up) n = 73 | The mean increase in CD4 count from baseline at week 24 of 27 cells/mm³ (P = 0.105), 105 cells/mm³ (P = 0.006), and 492 cells/mm³ (P < 0.001) in the 1.5, 4.5, and 7.5 miu dose groups of IL‐2. Overall 14 out of 36 (41%) of the IL‐2 group and 3 out of 37 (8%) of the controls had a magnitude increase of ≥ 1000 cells/mm³. |
| (48 weeks follow‐up) n = 22 | IL‐2 treated participants had mean absolute CD4 T cell counts (S.E) significantly increase at the end of the IL‐2 treatment (week 48) from 147 (18) cells/mm³ at baseline to 298 (43.3) cells/mm³ (P=0001). The control participants also had a significant increase was observed 16 weeks 228 (29) cells/mm³ (P = 0.002). |
| (at 48 weeks follow‐up) n = 159 | Reported median increases of CD4 cell count were 459, 312, and 102 cells/mm³ in the intravenous, SC Il‐2, and control groups respectively at 48 weeks (P < 0.001 for both). |
| (at 12 months follow‐up) n = 19 | Reported a mean increase in CD4 count from baseline of 452 cells/mm3 in the IL‐2 group compared to 135 cells/mm3 in the control group (P < 0.05). |
| n = 82 | Reported an increase in the time weighted mean CD4 cell count 252 x 106 cells/mm³ over 24 weeks for the overall scIL‐2 group compared with 42 x 106 cell/mm³. |
| Increase in CD4 cell count but statistical significance not reported in the trials | |
| (at 12 months follow‐up) (at 6 years follow‐up) n = 4111 | Six trials measured at 1 year; median CD4 increase of 206 versus 21 cells/mm³ in the IL‐2 group versus the control group and reported an average median increase of 109 more in the IL‐2 group more than the control group over the entire 7 years (95% CI 40 to 60 over 6 years) |
| (at 12 months follow‐up) n = 1695 | Six trials measured at 1 year; median CD4 increase of 131 versus 32 cells/mm³ in the IL‐2 group versus the control group over 12 months and reported an average median increase of 53 more in the IL‐2 group more than the control group over the entire 7 years (95% CI 40 to 60 over 6 years) |
| Dybul 2002 (at 12 months follow‐up) n = 9 | Four participants treated with HAART plus 3 cycles of intermittent IL‐2 had an increase in median absolute CD4+ T cell count from 529 cells/mm³ (range: 502 to 738 cells/mm³) at enrolment to 1995 cells/mm³ (range: 1112 to 3064 cells/mm³; 268% increase) after 12 months of treatment (Figure 1A). Five participants treated with HAART alone had an increase in median CD4+ T cell count from 580 cells/mm³ (range: 416 to 662 cells) at enrolment to 712 cells/mm³ (range: 667 to 1160 cells/mm³; 52% increase) after 12 months of treatment |
| No significant increase in CD4 cell count | |
| (at 24 weeks) n = 115 | Mean change in CD4 count in the IL‐2 group and the control group was 40 and −1 respectively |
| n = 61 | Reports that there was a progressive increase in circulating CD4 cells, determined at the beginning of each IL‐2 cycle, was observed in all participants receiving ART plus IL‐2, in comparison with those receiving ART alone but gave the values for the within subgroup variation |
| (at 6 months follow‐up) n = 22 | No significant difference between changes in CD4 counts in both groups |
| Abbreviations: ART: antiretroviral therapy; ESPIRIT: Evaluation of Subcutaneous Proleukin in a Randomised International Trial; IL‐2: interleukin‐2; SILICAAT: subcutaneous recombinant human interleukin‐2 in HIV‐infected patients low CD4 counts under active antiretroviral therapy | |
| Outcome or subgroup title | No. of studies | No. of participants | Statistical method | Effect size |
| 1 All‐cause mortality Show forest plot | 6 | 6565 | Risk Ratio (M‐H, Random, 95% CI) | 0.97 [0.80, 1.17] |
| 1.1 ART experienced | 2 | 626 | Risk Ratio (M‐H, Random, 95% CI) | 1.05 [0.16, 7.11] |
| 1.2 ART naive or not specified | 4 | 5939 | Risk Ratio (M‐H, Random, 95% CI) | 0.97 [0.80, 1.17] |
| 2 HIV RNA levels < 50 cells/mL Show forest plot | 5 | 805 | Risk Ratio (M‐H, Random, 95% CI) | 0.97 [0.81, 1.15] |
| 3 HIV RNA levels < 500 cells/mL Show forest plot | 4 | 5929 | Risk Ratio (M‐H, Random, 95% CI) | 0.96 [0.82, 1.12] |
| 4 Opportunistic infections Show forest plot | 7 | 6141 | Risk Ratio (M‐H, Random, 95% CI) | 0.79 [0.55, 1.13] |
| 4.1 ART experienced | 2 | 97 | Risk Ratio (M‐H, Random, 95% CI) | 0.30 [0.05, 1.86] |
| 4.2 ART naive or not specified | 5 | 6044 | Risk Ratio (M‐H, Random, 95% CI) | 0.81 [0.56, 1.19] |
| 5 Adverse events (grade 3 or 4) Show forest plot | 6 | 6291 | Risk Ratio (M‐H, Random, 95% CI) | 1.47 [1.10, 1.96] |