| 1 Pain Show forest plot | 21 | 1453 | Std. Mean Difference (IV, Random, 95% CI) | ‐0.29 [‐0.47, ‐0.11] |
|
| 1.1 Traditional cognitive behavioural therapy | 18 | 1150 | Std. Mean Difference (IV, Random, 95% CI) | ‐0.30 [‐0.44, ‐0.15] |
| 1.2 Operant therapy | 2 | 123 | Std. Mean Difference (IV, Random, 95% CI) | ‐0.67 [‐2.56, 1.23] |
| 1.3 Self‐management | 2 | 180 | Std. Mean Difference (IV, Random, 95% CI) | 0.02 [‐0.81, 0.84] |
| 2 Negative mood Show forest plot | 19 | 1649 | Std. Mean Difference (IV, Random, 95% CI) | ‐0.33 [‐0.49, ‐0.17] |
|
| 2.1 Traditional cognitive‐behavioural therapy | 15 | 1010 | Std. Mean Difference (IV, Random, 95% CI) | ‐0.34 [‐0.48, ‐0.19] |
| 2.2 Operant therapy | 2 | 124 | Std. Mean Difference (IV, Random, 95% CI) | ‐0.90 [‐2.21, 0.42] |
| 2.3 Self‐management education | 3 | 515 | Std. Mean Difference (IV, Random, 95% CI) | ‐0.10 [‐0.27, 0.07] |
| 3 Disability Show forest plot | 16 | 1234 | Std. Mean Difference (IV, Random, 95% CI) | ‐0.30 [‐0.51, ‐0.08] |
|
| 3.1 Traditional cognitive‐behavioural therapy | 13 | 931 | Std. Mean Difference (IV, Random, 95% CI) | ‐0.31 [‐0.45, ‐0.18] |
| 3.2 Operant therapy | 2 | 123 | Std. Mean Difference (IV, Random, 95% CI) | ‐0.88 [‐3.10, 1.33] |
| 3.3 Self‐management education | 2 | 180 | Std. Mean Difference (IV, Random, 95% CI) | 0.07 [‐0.60, 0.74] |
| 4 Self‐efficacy pain Show forest plot | 11 | 1047 | Std. Mean Difference (IV, Random, 95% CI) | ‐0.49 [‐0.80, ‐0.17] |
|
| 4.1 Traditional cognitive‐behavioural therapy | 9 | 589 | Std. Mean Difference (IV, Random, 95% CI) | ‐0.39 [‐0.72, ‐0.05] |
| 4.2 Operant therapy | 2 | 123 | Std. Mean Difference (IV, Random, 95% CI) | ‐1.18 [‐3.01, 0.64] |
| 4.3 Self‐management education | 1 | 335 | Std. Mean Difference (IV, Random, 95% CI) | ‐0.18 [‐0.39, 0.04] |
| 5 Acceptability Show forest plot | 21 | 1914 | Risk Ratio (M‐H, Random, 95% CI) | 0.94 [0.65, 1.35] |
|
| 5.1 Traditional cognitive‐behavioural therapy | 17 | 1169 | Risk Ratio (M‐H, Random, 95% CI) | 0.98 [0.65, 1.46] |
| 5.2 Operant therapy | 2 | 126 | Risk Ratio (M‐H, Random, 95% CI) | 0.43 [0.03, 7.34] |
| 5.3 Self‐management education | 3 | 619 | Risk Ratio (M‐H, Random, 95% CI) | 1.33 [0.81, 2.19] |
| 6 Fatigue Show forest plot | 11 | 910 | Std. Mean Difference (IV, Random, 95% CI) | ‐0.25 [‐0.49, ‐0.02] |
|
| 6.1 Traditional cognitive‐behavioural therapy | 9 | 667 | Std. Mean Difference (IV, Random, 95% CI) | ‐0.38 [‐0.65, ‐0.10] |
| 6.2 Operant therapy | 1 | 63 | Std. Mean Difference (IV, Random, 95% CI) | 0.09 [‐0.44, 0.62] |
| 6.3 Self‐management education | 2 | 180 | Std. Mean Difference (IV, Random, 95% CI) | 0.04 [‐0.33, 0.40] |
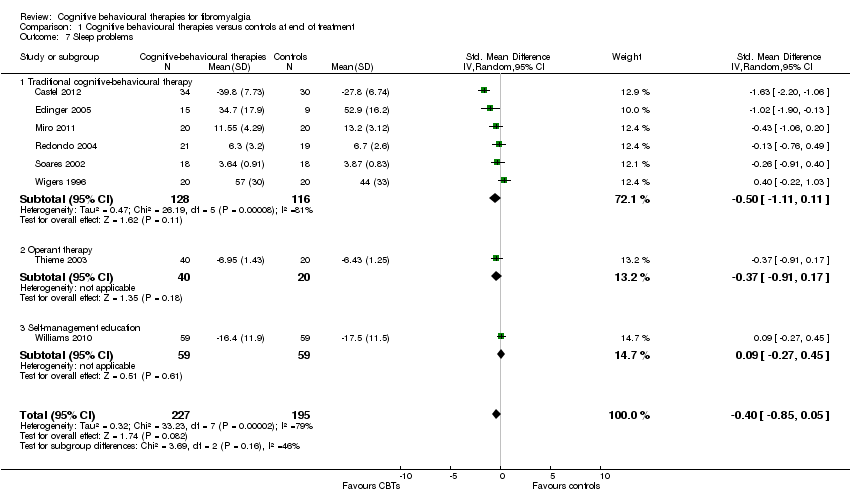
| 7 Sleep problems Show forest plot | 8 | 422 | Std. Mean Difference (IV, Random, 95% CI) | ‐0.40 [‐0.85, 0.05] |
|
| 7.1 Traditional cognitive‐behavioural therapy | 6 | 244 | Std. Mean Difference (IV, Random, 95% CI) | ‐0.50 [‐1.11, 0.11] |
| 7.2 Operant therapy | 1 | 60 | Std. Mean Difference (IV, Random, 95% CI) | ‐0.37 [‐0.91, 0.17] |
| 7.3 Self‐management education | 1 | 118 | Std. Mean Difference (IV, Random, 95% CI) | 0.09 [‐0.27, 0.45] |
| 8 Health‐related quality of life Show forest plot | 13 | 1238 | Std. Mean Difference (IV, Random, 95% CI) | ‐0.23 [‐0.38, ‐0.08] |
|
| 8.1 Traditional cognitive‐behavioural therapy | 11 | 778 | Std. Mean Difference (IV, Random, 95% CI) | ‐0.34 [‐0.49, ‐0.18] |
| 8.2 Operant therapy | 1 | 63 | Std. Mean Difference (IV, Random, 95% CI) | 0.19 [‐0.34, 0.72] |
| 8.3 Self‐management education | 2 | 397 | Std. Mean Difference (IV, Random, 95% CI) | ‐0.01 [‐0.36, 0.33] |