Méthodes de déclenchement d’accouchement à terme pour les femmes ayant précédemment accouché par césarienne
Información
- DOI:
- https://doi.org/10.1002/14651858.CD009792.pub3Copiar DOI

- Base de datos:
-
- Cochrane Database of Systematic Reviews
- Versión publicada:
-
- 09 junio 2017see what's new
- Tipo:
-
- Intervention
- Etapa:
-
- Review
- Grupo Editorial Cochrane:
-
Grupo Cochrane de Embarazo y parto
- Copyright:
-
- Copyright © 2017 The Cochrane Collaboration. Published by John Wiley & Sons, Ltd.
Cifras del artículo
Altmetric:
Citado por:
Autores
Contributions of authors
For the review update, Helen West and Marta Jozwiak assessed study eligibility, methodological quality, and performed data extraction. Helen West entered the data, conducted the GRADE assessment, produced the 'Summary of findings' tables, and drafted the review update. Jodie Dodd checked the data and commented on the review.
Sources of support
Internal sources
-
(HW) Cochrane Pregnancy and Childbirth Group, Department of Women's and Children's Health, The University of Liverpool, Liverpool, UK.
External sources
-
The University of Adelaide, Discipline of Obstetrics and Gynaecology, Australia.
-
The Australian National Health and Medical Research Council Practitioner Fellowship, Australia.
-
(HW) NIHR Cochrane Programme Grant Project: 13/89/05 – Pregnancy and childbirth systematic reviews to support clinical guidelines, UK.
Declarations of interest
Jodie Dodd: none known.
Marta Jozwiak was involved in two RCTs on the topic of induction of labour but these are not eligible for inclusion in this review (the participants had not had a previous caesarean section). She was also involved in an observational study looking at induction of labour in women with a caesarean section (PROBAAT‐S study) – this study has not yet been published but would not be eligible for inclusion in this review as it is not a randomised controlled trial.
Helen West's contribution to this project was supported by the National Institute for Health Research, via Cochrane Programme Grant funding to Cochrane Pregnancy and Childbirth. NIHR has no influence on the content or conclusions of this review.
Acknowledgements
Helen West is supported by the National Institute for Health Research (NIHR) Cochrane Programme Grant Project: 13/89/05 – Pregnancy and childbirth systematic reviews to support clinical guidelines.
Anna Cuthbert for data extraction; Denise Atherton for administrative assistance; Lynn Hampson for the literature search.
This project was supported by the National Institute for Health Research, via Cochrane Infrastructure and Cochrane Programme Grant funding to Cochrane Pregnancy and Childbirth. The views and opinions expressed therein are those of the authors and do not necessarily reflect those of the Systematic Reviews Programme, NIHR, NHS or the Department of Health.
Version history
| Published | Title | Stage | Authors | Version |
| 2017 Jun 09 | Methods of term labour induction for women with a previous caesarean section | Review | Helen M West, Marta Jozwiak, Jodie M Dodd | |
| 2013 Mar 28 | Methods of term labour induction for women with a previous caesarean section | Review | Marta Jozwiak, Jodie M Dodd | |
| 2012 Apr 18 | Methods of term labour induction for women with a previous caesarean section | Protocol | Marta Jozwiak, Jodie M Dodd | |
Differences between protocol and review
We have updated our methods to include the use of GRADE to assess the quality of the body of evidence and we have included 'Summary of findings' tables.
Trials using a cluster‐RCT design are now eligible for inclusion in this review (and we include methods for dealing with them) but none were identified for this update. We also include methods for dealing with trials that have multiple‐arms.
Keywords
MeSH
Medical Subject Headings (MeSH) Keywords
- *Vaginal Birth after Cesarean;
- Dinoprostone [administration & dosage];
- Early Termination of Clinical Trials;
- Labor, Induced [*methods];
- Misoprostol [administration & dosage];
- Oxytocics [*administration & dosage];
- Oxytocin [administration & dosage];
- Randomized Controlled Trials as Topic;
- Uterine Rupture [etiology];
Medical Subject Headings Check Words
Female; Humans; Pregnancy;
PICO

Study flow diagram

Risk of bias graph: review authors' judgements about each risk of bias item presented as percentages across all included studies
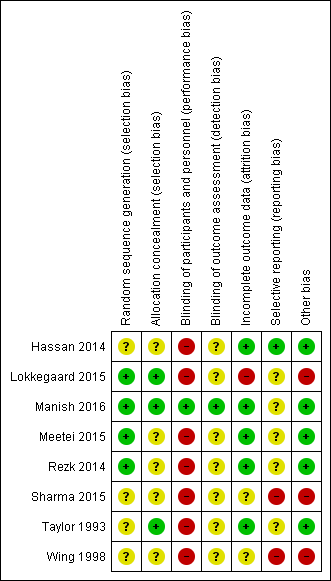
Risk of bias summary: review authors' judgements about each risk of bias item for each included study
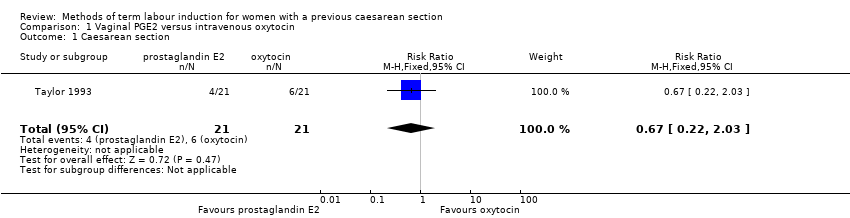
Comparison 1 Vaginal PGE2 versus intravenous oxytocin, Outcome 1 Caesarean section.

Comparison 1 Vaginal PGE2 versus intravenous oxytocin, Outcome 2 Serious neonatal morbidity or perinatal death.

Comparison 1 Vaginal PGE2 versus intravenous oxytocin, Outcome 3 Serious maternal morbidity or death.

Comparison 1 Vaginal PGE2 versus intravenous oxytocin, Outcome 4 Uterine rupture.

Comparison 1 Vaginal PGE2 versus intravenous oxytocin, Outcome 5 Epidural analgesia.

Comparison 1 Vaginal PGE2 versus intravenous oxytocin, Outcome 6 Instrumental vaginal delivery.

Comparison 1 Vaginal PGE2 versus intravenous oxytocin, Outcome 7 Apgar score < 7 at 5 minutes.

Comparison 2 Vaginal misoprostol versus intravenous oxytocin, Outcome 1 Uterine rupture.

Comparison 3 Foley catheter versus intravenous oxytocin, Outcome 1 Vaginal delivery not achieved within 24 hours.

Comparison 3 Foley catheter versus intravenous oxytocin, Outcome 2 Uterine hyperstimulation with FHR changes.

Comparison 3 Foley catheter versus intravenous oxytocin, Outcome 3 Caesarean section.

Comparison 3 Foley catheter versus intravenous oxytocin, Outcome 4 Oxytocin augmentation.

Comparison 3 Foley catheter versus intravenous oxytocin, Outcome 5 Uterine rupture.

Comparison 3 Foley catheter versus intravenous oxytocin, Outcome 6 Instrumental vaginal delivery.

Comparison 3 Foley catheter versus intravenous oxytocin, Outcome 7 Postpartum haemorrhage.

Comparison 3 Foley catheter versus intravenous oxytocin, Outcome 8 Chorioamnionitis.

Comparison 4 Double‐balloon catheter versus vaginal PGE2, Outcome 1 Caesarean section.

Comparison 4 Double‐balloon catheter versus vaginal PGE2, Outcome 2 Admission to neonatal unit.

Comparison 5 Oral mifepristone versus Foley catheter, Outcome 1 Oxytocin augmentation.

Comparison 5 Oral mifepristone versus Foley catheter, Outcome 2 Uterine rupture.

Comparison 6 Vaginal isosorbide mononitrate versus Foley catheter, Outcome 1 Vaginal delivery not achieved within 24 hours.

Comparison 6 Vaginal isosorbide mononitrate versus Foley catheter, Outcome 2 Caesarean section.

Comparison 6 Vaginal isosorbide mononitrate versus Foley catheter, Outcome 3 Oxytocin augmentation.
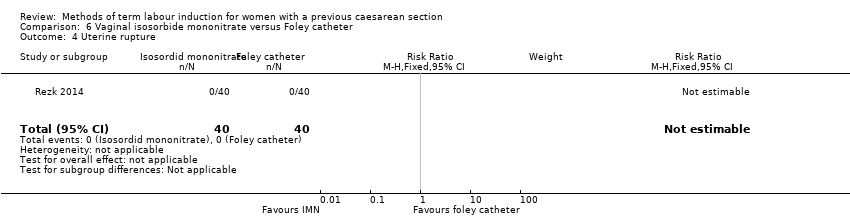
Comparison 6 Vaginal isosorbide mononitrate versus Foley catheter, Outcome 4 Uterine rupture.

Comparison 6 Vaginal isosorbide mononitrate versus Foley catheter, Outcome 5 Epidural analgesia.

Comparison 6 Vaginal isosorbide mononitrate versus Foley catheter, Outcome 6 Instrumental vaginal delivery.

Comparison 6 Vaginal isosorbide mononitrate versus Foley catheter, Outcome 7 Meconium‐stained liquor.

Comparison 6 Vaginal isosorbide mononitrate versus Foley catheter, Outcome 8 Apgar score < 7 at 5 minutes.
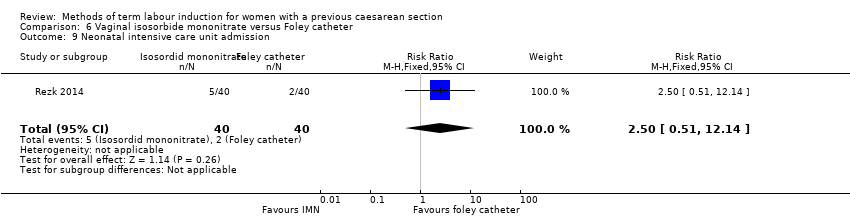
Comparison 6 Vaginal isosorbide mononitrate versus Foley catheter, Outcome 9 Neonatal intensive care unit admission.

Comparison 6 Vaginal isosorbide mononitrate versus Foley catheter, Outcome 10 Maternal nausea and vomiting.

Comparison 6 Vaginal isosorbide mononitrate versus Foley catheter, Outcome 11 Puerperal pyrexia (other maternal side‐effects).
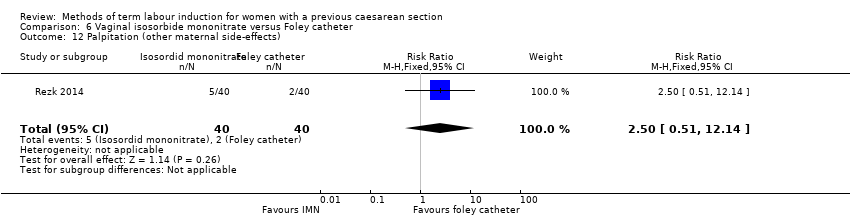
Comparison 6 Vaginal isosorbide mononitrate versus Foley catheter, Outcome 12 Palpitation (other maternal side‐effects).

Comparison 6 Vaginal isosorbide mononitrate versus Foley catheter, Outcome 13 Headache (other maternal side‐effects).

Comparison 6 Vaginal isosorbide mononitrate versus Foley catheter, Outcome 14 Postpartum haemorrhage.

Comparison 6 Vaginal isosorbide mononitrate versus Foley catheter, Outcome 15 Woman not satisfied.

Comparison 7 Foley catheter 80 mL versus Foley catheter 30 mL, Outcome 1 Vaginal delivery not achieved within 24 hours.

Comparison 7 Foley catheter 80 mL versus Foley catheter 30 mL, Outcome 2 Caesarean section.

Comparison 7 Foley catheter 80 mL versus Foley catheter 30 mL, Outcome 3 Oxytocin augmentation.

Comparison 7 Foley catheter 80 mL versus Foley catheter 30 mL, Outcome 4 Uterine rupture.

Comparison 7 Foley catheter 80 mL versus Foley catheter 30 mL, Outcome 5 Epidural analgesia.

Comparison 7 Foley catheter 80 mL versus Foley catheter 30 mL, Outcome 6 Instrumental vaginal delivery.

Comparison 7 Foley catheter 80 mL versus Foley catheter 30 mL, Outcome 7 Apgar score < 7 at 5 minutes.

Comparison 7 Foley catheter 80 mL versus Foley catheter 30 mL, Outcome 8 Neonatal intensive care unit admission.

Comparison 7 Foley catheter 80 mL versus Foley catheter 30 mL, Outcome 9 Neonatal encephalopathy.

Comparison 7 Foley catheter 80 mL versus Foley catheter 30 mL, Outcome 10 Perinatal death.

Comparison 7 Foley catheter 80 mL versus Foley catheter 30 mL, Outcome 11 Neonatal infection.

Comparison 7 Foley catheter 80 mL versus Foley catheter 30 mL, Outcome 12 Cord prolapse (other maternal side‐effects).

Comparison 7 Foley catheter 80 mL versus Foley catheter 30 mL, Outcome 13 Postpartum haemorrhage.

Comparison 7 Foley catheter 80 mL versus Foley catheter 30 mL, Outcome 14 Chorioamnionitis.

Comparison 8 Vaginal PGE2 pessary versus vaginal PGE2 tablet, Outcome 1 Caesarean section.
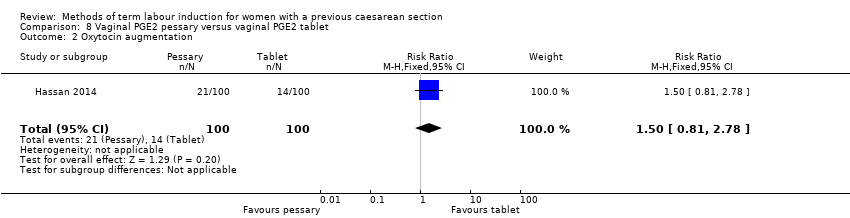
Comparison 8 Vaginal PGE2 pessary versus vaginal PGE2 tablet, Outcome 2 Oxytocin augmentation.

Comparison 8 Vaginal PGE2 pessary versus vaginal PGE2 tablet, Outcome 3 Uterine hyperstimulation (FHR change not mentioned).

Comparison 8 Vaginal PGE2 pessary versus vaginal PGE2 tablet, Outcome 4 Uterine rupture.

Comparison 8 Vaginal PGE2 pessary versus vaginal PGE2 tablet, Outcome 5 Apgar score < 7 at 5 minutes.

Comparison 8 Vaginal PGE2 pessary versus vaginal PGE2 tablet, Outcome 6 Neonatal intensive care unit admission.
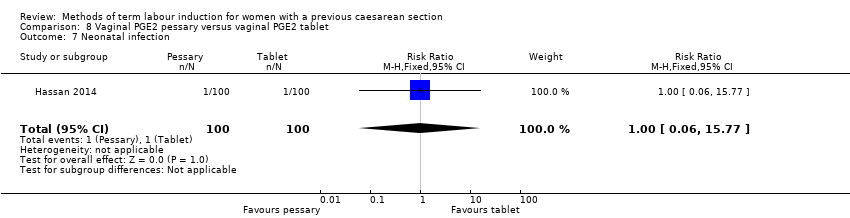
Comparison 8 Vaginal PGE2 pessary versus vaginal PGE2 tablet, Outcome 7 Neonatal infection.
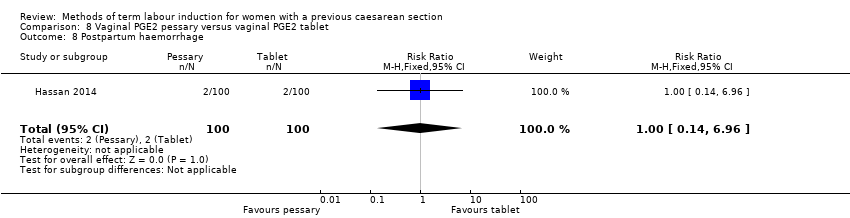
Comparison 8 Vaginal PGE2 pessary versus vaginal PGE2 tablet, Outcome 8 Postpartum haemorrhage.

Comparison 8 Vaginal PGE2 pessary versus vaginal PGE2 tablet, Outcome 9 Chorioamnionitis.

Comparison 8 Vaginal PGE2 pessary versus vaginal PGE2 tablet, Outcome 10 Endometritis.

Comparison 8 Vaginal PGE2 pessary versus vaginal PGE2 tablet, Outcome 11 Maternal intensive care unit admission (serious maternal complications).
| Vaginal PGE2 compared with IV oxytocin for term labour induction for women with a previous caesarean section | ||||||
| Patient or population: women with one previous lower segment caesarean section and requiring labour induction due to prolonged pregnancy or pre‐eclampsia, singleton in cephalic presentation, GA ≥ 37 weeks, BS < 9, no cephalopelvic disproportion anticipated | ||||||
| Outcomes | Anticipated absolute effects* (95% CI) | Relative effect | № of participants | Quality of the evidence | Comments | |
| Risk with oxytocin | Risk with prostaglandin E2 | |||||
| Vaginal delivery not achieved within 24 hours | ‐ | ‐ | ‐ | ‐ | ‐ | Not reported |
| Uterine hyperstimulation with fetal heart rate changes | ‐ | ‐ | ‐ | ‐ | ‐ | Not reported |
| Caesarean section | Study population | RR 0.67 | 42 | ⊕⊕⊝⊝ | ||
| 286 per 1000 | 191 per 1000 | |||||
| Serious neonatal morbidity/perinatal death | Study population | RR 3.00 | 42 | ⊕⊕⊝⊝ | ||
| 0 per 1000 | 0 per 1000 | |||||
| Serious maternal morbidity or death | Study population | RR 3.00 | 42 | ⊕⊕⊝⊝ | ||
| 0 per 1000 | 0 per 1000 | |||||
| *The risk in the intervention group (and its 95% confidence interval) is based on the assumed risk in the comparison group and the relative effect of the intervention (and its 95% CI). | ||||||
| GRADE Working Group grades of evidence | ||||||
| 1Wide CI crossing the line of no effect, small sample size, and few events (imprecision, downgraded 2 levels). | ||||||
| Vaginal misoprostol compared with IV oxytocin for term labour induction for women with a previous caesarean section | ||||||
| Patient or population: women with a previous caesarean section | ||||||
| Outcomes | Anticipated absolute effects* (95% CI) | Relative effect | № of participants | Quality of the evidence | Comments | |
| Risk with misoprostol | Risk with oxytocin | |||||
| Vaginal delivery not achieved within 24 hours | not reported | |||||
| Uterine hyperstimulation with fetal heart rate changes | not reported | |||||
| Caesarean section | not reported | |||||
| Serious neonatal morbidity or perinatal death | not reported | |||||
| Serious maternal morbidity or death | not reported | |||||
| *The risk in the intervention group (and its 95% confidence interval) is based on the assumed risk in the comparison group and the relative effect of the intervention (and its 95% CI). | ||||||
| GRADE Working Group grades of evidence | ||||||
| Foley catheter compared with IV oxytocin for term labour induction for women with a previous caesarean section | ||||||
| Patient or population: pregnant women with a previous low transverse caesarean section, singleton live pregnancy with cephalic presentation, period of gestation > 28 weeks and BS < 5 were included in the study, with unfavourable cervix | ||||||
| Outcomes | Anticipated absolute effects* (95% CI) | Relative effect | № of participants | Quality of the evidence | Comments | |
| Risk with oxytocin | Risk with Foley catheter | |||||
| Vaginal delivery not achieved within 24 hours | Study population | RR 1.47 | 53 | ⊕⊕⊝⊝ | ||
| 444 per 1000 | 653 per 1000 | |||||
| Uterine hyperstimulation with fetal heart rate changes | Study population | RR 3.11 | 53 | ⊕⊕⊝⊝ | ||
| 0 per 1000 | 0 per 1000 | |||||
| Caesarean section | Study population | RR 0.93 | 53 | ⊕⊕⊝⊝ | ||
| 370 per 1000 | 344 per 1000 | |||||
| Serious neonatal morbidity or perinatal death | ‐ | ‐ | ‐ | ‐ | ‐ | Not reported |
| Serious maternal morbidity or death | ‐ | ‐ | ‐ | ‐ | ‐ | Not reported |
| *The risk in the intervention group (and its 95% confidence interval) is based on the assumed risk in the comparison group and the relative effect of the intervention (and its 95% CI). | ||||||
| GRADE Working Group grades of evidence | ||||||
| 1Wide confidence interval crossing the line of no effect, small sample size, and few events (imprecision, downgraded 2 levels). | ||||||
| Double‐balloon catheter compared with vaginal PGE2 for term labour induction for women with a previous caesarean section | ||||||
| Patient or population: women with a previous caesarean section (subgroup of all women in the study) with intact fetal membranes, cephalic position and unfavourable cervix, with indications for induction of labour Intervention: double‐balloon catheter inserted through the cervical canal with 80 mL of saline installed stepwise in the uterine balloon and 80 mL saline in the cervicovaginal balloon | ||||||
| Outcomes | Anticipated absolute effects* (95% CI) | Relative effect | № of participants | Quality of the evidence | Comments | |
| Risk with prostaglandin E2 | Risk with double‐balloon catheter | |||||
| Vaginal delivery not achieved within 24 hours | ‐ | ‐ | ‐ | ‐ | ‐ | Not reported |
| Uterine hyperstimulation with fetal heart rate changes | ‐ | ‐ | ‐ | ‐ | ‐ | Not reported |
| Caesarean section | Study population | RR 0.97 | 16 | ⊕⊝⊝⊝ | ||
| 571 per 1000 | 554 per 1000 | |||||
| Serious neonatal morbidity or perinatal death | ‐ | ‐ | ‐ | ‐ | ‐ | Not reported |
| Serious maternal morbidity or death | ‐ | ‐ | ‐ | ‐ | ‐ | Not reported |
| *The risk in the intervention group (and its 95% confidence interval) is based on the assumed risk in the comparison group and the relative effect of the intervention (and its 95% CI). | ||||||
| GRADE Working Group grades of evidence | ||||||
| 1One study with design limitations (risk of bias, downgraded 1 level). | ||||||
| Oral mifepristone compared with Foley catheter for term labour induction for women with a previous caesarean section | ||||||
| Patient or population: pregnant women, 40 weeks' gestation, single cephalic presentation, 1 previous low segment caesarean section | ||||||
| Outcomes | Anticipated absolute effects* (95% CI) | Relative effect | № of participants | Quality of the evidence | Comments | |
| Risk with mifepristone | Risk with Foley catheter | |||||
| Vaginal delivery not achieved within 24 hours | not reported | |||||
| Uterine hyperstimulation with fetal heart rate changes | not reported | |||||
| Caesarean section | not reported | |||||
| Serious neonatal morbidity or perinatal death | not reported | |||||
| Serious maternal morbidity or death | not reported | |||||
| *The risk in the intervention group (and its 95% confidence interval) is based on the assumed risk in the comparison group and the relative effect of the intervention (and its 95% CI). | ||||||
| GRADE Working Group grades of evidence | ||||||
| Vaginal isosorbide mononitrate versus Foley catheter for term labour induction for women with a previous caesarean section | ||||||
| Patient or population: pregnant women with 1 previous lower segment caesarean section at 37 weeks and beyond, with a BS of ≤ 6, intact membranes, reactive non‐stress test, normal umbilical arterial Doppler indices, absence of labour and willingness of women to participate in the study | ||||||
| Outcomes | Anticipated absolute effects* (95% CI) | Relative effect | № of participants | Quality of the evidence | Comments | |
| Risk with Foley catheter | Risk with isosorbide mononitrate | |||||
| Vaginal delivery not achieved within 24 hours | Study population | RR 2.63 | 80 | ⊕⊕⊝⊝ | ||
| 200 per 1000 | 526 per 1000 | |||||
| Uterine hyperstimulation with fetal heart rate changes | ‐ | ‐ | ‐ | ‐ | ‐ | Not reported |
| Caesarean section | Study population | RR 1.00 | 80 | ⊕⊝⊝⊝ | ||
| 175 per 1000 | 175 per 1000 | |||||
| Serious neonatal morbidity or perinatal death | ‐ | ‐ | ‐ | ‐ | ‐ | Not reported |
| Serious maternal morbidity or death | ‐ | ‐ | ‐ | ‐ | ‐ | Not reported |
| *The risk in the intervention group (and its 95% confidence interval) is based on the assumed risk in the comparison group and the relative effect of the intervention (and its 95% CI). | ||||||
| GRADE Working Group grades of evidence | ||||||
| 1 One study with design limitations (risk of bias, downgraded 1 level). | ||||||
| 80 mL Foley catheter versus 30 mL Foley catheter for term labour induction for women with a previous caesarean section | ||||||
| Patient or population: pregnant women who previously had a lower segment CS and now have a singleton cephalic presentation after at least 36 completed weeks, not in labour, with intact membranes and BS of < 6 | ||||||
| Outcomes | Anticipated absolute effects* (95% CI) | Relative effect | № of participants | Quality of the evidence | Comments | |
| Risk with 30 mL Foley catheter | Risk with 80 mL Foley catheter | |||||
| Vaginal delivery not achieved within 24 hours | Study population | RR 1.05 | 154 | ⊕⊕⊕⊝ | ||
| 818 per 1000 | 859 per 1000 | |||||
| Uterine hyperstimulation with fetal heart rate changes | ‐ | ‐ | ‐ | ‐ | ‐ | Not reported |
| Caesarean section | Study population | RR 1.05 | 154 | ⊕⊕⊕⊝ | ||
| 766 per 1000 | 805 per 1000 | |||||
| Serious neonatal morbidity or perinatal death | ‐ | ‐ | ‐ | ‐ | ‐ | Not reported |
| Serious maternal morbidity or death | ‐ | ‐ | ‐ | ‐ | ‐ | Not reported |
| *The risk in the intervention group (and its 95% confidence interval) is based on the assumed risk in the comparison group and the relative effect of the intervention (and its 95% CI). | ||||||
| GRADE Working Group grades of evidence | ||||||
| 1Small sample size (imprecision, downgraded 1 level). | ||||||
| Vaginal PGE2 pessary versus vaginal PGE2 tablet for term labour induction for women with a previous caesarean section | ||||||
| Patient or population: women with a previous caesarean section, a live singleton fetus (37‐42 weeks of gestation) in cephalic presentation and a reactive non‐stress test, BS of ≤ 7 before onset of labour, no spontaneous contractions (< 4 contractions within 20 minutes) | ||||||
| Outcomes | Anticipated absolute effects* (95% CI) | Relative effect | № of participants | Quality of the evidence | Comments | |
| Risk with dinoprostone tablet | Risk with dinoprostone pessary | |||||
| Vaginal delivery not achieved within 24 hours | ‐ | ‐ | ‐ | ‐ | ‐ | Not reported |
| Uterine hyperstimulation with fetal heart rate changes | ‐ | ‐ | ‐ | ‐ | ‐ | Not reported |
| Caesarean section | Study population | RR 1.09 | 200 | ⊕⊝⊝⊝ | ||
| 330 per 1000 | 360 per 1000 | |||||
| Serious neonatal morbidity or perinatal death | ‐ | ‐ | ‐ | ‐ | ‐ | Not reported |
| Serious maternal morbidity or death | ‐ | ‐ | ‐ | ‐ | ‐ | Not reported |
| *The risk in the intervention group (and its 95% confidence interval) is based on the assumed risk in the comparison group and the relative effect of the intervention (and its 95% CI). | ||||||
| GRADE Working Group grades of evidence | ||||||
| 1One study with design limitations (risk of bias, downgraded 1 level). | ||||||
| Outcome or subgroup title | No. of studies | No. of participants | Statistical method | Effect size |
| 1 Caesarean section Show forest plot | 1 | 42 | Risk Ratio (M‐H, Fixed, 95% CI) | 0.67 [0.22, 2.03] |
| 2 Serious neonatal morbidity or perinatal death Show forest plot | 1 | 42 | Risk Ratio (M‐H, Fixed, 95% CI) | 3.0 [0.13, 69.70] |
| 3 Serious maternal morbidity or death Show forest plot | 1 | 42 | Risk Ratio (M‐H, Fixed, 95% CI) | 3.0 [0.13, 69.70] |
| 4 Uterine rupture Show forest plot | 1 | 42 | Risk Ratio (M‐H, Fixed, 95% CI) | 3.0 [0.13, 69.70] |
| 5 Epidural analgesia Show forest plot | 1 | 42 | Risk Ratio (M‐H, Fixed, 95% CI) | 1.42 [0.93, 2.17] |
| 6 Instrumental vaginal delivery Show forest plot | 1 | 42 | Risk Ratio (M‐H, Fixed, 95% CI) | 1.25 [0.39, 4.02] |
| 7 Apgar score < 7 at 5 minutes Show forest plot | 1 | 42 | Risk Ratio (M‐H, Fixed, 95% CI) | 0.0 [0.0, 0.0] |
| Outcome or subgroup title | No. of studies | No. of participants | Statistical method | Effect size |
| 1 Uterine rupture Show forest plot | 1 | 38 | Risk Ratio (M‐H, Fixed, 95% CI) | 3.67 [0.16, 84.66] |
| Outcome or subgroup title | No. of studies | No. of participants | Statistical method | Effect size |
| 1 Vaginal delivery not achieved within 24 hours Show forest plot | 1 | 53 | Risk Ratio (M‐H, Fixed, 95% CI) | 1.47 [0.89, 2.44] |
| 2 Uterine hyperstimulation with FHR changes Show forest plot | 1 | 53 | Risk Ratio (M‐H, Fixed, 95% CI) | 3.11 [0.13, 73.09] |
| 3 Caesarean section Show forest plot | 1 | 53 | Risk Ratio (M‐H, Fixed, 95% CI) | 0.93 [0.45, 1.92] |
| 4 Oxytocin augmentation Show forest plot | 1 | 53 | Risk Ratio (M‐H, Fixed, 95% CI) | 1.04 [0.81, 1.32] |
| 5 Uterine rupture Show forest plot | 1 | 53 | Risk Ratio (M‐H, Fixed, 95% CI) | 0.0 [0.0, 0.0] |
| 6 Instrumental vaginal delivery Show forest plot | 1 | 53 | Risk Ratio (M‐H, Fixed, 95% CI) | 7.26 [0.39, 134.01] |
| 7 Postpartum haemorrhage Show forest plot | 1 | 53 | Risk Ratio (M‐H, Fixed, 95% CI) | 3.11 [0.13, 73.09] |
| 8 Chorioamnionitis Show forest plot | 1 | 53 | Risk Ratio (M‐H, Fixed, 95% CI) | 0.0 [0.0, 0.0] |
| Outcome or subgroup title | No. of studies | No. of participants | Statistical method | Effect size |
| 1 Caesarean section Show forest plot | 1 | 16 | Risk Ratio (M‐H, Fixed, 95% CI) | 0.97 [0.41, 2.32] |
| 2 Admission to neonatal unit Show forest plot | 1 | 20 | Risk Ratio (M‐H, Fixed, 95% CI) | 0.0 [0.0, 0.0] |
| Outcome or subgroup title | No. of studies | No. of participants | Statistical method | Effect size |
| 1 Oxytocin augmentation Show forest plot | 1 | 107 | Risk Ratio (M‐H, Fixed, 95% CI) | 0.54 [0.38, 0.76] |
| 2 Uterine rupture Show forest plot | 1 | 107 | Risk Ratio (M‐H, Fixed, 95% CI) | 0.29 [0.08, 1.02] |
| Outcome or subgroup title | No. of studies | No. of participants | Statistical method | Effect size |
| 1 Vaginal delivery not achieved within 24 hours Show forest plot | 1 | 80 | Risk Ratio (M‐H, Fixed, 95% CI) | 2.63 [1.32, 5.21] |
| 2 Caesarean section Show forest plot | 1 | 80 | Risk Ratio (M‐H, Fixed, 95% CI) | 1.0 [0.39, 2.59] |
| 3 Oxytocin augmentation Show forest plot | 1 | 80 | Risk Ratio (M‐H, Fixed, 95% CI) | 1.65 [1.17, 2.32] |
| 4 Uterine rupture Show forest plot | 1 | 80 | Risk Ratio (M‐H, Fixed, 95% CI) | 0.0 [0.0, 0.0] |
| 5 Epidural analgesia Show forest plot | 1 | 80 | Risk Ratio (M‐H, Fixed, 95% CI) | 1.0 [0.39, 2.59] |
| 6 Instrumental vaginal delivery Show forest plot | 1 | 80 | Risk Ratio (M‐H, Fixed, 95% CI) | 0.8 [0.23, 2.76] |
| 7 Meconium‐stained liquor Show forest plot | 1 | 80 | Risk Ratio (M‐H, Fixed, 95% CI) | 2.0 [0.19, 21.18] |
| 8 Apgar score < 7 at 5 minutes Show forest plot | 1 | 80 | Risk Ratio (M‐H, Fixed, 95% CI) | 1.67 [0.95, 2.93] |
| 9 Neonatal intensive care unit admission Show forest plot | 1 | 80 | Risk Ratio (M‐H, Fixed, 95% CI) | 2.5 [0.51, 12.14] |
| 10 Maternal nausea and vomiting Show forest plot | 1 | 80 | Risk Ratio (M‐H, Fixed, 95% CI) | 3.0 [0.33, 27.63] |
| 11 Puerperal pyrexia (other maternal side‐effects) Show forest plot | 1 | 80 | Risk Ratio (M‐H, Fixed, 95% CI) | 0.42 [0.16, 1.07] |
| 12 Palpitation (other maternal side‐effects) Show forest plot | 1 | 80 | Risk Ratio (M‐H, Fixed, 95% CI) | 2.5 [0.51, 12.14] |
| 13 Headache (other maternal side‐effects) Show forest plot | 1 | 80 | Risk Ratio (M‐H, Fixed, 95% CI) | 3.33 [0.99, 11.22] |
| 14 Postpartum haemorrhage Show forest plot | 1 | 80 | Risk Ratio (M‐H, Fixed, 95% CI) | 2.0 [0.90, 4.43] |
| 15 Woman not satisfied Show forest plot | 1 | 80 | Risk Ratio (M‐H, Fixed, 95% CI) | 1.75 [0.56, 5.51] |
| Outcome or subgroup title | No. of studies | No. of participants | Statistical method | Effect size |
| 1 Vaginal delivery not achieved within 24 hours Show forest plot | 1 | 154 | Risk Ratio (M‐H, Fixed, 95% CI) | 1.05 [0.91, 1.20] |
| 2 Caesarean section Show forest plot | 1 | 154 | Risk Ratio (M‐H, Fixed, 95% CI) | 1.05 [0.89, 1.24] |
| 3 Oxytocin augmentation Show forest plot | 1 | 154 | Risk Ratio (M‐H, Fixed, 95% CI) | 0.81 [0.66, 0.98] |
| 4 Uterine rupture Show forest plot | 1 | 154 | Risk Ratio (M‐H, Fixed, 95% CI) | 1.0 [0.06, 15.70] |
| 5 Epidural analgesia Show forest plot | 1 | 154 | Risk Ratio (M‐H, Fixed, 95% CI) | 0.0 [0.0, 0.0] |
| 6 Instrumental vaginal delivery Show forest plot | 1 | 154 | Risk Ratio (M‐H, Fixed, 95% CI) | 0.92 [0.43, 1.95] |
| 7 Apgar score < 7 at 5 minutes Show forest plot | 1 | 154 | Risk Ratio (M‐H, Fixed, 95% CI) | 1.0 [0.06, 15.70] |
| 8 Neonatal intensive care unit admission Show forest plot | 1 | 154 | Risk Ratio (M‐H, Fixed, 95% CI) | 2.0 [0.19, 21.60] |
| 9 Neonatal encephalopathy Show forest plot | 1 | 154 | Risk Ratio (M‐H, Fixed, 95% CI) | 3.0 [0.12, 72.52] |
| 10 Perinatal death Show forest plot | 1 | 154 | Risk Ratio (M‐H, Fixed, 95% CI) | 3.0 [0.12, 72.52] |
| 11 Neonatal infection Show forest plot | 1 | 154 | Risk Ratio (M‐H, Fixed, 95% CI) | 0.0 [0.0, 0.0] |
| 12 Cord prolapse (other maternal side‐effects) Show forest plot | 1 | 154 | Risk Ratio (M‐H, Fixed, 95% CI) | 0.0 [0.0, 0.0] |
| 13 Postpartum haemorrhage Show forest plot | 1 | 154 | Risk Ratio (M‐H, Fixed, 95% CI) | 0.33 [0.01, 8.06] |
| 14 Chorioamnionitis Show forest plot | 1 | 154 | Risk Ratio (M‐H, Fixed, 95% CI) | 0.33 [0.04, 3.13] |
| Outcome or subgroup title | No. of studies | No. of participants | Statistical method | Effect size |
| 1 Caesarean section Show forest plot | 1 | 200 | Risk Ratio (M‐H, Fixed, 95% CI) | 1.09 [0.74, 1.60] |
| 2 Oxytocin augmentation Show forest plot | 1 | 200 | Risk Ratio (M‐H, Fixed, 95% CI) | 1.5 [0.81, 2.78] |
| 3 Uterine hyperstimulation (FHR change not mentioned) Show forest plot | 1 | 200 | Risk Ratio (M‐H, Fixed, 95% CI) | 0.5 [0.05, 5.43] |
| 4 Uterine rupture Show forest plot | 1 | 200 | Risk Ratio (M‐H, Fixed, 95% CI) | 0.33 [0.01, 8.09] |
| 5 Apgar score < 7 at 5 minutes Show forest plot | 1 | 200 | Risk Ratio (M‐H, Fixed, 95% CI) | 0.8 [0.22, 2.89] |
| 6 Neonatal intensive care unit admission Show forest plot | 1 | 200 | Risk Ratio (M‐H, Fixed, 95% CI) | 0.75 [0.17, 3.27] |
| 7 Neonatal infection Show forest plot | 1 | 200 | Risk Ratio (M‐H, Fixed, 95% CI) | 1.0 [0.06, 15.77] |
| 8 Postpartum haemorrhage Show forest plot | 1 | 200 | Risk Ratio (M‐H, Fixed, 95% CI) | 1.0 [0.14, 6.96] |
| 9 Chorioamnionitis Show forest plot | 1 | 200 | Risk Ratio (M‐H, Fixed, 95% CI) | 1.0 [0.06, 15.77] |
| 10 Endometritis Show forest plot | 1 | 200 | Risk Ratio (M‐H, Fixed, 95% CI) | 1.5 [0.26, 8.79] |
| 11 Maternal intensive care unit admission (serious maternal complications) Show forest plot | 1 | 200 | Risk Ratio (M‐H, Fixed, 95% CI) | 0.0 [0.0, 0.0] |