Antioxidantes para la prevención y la reducción del dolor muscular después del ejercicio
Información
- DOI:
- https://doi.org/10.1002/14651858.CD009789.pub2Copiar DOI

- Base de datos:
-
- Cochrane Database of Systematic Reviews
- Versión publicada:
-
- 14 diciembre 2017see what's new
- Tipo:
-
- Intervention
- Etapa:
-
- Review
- Grupo Editorial Cochrane:
-
Grupo Cochrane de Lesiones óseas, articulares y musculares
- Copyright:
-
- Copyright © 2017 The Cochrane Collaboration. Published by John Wiley & Sons, Ltd.
Cifras del artículo
Altmetric:
Citado por:
Autores
Contributions of authors
Mayur Ranchordas identified the research idea for the review, wrote the protocol, extracted the data, wrote the review and is the guarantor.
David Rogerson assisted with drafting the protocol and data extraction.
Hora Soltani provided feedback on the draft protocol and review.
Joseph Costello assisted with data analysis and drafted the final review.
Sources of support
Internal sources
-
Sheffield Hallam University, UK.
-
University of Portsmouth, UK.
External sources
-
No sources of support supplied
Declarations of interest
Mayur Ranchordas co‐authored one of the included studies (Lynn 2015). Decisions on inclusion of this study, the 'Risk of bias' assessment and data extraction were undertaken by other review authors (JC, DR), who had no involvement in the study.
David Rogerson: none known.
Hora Soltani: none known.
Joseph Costello: none known.
Acknowledgements
We would like to thank Joanne Elliott for her assistance with developing and running the search strategies. We would also like to thank Helen Handoll, Joanne Elliott, Lindsey Elstub and Zipporah Iheozor‐Ejiofor for their comments and feedback on drafts of the review. We thank the external referee, Michalis Nikolaidis, for his feedback.
We thank the Cochrane Editorial Unit for feedback received during editorial screening, including the preparation by Newton Opiyo of an additional table documenting sensitivity analyses testing the effects of excluding cross‐over studies.
This project was supported by the National Institute for Health Research via Cochrane Infrastructure funding to the Cochrane Bone, Joint and Muscle Trauma Group. The views and opinions expressed therein are those of the authors and do not necessarily reflect those of the Systematic Reviews Programme, NIHR, NHS or the Department of Health.
Version history
| Published | Title | Stage | Authors | Version |
| 2017 Dec 14 | Antioxidants for preventing and reducing muscle soreness after exercise | Review | Mayur K Ranchordas, David Rogerson, Hora Soltani, Joseph T Costello | |
| 2012 Apr 18 | Antioxidants for preventing and reducing muscle soreness after exercise | Protocol | Mayur K Ranchordas, David Rogerson, Hora Soltani | |
Differences between protocol and review
Since publication of the protocol (Ranchordas 2012), we made the following changes.
We updated the Background to reflect current evidence on the potential negative effects of antioxidant supplementation (in particularly long‐term use) by impairing exercise adaptations.
In Types of outcome measures, we stipulated that trials that did not record muscle soreness (pain) would be excluded. We included a new primary outcome (subjective recovery) and we elevated adverse effects, originally listed as a secondary outcome, to primary outcome status.
Linked with this was our selection of outcome measures for presentation in summary of findings Table for the main comparison. This included limiting the measurement of DOMS to five follow‐up periods up to 96 hours.
In Subgroup analysis and investigation of heterogeneity, we removed the subgroup analysis "Type of antioxidants supplement (antioxidants supplements vs. antioxidants‐enriched food)". This is because we realised that it was not possible to categorise studies into 'antioxidant supplement' or 'antioxidant‐enriched food' as they usually belonged to both categories; for example, tart cherry juice is an antioxidant‐enriched food but it is also an antioxidant supplement containing vitamins such as vitamin C.
We merged two previous subgroup comparisons on types of exercise ("Normal sporting activities and laboratory induced DOMS"; "Exercise that requires high oxygen consumption (e.g. running, cycling) and exercise that requires low oxygen consumption (e.g. eccentric exercise in one arm)") as the comparison of "whole body aerobic exercise" versus "mechanical exercise" captured both of these.
We included an additional subgroup analysis on sources of funding where we compared DOMS for studies that were funded by a food company or provider of antioxidant supplements versus studies that were not funded by a food company or provider of antioxidant supplements.
We could not compare the subgroup analysis 'timing of exercise' because of insufficient studies in the 'supplementation after exercise' group.
In Sensitivity analysis, we modified the sensitivity analysis testing the effects of high risk of selection bias to include also trials at unclear risk of selection bias, relating to random sequence generation, allocation concealment or both. Additional sensitivity analysis to explore the effects of excluding cross‐over studies on the pooled data for muscle soreness at five time periods were conducted at screening by the Cochrane Editorial Unit.
Keywords
MeSH
Medical Subject Headings (MeSH) Keywords
Medical Subject Headings Check Words
Adolescent; Adult; Female; Humans; Male; Middle Aged;
PICO
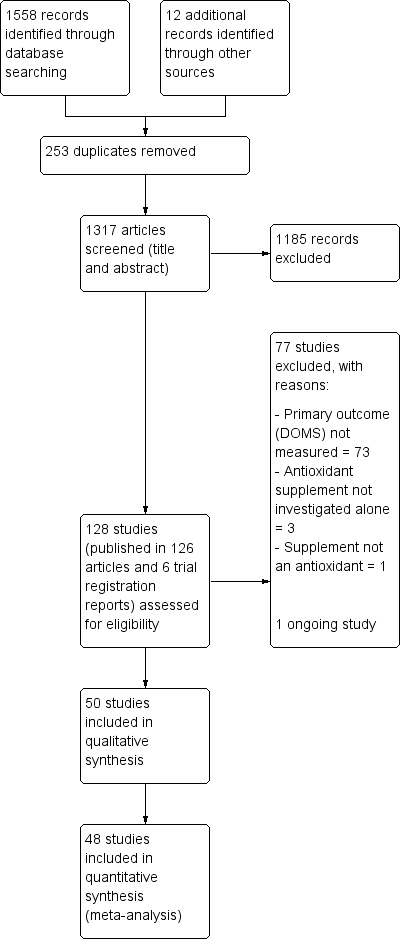
Study flow diagram
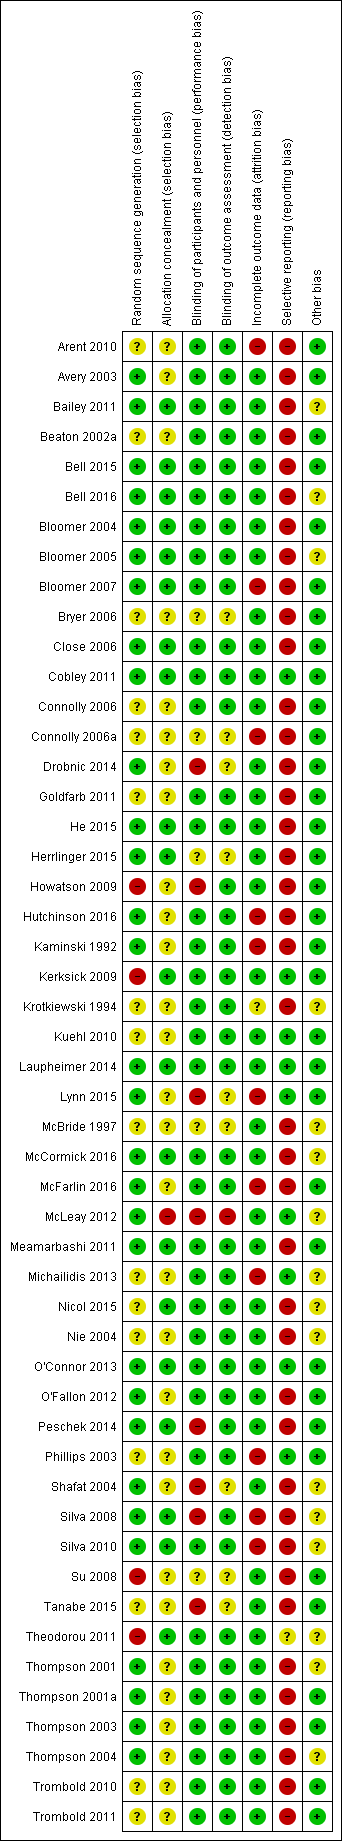
'Risk of bias' summary: review authors' judgements about each risk of bias item for each included study.
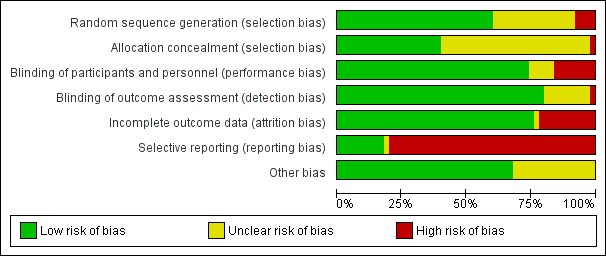
'Risk of bias' graph: review authors' judgements about each risk of bias item presented as percentages across all included studies
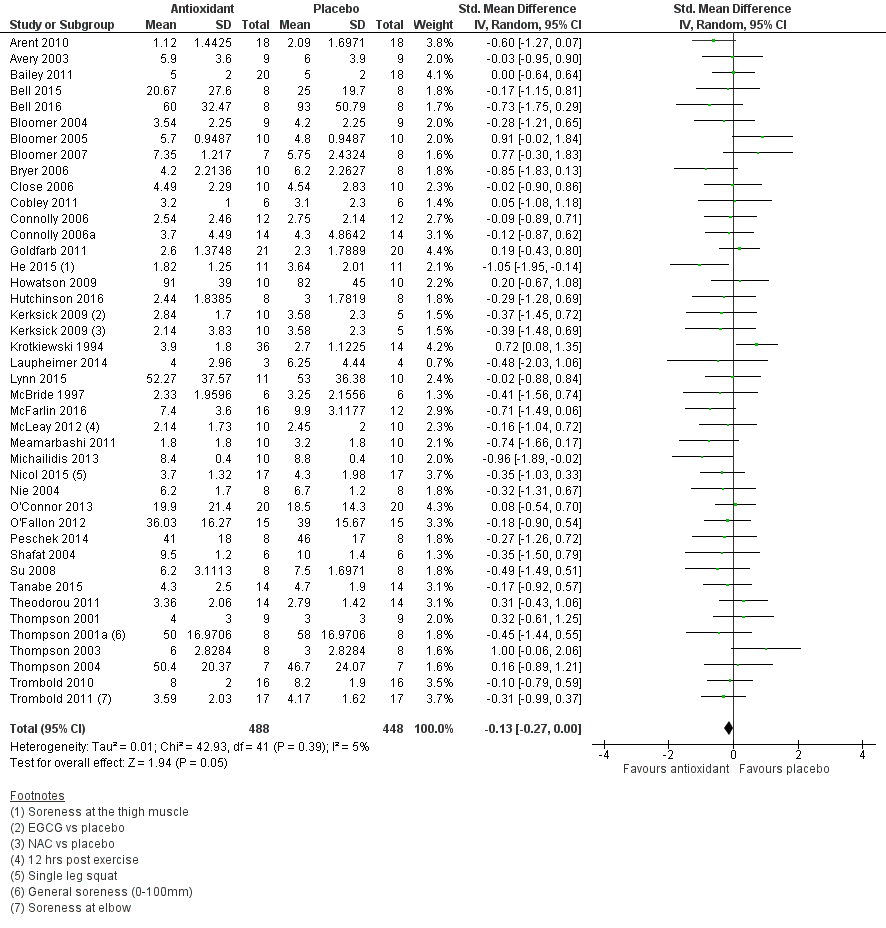
Forest plot of comparison: 1 Antioxidant supplementation vs. placebo for delayed onset muscle soreness (all studies), outcome: 1.2 Muscle soreness at 24 hours; random‐effects model.
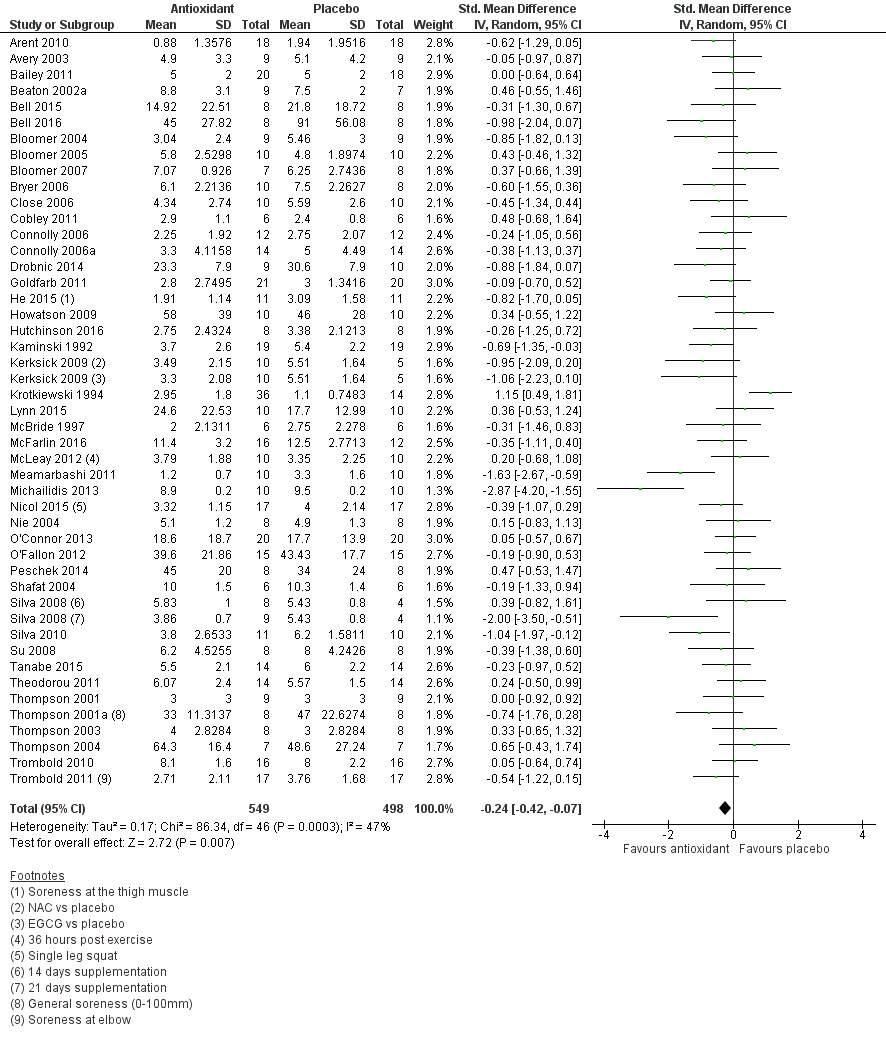
Forest plot of comparison: 1 Antioxidant supplementation vs. placebo for delayed onset muscle soreness (all studies), outcome: 1.3 Muscle soreness at 48 hours; random‐effects model.
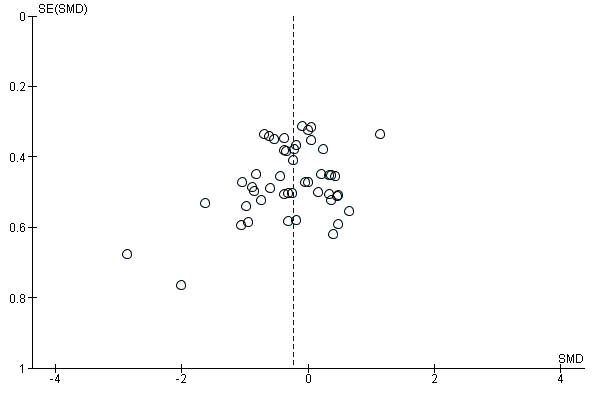
Funnel plot of comparison: 1 Antioxidant supplementation vs. placebo for delayed onset muscle soreness (all studies), outcome: 1.2 Muscle soreness at 24 hours; random‐effects model.
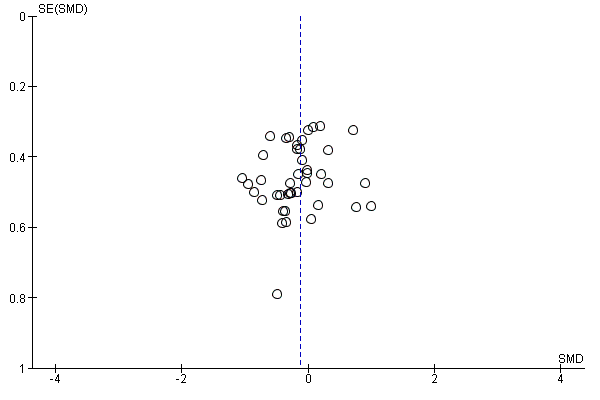
Funnel plot of comparison: 1 Antioxidant supplementation vs. placebo for delayed onset muscle soreness (all studies), outcome: 1.3 Muscle soreness at 48 hours; random‐effects model.
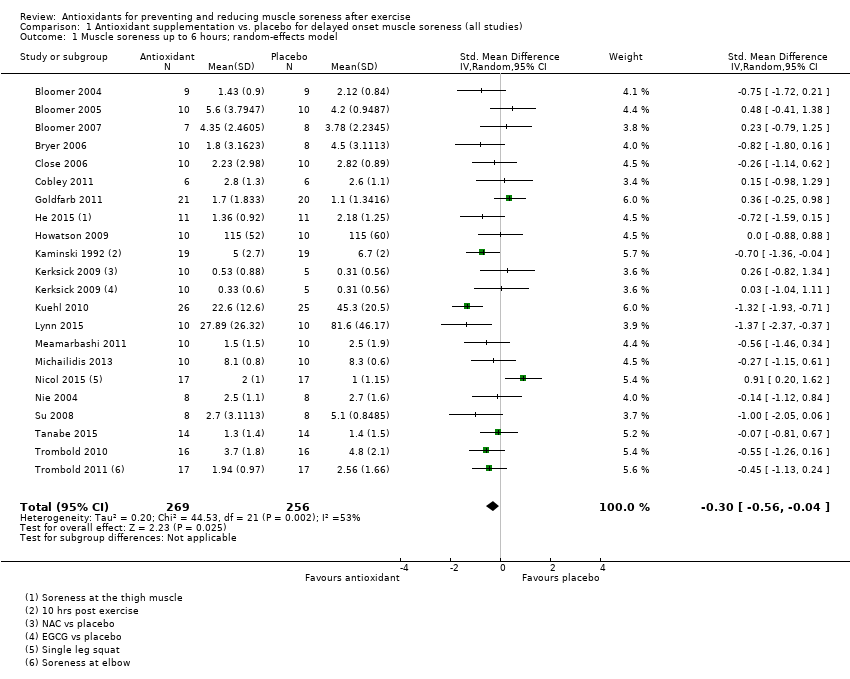
Comparison 1 Antioxidant supplementation vs. placebo for delayed onset muscle soreness (all studies), Outcome 1 Muscle soreness up to 6 hours; random‐effects model.
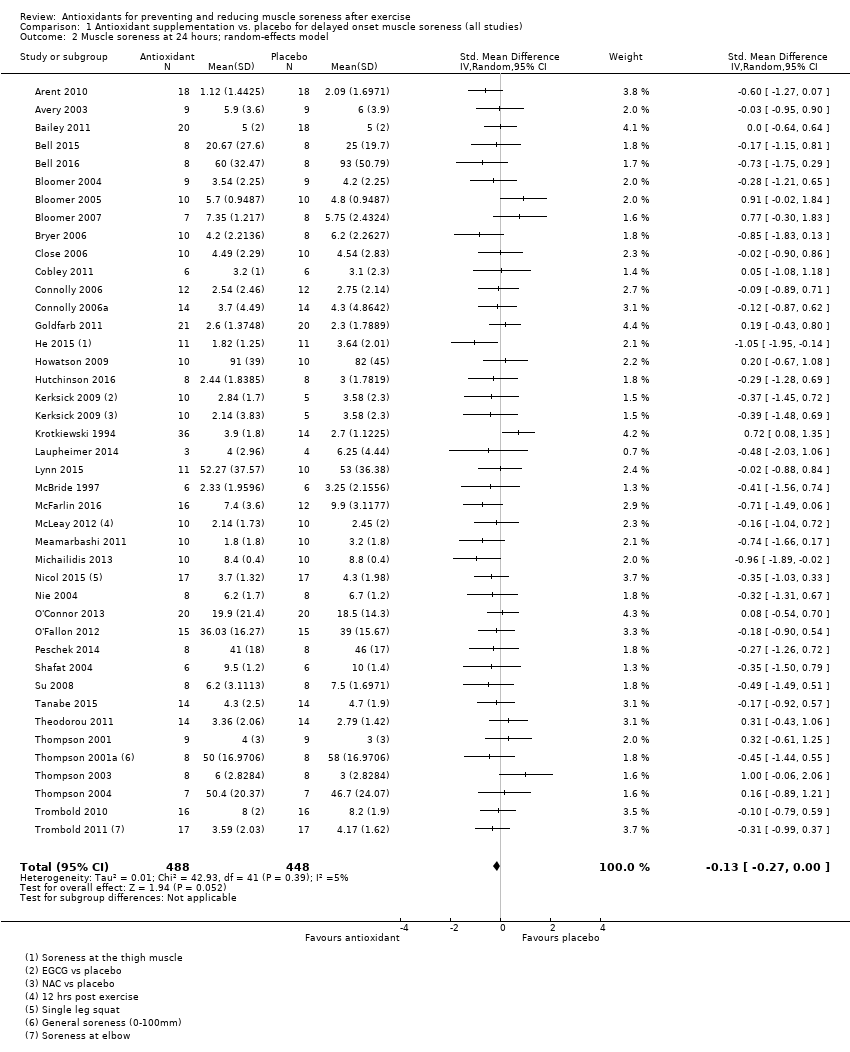
Comparison 1 Antioxidant supplementation vs. placebo for delayed onset muscle soreness (all studies), Outcome 2 Muscle soreness at 24 hours; random‐effects model.
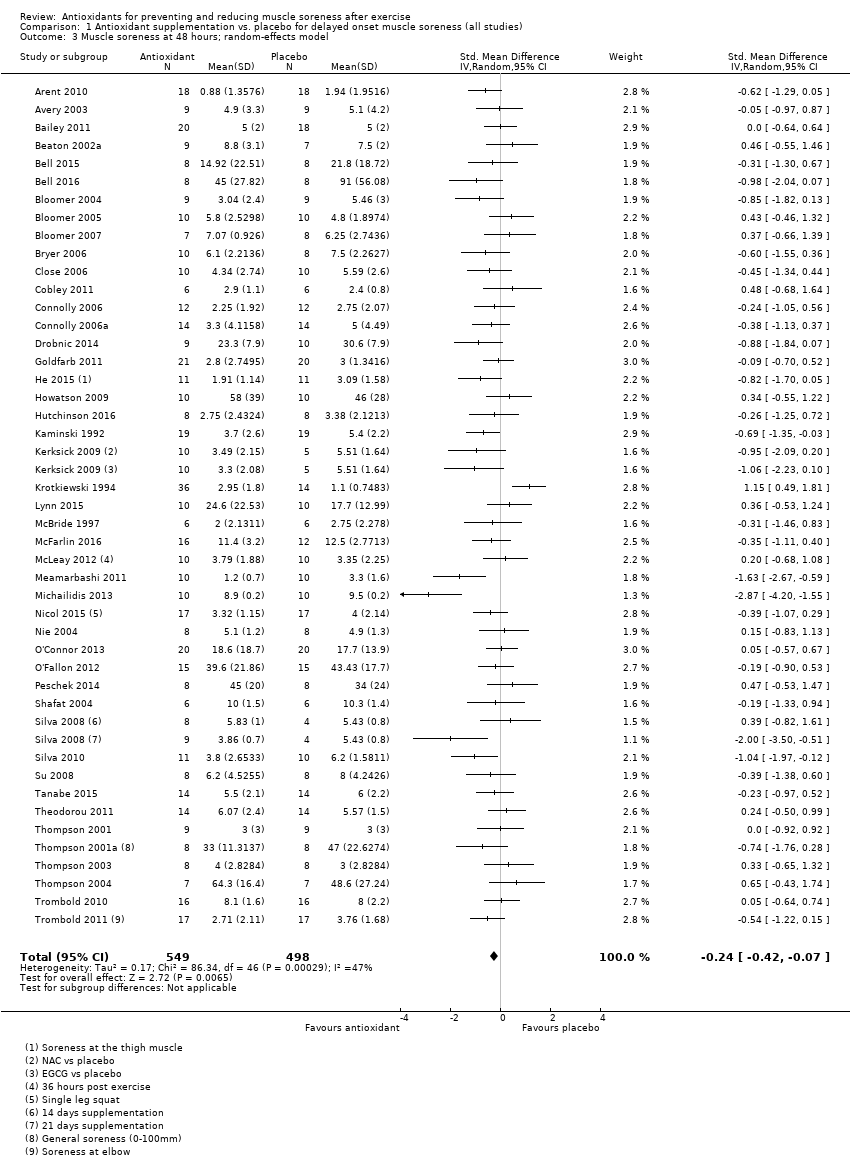
Comparison 1 Antioxidant supplementation vs. placebo for delayed onset muscle soreness (all studies), Outcome 3 Muscle soreness at 48 hours; random‐effects model.
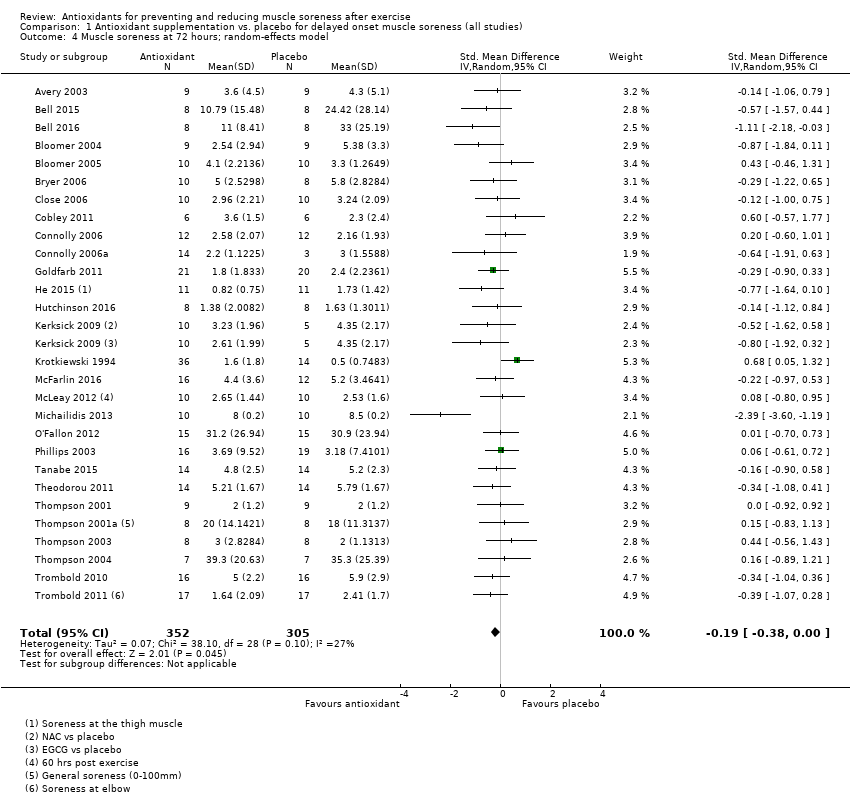
Comparison 1 Antioxidant supplementation vs. placebo for delayed onset muscle soreness (all studies), Outcome 4 Muscle soreness at 72 hours; random‐effects model.
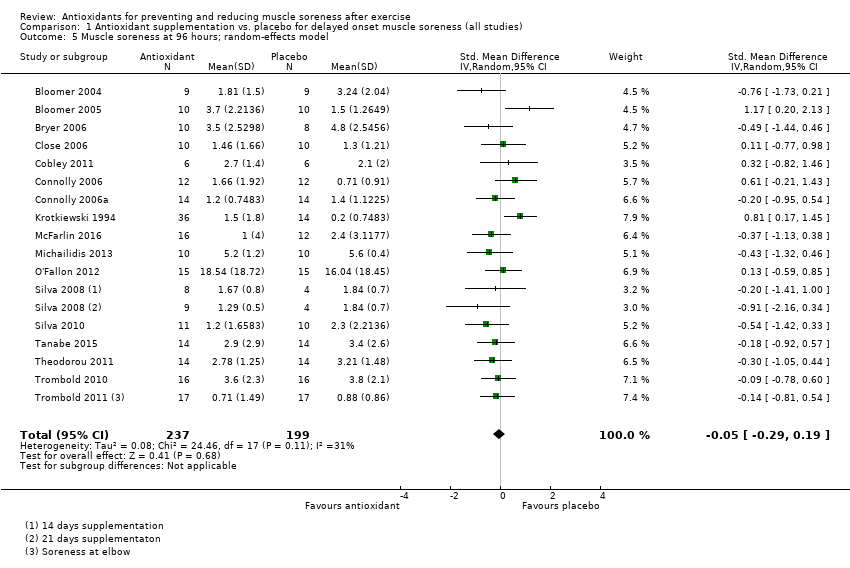
Comparison 1 Antioxidant supplementation vs. placebo for delayed onset muscle soreness (all studies), Outcome 5 Muscle soreness at 96 hours; random‐effects model.
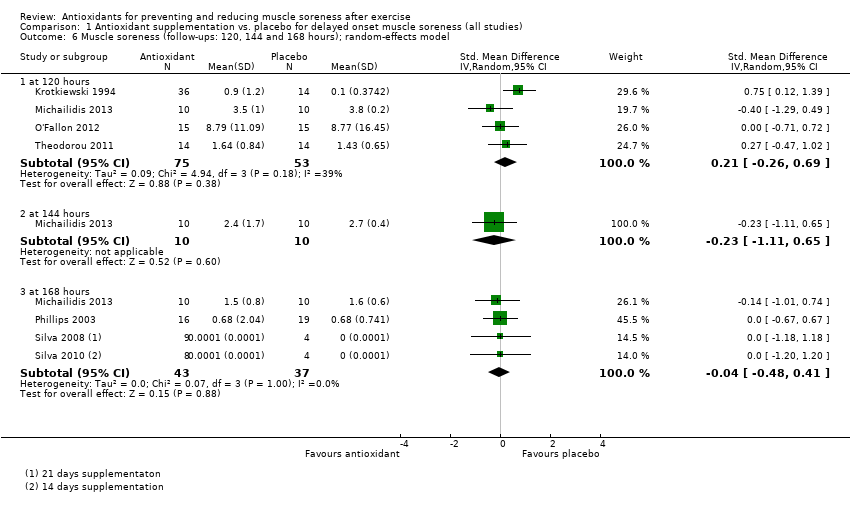
Comparison 1 Antioxidant supplementation vs. placebo for delayed onset muscle soreness (all studies), Outcome 6 Muscle soreness (follow‐ups: 120, 144 and 168 hours); random‐effects model.
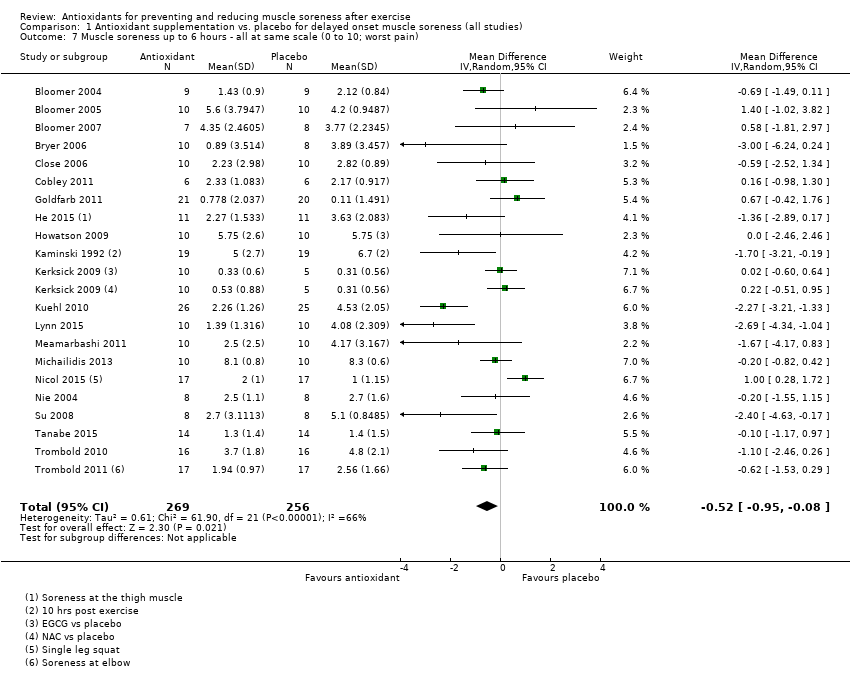
Comparison 1 Antioxidant supplementation vs. placebo for delayed onset muscle soreness (all studies), Outcome 7 Muscle soreness up to 6 hours ‐ all at same scale (0 to 10; worst pain).
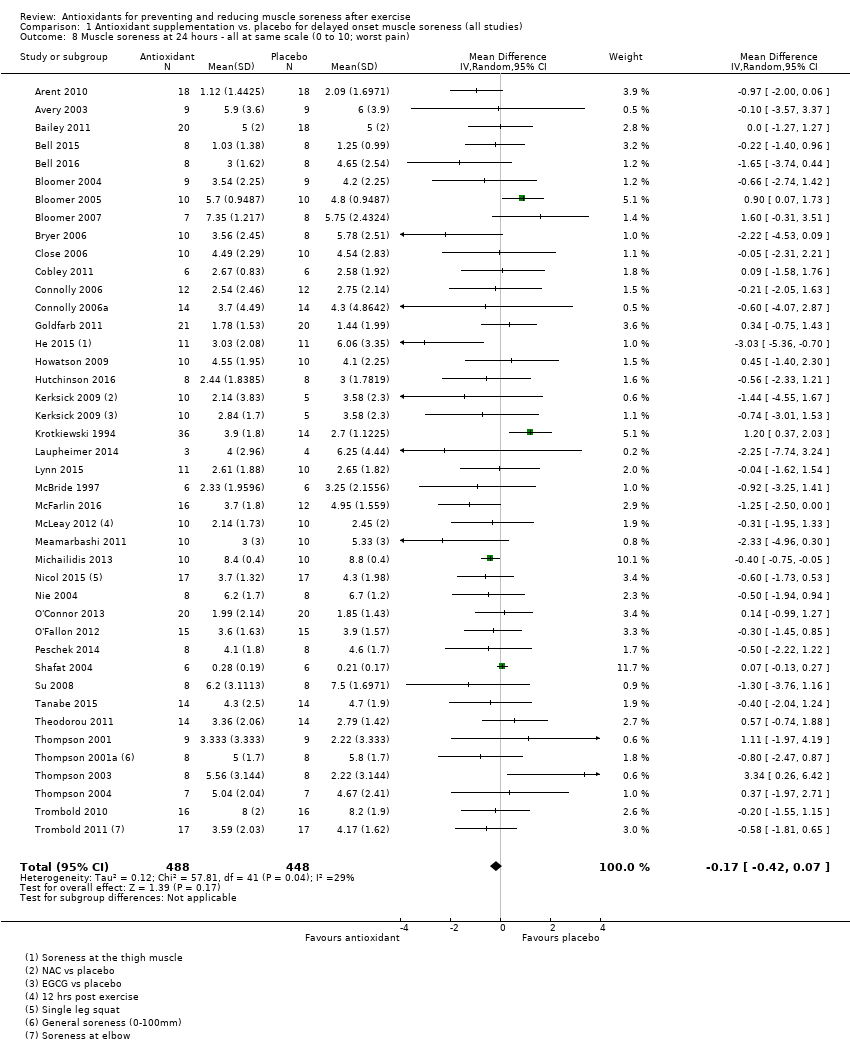
Comparison 1 Antioxidant supplementation vs. placebo for delayed onset muscle soreness (all studies), Outcome 8 Muscle soreness at 24 hours ‐ all at same scale (0 to 10; worst pain).
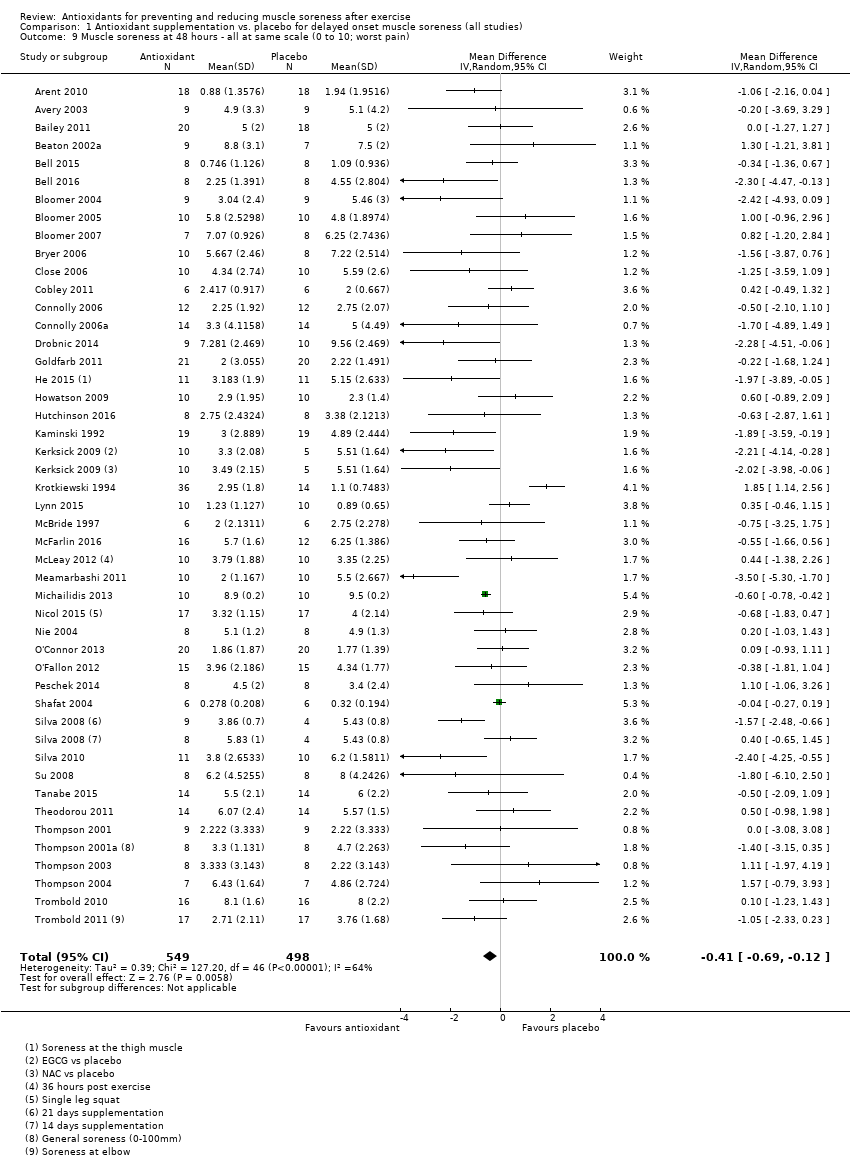
Comparison 1 Antioxidant supplementation vs. placebo for delayed onset muscle soreness (all studies), Outcome 9 Muscle soreness at 48 hours ‐ all at same scale (0 to 10; worst pain).
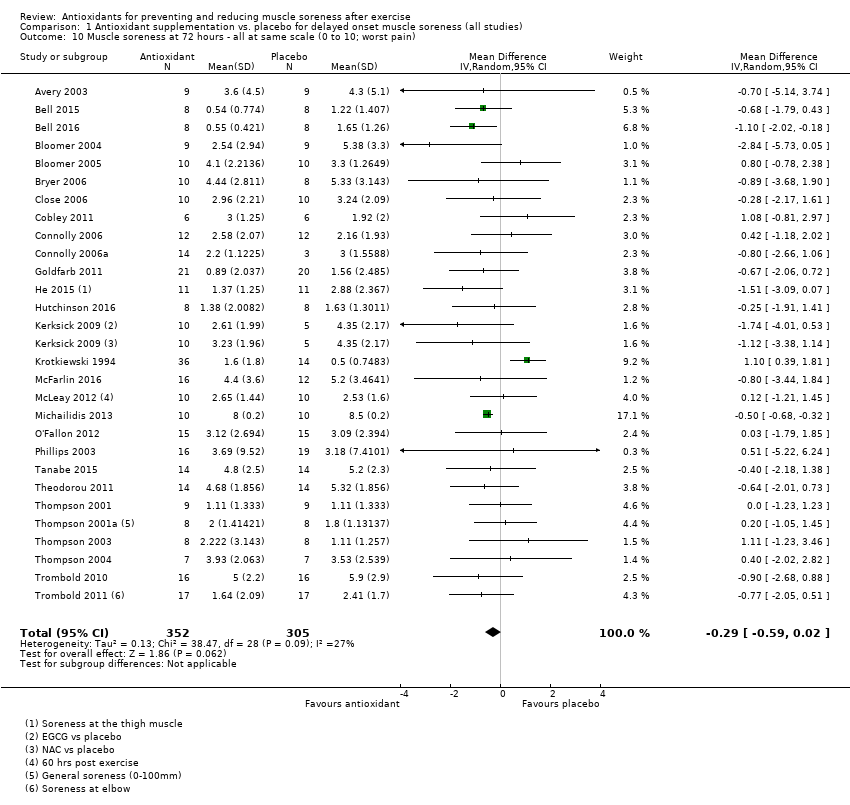
Comparison 1 Antioxidant supplementation vs. placebo for delayed onset muscle soreness (all studies), Outcome 10 Muscle soreness at 72 hours ‐ all at same scale (0 to 10; worst pain).
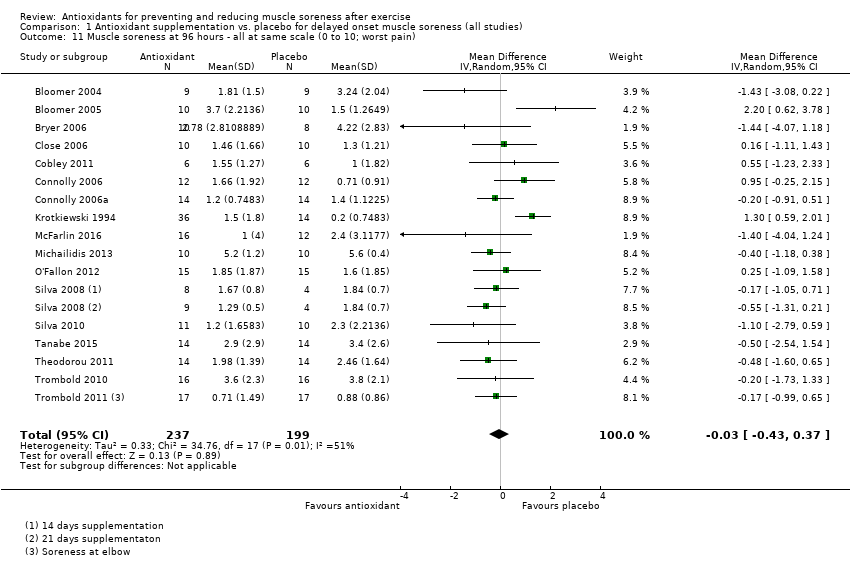
Comparison 1 Antioxidant supplementation vs. placebo for delayed onset muscle soreness (all studies), Outcome 11 Muscle soreness at 96 hours ‐ all at same scale (0 to 10; worst pain).
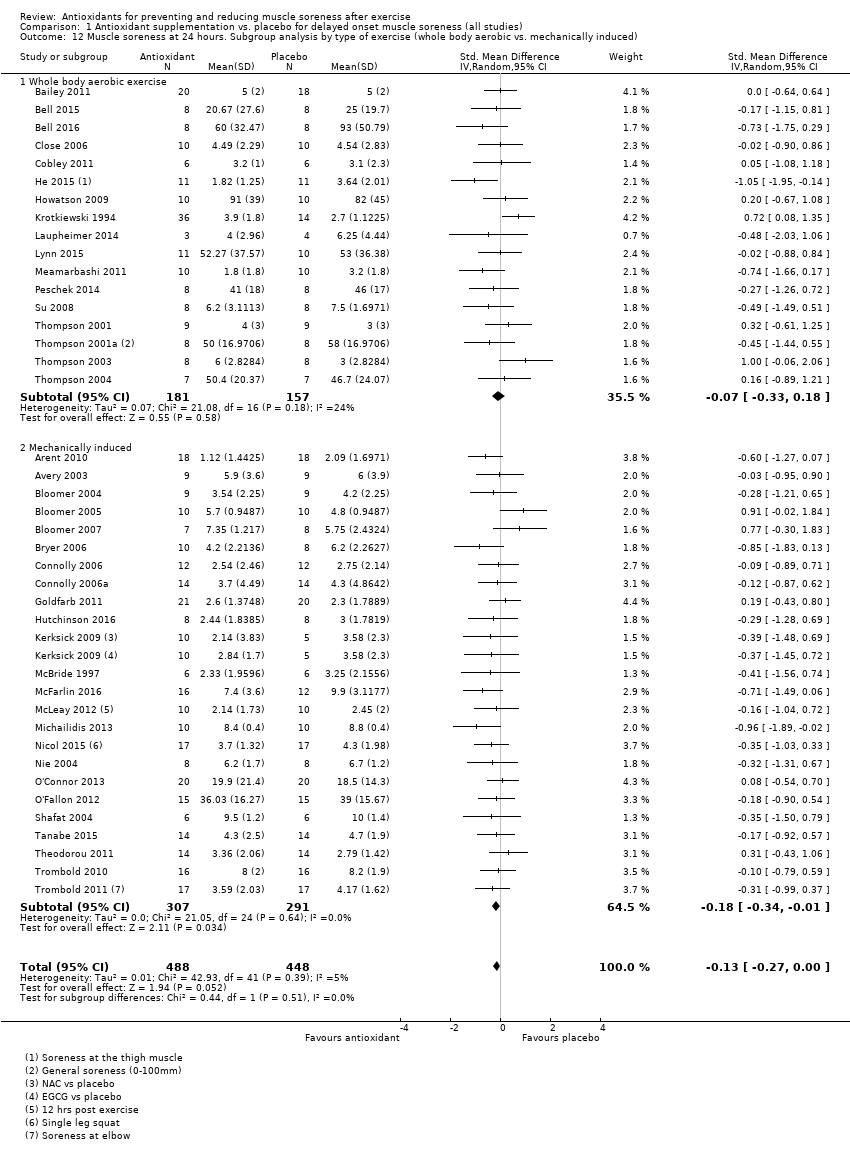
Comparison 1 Antioxidant supplementation vs. placebo for delayed onset muscle soreness (all studies), Outcome 12 Muscle soreness at 24 hours. Subgroup analysis by type of exercise (whole body aerobic vs. mechanically induced).
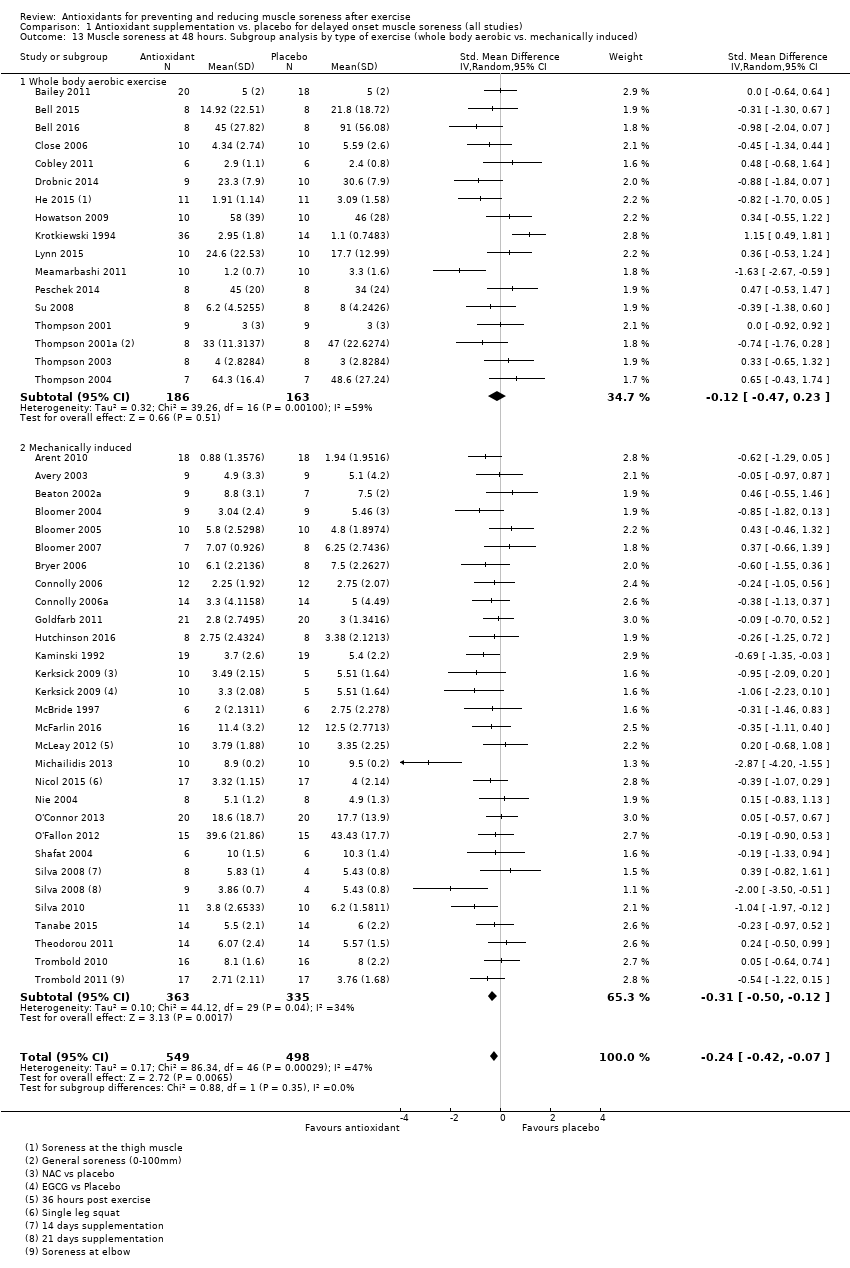
Comparison 1 Antioxidant supplementation vs. placebo for delayed onset muscle soreness (all studies), Outcome 13 Muscle soreness at 48 hours. Subgroup analysis by type of exercise (whole body aerobic vs. mechanically induced).
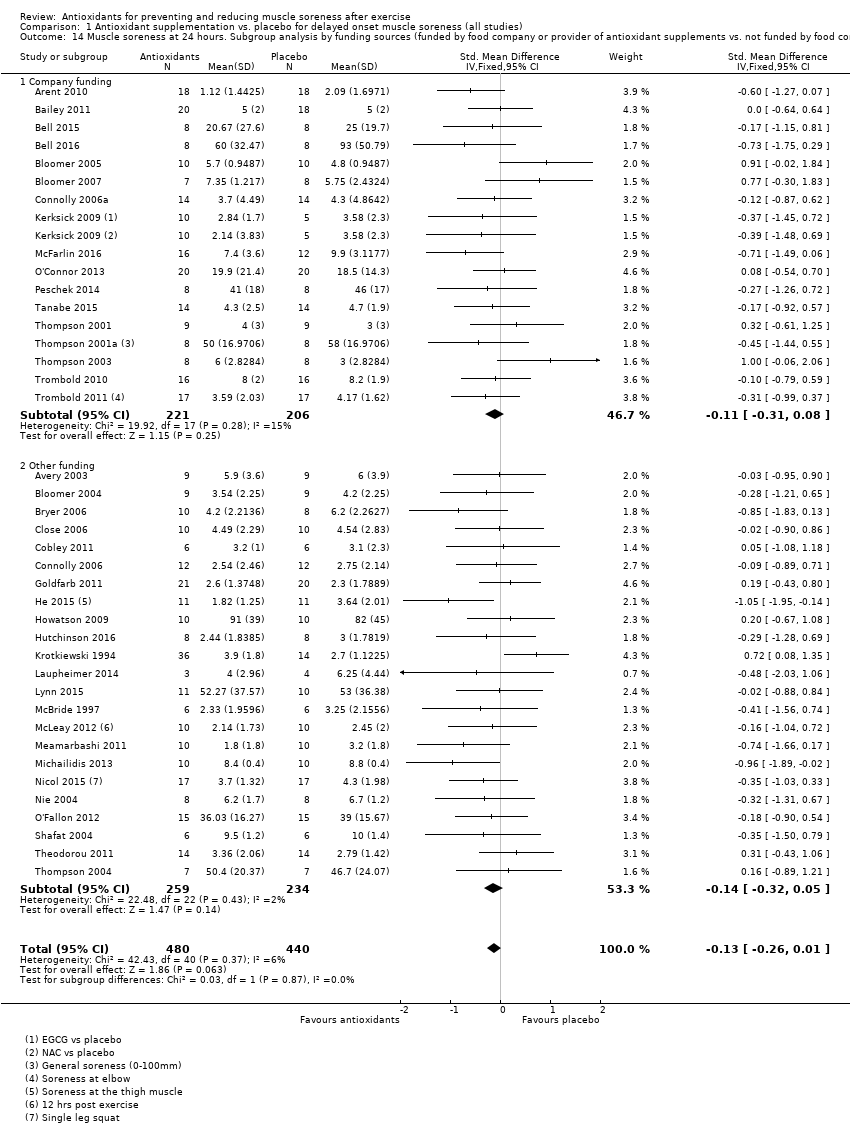
Comparison 1 Antioxidant supplementation vs. placebo for delayed onset muscle soreness (all studies), Outcome 14 Muscle soreness at 24 hours. Subgroup analysis by funding sources (funded by food company or provider of antioxidant supplements vs. not funded by food company or provider of antioxidant supplements).
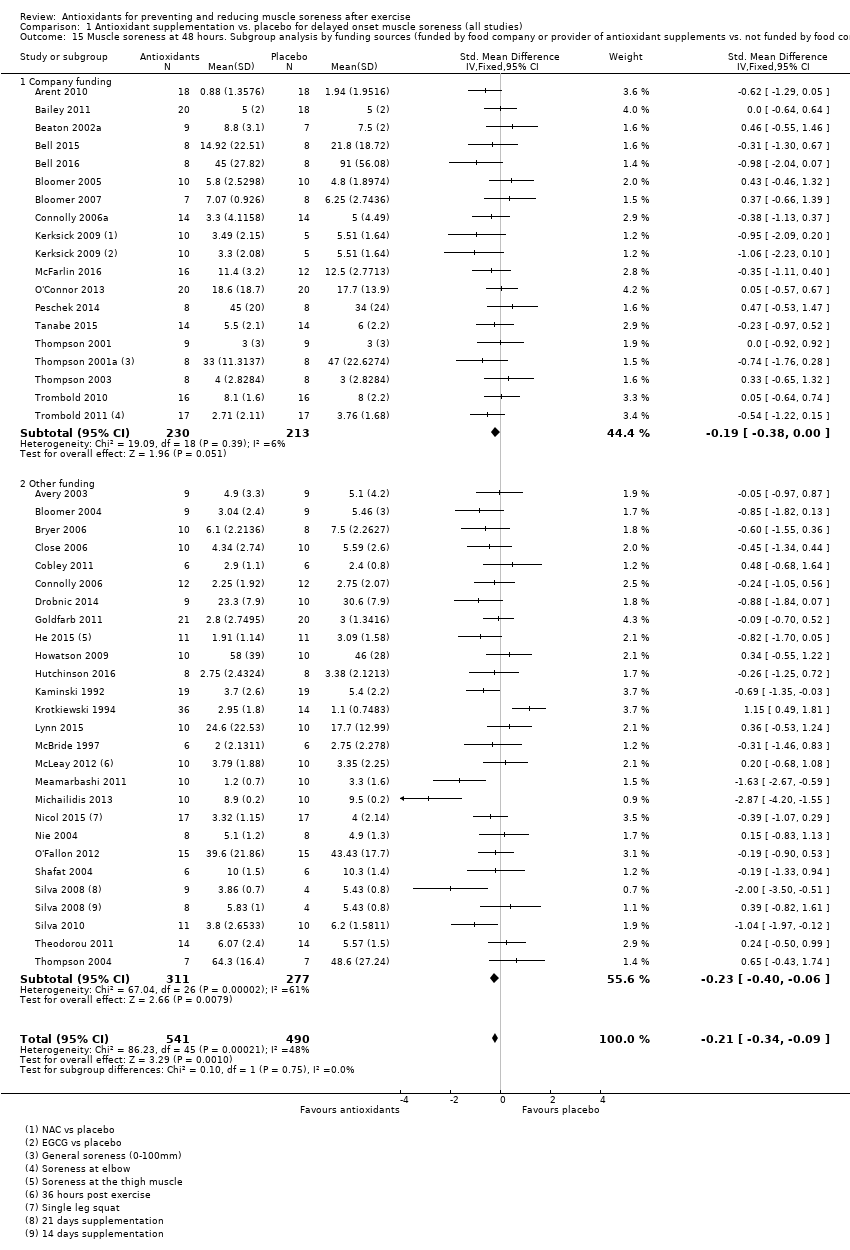
Comparison 1 Antioxidant supplementation vs. placebo for delayed onset muscle soreness (all studies), Outcome 15 Muscle soreness at 48 hours. Subgroup analysis by funding sources (funded by food company or provider of antioxidant supplements vs. not funded by food company or provider of antioxidant supplements).
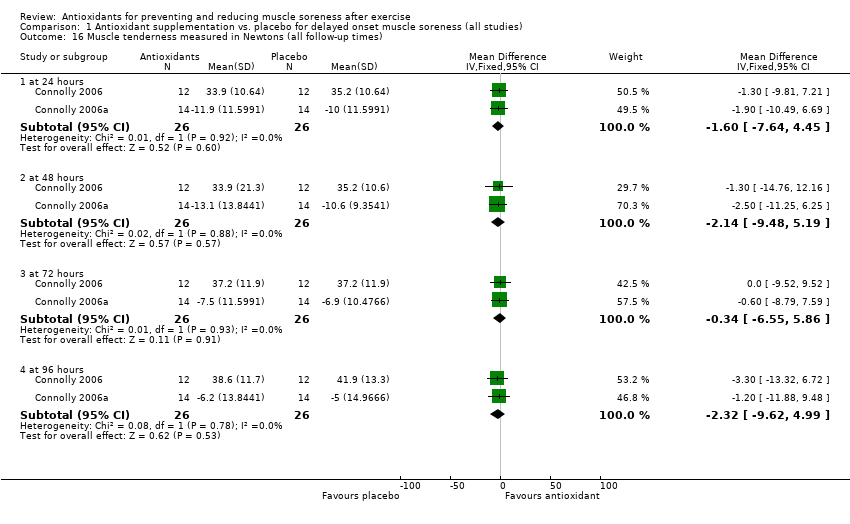
Comparison 1 Antioxidant supplementation vs. placebo for delayed onset muscle soreness (all studies), Outcome 16 Muscle tenderness measured in Newtons (all follow‐up times).
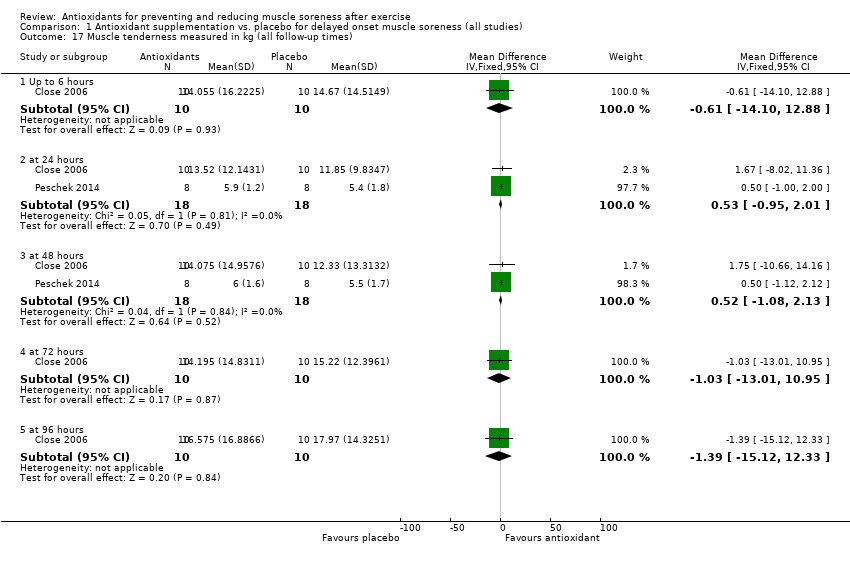
Comparison 1 Antioxidant supplementation vs. placebo for delayed onset muscle soreness (all studies), Outcome 17 Muscle tenderness measured in kg (all follow‐up times).
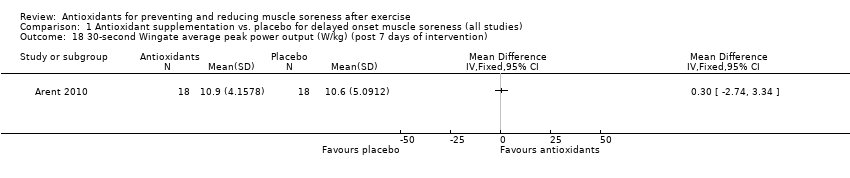
Comparison 1 Antioxidant supplementation vs. placebo for delayed onset muscle soreness (all studies), Outcome 18 30‐second Wingate average peak power output (W/kg) (post 7 days of intervention).
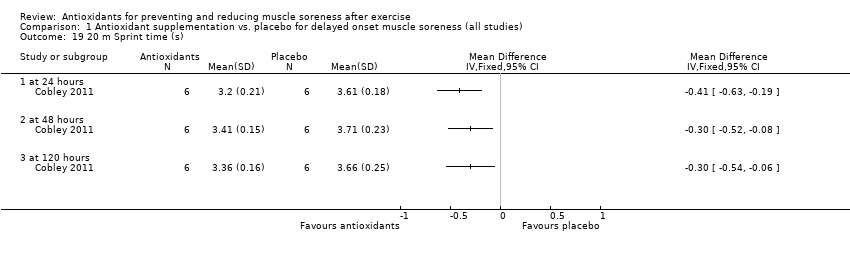
Comparison 1 Antioxidant supplementation vs. placebo for delayed onset muscle soreness (all studies), Outcome 19 20 m Sprint time (s).
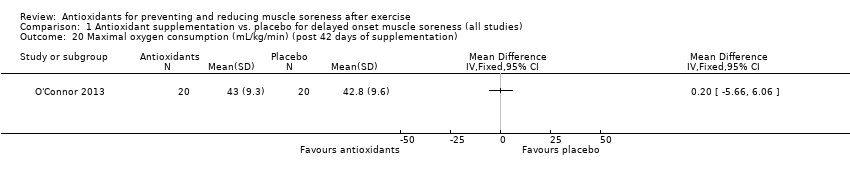
Comparison 1 Antioxidant supplementation vs. placebo for delayed onset muscle soreness (all studies), Outcome 20 Maximal oxygen consumption (mL/kg/min) (post 42 days of supplementation).
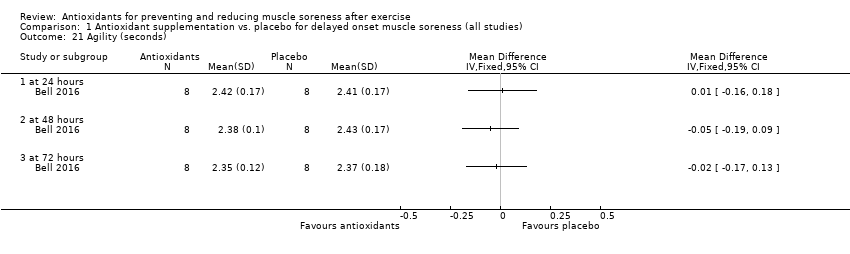
Comparison 1 Antioxidant supplementation vs. placebo for delayed onset muscle soreness (all studies), Outcome 21 Agility (seconds).
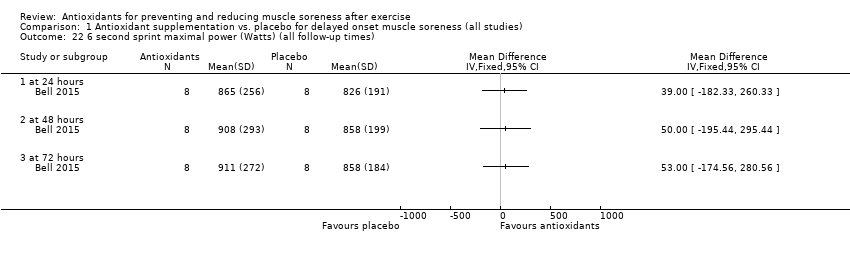
Comparison 1 Antioxidant supplementation vs. placebo for delayed onset muscle soreness (all studies), Outcome 22 6 second sprint maximal power (Watts) (all follow‐up times).
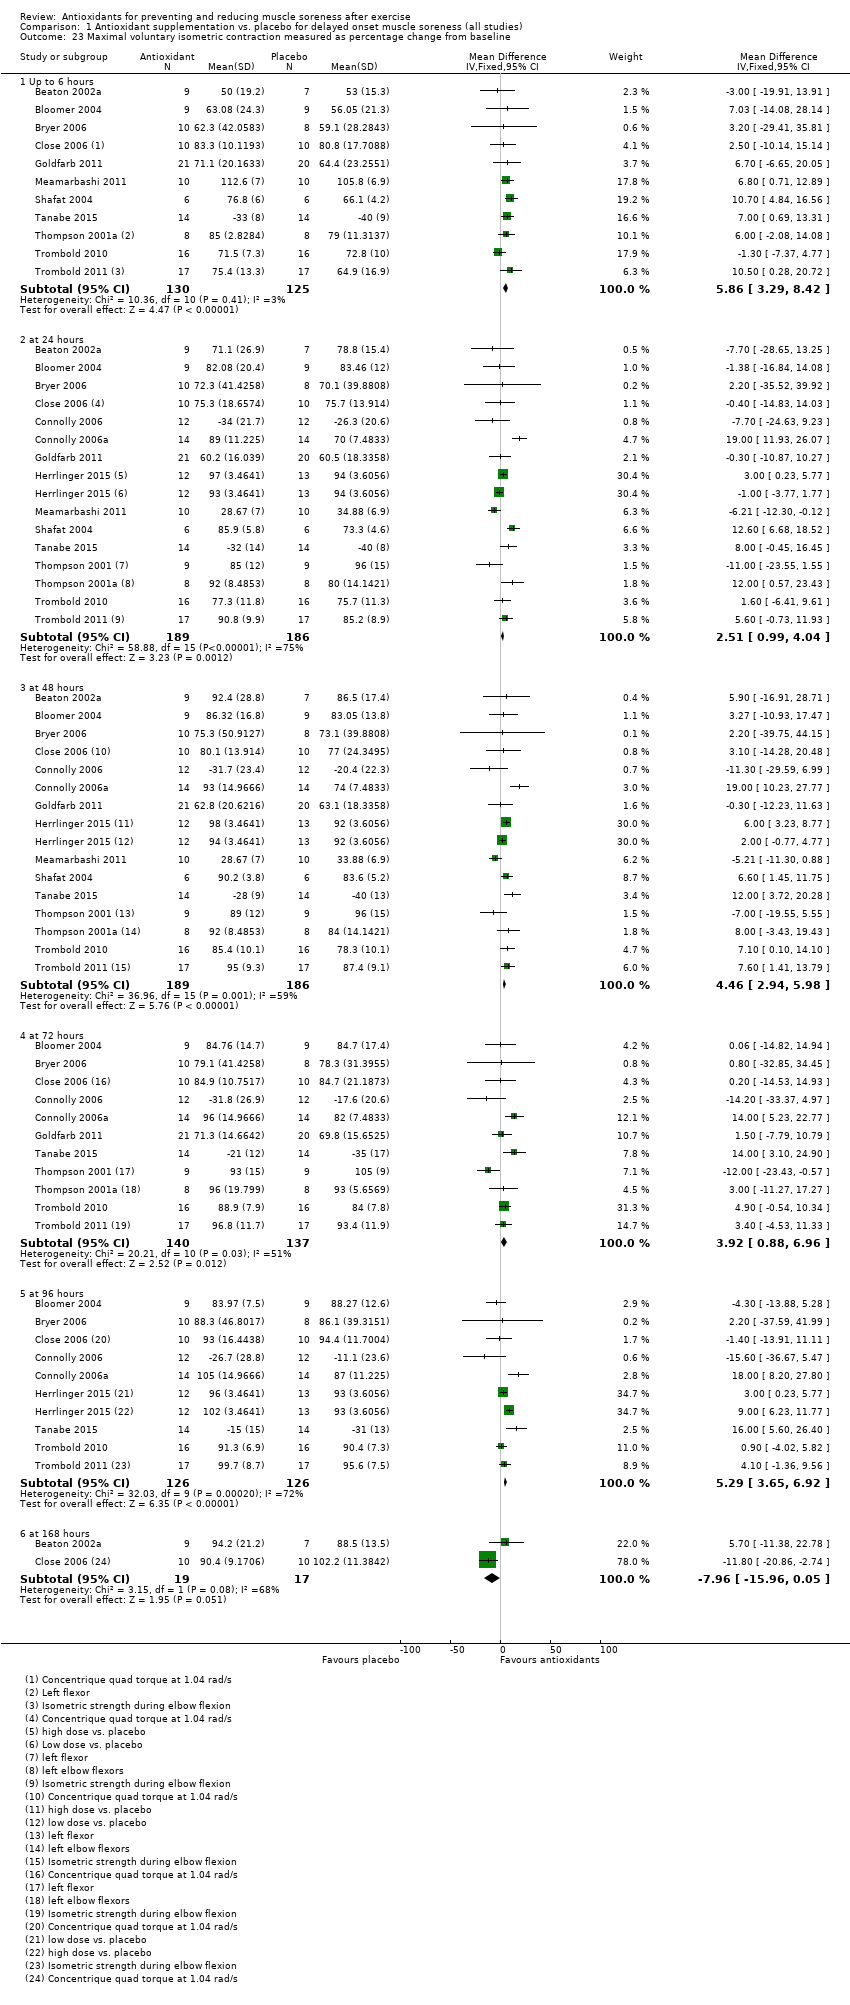
Comparison 1 Antioxidant supplementation vs. placebo for delayed onset muscle soreness (all studies), Outcome 23 Maximal voluntary isometric contraction measured as percentage change from baseline.
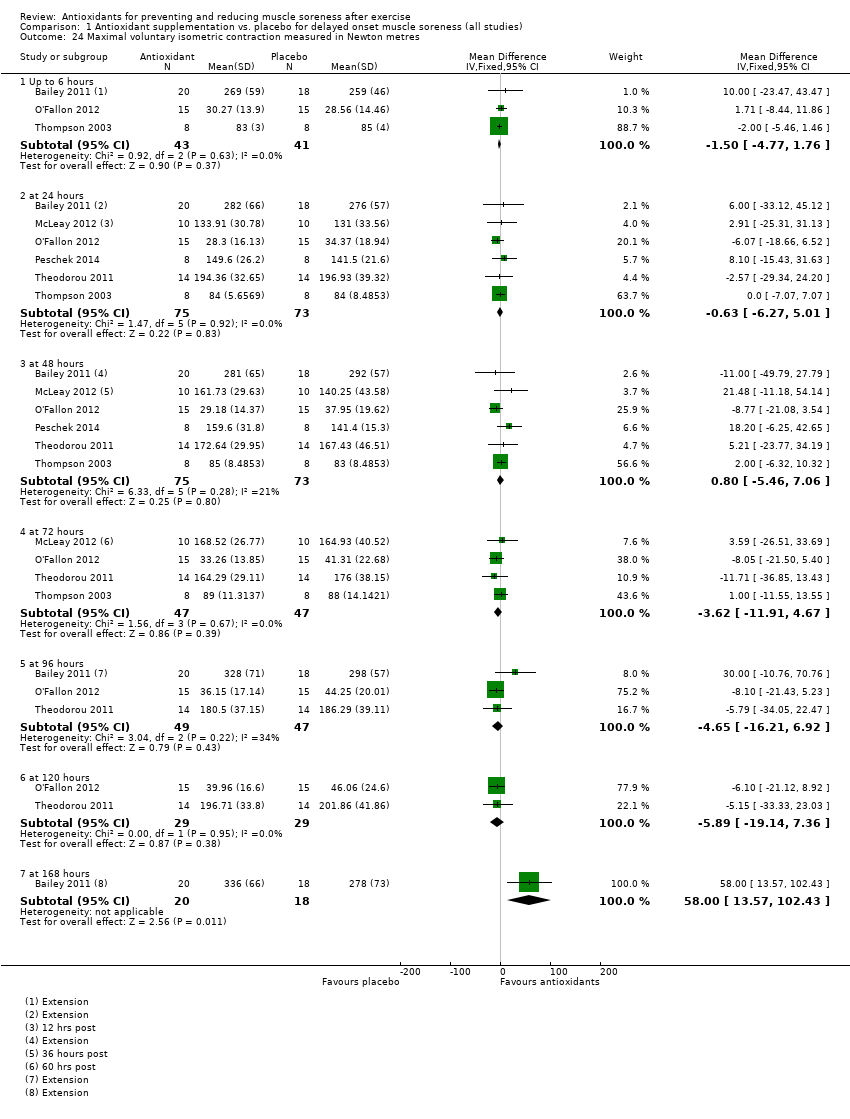
Comparison 1 Antioxidant supplementation vs. placebo for delayed onset muscle soreness (all studies), Outcome 24 Maximal voluntary isometric contraction measured in Newton metres.
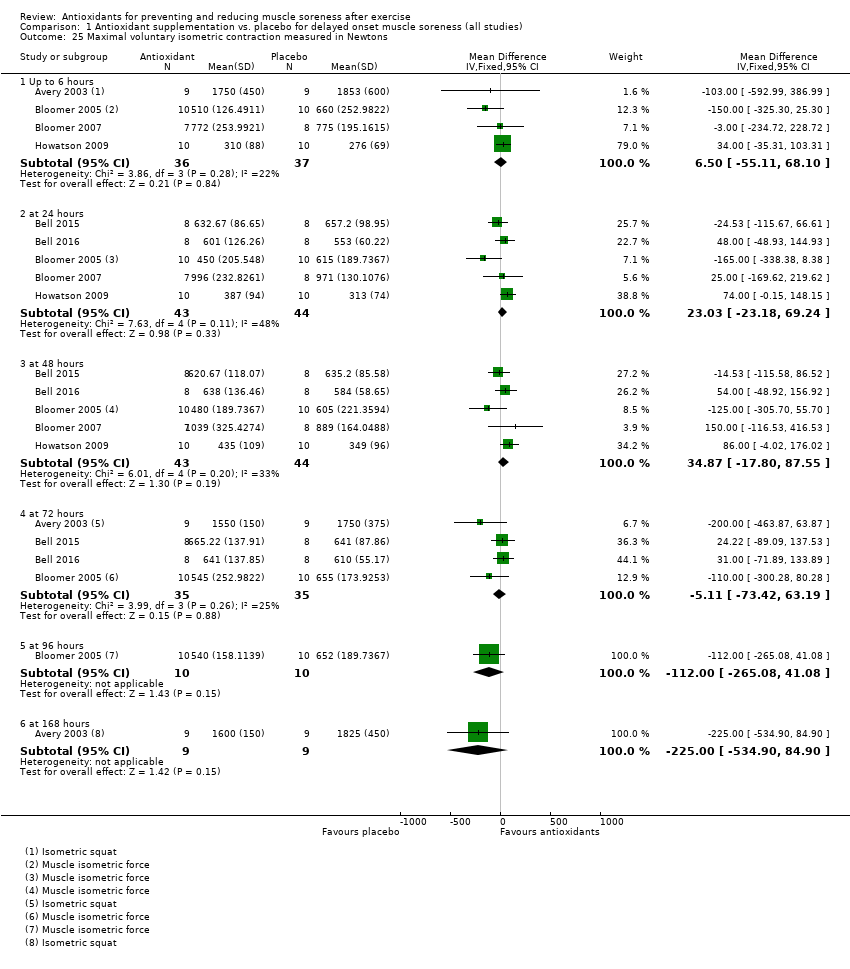
Comparison 1 Antioxidant supplementation vs. placebo for delayed onset muscle soreness (all studies), Outcome 25 Maximal voluntary isometric contraction measured in Newtons.
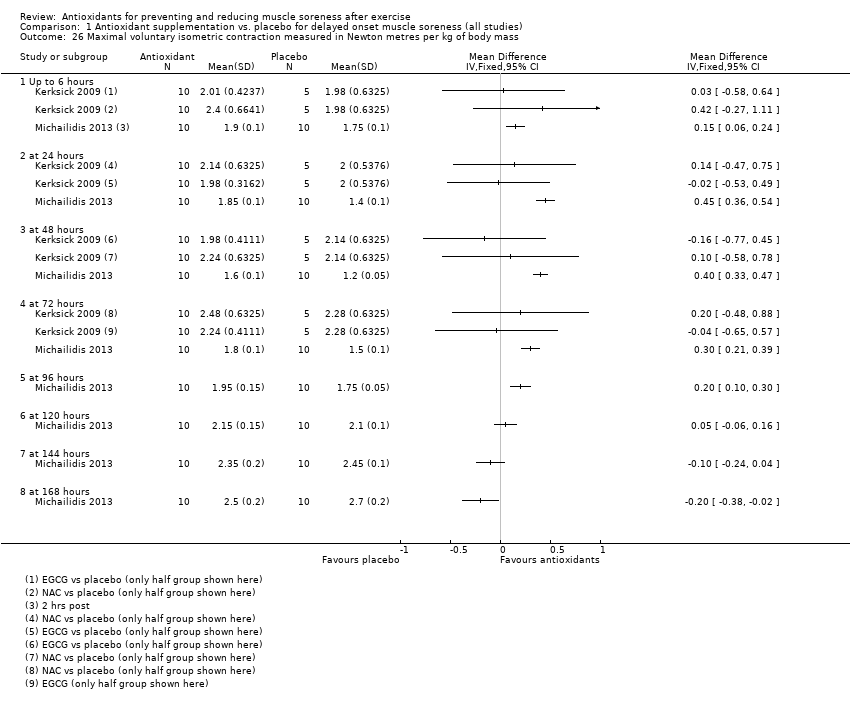
Comparison 1 Antioxidant supplementation vs. placebo for delayed onset muscle soreness (all studies), Outcome 26 Maximal voluntary isometric contraction measured in Newton metres per kg of body mass.
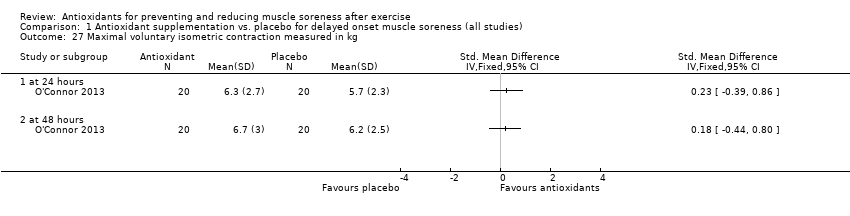
Comparison 1 Antioxidant supplementation vs. placebo for delayed onset muscle soreness (all studies), Outcome 27 Maximal voluntary isometric contraction measured in kg.
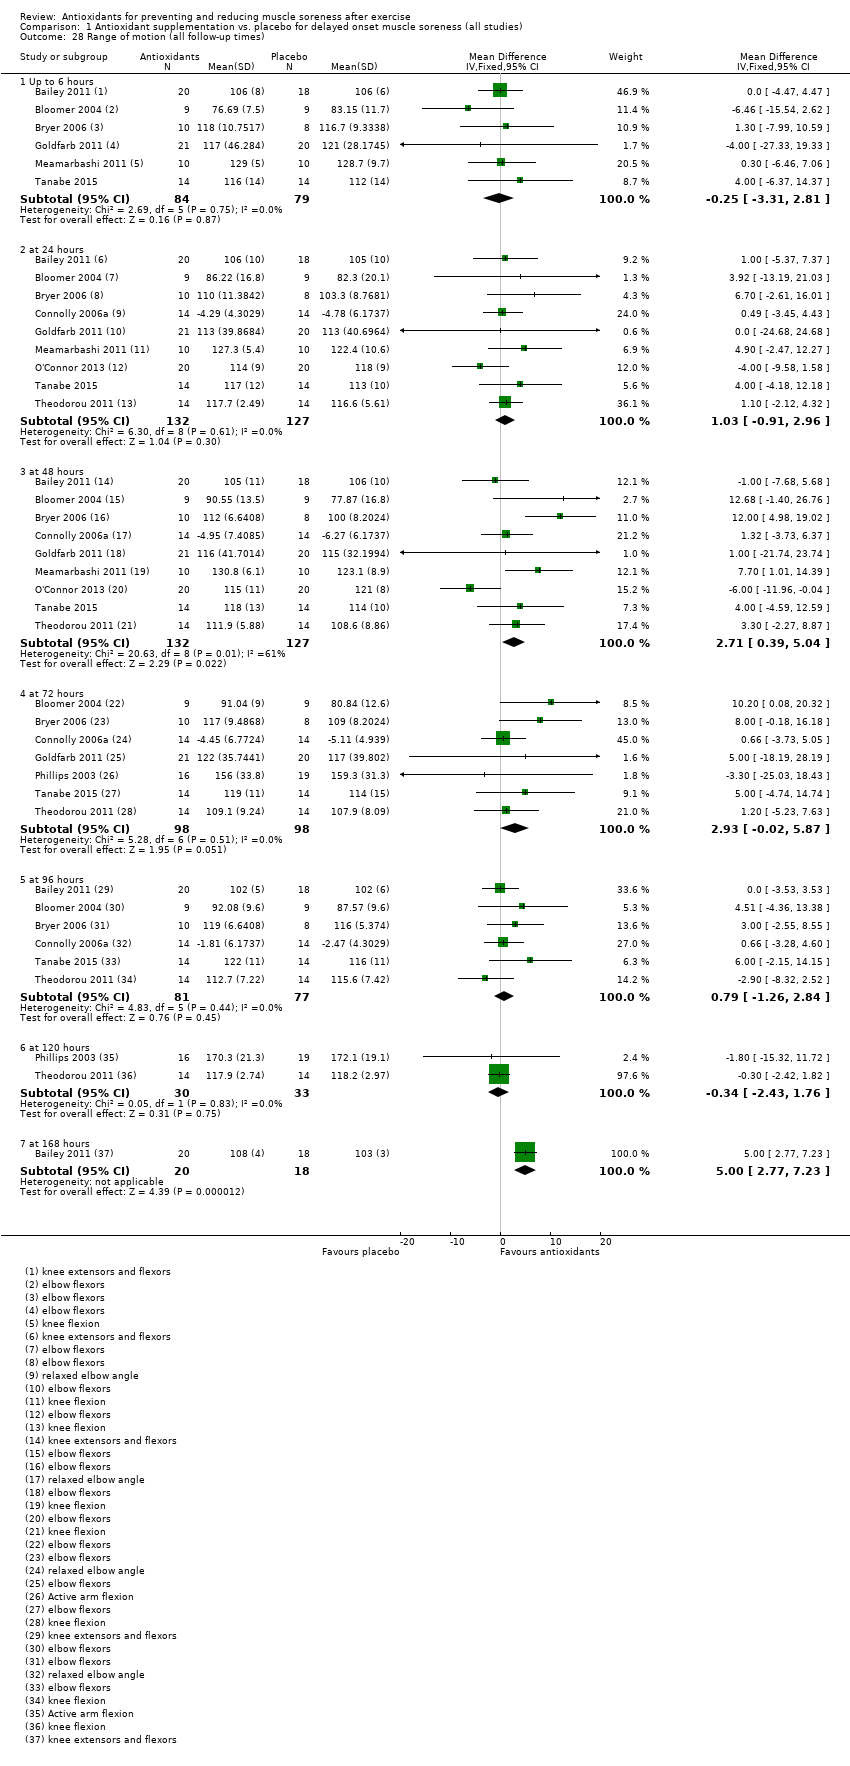
Comparison 1 Antioxidant supplementation vs. placebo for delayed onset muscle soreness (all studies), Outcome 28 Range of motion (all follow‐up times).
| Antioxidants compared with placebo or no treatment for preventing and reducing muscle soreness after exercise | ||||||
| Patient or population: mainly physically active individuals1 partaking in exercise2 designed to produce delayed onset muscle soreness Settings: controlled laboratory studies and field‐based studies Intervention: antioxidant supplements3. These fell into 3 main categories: whole natural food source (e.g. bilberry juice, cherry, pomegranate juice); antioxidant extract or mixed antioxidants (e.g. black tea extract, curcumin); and vitamin C or E or both combined. Comparison: all were placebo controls | ||||||
| Outcomes | Illustrative comparative risks (95% CI) | Relative effect (95% CI) | No of participants | Quality of the evidence | Comments | |
| Assumed risk | Corresponding risk | |||||
| Control (placebo or no antioxidants) | Antioxidant supplementation | |||||
| Muscle soreness Follow‐up: immediately up to 6 hours post‐exercise | The mean level of muscle soreness in the control group ranged from 1.0 to 8.3 cm (adjusted to a 0 to 10 cm scale) | The mean level of muscle soreness after antioxidant supplementation was 0.30 standard deviations lower | SMD ‐0.30 (‐0.56 to ‐0.04) | 525 | ⊕⊕⊝⊝ | One 'rule of thumb' is that 0.2 represents a small difference, 0.5 a moderate difference and 0.8 a large difference. Based on this 'rule of thumb', this result equates to a small to moderate difference in favour of antioxidant supplementation. However, when we rescaled the data to a 0 to 10 cm scale, the MD was lower by 0.52 cm (0.95 to 0.08 cm lower). These are all under the typical MID for pain (taken here as 1.4 cm). |
| Muscle soreness Follow‐up: 24 hours | The mean level of muscle soreness in the control group ranged from 0.21 to 8.8 cm (adjusted to a 0 to 10 cm scale) | The mean level of muscle soreness after antioxidant supplementation was 0.13 standard deviations lower | SMD ‐0.13 (‐0.27 to ‐0.00) | 936 | ⊕⊕⊕⊝ | Based on the above 'rule of thumb', this result equates to a small difference in favour of antioxidant supplementation. However, when we rescaled the data to a 0 to 10 cm scale, the MD was lower by 0.17 cm (0.42 lower to 0.07 higher). These are all under the typical MID for pain (taken here as 1.4 cm). |
| Muscle soreness Follow‐up: 48 hours | The mean level of muscle soreness in the control group ranged from 0.32 to 9.56 cm (adjusted to a 0 to 10 cm scale) | The mean level of muscle soreness after antioxidant supplementation was 0.24 standard deviations lower | SMD ‐0.24 (‐0.42 to ‐0.07) | 1047 | ⊕⊕⊝⊝ | Based on the above 'rule of thumb', this result equates to a small difference in favour of antioxidant supplementation. However, when we rescaled the data to a 0 to 10 cm scale, the MD was lower by 0.41 cm (0.69 to 0.12 lower). These are all under the typical MID for pain (taken here as 1.4 cm). |
| Muscle soreness Follow‐up: 72 hours | The mean level of muscle soreness in the control group ranged from 0.5 to 8.5 cm (adjusted to a 0 to 10 cm scale) | The mean level of muscle soreness after antioxidant supplementation was 0.19 standard deviations lower | SMD ‐0.19 (‐0.38 to ‐0.00) | 657 | ⊕⊕⊕⊝ | Based on the above 'rule of thumb', this result equates to a small difference in favour of antioxidant supplementation. When we rescaled the data to a 0 to 10 cm scale, the MD was lower by 0.29 cm (0.59 lower to 0.02 higher). These are all under the typical MID for pain (taken here as 1.4 cm). |
| Muscle soreness Follow‐up: 96 hours | The mean level of muscle soreness in the control group ranged from 0.2 to 5.6 cm (adjusted to a 0 to 10 cm scale) | The mean level of muscle soreness after antioxidant supplementation was 0.05 standard deviations lower | SMD ‐0.05 (‐0.29 to 0.19) | 436 | ⊕⊕⊝⊝ | Based on the above 'rule of thumb', this result equates to a small difference in favour of antioxidant supplementation but also includes a small effect in favour of placebo or no antioxidants. However, when we rescaled the data to a 0 to 10 cm scale, the MD was lower by 0.03 cm (0.43 lower to 0.37 higher). These are all under the typical MID for pain (taken here as 1.4 cm). |
| Subjective recovery | See comment | See comment | — | See comment | — | None of the 50 studies included in this review measured subjective recovery (return to previous activities without signs or symptoms). |
| Adverse events | See comment | See comment | — | See comment 9 studies | ⊕⊝⊝⊝ | Adverse effects were considered in only 9 studies and actual events reported in 2 studies. One study reported that all 6 participants in the antioxidant supplementation group10 had diarrhoea (5 mild, 1 severe); 4 participants also reported mild indigestion. One placebo group participant also had mild indigestion. The second study reported mild gastrointestinal distress in 1 of 26 participants taking the antioxidant supplement. |
| CI: confidence interval; RR: risk ratio; MD: mean difference; MID: minimal important difference; SMD: standardised mean difference | ||||||
| GRADE Working Group grades of evidence | ||||||
| 1Although some participants were sedentary, the majority of participants were recreationally active or moderately trained athletes. No data were included from highly trained elite athletes. Most trial participants were male. 2Muscle damage was induced either mechanically (e.g. resistance‐based exercise) or through whole body aerobic exercise (e.g. running, cycling, bench stepping). 3Typically, supplementation was taken before, the day of and after exercise for up to several days. The supplements were all taken orally, either as capsules, powders or drinks. All studies used an antioxidant dosage higher than the recommended daily amount. 4In this analysis, one study tested two antioxidants compared with placebo control. 5We downgraded the quality of evidence one level for serious study limitations (high/unclear risk of bias) and one level for serious inconsistency. 6We downgraded the quality of evidence one level for serious study limitations (high/unclear risk of bias). 7In this analysis, two studies tested two antioxidants compared with placebo control. 8We downgraded the quality of evidence one level for serious study limitations (high/unclear risk of bias) and one level for serious inconsistency. 9We downgraded the quality of evidence three levels for very serious study limitations, in particular reflecting bias relating failure to record or report on adverse events by the majority of trials. 10Notably the antioxidant used was NAC (N‐acetylcysteine), which is a prescription medicine with antioxidant properties. Listed side effects of NAC include nausea, vomiting and diarrhoea or constipation. | ||||||
| Study ID | Antioxidant (type: Ex; Vit; Whole)* | Dose** | Form taken | Regimen | Started: before exercise | Duration |
| Ex: black tea extract; theaflavin | 700 mg/day | Capsule | 4 capsules daily | 9 days | 11 days | |
| Vit: vitamin E | 992 mg (1200 IU)/day | Capsule | Not known (daily) | 21 days | 31 days | |
| Ex: mixed supplement: vitamins C, E, B6, B9, B12 and zinc | 400 mg vitamin C | Capsule | 1 capsule daily | 42 days | 6 weeks | |
| Vit: vitamin E | 1200 IU | Capsule | ? | 30 days | 30 days | |
| Whole: tart cherry | 9.2 mg/mL anthocyanins | Drink | 30 mL twice daily | 3 days | 8 days | |
| Whole: tart cherry | 73.5 mg/L total anthocyanin content | Drink | 30 mL twice daily | 4 days | 7 days | |
| Vit: vitamin C, E and selenium | 268 mg vitamin E 1 g vitamin C 90 µg selenium | Capsule | 3 capsules daily | 14 days | 18 days | |
| Ex: astaxanthin | 4 mg astaxanthin 480 mg lutein | Capsule | 2 capsules daily | 21 days | 25 days | |
| Vit: vitamin C and E | 1000 mg of vitamin C 378 mg vitamin E | Capsule | 2 capsules daily | 14 days | 14 days | |
| Vit: vitamin C | 3 g/day vitamin C | Capsule | 3 capsules daily | 14 days | 18 days | |
| Vit: vitamin C | 1 g/day vitamin C | ? | ? | 0 days (day of exercise) | 14 days | |
| Ex: N‐acetyl‐cysteine | 50 mg/kg/day | Powder dissolved in water | 50 mg/kg/day once daily dissolved in 500 mL water | 1 hour | 6 days | |
| Vit: vitamin C | 1 g/day vitamin C | Capsule | 3 capsules daily | 3 days | 8 days | |
| Whole: cherry | 600 mg phenolic compounds 40 mg anthocyanins | Drink | 2 x 12 oz bottle daily | 4 days | 8 days | |
| Ex: curcumin | 400 mg/day curcumin | Capsule | 2 capsules daily | 2 days | 5 days | |
| Ex: Juice Plus powder | 7.5 mg beta‐carotene 276 mg vitamin C | Capsule | 6 capsules daily | 4 days | 8 days | |
| Vit: vitamin C and vitamin E | 100 mg of vitamin C 268 mg (400 IU) of vitamin E | Capsule | ? | 14 days | 17 days | |
| Ex: black and green tea | High‐dose = 2000 mg per Low‐dose = 1000 mg per day polyphenolic blend | Capsule | 4 capsules daily | 91 days | 91 days | |
| Whole: cherry | 600 mg phenolic compounds expressed as gallic acid equivalents, 32 g of carbohydrate and at least 40 mg of anthocyanins | Drink | 2 x 8 fl oz bottles per day | 5 days | 7 days | |
| Whole: blackcurrant nectar | 193.25 mg/day of malvidin glucosides 175.69 mg/day of cyanidin glucosides | Drink | 16 oz bottle per day | 8 days | 8 days | |
| Vit: vitamin C | 1 g/day vitamin C | Capsule | 3 capsules daily | 3 days | 10 days | |
| Ex: N‐acetyl‐cysteine and epigallocatechin gallate (EGCG) | 1800 mg/day N‐acetyl‐cysteine (NAC) 1800 mg/day epigallocatechin gallate (EGCG) | Drink | ? | 14 days | 14 days | |
| Ex: pollen extract | 30,000 units per gram of Polbax | ? | ? | 28 days | 28 days | |
| Whole: cherry | 600 mg phenolic compounds 40 mg anthocyanins | Drink | 2 x 335 mL bottles daily | 7 days | 15 days | |
| Ex: resveratrol | 600 mg/day of resveratrol | Capsules | 6 capsules daily | 7 days | 9 days | |
| Whole: bilberry juice | Total phenol content per 200 mL serving was 744.14 ± 81.75 mg (n = 3) and 80.04 ± 3.51 mg (n = 3) of total anthocyanins | Drink | 2 x 200 mL daily | 5 days | 8 days | |
| Vit: vitamin E | 992 mg/day of vitamin E (1200 IU) | Capsules | 1 capsule daily | 14 days | 14 days | |
| Whole: cherry | 9.117 mg/mL anthocyanins | Drink | 90 mL daily (2 x 30 mL) | 6 days | 6 days | |
| Ex: curcumin | 400 mg/day curcumin | Capsules | Capsules | 2 days | 6 days | |
| Whole: blueberry smoothie | Per 100 mL: total phenolics 168 mg/gallic acid equ.; anthocyanins 96.6 mg; phenolic acid 26 mg, | Drink | 200 g blueberries, 50 g banana + 200 mL apple juice daily | 0 days (day of exercise) | 4 days | |
| Ex: purslane extract | 1200 mg/day purslane extract | Capsules | 2 capsules daily | 3 days | 5 days | |
| Vit: N‐acetyl‐cysteine | 20 mg/kg/day N‐acetyl‐cysteine | Drink | 3 x 500 mL drink daily | 0 days (day of exercise) | 9 days | |
| Ex: curcumin | 2.5 g/day of curcumin | Capsules | 10 capsules daily (2 x 5 capsules) | 2.5 days | 5 days | |
| Vit: vitamin C | 800 mg/day vitamin C | Capsules | ? | 3 hours | 2 days | |
| Whole: grape juice | 1.75 mg/kg resveratrol 19.7 mg/kg catechin 12.6 mg/kg 31.7 mg/kg peonidin 125 mg/kg cyanidin 145.2 mg/kg 32.6 mg/kg quercetin 5.6 mg/kg kaempferol 6.8 mg/kg isorhamnetin | Drink (dissolved powder) | 1 serving of powder daily mixed with 236 mL of water | 45 days | 50 days | |
| Ex: quercetin | 1000 mg/day quercetin | Bar | 2 bars daily | 7 days | 7 days | |
| Whole: cocoa | 350 mg/day flavanols | Drink | 240 mL daily | 0 days (day of exercise) | 3 days | |
| Ex: mixed antioxidants | 300 mg/day tocopherols 800 mg/day docosahexaenoate 300 mg/day flavonoids of which was 100 mg hesperetin and 200 mg quercetin | Capsules | Vitamin E: 1 capsule; docosahexaenoate: 3 capsules; flavonoids: 3 capsules | 14 days | 14 days | |
| Vit: vitamin C + vitamin E | 500 mg/day vitamin C 992 mg/day (1200 IU/day) vitamin E | Capsules | ? | ? | 37 days | |
| Ex: N‐acetyl‐cysteine | 10 mg/kg/day of body mass N‐acetyl‐cysteine | Capsules | 1 capsule daily | 14 days | 21 days | |
| Vit: vitamin E | 536 mg/day (800 IU/day) vitamin E | Capsules | 1 capsule daily | 14 days | 21 days | |
| Ex: allicin | 80 mg/day allicin | Capsules | Capsules | 14 days | 16 days | |
| Ex: curcumin | 150 mg/day curcumin | Capsules | 6 capsules daily | 0 days (day of exercise; 1 hour before) | 1 day | |
| Vit: vitamin C + vitamin E | 1 g/day vitamin C 268 mg/day (1200 IU/day) vitamin E | Capsules | 1 capsule daily | 28 days | 77 days | |
| Vit: vitamin C | 1 g/day vitamin C | Drink | ? | 0 days (day of exercise; 2 hours before) | 1 day | |
| Vit: vitamin C | 1 g/day of vitamin C on day 1 followed by 400 mg/day divided into 2 doses for 12 days | Drink and capsules | 1 g given in a solution followed by 400 mg/day doses in capsules | 14 days | 14 days | |
| Vit: vitamin C | 200 mg/day vitamin C | Drink | Daily drink | 0 days (day of exercise) | 3 days | |
| Vit: vitamin C | 200 mg/day vitamin C | Drink | Daily drink | 14 days | 14 days | |
| Whole: pomegranate juice | 650 mg/day polyphenols, consisting of 95.5% ellagitannins, 3.5% ellagic acid and 1% anthocyanins | Drink | 960 mL per day (as 2 x 480 mL drinks) | 9 days | 32 days | |
| Whole: pomegranate juice | 3958 mg/L of tannins 768 mg/L anthocyanins 242 mg/L of ellagic derivatives | Drink | 500 mL per day (as 2 x 250 mL drinks) | 15 days | 44 days | |
| * Types: Extract, mixed or other (e.g. amino‐acid derivative) antioxidants; Vitamin; and Whole natural food source. | ||||||
| Study ID | Outcome measure | Score (higher = worse) | Timing post‐exercise | Data extraction |
| Muscle soreness during a squat | VAS (0 to 10 cm) | 24, 48 hours | Text (SDs from SEs) | |
| Muscle soreness during shoulder abduction, shoulder horizontal adduction and hip flexion (unloaded squat) | VAS (0 to 10 cm) | 24, 48, 72 hours | Text | |
| General soreness at the quadriceps | VAS (1 to 10 cm) | 24, 48 hours | Text | |
| General soreness at the quadriceps | VAS (0 to 10 cm) | 48 hours | Text | |
| Muscle soreness during a squat | VAS (0 to 200 mm) | 24, 48, 72 hours | Raw data provided by the authors | |
| Muscle soreness during a squat | VAS (0 to 200 mm) | 24, 48, 72 hours | Raw data provided by the authors | |
| Active movement of elbow flexion or extension, as well as following light palpitation by the investigators | VAS (0 to 10 cm) | 0, 2, 6, 24, 48, 72, 96 hours | Raw data provided by the authors | |
| Dominant leg during knee extension | VAS (0 to 10 cm) | 0, 10, 24, 48, 72, 96 hours | Raw data provided by the authors Immediate pain data used for the up to 6 hours analysis | |
| Performance of 2 (concentric‐eccentric) repetitions of the barbell bench press exercise using a standard 20 kg barbell | VAS (0 to 10 cm) | 0, 24, 48 hours | Raw data provided by the authors | |
| Delayed onset muscle soreness was assessed in a rested position and in response to palpation on the muscle of the arms | VAS (1 to 10 cm) | 0, 4, 24, 48, 72, 96 hours | Text (SDs from SEs) Immediate pain data used for the up to 6 hours analysis | |
| Delayed onset muscle soreness was measured at the gastrocnemius, anterior tibialis, hamstrings, quadriceps, gluteals (both sides) and lower back muscles | VAS (0 to 10 cm) | 0, 24, 48, 72, 96, 168, 336 hours | Raw data provided by the authors Immediate pain data used for the up to 6 hours analysis | |
| Total muscle soreness after performing a 90 degree squat | VAS (0 to 12 cm) | 0, 24, 48, 50, 72, 96, 98 hours | Raw data provided by the authors Immediate pain data used for the up to 6 hours analysis | |
| General delayed onset muscle soreness assessed at the quadriceps | VAS (0 to 10 cm) | 24, 48, 72, 96 hours | Text | |
| Pain scores were obtained by asking participants to verbally rate their overall discomfort during active elbow flexion and extension | VAS (0 to 10 cm) | 24, 48, 72, 96 hours | Text (SDs from SEs) | |
| Muscle soreness during descending and climbing stairs. The following 8 sites were measured: anterior right thigh, posterior right thigh, anterior right leg, posterior right leg, anterior left thigh, posterior left thigh, anterior left leg, posterior left leg and added together for a total score. | VAS (0 to 4) | 48 hours | Raw data provided by the authors | |
| Delayed onset muscle soreness was measured at the elbow flexor with the arm rested | VAS (1 to 10 cm) | 0, 2, 6, 24, 48, 72 hours | Text (SDs from SEs) Immediate pain data used for the up to 6 hours analysis | |
| Delayed onset muscle soreness of the quadriceps, hamstrings, gluteus, gastrocnemius and tibialis anterior | VAS (0 to 6) | 0, 24, 48, 72 hours | Raw data provided by the authors Immediate pain data used for the up to 6 hours analysis | |
| Soreness was assessed in a variety of muscle groups including the gastrocnemius, hamstrings, quadriceps, gluteus maximus, lower back, abdominals and the whole body | Likert (0 to 7) | 24, 48, 72, 96 hours | The authors of Herrlinger 2015 were contacted on 2 February 2017 and again on 18February 2017 for missing data as these were not available in the manuscript and could not be extracted from graphs. No response was received and this study was therefore included in the qualitative analysis but not the quantitative analysis. | |
| Squat down to 90 degrees (internal joint angle) rise to the start position | VAS (0 to 200 mm) | 0, 24, 48 hours | Text Immediate pain data used for the up to 6 hours analysis | |
| Full range squat with no external weight | VAS (0 to 10 cm) | 24, 48, 72 hours | Text (SDs from SEs) | |
| General delayed onset muscle soreness was monitored by self‐reporting | VAS (1 to 10 cm) | 0, 10, 24, 48, 58, 72, 96 hours | Raw data provided by the authors Immediate pain data used for the up to 6 hours analysis | |
| Delayed onset muscle soreness was assessed at the quadriceps | VAS (0 to 10 cm) | 6, 24, 48 hours | Raw data provided by the authors 6 hours post‐exercise data used for the up to 6 hours analysis | |
| General soreness | VAS (0 to 10 cm) | 24, 48, 72, 96, 120 hours | Text (SDs from SEs) | |
| General soreness in the legs | VAS (0 to 100 mm) | 0 hours | Text Immediate pain data used for the up to 6 hours analysis | |
| General soreness in both legs | VAS (0 to 10 cm) | 24 hours | Raw data provided by the authors | |
| Squat to a 90 angle and returning to a standing position | VAS (0 to 200 mm) | 0, 24, 48 hours | Text Immediate pain data used for the up to 6 hours analysis | |
| General soreness | VAS (0 to 10 cm) | 24, 48 hours | Text (SDs from SEs) | |
| Upper body, upper legs, lower legs and overall body | VAS (0 to 10 cm) | 24, 48, 72, 96, 120, 144 hours | This study was only included in the qualitative analysis because the exercise paradigm was completely different to all the other studies included in this review | |
| Muscle soreness measured using a gauge. Pressure was applied using standard force (20 to 30 N) over the distal, middle and proximal thigh in a seated position with the knee fully extended and relaxed. The 3 ratings for each quadricep were added together. | VAS (0 to 10 cm) | 24, 48, 72, 96 hours | Text (SDs from SEs) | |
| Step up (concentric muscle action) onto a 40 cm box then step down (eccentric muscular contraction) and the soreness was rated | VAS (0 to 10 cm) | 24, 48, 72 hours | Text | |
| Participants were requested to rate the general discomfort in only the quadriceps and calf regions of the right leg | VAS (0 to 6) | 0, 24, 48 hours | Text Immediate pain data used for the up to 6 hours analysis | |
| Palpation of the muscle belly and the distal region of the vastus medialis, vastus lateralis and rectus femoris after a squat | VAS (1 to 10 cm) | 0, 2, 24, 48, 72, 96, 120, 144, 168 hours | Text Immediate pain data used for the up to 6 hours analysis | |
| Pain was rated for single leg squat, walking downstairs, passive strength of the gluteals and single leg vertical jump | VAS (0 to 10 cm) | 0, 24, 48 hours | Raw data provided by the authors Immediate pain data used for the up to 6 hours analysis | |
| Perceived soreness was done during quadriceps extension | VAS (0 to 10 cm) | 0, 24, 48 hours | Text Immediate pain data used for the up to 6 hours analysis | |
| Delayed onset muscle soreness in the arm was rated in response to isometric strength measurement | VAS (0 to 100 mm) | 24, 48 hours | Text | |
| Delayed onset muscle soreness at the elbow flexor | VAS (0 to 100 mm) | 24, 48, 72, 96, 120 hours | Raw data provided by the authors | |
| Delayed onset muscle soreness at the legs | VAS (0 to 10 cm) | 24, 48 hours | Text | |
| Soreness measures were subjectively evaluated through palpitation for oedema at he elbow | VAS (0 to 10 cm) | 72, 168 hours | Text (SDs from SEs) | |
| Delayed onset muscle soreness was evaluated using a questionnaire employing a visual analogue scale for a total of 8 sites (6 sites on the anterior muscle of the upper leg and 2 sites on the posterior muscles of the upper leg). The participants were asked to palpate the relaxed muscle and rate soreness. | VAS (1 to 10 cm) (x 8): 8 to 80 score | 24, 48 hours | Text | |
| Delayed onset muscle soreness at the elbow flexor | VAS (0 to 10 cm) | 48, 96, 168 hours | Text | |
| Muscle soreness of the biceps muscle was assessed | VAS (0 to 10 cm) | 48, 96, 168 hours | Text (SDs from SEs) | |
| At the beginning of the exercise test, participants were instructed to give CR‐10 values | Borg CR (0‐10) | 0, 24, 48 hours | Text (SDs from SEs) Immediate pain data used for the up to 6 hours analysis | |
| Palpitation of the upper arm and passively extending the elbow joint | VAS (0 to 100 mm) | 0, 24. 48, 72, 96 hours | Raw data provided by the authors Immediate pain data used for the up to 6 hours analysis | |
| Squat using body weight | VAS (0 to 10 cm) | 24, 48, 72, 96, 120 hours | Text | |
| Actively contracted the quadriceps | VAS (1 to 10 cm) | 24, 48, 72 hours | Text (SDs from SEs); there are no decimal places; where SE = 0, we have put this as 0.4 (SD = 1.2) | |
| Actively contracted the quadriceps | VAS (0 to 100 mm) | 24, 48, 72 hours | Text (SDs from SEs) | |
| Actively contracted the quadriceps | VAS (1 to 10 cm) | 24, 48, 72 hours | Text (SDs from SEs); there are no decimal places; where SE = 0, we have put this as 0.4 (SD = 1.1313) | |
| Actively contracting the leg extensors against resistance equivalent to 75% of each individual's 1 repetition maximum | VAS (0 to 10 cm) | 24, 48, 72 hours | Raw data provided by the authors | |
| Unloaded elbow flexion of the tested arm | VAS (0 to 10 cm) | 2, 24, 48, 72, 96 hours | Raw data provided by the authors 2 hours post‐exercise data used for the up to 6 hours analysis | |
| Unloaded elbow flexion and knee extension on the tested arm and leg | VAS (0 to 10 cm) | 2, 24, 48, 72, 96 hours | Raw data provided by the authors 2 hours post‐exercise data used for the up to 6 hours analysis | |
| SD: standard deviation | ||||
| Follow‐up times | No. studies | No. participants | SMD (95% CI) |
| Up to 6 hours | 21 | 525 | ‐0.31 (‐0.49 to ‐0.13) |
| 24 hours | 41 | 936 | ‐0.13 (‐0.26 to ‐0.00) |
| 48 hours | 45 | 1047 | ‐0.22 (‐0.34 to ‐0.09) |
| 72 hours | 28 | 657 | ‐0.17 (‐0.33 to ‐0.02) |
| 96 hours | 17 | 436 | ‐0.04 (‐0.23 to 0.16) |
| 120 hours | 4 | 128 | 0.25 (‐0.12 to 0.61) |
| 144 hours | 1 | 20 | ‐0.23 (‐1.11 to 0.65) |
| 168 hours | 4 | 80 | ‐0.04 (‐0.48 to 0.41) |
| CI: confidence interval | |||
| Follow‐up times | All studies | Parallel group studies only | ||
| No. studies | SMD (95% CI) | No. studies | SMD (95% CI) | |
| Up to 6 hours | 21 | ‐0.30 (‐0.56 to ‐0.04) | 15 | ‐0.35 (‐0.67 to ‐0.03) |
| 24 hours | 41 | ‐0.13 (‐0.27 to 0.00) | 32 | ‐0.08 (‐0.25 to 0.08) |
| 48 hours | 45 | ‐0.24 (‐0.42 to ‐0.07) | 34 | ‐0.19 (‐0.40 to 0.01) |
| 72 hours | 28 | ‐0.19 (‐0.38 to ‐0.00) | 22 | ‐0.11 (‐0.30 to 0.08) |
| 96 hours | 17 | ‐0.05 (‐0.29 to 0.19) | 12 | 0.01 (‐0.33 to 0.34) |
| Table produced independently of the authors by Newton Opiyo and checked by Helen Handoll | ||||
| Outcome or subgroup title | No. of studies | No. of participants | Statistical method | Effect size |
| 1 Muscle soreness up to 6 hours; random‐effects model Show forest plot | 21 | 525 | Std. Mean Difference (IV, Random, 95% CI) | ‐0.30 [‐0.56, ‐0.04] |
| 2 Muscle soreness at 24 hours; random‐effects model Show forest plot | 41 | 936 | Std. Mean Difference (IV, Random, 95% CI) | ‐0.13 [‐0.27, 0.00] |
| 3 Muscle soreness at 48 hours; random‐effects model Show forest plot | 45 | 1047 | Std. Mean Difference (IV, Random, 95% CI) | ‐0.24 [‐0.42, ‐0.07] |
| 4 Muscle soreness at 72 hours; random‐effects model Show forest plot | 28 | 657 | Std. Mean Difference (IV, Random, 95% CI) | ‐0.19 [‐0.38, ‐0.00] |
| 5 Muscle soreness at 96 hours; random‐effects model Show forest plot | 17 | 436 | Std. Mean Difference (IV, Random, 95% CI) | ‐0.05 [‐0.29, 0.19] |
| 6 Muscle soreness (follow‐ups: 120, 144 and 168 hours); random‐effects model Show forest plot | 7 | Std. Mean Difference (IV, Random, 95% CI) | Subtotals only | |
| 6.1 at 120 hours | 4 | 128 | Std. Mean Difference (IV, Random, 95% CI) | 0.21 [‐0.26, 0.69] |
| 6.2 at 144 hours | 1 | 20 | Std. Mean Difference (IV, Random, 95% CI) | ‐0.23 [‐1.11, 0.65] |
| 6.3 at 168 hours | 4 | 80 | Std. Mean Difference (IV, Random, 95% CI) | ‐0.04 [‐0.48, 0.41] |
| 7 Muscle soreness up to 6 hours ‐ all at same scale (0 to 10; worst pain) Show forest plot | 21 | 525 | Mean Difference (IV, Random, 95% CI) | ‐0.52 [‐0.95, ‐0.08] |
| 8 Muscle soreness at 24 hours ‐ all at same scale (0 to 10; worst pain) Show forest plot | 41 | 936 | Mean Difference (IV, Random, 95% CI) | ‐0.17 [‐0.42, 0.07] |
| 9 Muscle soreness at 48 hours ‐ all at same scale (0 to 10; worst pain) Show forest plot | 45 | 1047 | Mean Difference (IV, Random, 95% CI) | ‐0.41 [‐0.69, ‐0.12] |
| 10 Muscle soreness at 72 hours ‐ all at same scale (0 to 10; worst pain) Show forest plot | 28 | 657 | Mean Difference (IV, Random, 95% CI) | ‐0.29 [‐0.59, 0.02] |
| 11 Muscle soreness at 96 hours ‐ all at same scale (0 to 10; worst pain) Show forest plot | 17 | 436 | Mean Difference (IV, Random, 95% CI) | ‐0.03 [‐0.43, 0.37] |
| 12 Muscle soreness at 24 hours. Subgroup analysis by type of exercise (whole body aerobic vs. mechanically induced) Show forest plot | 41 | 936 | Std. Mean Difference (IV, Random, 95% CI) | ‐0.13 [‐0.27, 0.00] |
| 12.1 Whole body aerobic exercise | 17 | 338 | Std. Mean Difference (IV, Random, 95% CI) | ‐0.07 [‐0.33, 0.18] |
| 12.2 Mechanically induced | 24 | 598 | Std. Mean Difference (IV, Random, 95% CI) | ‐0.18 [‐0.34, ‐0.01] |
| 13 Muscle soreness at 48 hours. Subgroup analysis by type of exercise (whole body aerobic vs. mechanically induced) Show forest plot | 45 | 1047 | Std. Mean Difference (IV, Random, 95% CI) | ‐0.24 [‐0.42, ‐0.07] |
| 13.1 Whole body aerobic exercise | 17 | 349 | Std. Mean Difference (IV, Random, 95% CI) | ‐0.12 [‐0.47, 0.23] |
| 13.2 Mechanically induced | 28 | 698 | Std. Mean Difference (IV, Random, 95% CI) | ‐0.31 [‐0.50, ‐0.12] |
| 14 Muscle soreness at 24 hours. Subgroup analysis by funding sources (funded by food company or provider of antioxidant supplements vs. not funded by food company or provider of antioxidant supplements) Show forest plot | 40 | 920 | Std. Mean Difference (IV, Fixed, 95% CI) | ‐0.13 [‐0.26, 0.01] |
| 14.1 Company funding | 17 | 427 | Std. Mean Difference (IV, Fixed, 95% CI) | ‐0.11 [‐0.31, 0.08] |
| 14.2 Other funding | 23 | 493 | Std. Mean Difference (IV, Fixed, 95% CI) | ‐0.14 [‐0.32, 0.05] |
| 15 Muscle soreness at 48 hours. Subgroup analysis by funding sources (funded by food company or provider of antioxidant supplements vs. not funded by food company or provider of antioxidant supplements) Show forest plot | 44 | 1031 | Std. Mean Difference (IV, Fixed, 95% CI) | ‐0.21 [‐0.34, ‐0.09] |
| 15.1 Company funding | 18 | 443 | Std. Mean Difference (IV, Fixed, 95% CI) | ‐0.19 [‐0.38, 0.00] |
| 15.2 Other funding | 26 | 588 | Std. Mean Difference (IV, Fixed, 95% CI) | ‐0.23 [‐0.40, ‐0.06] |
| 16 Muscle tenderness measured in Newtons (all follow‐up times) Show forest plot | 2 | Mean Difference (IV, Fixed, 95% CI) | Subtotals only | |
| 16.1 at 24 hours | 2 | 52 | Mean Difference (IV, Fixed, 95% CI) | ‐1.60 [‐7.64, 4.45] |
| 16.2 at 48 hours | 2 | 52 | Mean Difference (IV, Fixed, 95% CI) | ‐2.14 [‐9.48, 5.19] |
| 16.3 at 72 hours | 2 | 52 | Mean Difference (IV, Fixed, 95% CI) | ‐0.34 [‐6.55, 5.86] |
| 16.4 at 96 hours | 2 | 52 | Mean Difference (IV, Fixed, 95% CI) | ‐2.32 [‐9.62, 4.99] |
| 17 Muscle tenderness measured in kg (all follow‐up times) Show forest plot | 2 | Mean Difference (IV, Fixed, 95% CI) | Subtotals only | |
| 17.1 Up to 6 hours | 1 | 20 | Mean Difference (IV, Fixed, 95% CI) | ‐0.61 [‐14.10, 12.88] |
| 17.2 at 24 hours | 2 | 36 | Mean Difference (IV, Fixed, 95% CI) | 0.53 [‐0.95, 2.01] |
| 17.3 at 48 hours | 2 | 36 | Mean Difference (IV, Fixed, 95% CI) | 0.52 [‐1.08, 2.13] |
| 17.4 at 72 hours | 1 | 20 | Mean Difference (IV, Fixed, 95% CI) | ‐1.03 [‐13.01, 10.95] |
| 17.5 at 96 hours | 1 | 20 | Mean Difference (IV, Fixed, 95% CI) | ‐1.39 [‐15.12, 12.33] |
| 18 30‐second Wingate average peak power output (W/kg) (post 7 days of intervention) Show forest plot | 1 | Mean Difference (IV, Fixed, 95% CI) | Totals not selected | |
| 19 20 m Sprint time (s) Show forest plot | 1 | Mean Difference (IV, Fixed, 95% CI) | Totals not selected | |
| 19.1 at 24 hours | 1 | Mean Difference (IV, Fixed, 95% CI) | 0.0 [0.0, 0.0] | |
| 19.2 at 48 hours | 1 | Mean Difference (IV, Fixed, 95% CI) | 0.0 [0.0, 0.0] | |
| 19.3 at 120 hours | 1 | Mean Difference (IV, Fixed, 95% CI) | 0.0 [0.0, 0.0] | |
| 20 Maximal oxygen consumption (mL/kg/min) (post 42 days of supplementation) Show forest plot | 1 | Mean Difference (IV, Fixed, 95% CI) | Totals not selected | |
| 21 Agility (seconds) Show forest plot | 1 | Mean Difference (IV, Fixed, 95% CI) | Totals not selected | |
| 21.1 at 24 hours | 1 | Mean Difference (IV, Fixed, 95% CI) | 0.0 [0.0, 0.0] | |
| 21.2 at 48 hours | 1 | Mean Difference (IV, Fixed, 95% CI) | 0.0 [0.0, 0.0] | |
| 21.3 at 72 hours | 1 | Mean Difference (IV, Fixed, 95% CI) | 0.0 [0.0, 0.0] | |
| 22 6 second sprint maximal power (Watts) (all follow‐up times) Show forest plot | 1 | Mean Difference (IV, Fixed, 95% CI) | Totals not selected | |
| 22.1 at 24 hours | 1 | Mean Difference (IV, Fixed, 95% CI) | 0.0 [0.0, 0.0] | |
| 22.2 at 48 hours | 1 | Mean Difference (IV, Fixed, 95% CI) | 0.0 [0.0, 0.0] | |
| 22.3 at 72 hours | 1 | Mean Difference (IV, Fixed, 95% CI) | 0.0 [0.0, 0.0] | |
| 23 Maximal voluntary isometric contraction measured as percentage change from baseline Show forest plot | 15 | Mean Difference (IV, Fixed, 95% CI) | Subtotals only | |
| 23.1 Up to 6 hours | 11 | 255 | Mean Difference (IV, Fixed, 95% CI) | 5.86 [3.29, 8.42] |
| 23.2 at 24 hours | 15 | 375 | Mean Difference (IV, Fixed, 95% CI) | 2.51 [0.99, 4.04] |
| 23.3 at 48 hours | 15 | 375 | Mean Difference (IV, Fixed, 95% CI) | 4.46 [2.94, 5.98] |
| 23.4 at 72 hours | 11 | 277 | Mean Difference (IV, Fixed, 95% CI) | 3.92 [0.88, 6.96] |
| 23.5 at 96 hours | 9 | 252 | Mean Difference (IV, Fixed, 95% CI) | 5.29 [3.65, 6.92] |
| 23.6 at 168 hours | 2 | 36 | Mean Difference (IV, Fixed, 95% CI) | ‐7.96 [‐15.96, 0.05] |
| 24 Maximal voluntary isometric contraction measured in Newton metres Show forest plot | 6 | Mean Difference (IV, Fixed, 95% CI) | Subtotals only | |
| 24.1 Up to 6 hours | 3 | 84 | Mean Difference (IV, Fixed, 95% CI) | ‐1.50 [‐4.77, 1.76] |
| 24.2 at 24 hours | 6 | 148 | Mean Difference (IV, Fixed, 95% CI) | ‐0.63 [‐6.27, 5.01] |
| 24.3 at 48 hours | 6 | 148 | Mean Difference (IV, Fixed, 95% CI) | 0.80 [‐5.46, 7.06] |
| 24.4 at 72 hours | 4 | 94 | Mean Difference (IV, Fixed, 95% CI) | ‐3.62 [‐11.91, 4.67] |
| 24.5 at 96 hours | 3 | 96 | Mean Difference (IV, Fixed, 95% CI) | ‐4.65 [‐16.21, 6.92] |
| 24.6 at 120 hours | 2 | 58 | Mean Difference (IV, Fixed, 95% CI) | ‐5.89 [‐19.14, 7.36] |
| 24.7 at 168 hours | 1 | 38 | Mean Difference (IV, Fixed, 95% CI) | 58.0 [13.57, 102.43] |
| 25 Maximal voluntary isometric contraction measured in Newtons Show forest plot | 6 | Mean Difference (IV, Fixed, 95% CI) | Subtotals only | |
| 25.1 Up to 6 hours | 4 | 73 | Mean Difference (IV, Fixed, 95% CI) | 6.50 [‐55.11, 68.10] |
| 25.2 at 24 hours | 5 | 87 | Mean Difference (IV, Fixed, 95% CI) | 23.03 [‐23.18, 69.24] |
| 25.3 at 48 hours | 5 | 87 | Mean Difference (IV, Fixed, 95% CI) | 34.87 [‐17.80, 87.55] |
| 25.4 at 72 hours | 4 | 70 | Mean Difference (IV, Fixed, 95% CI) | ‐5.11 [‐73.42, 63.19] |
| 25.5 at 96 hours | 1 | 20 | Mean Difference (IV, Fixed, 95% CI) | ‐112.0 [‐265.08, 41.08] |
| 25.6 at 168 hours | 1 | 18 | Mean Difference (IV, Fixed, 95% CI) | ‐225.0 [‐534.90, 84.90] |
| 26 Maximal voluntary isometric contraction measured in Newton metres per kg of body mass Show forest plot | 2 | Mean Difference (IV, Fixed, 95% CI) | Totals not selected | |
| 26.1 Up to 6 hours | 2 | Mean Difference (IV, Fixed, 95% CI) | 0.0 [0.0, 0.0] | |
| 26.2 at 24 hours | 2 | Mean Difference (IV, Fixed, 95% CI) | 0.0 [0.0, 0.0] | |
| 26.3 at 48 hours | 2 | Mean Difference (IV, Fixed, 95% CI) | 0.0 [0.0, 0.0] | |
| 26.4 at 72 hours | 2 | Mean Difference (IV, Fixed, 95% CI) | 0.0 [0.0, 0.0] | |
| 26.5 at 96 hours | 1 | Mean Difference (IV, Fixed, 95% CI) | 0.0 [0.0, 0.0] | |
| 26.6 at 120 hours | 1 | Mean Difference (IV, Fixed, 95% CI) | 0.0 [0.0, 0.0] | |
| 26.7 at 144 hours | 1 | Mean Difference (IV, Fixed, 95% CI) | 0.0 [0.0, 0.0] | |
| 26.8 at 168 hours | 1 | Mean Difference (IV, Fixed, 95% CI) | 0.0 [0.0, 0.0] | |
| 27 Maximal voluntary isometric contraction measured in kg Show forest plot | 1 | Std. Mean Difference (IV, Fixed, 95% CI) | Totals not selected | |
| 27.1 at 24 hours | 1 | Std. Mean Difference (IV, Fixed, 95% CI) | 0.0 [0.0, 0.0] | |
| 27.2 at 48 hours | 1 | Std. Mean Difference (IV, Fixed, 95% CI) | 0.0 [0.0, 0.0] | |
| 28 Range of motion (all follow‐up times) Show forest plot | 10 | Mean Difference (IV, Fixed, 95% CI) | Subtotals only | |
| 28.1 Up to 6 hours | 6 | 163 | Mean Difference (IV, Fixed, 95% CI) | ‐0.25 [‐3.31, 2.81] |
| 28.2 at 24 hours | 9 | 259 | Mean Difference (IV, Fixed, 95% CI) | 1.03 [‐0.91, 2.96] |
| 28.3 at 48 hours | 9 | 259 | Mean Difference (IV, Fixed, 95% CI) | 2.71 [0.39, 5.04] |
| 28.4 at 72 hours | 7 | 196 | Mean Difference (IV, Fixed, 95% CI) | 2.93 [‐0.02, 5.87] |
| 28.5 at 96 hours | 6 | 158 | Mean Difference (IV, Fixed, 95% CI) | 0.79 [‐1.26, 2.84] |
| 28.6 at 120 hours | 2 | 63 | Mean Difference (IV, Fixed, 95% CI) | ‐0.34 [‐2.43, 1.76] |
| 28.7 at 168 hours | 1 | 38 | Mean Difference (IV, Fixed, 95% CI) | 5.0 [2.77, 7.23] |