Leukoreduction for the prevention of adverse reactions from allogeneic blood transfusion
Abstract
Background
A blood transfusion is an acute intervention, implemented to solve life and health‐threatening conditions on a short‐term basis. However, blood transfusions have adverse events, some of them potentially related to immune modulation or to a direct transmission of infectious agents (e.g. cytomegalovirus). Leukoreduction is a process in which the white blood cells are intentionally reduced in packed red blood cells (PRBCs) in order to reduce the risk of adverse reactions. The potential benefits of leukoreduced PRBCs in all types of transfused patients for decreasing infectious and non‐infectious complications remain unclear.
Objectives
To determine the clinical effectiveness of leukoreduction of packed red blood cells for preventing adverse reactions following allogeneic blood transfusion.
Search methods
We ran the most recent search on 10th November 2015. We searched the Cochrane Injuries Group's Specialised Register, Cochrane Central Register of Controlled Trials (CENTRAL, the Cochrane Library), MEDLINE (OvidSP), Embase(OvidSP), CINAHL Plus (EBSCO), LILACS (BIREME), and clinical trials registers. In addition, we checked the reference lists of all relevant trials and reviews identified in the literature searches.
Selection criteria
Randomised clinical trials including patients of all ages requiring PRBC allogeneic transfusion. Any study was eligible for inclusion, regardless of the length of participant follow‐up or country where the study was performed. The primary outcome was transfusion‐related acute lung injury (TRALI). Secondary outcomes were death from any cause, infection from any cause, non‐infectious complications and any other adverse event.
Data collection and analysis
At least two review authors independently performed study selection, 'Risk of bias' assessments and data extraction. We estimated pooled relative risk for dichotomous outcomes, and we measured statistical heterogeneity using I² statistic. The random‐effects model was used to synthesise results. We conducted a trial sequential analysis to assess the risk of random errors in cumulative meta‐analyses.
Main results
Thirteen studies, most including adult patients, met the eligibility criteria. We found no clear evidence of an effect of leukoreduced PRBC versus non‐leukoreduced PRBC in patients that were randomised to receive transfusion for the following outcomes:
TRALI: RR 0.96, 95% CI 0.67 to 1.36, P = 0.80 from one trial reporting data on 1864 trauma patients. The accrued information of 1864 participants constituted only 28.5% of the diversity‐adjusted required information size (DARIS) of 6548 participants. The quality of evidence was low.
Death from any cause: RR 0.81, 95% CI 0.58 to 1.12, I² statistic = 63%, P = 0.20 from nine trials reporting data on 6485 cardiovascular surgical patients, gastro‐oncology surgical patients, trauma patients and HIV infected patients. The accrued information of 6485 participants constituted only 55.3% of the DARIS of 11,735 participants. The quality of evidence was very low.
Infection from any cause: RR 0.80, 95% CI 0.62 to 1.03, I² statistic = 84%, P = 0.08 from 10 trials reporting data on 6709 cardiovascular surgical patients, gastro‐oncology surgical patients, trauma patients and HIV infected patients. The accrued information of 6709 participants constituted only 60.6% of the DARIS of 11,062 participants. The quality of evidence was very low.
Adverse events: The only adverse event reported as an adverse event was fever (RR 0.81, 95% CI 0.64 to 1.02; I² statistic= 0%, P = 0.07). Fever was reported in two trials on 634 cardiovascular surgical and gastro‐oncology surgical patients. The accrued information of 634 participants constituted only 84.4% of the DARIS of 751 participants. The quality of evidence was low.
Incidence of other non‐infectious complications: This outcome was not assessed in any included trial.
Authors' conclusions
There is no clear evidence for supporting or rejecting the routine use of leukoreduction in all patients requiring PRBC transfusion for preventing TRALI, death, infection, non‐infectious complications and other adverse events. As the quality of evidence is very low to low, more evidence is needed before a definitive conclusion can be drawn.
PICO
Plain language summary
White blood cells reduction in packed red blood cell transfusions for preventing adverse reactions
Background
A blood transfusion is when blood is taken from one person and given to another person. Blood transfusions are given to solve life and health‐threatening medical conditions on a short‐term basis. However, blood transfusions have adverse events, some of them potentially related to an immune system response or due to the transmission of infectious agents (e.g. Human Immunodeficiency Virus). Leukoreduction is a process in which the white blood cells are intentionally removed from donated blood in order to reduce the risk of adverse reactions in people receiving the blood transfusion. The benefits of removing white blood cells with the intent of reducing infectious and non‐infectious complications in all types of transfused patients remains unclear. Removing white blood cells is costly. The USA and UK spend tens of millions each year on the procedure. In the USA, the procedure costs approximately USD $30 for each unit of blood product. It may not be worth spending so much money if there is no clear benefit to patients.
Clinical question
What are the benefits and harms of removing white blood cells from donated blood for people receiving a blood transfusion?
Study characteristics
We searched medical journals for reports of clinical trials which examined the effects of removing white blood cells from donated blood. We were interested in finding out whether the removal of white blood cells from donated blood resulted in patients receiving a blood transfusion having few complications such as transfusion‐related acute lung injury, death, infectious and non‐infectious complications, or any other adverse event. We included people of any age or sex, who received a blood transfusion for any reason. The evidence is based on studies retrieved up to 05 December 2014.
Main results
We found 13 studies which included people who received a blood transfusion during heart or cancer surgery, or because they were injured, had cancer, HIV or sepsis.
We found no clear evidence showing either benefits or harms for removing white blood cells from donated blood. For all of the outcomes examined (transfusion‐related acute lung injury, death from any cause, infection from any cause, non‐infectious complication or any other adverse event), there was no sign of benefit or harm.
Quality of evidence
The overall quality of evidence of the included studies ranges from very low to low. None of the studies included enough people to give a definitive answer about the usefulness of removing white blood cells from donated blood. New high‐quality studies, involving a few thousand people, are needed to enable us to know the true benefits and harms of this procedure.
Authors' conclusions
Summary of findings
| Leukoreduced PRBCs versus non‐leukoreduced PRBCs for preventing adverse reaction from allogeneic blood transfusion | ||||||
| Patient or population: Patients receiving RBC transfusion | ||||||
| Outcomes | Illustrative comparative risks* (95% CI) | Relative effect | Number of participants | Quality of the evidence | Comments | |
| Assumed risk | Corresponding risk | |||||
| Non‐leukoreduced packed RBCs | Leukoreduced packed RBCs | |||||
| TRALI | Study population | RR 0.96 | 1864 | ⊕⊕⊝⊝ | TSA yielded an inconclusive result. | |
| 63 per 1000 | 61 per 1000 | |||||
| Death due to any cause | Study population | RR 0.81 | 6485 | ⊕⊝⊝⊝ | TSA yielded an inconclusive | |
| 93 per 1000 | 76 per 1000 | |||||
| Infection from any cause | Study population | RR 0.80 | 6709 | ⊕⊝⊝⊝ | TSA yielded an inconclusive | |
| 204 per 1000 | 163 per 1000 | |||||
| Adverse events | Study population | RR 0.81 | 634 | ⊕⊕⊝⊝ | TSA yielded an inconclusive | |
| 387 per 1000 | 314 per 1000 | |||||
| Non‐infectious complication | Study population | Not estimable | — | — | No trial assessed this outcome. | |
| Not estimable | Not estimable | |||||
| *The basis for the assumed risk was the median control group risk across studies. The corresponding risk (and its 95% CI) is based on the assumed risk in the comparison group and the relative effect of the intervention (and its 95% CI). | ||||||
| GRADE Working Group grades of evidence | ||||||
| 1Downgraded by two due to imprecision: small sample size as compared with the calculated DARIS and the wide CI overlapping zones of no effect, as well as potential harm or benefit, or both. Few events reported. 3Downgraded due to: high risk of bias (Seven of 10 included studies were at high or unclear risk of bias, ‐1); important heterogeneity (I² statistic: 84%, ‐2); and imprecision due to the CI crossing the threshold of meaningful effect and an insufficient sample size as compared with the DARIS (‐1) 4Downgraded due to: high risk of bias (All included studies evaluated were at high risk of bias, ‐1) and imprecision due to the CI crossing the threshold of meaningful effect and an insufficient sample size as compared with the DARIS (‐1). | ||||||
Background
Description of the condition
Blood transfusion is the infusion of both soluble and cell‐associated forms (red blood cells (RBCs), white blood cells (WBCs) and platelets) into a recipient (Vamvakas 2001). A blood transfusion is an acute intervention, implemented to solve life and health‐threatening conditions on a short‐term basis; and in general, its long‐term effects tend to be of secondary importance (Tsai 2010).
However, blood transfusion is associated with an increasing risk of infectious and non‐infectious adverse events (Wagner 2004; Hendrickson 2009; Sachs 2010). The incidence of non‐infectious transfusion reactions is greater than that of infectious complications (Lavoie 2011). Mortality associated with non‐infectious risks is also significantly higher and accounts for 87% to 100% of fatal complications of transfusions (Lavoie 2011).
The main non‐infectious adverse events to the patient are transfusion‐related acute lung injury (TRALI), which is considered the most severe non‐infectious complication (Renaudier 2009; Triulzi 2009; Vamvakas 2009); non‐haemolytic febrile transfusion reaction (NHFTR) (King 2004; Blajchman 2006; Hoffman 2008) and allergic reactions (Tenorio 2007). Less frequent are transfusion‐associated graft‐versus‐host disease (TA‐GVHD) (Dwyre 2008; Hoffman 2008; Rühl 2009) and transfusion‐related with an immunomodulation effect (TRIM) (Vamvakas 2006).
Several approaches have been considered to prevent adverse reactions related to transfusion (Martí‐Carvajal 2010; Lavoie 2011; Lindholm 2011; Tobian 2011). Transfusion of leukocyte‐reduced RBC concentrates is one of those approaches (Blajchman 2010; Blumberg 2010; Mukagatare 2010). Leukocytes (WBCs) in blood components can mediate febrile transfusion reactions, stimulate human leukocyte antigen (HLA) alloimmunization in transfusion recipients, and transmit some cell‐associated pathogens such as cytomegalovirus (CMV). Therefore, it is desirable to remove WBCs from transfusable blood components (Galel 2009).
Appendix 1 shows non‐infectious transfusion reaction definitions related to WBCs.
Description of the intervention
Leukoreduction is a process in which the WBCs are intentionally reduced by almost 99.99% in RBC concentrates (Shapiro 2004). There are many methods to conduct this approach; however, this process is currently performed using selective leukoreduction filters (Galel 2009). According to the U.S. Food and Drug Administration (FDA), leukocyte‐reduced RBC concentrates contain fewer than 5 × 10⁶ WBCs/unit and at least 85% of the original RBCs (Galel 2009), and according to the Council of Europe < 1 × 10⁶ total WBC/unit. Usually, most RBC leukofiltration is performed by blood collection centres within the first few days after collection (Galel 2009).
Leukoreduction in trauma patients
Safe transfusion products are a necessity for the successful treatment of trauma patients (Tien 2007; Theusinger 2009). It is unclear if leukoreduction of RBC concentrates is the best method of providing blood products for trauma patients (Nathens 2006; Phelan 2007; Watkins 2008). Retrospective studies have shown a reduction of infectious complications in injured patients treated with leukoreduced AlloBT; this effect appears more pronounced in patients receiving massive transfusion (> 6 units of PRBC) (Friese 2008).
Leukoreduction in surgery
Several studies have focused on the advantages of leukoreduced PRBC cells for transfusion in cardiac surgery (van de Watering 1998; Dzik 2002; Wallis 2002; Bilgin 2004; van Hilten 2004; Connery 2005); colorectal surgery (Jensen 1992; Houbiers 1994; Jensen 1996; Titlestad 2001; Dzik 2002; Skånberg 2007); gastrointestinal surgery (Tartter 1998; Dzik 2002; van Hilten 2004); and renal transplantation (Sanfilippo 1985; Opelz 1997; Hiesse 2001). However, some of the findings of these published trials are considered controversial. Furthermore, this approach has been used in patients with AIDS; but, is unclear if this alternative method is beneficial in this population (Collier 2001).
How the intervention might work
Leukoreduction works through multiple mechanisms for preventing adverse reactions:
-
To prevent TRALI: avoiding the transfer of leukocytes and reducing the cellular antibody interaction complexes that damage the endothelium of the lung (Triulzi 2009; Sachs 2011).
-
To avoid post‐transfusion infections through reducing some cell‐associated pathogens, such as CMV (Bilgin 2004; Blajchman 2004; van Hilten 2004; Connery 2005; Friese 2008).
-
To prevent immunomodulation: donor WBCs may suppress the recipient's immune system by interacting with it, producing susceptibility to many pathological conditions including cancer recurrence and other malignancies (Blajchman 2002; Dellinger 2004; Flohé 2007).
Why it is important to do this review
This Cochrane review is important for the following reasons:
Firstly, leukoreduction is expensive. About EUR 29 million/year are spent on implementing leukoreduction (AETSA 2007). Other studies reported costs ranging from CAD $26 million to 46 million annually (CCOHTA 1998). One study estimated the total cost of implementing leukoreduction was about USD 600 million dollars per year in USA (Shapiro 2004). It has also been reported that leukoreduction results in an increase of approximately USD 30/unit of blood product (Phelan 2007). More recently, Tsantes 2014 reported an incremental cost‐effectiveness ratio (ICER) of EUR 6916 to prevent one case of febrile non‐haemolytic transfusion reactions (FNHTR). Secondly, the potential role of leukoreduction for decreasing mortality and infection is controversial (AETSA 2007; Mukagatare 2010). Thirdly, several studies and meta‐analyses did not report conclusive results about leukoreduction, and showed methodological inconsistencies (Vamvakas 1996; Blumberg 1998; Jensen 1998; Fergusson 2004; Blumberg 2007; Vamvakas 2007). Therefore, it is important to conduct this Cochrane review to determine the potential benefits of leukoreduction procedure in patients requiring RBC concentrates, focused on the prevention of adverse reaction.
Objectives
To determine the clinical effectiveness of leukoreduction of packed red blood cells for preventing adverse reactions following allogeneic blood transfusion.
Methods
Criteria for considering studies for this review
Types of studies
Randomised controlled trials (RCTs).
Types of participants
Patients requiring allogeneic packed RBC (PRBC) transfusion. Patients could be of any age.
Types of interventions
Intervention
-
Leukoreduced PRBCs.
Comparison
-
Non‐leukoreduced PRBCs.
We applied no limitations to the leukoreduction procedures used.
Types of outcome measures
Primary outcomes
-
Incidence of TRALI.
Secondary outcomes
-
Death due to any cause.
-
Infection from any cause (number of patients out of the total randomised).
-
Non‐infectious complications (Appendix 1).
-
Any other adverse event: “any untoward medical occurrence that may present during treatment with a pharmaceutical product but which does not necessarily have a causal relationship with this treatment” (Nebeker 2004).
We took the information size for the primary outcome of this Cochrane review from the relative risk reported in Nathens 2006. This study included trauma patients. A total sample size of 8781 participants was defined to assess a relative risk reduction on TRALI events of 25%, from a baseline incidence in the control of 6.31% (alpha level of 5% and power of 90%).
Search methods for identification of studies
In order to reduce publication and retrieval bias we did not restrict our search by language, date or publication status.
Electronic searches
The Cochrane Injuries Group Trials Search Co‐ordinator searched the following:
-
Cochrane Injuries Group Specialised Register (10/11/2015)
-
Cochrane Central Register of Controlled Trials (CENTRAL, the Cochrane Library) (issue 10 of 12, 2015)
-
MEDLINE (OvidSP) (1950 to November week 1, 2015)
-
Embase + Embase Classic (OvidSP) (1947 to 10/11/2015)
-
LILACS (BIREME) (1982 to 10/11/2015)
-
CINAHL Plus (EBSCO) (1937 to 10/11/2015)
-
Clinicaltrials.gov (www.clinicaltrials.gov) (10/1/2015)
-
WHO International Clinical Trials Registry Platform (http://apps.who.int/trialsearch/) (10/11/2015)
We have reported the search strategies in Appendix 2. We adapted the MEDLINE search strategy as necessary for the other databases. To the MEDLINE search strategy we added the Cochrane Highly Sensitive Search Strategy for identifying RCTs. To the EMBASE strategy we added the terms of the search strategy and study design terms as used by the UK Cochrane Centre (Lefebvre 2011).
Searching other resources
We also searched the following websites (25 November 2014):
-
US FDA (http://www.fda.gov).
-
European Medicines Agency (http://www.emea.europa.eu).
-
Scirus (www.scirus.com).
-
American Association of Blood Banks (AABB) (http://www.aabb.org).
-
Transfusion Evidence Library (http://transfusionguidelines.org).
In addition, we checked the reference lists of all relevant trials and reviews identified.
Data collection and analysis
We summarised data according to standard Cochrane methodologies, including the Cochrane Handbook of Systematic Reviews for Interventions (Higgins 2011) and the Methodological Expectations for Cochrane Intervention Reviews (MECIR) (Chandler 2013).
Selection of studies
Two review authors, Daniel Simancas‐Racines (DSR) and Ingrid Arévalo‐Rodriguez (IAR), independently assessed for inclusion all the potential studies identified from the literature searches. We consulted a third review author, Arturo Martí‐Carvajal (AMC) for any disagreements, which were resolved through discussion and consensus.
Data extraction and management
Two review authors, DSR and IAR, independently extracted data from the included trials. We consulted AMC and Dimelza Osorio (DO) in the event of any disagreements, which we resolved through discussion and consensus. Data were recorded for: eligibility criteria, demographics (age, gender and country), type of surgery, setting of the patients (i.e. cardiac surgery, intensive care unit (ICU)) outcomes. DSR recorded the data into a database. IAR and DO checked the data entered.
We contacted the trial author when a full‐text article was unavailable (see Appendix 3 for details).
Assessment of risk of bias in included studies
Two review authors, DSR and IAR, independently assessed the quality of each trial using a simple form following the domain‐based evaluation as described in the Cochrane Handbook for Systematic Reviews of Interventions (Higgins 2011). We compared the assessments and discussed any discrepancies between the review authors. We consulted a third review author (AMC) to resolve any disagreement and to reach consensus.
For each included trial, we assessed risk of bias (as low, high or unclear) for each of the following domains:
-
Generation of random sequence (selection bias).
-
Concealment of treatment allocation (selection bias).
-
Blinding of participants and personnel (person delivering treatment) to treatment allocation (performance bias).
-
Blinding of outcome assessors to treatment allocation (detection bias).
-
Completeness of the outcome data (including checks for possible attrition bias through withdrawals, loss to follow‐up and protocol violations). For the incomplete outcome data domain, we considered as a high risk of bias RCTs that losses participants after transfusion intervention. Additionally, we considered high risk of bias (design bias) as those studies in which the patients were not transfused because inconsistency to determine inclusion criteria adequately or when a premature randomisation was done.
-
Selective reporting of outcomes (reporting bias).
-
Other sources of bias (other bias).
Measures of treatment effect
All outcomes in this Cochrane review were binary outcomes. We calculated the treatment effect with risk ratios (RRs) with 95% confidence intervals (CI).
Unit of analysis issues
The unit of analysis was the patient. We collected and analysed a single measurement for each outcome from each patient.
Dealing with missing data
We assessed the percentages of the overall dropouts for each included trial and per each randomisation arm, and we evaluated whether an intention‐to‐treat (ITT) analysis had been performed or could be performed with the available published information. We defined these dropouts as the percentage of lost patients who received an effective transfusion, over the total of transfused patients reported for each arm of the included studies.
Assessment of heterogeneity
We quantified statistical heterogeneity using the I² statistic. The I² statistic describes the percentage of total variation across trials that is due to heterogeneity rather than sampling error (Higgins 2003). We considered I² statistic between 50% and 74% as a moderate statistical heterogeneity, whereas a value of ≥ 75% represents high heterogeneity. We explored heterogeneity using a sensitivity analysis.
Assessment of reporting biases
We created a funnel plot to assess reporting bias for each outcome (Sterne 2011) where there were data from at least 10 trials (Higgins 2011).
Data synthesis
We summarized sufficiently comparable trials using the random‐effects model to accommodate the high heterogeneity, and used a fixed‐effect model for the sensitivity analysis. We carried out the main analysis based on the number of randomised participants, using an ITT analysis. All the analyses were carried out using RevMan 2014.
Subgroup analysis and investigation of heterogeneity
No data were available to perform the following subgroup analyses for the primary outcome (incidence of TRALI):
-
By type of post‐transfusion complication.
-
By technique or type of material used.
-
Immunosuppressed patient versus non‐immunosuppressed patient.
-
Massive transfusion (> 6 units PRBCs) versus less.
Sensitivity analysis
We performed the following sensitivity analysis for the primary outcome:
-
To assess the robustness of estimates, we used both fixed‐effect and random‐effects models for all outcomes and compared results.
-
We conducted a sensitivity analysis comparing trials with low risk of bias, with those at unclear or high risk of bias, according to attrition bias (Higgins 2011).
-
We also conducted a sensitivity analysis based on transfused patients to explore the high heterogeneity.
Trial sequential analysis
We carried out a trial sequential analysis (TSA) for every dichotomous outcome evaluated in this systematic review: TRALI, death from any cause, infection from any cause, and adverse events/fever.
TSA is a type of statistical power analysis that can be used to further investigate the relevance of results ("strength of evidence") yielded by a meta‐analysis (Wetterslev 2008). It is the counterpart of a sample size calculation as part of a conventional study design. TSA allows researchers to differentiate between "spurious" significant findings caused by random error in a data‐set with only small numbers of participants and trials and a "truly" significant result with sufficient statistical power. Thereby, TSA also accounts for repeated significance testing. The optimal information size and O'Brien‐Fleming alpha‐spending boundaries indicating the "real" significance threshold are constructed by providing the numbers for alpha level, power, control group risk and inter‐study heterogeneity (Thorlund 2011). TSA can be performed only if the information size (number of participants) is large enough as compared with the optimal information size, and only if the outcome is dichotomous. Further details can be found in the "User Manual for Trial Sequential Analysis (TSA)", provided by the Centre for Clinical Intervention Research of the Copenhagen Trial Unit (Thorlund 2011).
'Summary of findings' tables
We used the GRADE approach (Guyatt 2011b) to assess the overall quality of evidence. The GRADE approach appraises the quality of a body of evidence based on the extent to which one can be confident that an estimate of effect or association reflects the item being assessed. The quality of a body of evidence considers within‐study risk of bias (methodological quality), the directness of the evidence, heterogeneity of the data, precision of effect estimates and risk of publication bias (Balshem 2011; Brozek 2011; Guyatt 2011a; Guyatt 2011c; Guyatt 2011d; Guyatt 2011e; Guyatt 2011f; Guyatt 2011g; Guyatt 2011h). We created a ‘Summary of Findings’ table using GRADEpro GDT Guideline Development Tool (www.gradepro.org). We have presented the body of evidence in summary of findings Table for the main comparison.
Results
Description of studies
See the Included studies section.
Results of the search
We identified 6244 references. Thirteen RCTs met our inclusion criteria (Sanfilippo 1985; Jensen 1996; Tartter 1998; van de Watering 1998; Collier 2001; Titlestad 2001; Wallis 2002; Bilgin 2004; van Hilten 2004; Boshkov 2006; Nathens 2006; Lapierre 2007; Donati 2014). See Figure 1.
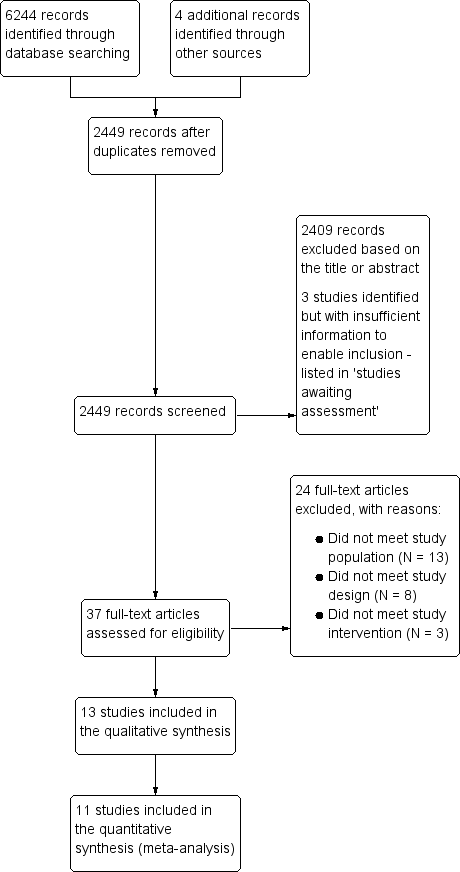
Study flow diagram.
We did not find any ongoing trials. Three studies were classified as awaiting assessment (Zhao 2004; NCT00810810; Waghmare 2012). There is insufficient information available about these studies to enable us to decide whether or not they should be included in the review. See Characteristics of studies awaiting classification.
Included studies
Methodology characteristics
Trials were published between 1985 and 2014. They were conducted in various countries: five in the USA (Sanfilippo 1985; Tartter 1998; Collier 2001; Boshkov 2006; Nathens 2006), three in the Netherlands (van de Watering 1998; Bilgin 2004; van Hilten 2004), two in Denmark (Jensen 1996; Titlestad 2001), one in France (Lapierre 2007), one in the UK (Wallis 2002) and one in Italy (Donati 2014).
All trials had a parallel study design; 11 comparing two groups and two trials comparing three groups (van de Watering 1998; Wallis 2002). The number of trial participants ranged from 20 (Donati 2014) to 1864 (Nathens 2006), with a median of 531 participants.
In three trials participants were monitored for one month or less (Jensen 1996; Nathens 2006; Donati 2014). In 10 trials participants were monitored for between two and 15 months. In 11 trials there was an a priori sample size estimation, and one trial did not report how the sample size was derived (Sanfilippo 1985). In one trial the data used were taken from the report's abstract, and there was no information about the sample size calculation (Boshkov 2006). All trials used patients as the randomisation unit and unit of analysis. All trials reported inclusion criteria. Exclusion criteria were not reported in the Boshkov 2006 study abstract.
Patient characteristics
All 13 included trials were conducted in adults, but two trials also included patients under 18 years of age: Collier 2001 (≥ 14 years) and Nathens 2006 (≥ 17 years). Twelve trials reported the gender of the participants; almost 60% of the included participants were men. Five trials involved cardiac surgery patients (van de Watering 1998; Wallis 2002; Bilgin 2004; van Hilten 2004; Boshkov 2006), four trials involved gastro‐oncology surgery patients (Jensen 1996; Titlestad 2001; van Hilten 2004; Lapierre 2007), one trial involved non‐surgical oncology patients (Lapierre 2007), one trial involved trauma patients (Nathens 2006), one trial included HIV infected patients (Collier 2001) and one trial involved patients with sepsis, severe sepsis or septic shock requiring ICU care (Donati 2014).
Interventions
Leukoreduction definition
The extent of leukoreduction differed across the studies: two studies obtained 0.1 to 0.3 × 10⁶ per unit (Bilgin 2004; Titlestad 2001). Three trials reported 5 × 10⁶ leukocytes per unit of blood after leukoreduction (Collier 2001; Wallis 2002; Nathens 2006). Jensen 1996 reported 1.2 × 10⁹ per unit; van de Watering 1998 reported 1.2 ± 1.4 × 10⁶ per unit; Tartter 1998 reported 2 × 10⁵ per unit; and Lapierre 2007 less than 2 × 10⁴ per unit. Four studies did not report definitions for leukoreduction (Sanfilippo 1985; van Hilten 2004; Boshkov 2006; Donati 2014).
Type of filters
Trials were conducted using different types of filters. Two trials used "Cellselect Optima" filters (Bilgin 2004; van de Watering 1998). Four trials used "BPF4" filters for blood leukoreduction (Tartter 1998; Titlestad 2001; Wallis 2002; Nathens 2006). Jensen 1996 used "RC 100" filters and two trials used "Sepacell RZ‐200B1" filters (Lapierre 2007; Donati 2014). Four trials did not report the type of filter used (Sanfilippo 1985; Collier 2001; van Hilten 2004; Boshkov 2006).
Control groups
Trials were conducted using different types of comparator groups. Five trials used "Buffy coat depleted packed cells (PCs)" as a comparison group (Jensen 1996; van de Watering 1998; Wallis 2002; Bilgin 2004; van Hilten 2004). Eight trials used "unmodified RBC transfusion" or standard RBCs as a comparison group (Sanfilippo 1985; Tartter 1998; Collier 2001; Titlestad 2001; Boshkov 2006; Nathens 2006; Lapierre 2007; Donati 2014). One trial also used "Red blood cells concentrate with plasma reduction" as a third non‐leukoreduced arm (Wallis 2002).
Cointervention
Three studies described the use of platelets as co‐intervention (Collier 2001; Bilgin 2004; Nathens 2006). Bilgin 2004 reported that platelets were all leukocyte‐depleted by filtration; Collier 2001 did not describe the platelet leukoreduction process, and Nathens 2006 reported that all patients received apheresis platelets when platelets were required. Lapierre 2007 reported that none of the patients received platelets concentrate.
Outcomes
One trial reported on TRALI (Nathens 2006).
Nine trials reported on death from any cause (Jensen 1996; van de Watering 1998; Collier 2001; Titlestad 2001; Wallis 2002; Bilgin 2004; van Hilten 2004; Nathens 2006; Lapierre 2007). Boshkov 2006 reported death only for the transfused patients group.
Ten trials reported on infection from any cause (Jensen 1996; Tartter 1998; van de Watering 1998; Collier 2001; Titlestad 2001; Wallis 2002; Bilgin 2004; van Hilten 2004; Nathens 2006; Lapierre 2007) the infections reported were: respiratory tract infections in six studies (Jensen 1996; van de Watering 1998; Titlestad 2001; Bilgin 2004; Nathens 2006; Lapierre 2007); urinary tract infections in five studies (Jensen 1996; van de Watering 1998; Bilgin 2004; Nathens 2006; Lapierre 2007); wound infections or surgical site infections in seven studies (Jensen 1996; Tartter 1998; van de Watering 1998; Titlestad 2001; Bilgin 2004; Nathens 2006; Lapierre 2007); bacteraemia or septicaemia in seven studies (Jensen 1996; van de Watering 1998; Collier 2001; Titlestad 2001; Bilgin 2004; Nathens 2006; Lapierre 2007); abdominal infection in three studies (Jensen 1996; Titlestad 2001; Nathens 2006). Collier 2001 included persons infected with HIV and CMV.
Three trials reported adverse events (Collier 2001; Wallis 2002; Lapierre 2007). One trial, Collier 2001, analysed fever episodes per transfusion, but not per study participant, thus it was not included in the meta‐analysis.
Donati 2014 and Sanfilippo 1985 reported only physiological outcomes. There were no relevant data to include in the analyses.
Excluded studies
We excluded 24 studies (see Characteristics of excluded studies) for the following reasons:
-
Use of other blood products in the intervention groups (Gilbert 1989; Jensen 1992; Houbiers 1994; Bowden 1995; Kao 1995; Gu 1996; Nielsen 1999; Hayashi 2000; Dzik 2002; Efstathiou 2003; Connery 2005; Gu 2009).
-
No transfusion in one of the study groups (Opelz 1997; de Vries 2004; Koskenkari 2005; Leal‐Noval 2005; Salamonsen 2005; So‐Osman 2010).
-
Non‐randomised clinical trial (Bracey 2002; de Vries 2003; Llewelyn 2004; Skånberg 2007), or a review article (van de Watering 2004; Vamvakas 2007).
Risk of bias in included studies
We have summarised the risk of bias in the included studies in Figure 2 and Figure 3.

'Risk of bias' graph: review authors' judgements about each 'Risk of bias' item presented as percentages across all included studies.
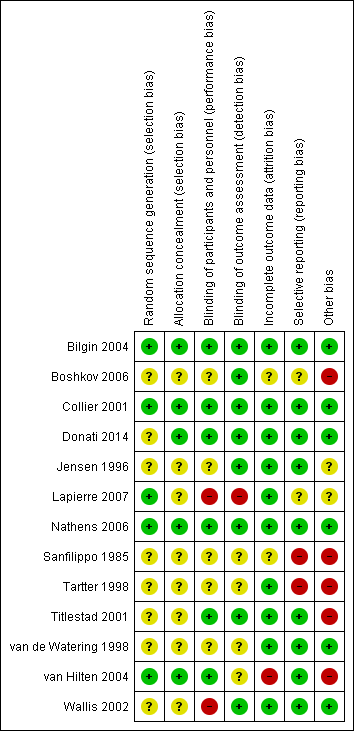
'Risk of bias' summary: review authors' judgements about each 'Risk of bias' item for each included study.
Allocation
Random sequence generation
In five trials there was low risk of bias related to the sequence generation method (Collier 2001; Bilgin 2004; van Hilten 2004; Nathens 2006; Lapierre 2007). Eight trials had unclear risk of bias (Sanfilippo 1985; Jensen 1996; Tartter 1998; van de Watering 1998; Titlestad 2001; Wallis 2002; Boshkov 2006; Donati 2014).
Allocation concealment
In five trials there was low risk of bias related to the method of allocation concealment (Collier 2001; Bilgin 2004; van Hilten 2004; Nathens 2006; Donati 2014). Eight trials had unclear risk of bias (Sanfilippo 1985; Jensen 1996; Tartter 1998; van de Watering 1998; Titlestad 2001; Wallis 2002; Boshkov 2006; Lapierre 2007).
Blinding
Blinding of participants and personnel
The risk of bias arising from the lack of blinding was rated as low in six trials (Collier 2001; Titlestad 2001; Bilgin 2004; van Hilten 2004; Nathens 2006; Donati 2014). The risk of bias from blinding was unclear in five trials (Sanfilippo 1985; Jensen 1996; Tartter 1998; van de Watering 1998; Boshkov 2006) and high in two studies (Wallis 2002; Lapierre 2007).
Blinding outcome assessment
Eight trials had a low risk of bias arising from the method of blinding outcome assessment (Jensen 1996; Collier 2001; Titlestad 2001; Wallis 2002; Bilgin 2004; Boshkov 2006; Nathens 2006; Donati 2014). Four studies were at unclear risk (Sanfilippo 1985; Tartter 1998; van de Watering 1998; van Hilten 2004) and one trial was at high risk of bias (Lapierre 2007).
Incomplete outcome data
Ten trials were judged to be at low risk of bias from incomplete outcome data (Jensen 1996; Tartter 1998; van de Watering 1998; Collier 2001; Titlestad 2001; Wallis 2002; Bilgin 2004; Nathens 2006; Lapierre 2007; Donati 2014). There was unclear risk of bias in two trials (Sanfilippo 1985; Boshkov 2006), and high risk of bias in one trial (van Hilten 2004).
Selective reporting
We judged nine trials as at low risk of reporting bias (Jensen 1996; van de Watering 1998; Collier 2001; Titlestad 2001; Wallis 2002; Bilgin 2004; van Hilten 2004; Nathens 2006; Donati 2014). Two trials were at unclear risk of bias (Boshkov 2006; Lapierre 2007), and two trials were at high risk of bias (Sanfilippo 1985; Tartter 1998).
Other potential sources of bias
Six trials appeared free of other potential sources of bias and we judged these trials to be at low risk of bias (van de Watering 1998; Collier 2001; Wallis 2002; Bilgin 2004; Nathens 2006; Donati 2014). Seven trials had design bias of different kinds: inconsistency in adequately determining inclusion criteria, premature randomisation (Sanfilippo 1985; Tartter 1998; van de Watering 1998; Titlestad 2001; van Hilten 2004; Boshkov 2006) or sample size bias (Lapierre 2007).
Effects of interventions
Leukoreduced PRBC versus non‐leukoreduced PRBC
1. Primary outcomes
TRALI (analysis based on total randomised patients)
Overall analysis
One trial including 1864 participants showed no difference between treatment groups on TRALI (6.02% versus 6.31%) (RR 0.96, 95% CI 0.67 to 1.36; P = 0.80) (Nathens 2006). See Analysis 1.1.
Quality of evidence (TSA and GRADE)
The accrued information of 1864 participants constituted only 28.5% of the diversity‐adjusted required information size (DARIS) of 6548 participants. We calculated DARIS based on a diversity of 4%; a proportion with the TRALI events of 6.3% in the control group; a relative risk reduction of 25%; an alpha of 5%; and a beta of 20% (power = 80%). With the inclusion of data from one trial, the Z‐value neither crossed the conventional statistical boundaries of 5% nor the Lan‐DeMets‐O'Brian‐Fleming boundaries. The TSA‐adjusted 95% CI overlapped with no effect (RR 1.0) and is compatible with both a potential benefit and a potential harm (RR 0.46 and RR 1.98, respectively); thus, the TSA yielded an inconclusive result. The quality of evidence was low (imprecision as reflected in the wide CI and only one trial with a small sample size as compared with the DARIS (‐2)).
In the analysis including "only transfused patients", compared to all patients results were similar (RR 0.98, 95% CI 0.74 to 1.29; P = 0.87; Analysis 2.1). We were unable to conduct other subgroup and sensitivity analyses because only one study measured this outcome. In this study, Nathens 2006, leukoreduction was performed pre‐storage.
2. Secondary outcomes
Death due to any cause
Overall analysis (total randomised patients)
The meta‐analysis of nine trials including 6485 participants showed no difference between treatment groups in the risk of death from any cause (8.54% versus 9.34%; RR 0.81, 95% CI 0.58 to 1.12, I² statistic = 63%, P = 0.20) (Jensen 1996; van de Watering 1998; Collier 2001; Titlestad 2001; Wallis 2002; Bilgin 2004; van Hilten 2004; Nathens 2006; Lapierre 2007). See Analysis 1.2.
Sensitivity analysis
We conducted three sensitivity analyses; none of which were statistically significant. The RRs using the fixed‐effect model were similar to that of the random effect model.
-
Including three studies with low risk of bias (Collier 2001; Bilgin 2004; Nathens 2006), compared to six studies at unclear or high risk of bias (RR 1.03, 95% CI 0.89 to 1.20; I² statistic = 38%, P = 0.66).
-
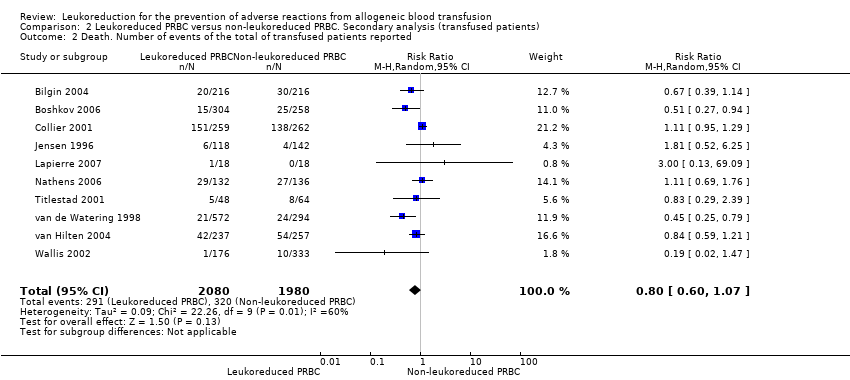
Including "only transfused patients", compared to all patients (RR 0.80, 95% CI 0.60 to 1.07, I² statistic: 60%, P = 0.13, Analysis 2.2).
-
Post‐storage leukoreduction, compared with pre‐storage leukoreduction (RR 0.74, 95% CI 0.53 to 1.04, I² statistic: 70%, P = 0.09).
Reporting bias
We did not explore reporting biases since the meta‐analysis included fewer than 10 studies (Higgins 2011).
Quality of evidence (TSA and GRADE)
The accrued information of 6485 participants constituted only 55.2% of the DARIS of 11,735 participants. DARIS was calculated based on a diversity of 84%; a proportion of death from any cause of 9.34% in the control group (median proportion of deaths in the control group); a relative risk reduction of 25%; an alpha of 5%; and a beta of 20% (power = 80%). The Z‐value neither crossed the conventional statistical boundaries of 5% nor the Lan‐DeMets‐O'Brian‐Fleming boundaries. The TSA did not indicate futility, as the cumulative Z‐curve did not cross the futility wedge (Figure 4). The TSA‐adjusted 95% CI overlapped with no effect (RR 1.0) and is compatible with both a potential benefit and a potential harm (RR 0.51 and RR 1.27, respectively); thus, the TSA yielded an inconclusive result. The quality of evidence was very low (high risk of bias (‐1); important heterogeneity (‐1); and imprecision as reflected in the wide CI and an insufficient accrued information size compared with the DARIS (‐1)).

TSA calculated to reliably detect a 25% relative change in the incidence of death from any cause, assuming a control group event rate of 9.34% with a power of 80% at an alpha of 5%
Infection from any cause
Overall analysis (total randomised patients)
The meta‐analysis of 10 trials involving 6709 participants showed no difference between treatment groups in the risk of infection from any cause (17.7% versus 20.4%; RR 0.80, 95% CI 0.62 to 1.03; I² statistic = 84%, P = 0.08) (Jensen 1996; Tartter 1998; van de Watering 1998; Collier 2001; Titlestad 2001; Wallis 2002; Bilgin 2004; van Hilten 2004; Nathens 2006; Lapierre 2007). See Analysis 1.3.
Sensitivity analysis
The RR was different when we used the fixed‐effect model (RR 0.85, 95% CI 0.77 to 0.93; I² statistic = 84%, P = 0.0006); however, the results of TSA indicate this statistically significant result may be a spurious finding.
We performed three other sensitivity analyses, which showed no statistically significant differences:
-
Including three studies with low risk of bias (Collier 2001; Bilgin 2004; Nathens 2006), compared with seven studies at unclear or high risk of bias (RR 0.92, 95% CI 0.63 to 1.34; I² statistic = 83%, P = 0.67).
-
Including "only transfused patients", compared with all randomised patients (RR 0.76, 95% CI 0.58 to 1.00; I² statistic = 87%, P = 0.05, Analysis 2.3), and the heterogeneity remained high.
-
Post‐storage leukoreduction, compared with pre‐storage leukoreduction (RR 0.91, 95% CI 0.76 to 1.09; I² statistic = 65%, P = 0.32).
Reporting bias
After visual assessment of the funnel plot (Figure 5) and a formal assessment of the funnel plot asymmetry, applying the Egger's test (P = 0.09), we found no sign of reporting bias.

Funnel plot of comparison: 1 Leukoreduced PRBC versus non‐leukoreduced PRBC. Main Analysis (Randomised patients), outcome: 1.3 Infection. Number of events of the total of randomised patients reported.
Quality of evidence (TSA and GRADE)
The accrued information of 6709 participants constituted only 60.6% of the DARIS of 11,062 participants. We calculated DARIS based on a diversity of 86%; a proportion of infection from any cause of 20.4% in the control group (median proportion in the control group); a relative risk reduction of 25%; an alpha of 5%; and a beta of 20% (power = 80%). The Z‐value neither crossed the conventional statistical boundaries of 5% nor the Lan‐DeMets‐O'Brian‐Fleming boundaries. TSA did not indicate futility, as the Z‐curve did not cross the futility wedge (Figure 6). The TSA‐adjusted 95% CI overlapped the zone of no effect (RR 1.0) and is compatible with both a potential benefit and a potential harm (RR 0.57 and RR 1.12, respectively); thus, the TSA yielded an inconclusive result. The quality of evidence was very low (high risk of bias (‐1); important heterogeneity (‐2); and imprecision due to the CI crossing the threshold of meaningful effect and an insufficient sample size as compared with the DARIS (‐1)).

TSA calculated to reliably detect a 25% relative change in the incidence of infection from any cause, assuming a control group event rate of 20.4% with a power of 80% at an alpha of 5%.
Adverse events (fever)
Three trials reported adverse events. However, we excluded one trial reporting fever as a temperature increase of at least 1°C per transfusion from the meta‐analysis since fever was not analysed per study participant (Collier 2001).
Overall analysis (total randomised patients)
Two trials including 634 participants showed no difference between treatment groups in adverse events (31.9% versus 38.7%; RR 0.81, 95% CI 0.64 to 1.02; I² statistic = 0%, P = 0.07) (Wallis 2002). See Analysis 1.4.
Sensitivity analysis
In the sensitivity analysis comparing "transfused patients" with randomised patients, there was a statistically significant difference (RR 0.75, 95% CI 0.60 to 0.94, I² statistic = 0%, P = 0.01, Analysis 2.4); however, the results of TSA indicate this statistically significant result may be a spurious finding.
In a sensitivity analysis of data from one study, Wallis 2002, there was no difference when comparing post‐storage with pre‐storage leukoreduction (RR 0.81, 95% CI 0.64 to 1.04).
Reporting bias
We did not explore reporting biases since the meta‐analysis included fewer than 10 studies (Higgins 2011).
Quality of evidence (TSA and GRADE)
The accrued information of 634 participants constituted only 84.4% of the DARIS of 751 participants. DARIS was calculated based on a diversity of 0%; a proportion of infection from any cause of 38.7% in the control group (median proportion in the control group); a relative risk reduction of 25%; an alpha of 5%; and a beta of 20% (power = 80%). The Z‐value neither crossed the conventional statistical boundaries of 5% nor the Lan‐DeMets‐O'Brian‐Fleming boundaries. TSA did not indicate futility, as the Z‐curve did not cross the futility wedge (Figure 7). The TSA‐adjusted 95% CI overlapped with the zone of no effect (RR 1.0) and is compatible with both a potential benefit and a potential harm (RR 0.68 and RR 1.05, respectively); thus, the TSA yielded an inconclusive result. The quality of evidence was low (high risk of bias (‐1); and imprecision due to the CI crossing the threshold of meaningful effect and an insufficient sample size as compared with the DARIS (‐1)).

TSA calculated to reliably detect a 25% relative change in the incidence of fever, assuming a control group event rate of 38.7% with a power of 80% at an alpha of 5%.
Non‐infectious complications
The included trials did not assess this pre‐defined outcome.
Discussion
Summary of main results
In this systematic review we included 13 trials involving cardiovascular surgical, gastro‐oncology surgery, trauma and HIV patients who were randomised to receive leukoreduced compared with non‐leukoreduced PRBC transfusion. After analysis of the study data, we are unable to conclude whether or not leukoreduction of PRBC has an effect on preventing TRALI (one trial), death (nine trials), infection (10 trials) and other adverse events (fever, reported in two trials). The quality of evidence was low (TRALI and adverse events) to very low (death and infection) due to high heterogeneity, imprecision and high risk of bias. None of the included trials reported on other non‐infectious complications. The sensitivity analyses of trials at low risk of bias showed neither a beneficial or harmful effect of leukoreduction of PRBC on the pooled data regarding death, infection and adverse events.
Overall completeness and applicability of evidence
Overall completeness of evidence
We analysed 13 controlled clinical trials that met our predefined inclusion criteria. Two trials reported only physiological results and we excluded them from the meta‐analyses. Only one RCT evaluated the primary outcome (TRALI). However, we obtained data from 11 trials which contributed to the effect estimates of the secondary outcomes (death from any cause, infection from any cause and adverse events/fever). We found no trials evaluating non‐infectious complications other than TRALI (e.g. FNHTR). Therefore, the pre‐specified objectives and outcomes of our Cochrane review were partially addressed and the results are inconclusive. Consequently, the findings of this review should be interpreted with caution until more data are available.
Applicability of evidence
This Cochrane review is complex for a variety of reasons:
Firstly, regarding the population: the identified studies enrolled patients with different health problems, including trauma, cancer, cardiac disease and HIV‐infected patients. Some important patient populations were not studied at all (e.g. paediatric or obstetric patients) or were insufficiently assessed (e.g. one RCT of trauma patients). In this context, external validity may be limited due to a lack of studies analysing these populations. Furthermore, the effect of leukoreduction on some types of patients without a strong indication for leukoreduced PRBC has not been sufficiently evaluated: single‐transfused patients, patients without history of FNHTR, patients who are not receiving long‐term platelet transfusions and those who are not at risk of developing CMV disease.
Secondly, regarding the intervention, the included studies did not adequately report several aspects related to the transfusion of RBC that need to be considered when interpreting the results, namely: the use of leukoreduced or non‐leukoreduced platelets as a co‐intervention, the timing of leukoreduction (i.e. pre‐storage or post‐storage), the type of filter used (e.g. Cell select Optima, BPF4, RC 100, Sepacell RZ‐200B1), leucocyte reduction definition (e.g. 0.1 to 0.3 × 10⁶ WBC/unit, 5 × 10⁶, 2 × 10⁵ per unit, etc.) and the type of transfusion (i.e. allogeneic or autologous).
Thirdly, regarding the outcomes: not all the included trials assessed relevant clinical outcomes. Relevant infections (e.g. CMV), non‐infectious complications (e.g. TRALI, FNHTR) and any other adverse events were not sufficiently assessed or reported (Schulz 2010). The various follow‐up intervals (28 days to 15 months) may represent another limitation for the assessment of outcomes.
Fourthly, regarding the costs: leukoreduction is widely implemented in clinical practice in many countries and some countries have established universal leukoreduction for blood transfusions (Laupacis 2001). However, the high costs related to this procedure deserve special attention. Even though the reintroduction of non‐leukoreduced products probably provides no clinical impact, it does entail economic consequences. Changing the strategy from performing universal to selective leukoreduction would result in an important decrease in the costs (e.g. almost EUR 30 million per year in Spain (AETSA 2007)). Tsantes 2014 reported an incremental cost‐effectiveness ratio (ICER) of EUR 6916 to prevent one case of FNHTR. Additionally, it is reasonable to consider other costs associated with maintaining dual inventories of leukoreduced PRBC and non‐leukoreduced PRBC.
Finally, as leukoreduction of PRBC was shown to have no effect on preventing TRALI, death, infection and other adverse events reported by RCTs, these results have to be adequately interpreted within the context of current clinical practice which differs internationally and among populations. Other strategies might be more cost‐effective than leukoreduction in terms of avoiding adverse events related to transfusion PRBC, such as the use of restrictive transfusion triggers (Carson 2012; Rohde 2014), that have shown effectiveness regardless of whether blood products are leukoreduced or not.
Quality of the evidence
The body of evidence available to date does not allow a definitive conclusion to be drawn about the benefits and harms of leukoreduction. The included RCTs had important methodological limitations: 1. poor and incomplete reporting of inclusion and exclusion criteria; 2. important attrition bias due to the exclusion of many patients included, but not transfused; 3. incomplete information on allocation concealment; 4. inadequate reporting of other blood components as co‐interventions; and 5. incomplete reporting of clinical outcomes of interest. Additionally, some of the included trials showed important inconsistency in the estimates of effect.
Potential biases in the review process
We applied Cochrane systematic review methodology to the search for and selection of studies for inclusion in the review. However, despite our effort to include all published studies evaluating leukoreduction for the prevention of adverse reactions from allogeneic blood transfusion, it is possible that not all relevant data were identified. The small number of trials identified in our review raises concerns about publication bias. In order to identify this potential bias we performed a funnel plot. However, this visual method was possible only for one outcome (infection of any cause), since fewer than 10 studies assessed the other outcomes.
We contacted trial authors during the identification of trials (see Appendix 3) to clarify some questions related to the eligibility criteria, but not while we completed data extraction and analysis. We took into account only published data during these processes, considering the missing information as reporting bias.
In the review protocol we defined the main analysis based on the ITT approach (Simancas‐Racines 2012). However, during the data extraction we identified an important number of patients included but not transfused. This may affect the precision of the effect estimations. In order to explore this scenario, we carried out a per‐protocol analysis (only transfused patients) which did not reflect relevant differences in relation to the primary outcome (TRALI) and secondary outcomes death and infection from any cause, but the secondary outcome adverse events (fever) showed differences.
A limitation of the review was not considering the effect of buffy coat depletion in the estimations through a sensitivity analysis, because we had not planned such analysis in advance. Another limitation was not considering the subgroup analysis of the potential effect of different types of filters used in the included studies for all outcomes. We planned this analysis in the review protocol only for the primary outcome.
Agreements and disagreements with other studies or reviews
Reviews and meta‐analyses on postoperative infection and death related to the leukoreduction of blood products have been carried out previously. However, as far as we know, no systematic reviews focused on non‐infectious complications, such as TRALI or FNHTR, have yet been published. In the overall analysis of death from any cause, the findings of other reviews are in accordance with our results. Nevertheless, one systematic review showed a 50% reduction in the probability of postoperative infection (Blumberg 2007) and another review analysing "only patients who received transfusion" found a statistically significant reduction of 40% in postoperative infection, but a non‐significant reduction in mortality (Fergusson 2004).
These two reviews have several limitations. They included studies with other blood components apart from leukoreduced PRBC cells as interventions, as well as non‐randomised studies. Moreover, heterogeneity between studies was not taken into account and the risk of bias of included studies was not appropriately assessed. Furthermore, some relevant studies were not included.

Study flow diagram.

'Risk of bias' graph: review authors' judgements about each 'Risk of bias' item presented as percentages across all included studies.

'Risk of bias' summary: review authors' judgements about each 'Risk of bias' item for each included study.
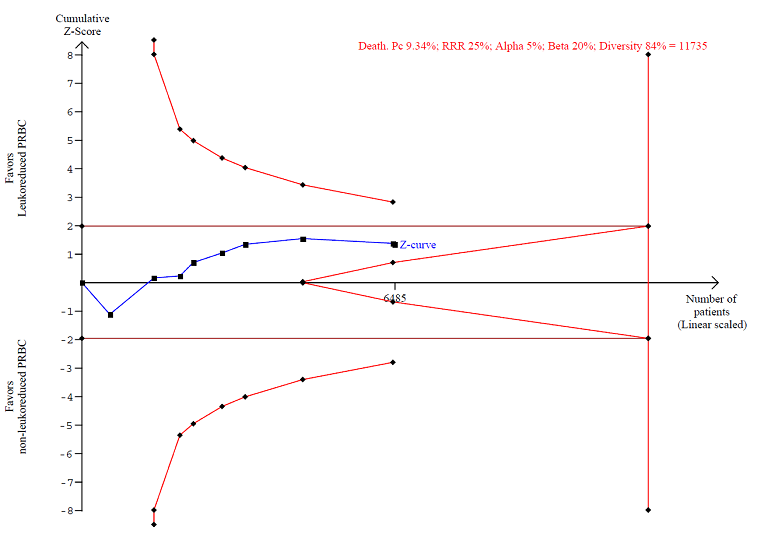
TSA calculated to reliably detect a 25% relative change in the incidence of death from any cause, assuming a control group event rate of 9.34% with a power of 80% at an alpha of 5%

Funnel plot of comparison: 1 Leukoreduced PRBC versus non‐leukoreduced PRBC. Main Analysis (Randomised patients), outcome: 1.3 Infection. Number of events of the total of randomised patients reported.

TSA calculated to reliably detect a 25% relative change in the incidence of infection from any cause, assuming a control group event rate of 20.4% with a power of 80% at an alpha of 5%.

TSA calculated to reliably detect a 25% relative change in the incidence of fever, assuming a control group event rate of 38.7% with a power of 80% at an alpha of 5%.

Comparison 1 Leukoreduced PRBC versus non‐leukoreduced PRBC. Main analysis (randomised patients), Outcome 1 TRALI. Number of events of the total of randomised patients reported.

Comparison 1 Leukoreduced PRBC versus non‐leukoreduced PRBC. Main analysis (randomised patients), Outcome 2 Death. Number of events of the total of randomised patients reported.

Comparison 1 Leukoreduced PRBC versus non‐leukoreduced PRBC. Main analysis (randomised patients), Outcome 3 Infection. Number of events of the total of randomised patients reported.
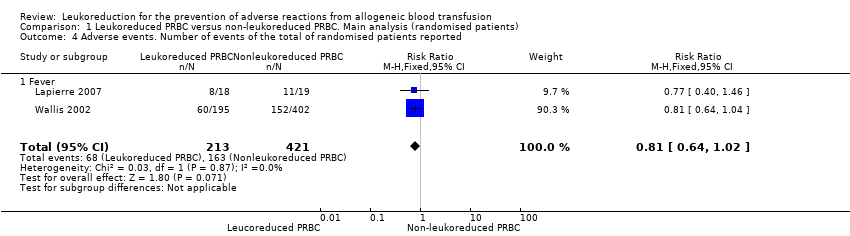
Comparison 1 Leukoreduced PRBC versus non‐leukoreduced PRBC. Main analysis (randomised patients), Outcome 4 Adverse events. Number of events of the total of randomised patients reported.
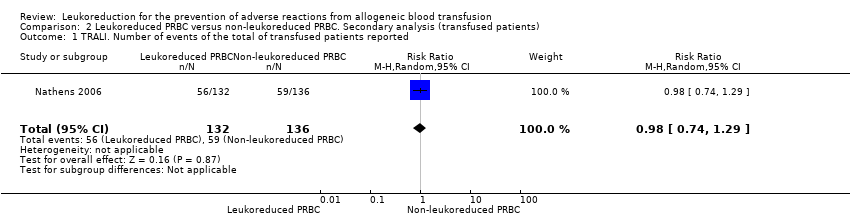
Comparison 2 Leukoreduced PRBC versus non‐leukoreduced PRBC. Secondary analysis (transfused patients), Outcome 1 TRALI. Number of events of the total of transfused patients reported.
Comparison 2 Leukoreduced PRBC versus non‐leukoreduced PRBC. Secondary analysis (transfused patients), Outcome 2 Death. Number of events of the total of transfused patients reported.

Comparison 2 Leukoreduced PRBC versus non‐leukoreduced PRBC. Secondary analysis (transfused patients), Outcome 3 Infection. Number of events of the total of transfused patients reported.

Comparison 2 Leukoreduced PRBC versus non‐leukoreduced PRBC. Secondary analysis (transfused patients), Outcome 4 Adverse events. Number of events of the total of transfused patients reported.
| Leukoreduced PRBCs versus non‐leukoreduced PRBCs for preventing adverse reaction from allogeneic blood transfusion | ||||||
| Patient or population: Patients receiving RBC transfusion | ||||||
| Outcomes | Illustrative comparative risks* (95% CI) | Relative effect | Number of participants | Quality of the evidence | Comments | |
| Assumed risk | Corresponding risk | |||||
| Non‐leukoreduced packed RBCs | Leukoreduced packed RBCs | |||||
| TRALI | Study population | RR 0.96 | 1864 | ⊕⊕⊝⊝ | TSA yielded an inconclusive result. | |
| 63 per 1000 | 61 per 1000 | |||||
| Death due to any cause | Study population | RR 0.81 | 6485 | ⊕⊝⊝⊝ | TSA yielded an inconclusive | |
| 93 per 1000 | 76 per 1000 | |||||
| Infection from any cause | Study population | RR 0.80 | 6709 | ⊕⊝⊝⊝ | TSA yielded an inconclusive | |
| 204 per 1000 | 163 per 1000 | |||||
| Adverse events | Study population | RR 0.81 | 634 | ⊕⊕⊝⊝ | TSA yielded an inconclusive | |
| 387 per 1000 | 314 per 1000 | |||||
| Non‐infectious complication | Study population | Not estimable | — | — | No trial assessed this outcome. | |
| Not estimable | Not estimable | |||||
| *The basis for the assumed risk was the median control group risk across studies. The corresponding risk (and its 95% CI) is based on the assumed risk in the comparison group and the relative effect of the intervention (and its 95% CI). | ||||||
| GRADE Working Group grades of evidence | ||||||
| 1Downgraded by two due to imprecision: small sample size as compared with the calculated DARIS and the wide CI overlapping zones of no effect, as well as potential harm or benefit, or both. Few events reported. 3Downgraded due to: high risk of bias (Seven of 10 included studies were at high or unclear risk of bias, ‐1); important heterogeneity (I² statistic: 84%, ‐2); and imprecision due to the CI crossing the threshold of meaningful effect and an insufficient sample size as compared with the DARIS (‐1) 4Downgraded due to: high risk of bias (All included studies evaluated were at high risk of bias, ‐1) and imprecision due to the CI crossing the threshold of meaningful effect and an insufficient sample size as compared with the DARIS (‐1). | ||||||
| Outcome or subgroup title | No. of studies | No. of participants | Statistical method | Effect size |
| 1 TRALI. Number of events of the total of randomised patients reported Show forest plot | 1 | 1864 | Risk Ratio (M‐H, Random, 95% CI) | 0.96 [0.67, 1.36] |
| 2 Death. Number of events of the total of randomised patients reported Show forest plot | 9 | 6485 | Risk Ratio (M‐H, Random, 95% CI) | 0.81 [0.58, 1.12] |
| 3 Infection. Number of events of the total of randomised patients reported Show forest plot | 10 | 6709 | Risk Ratio (M‐H, Random, 95% CI) | 0.80 [0.62, 1.03] |
| 4 Adverse events. Number of events of the total of randomised patients reported Show forest plot | 2 | 634 | Risk Ratio (M‐H, Fixed, 95% CI) | 0.81 [0.64, 1.02] |
| 4.1 Fever | 2 | 634 | Risk Ratio (M‐H, Fixed, 95% CI) | 0.81 [0.64, 1.02] |
| Outcome or subgroup title | No. of studies | No. of participants | Statistical method | Effect size |
| 1 TRALI. Number of events of the total of transfused patients reported Show forest plot | 1 | 268 | Risk Ratio (M‐H, Random, 95% CI) | 0.98 [0.74, 1.29] |
| 2 Death. Number of events of the total of transfused patients reported Show forest plot | 10 | 4060 | Risk Ratio (M‐H, Random, 95% CI) | 0.80 [0.60, 1.07] |
| 3 Infection. Number of events of the total of transfused patients reported Show forest plot | 10 | 3557 | Risk Ratio (M‐H, Random, 95% CI) | 0.76 [0.58, 1.00] |
| 4 Adverse events. Number of events of the total of transfused patients reported Show forest plot | 2 | 544 | Risk Ratio (M‐H, Fixed, 95% CI) | 0.75 [0.60, 0.94] |
| 4.1 Fever | 2 | 544 | Risk Ratio (M‐H, Fixed, 95% CI) | 0.75 [0.60, 0.94] |