Geräte zur Verhinderung von Stichverletzungen durch Nadeln bei medizinischem Personal
Referencias
References to studies included in this review
References to studies excluded from this review
References to studies awaiting assessment
Additional references
References to other published versions of this review
Characteristics of studies
Characteristics of included studies [ordered by study ID]
| Methods | Study design: Randomised Controlled Trial. Object of randomisation: patients | |
| Participants | Japan. Researchers and their assistants performing intravenous infusion on patients scheduled for elective surgery. Number studied: 100 patients. Intervention group n = 50. Control group n = 50. | |
| Interventions | Use of Insyte AutoGuard intravenous cannula where the needle can be retracted into a safety barrel by actively pushing a button. The control group used conventional Insyte intravenous cannula. | |
| Outcomes | (1) Number of needlestick injuries per total number of procedures; (2) blood contamination from either the inserted cannula or needle on researcher, assistant, patient or equipment; (3) blood stains on the collection tray. Measurement: (1) self‐reporting of needlestick injuries; (2) number of incidents of blood contamination by visual assessment; (3) number of blood stains with a maximum score of 10 if there were more than 10 stains. | |
| Notes | ||
| Risk of bias | ||
| Bias | Authors' judgement | Support for judgement |
| Random sequence generation (selection bias) | Unclear risk | "the patient was allocated to one of the two groups by blocked randomisation (blocks of 10). " No additional information is available on the blocked randomisation. |
| Allocation concealment (selection bias) | Unclear risk | Information about allocation concealment is not available in the article. |
| Blinding (performance bias and detection bias) | Low risk | "The presence or absence of blood on the tray was assessed by a blinded researcher" Healthcare workers could not have been blinded as they were using the devices but it is unlikely that this introduces bias. |
| Incomplete outcome data (attrition bias) | Low risk | No missing outcome data. |
| Selective reporting (reporting bias) | Low risk | Authors reported the outcomes mentioned in the method section. Information is available for the two groups for the number of attempts at insertion, ease of insertion, ease of handling needle, blood contamination, and needlestick injuries. |
| Similar recruitment of groups | Unclear risk | Patient characteristics were similar in terms of sex, age, weight and height. No information available on the characteristics of the researchers and assistants such as years of experience, professions, difference between the intervention and control groups in terms of staff. |
| Adjustment for baseline differences | Unclear risk | No information related to adjustment for baseline differences is reported. |
| Other bias | High risk | "We thank Japan Becton for supplying the Insyte and Autoguard cannulae." The involvement of a medical devices manufacturing company may have potentially introduced information bias. |
| Methods | Study design: Randomised Controlled Trial with two intervention arms and one control arm. Object of randomisation: patients. | |
| Participants | Japan. Researchers and assistants performing intravenous (n = 150) and intra‐arterial cannulations (n = 150) in elective surgery. Number studied: 300 patients. Intervention group one n = 100 (Insyte Autoguard cannula with a button for actively retracting the needle. Control group n = 100 (divided over the two intervention arms). | |
| Interventions | Arm one: Use of safeguarded needles (Insyte Autoguard) in intravenous cannulations. The control group used conventional Insyte catheter needles. | |
| Outcomes | Needlestick injuries (none detected), median number of blood contamination from inserted catheter or needles on staff, patients, equipment or tray. | |
| Notes | We combined the results of the intravenous and intra‐arterial cannulation when the same devices were used. | |
| Risk of bias | ||
| Bias | Authors' judgement | Support for judgement |
| Random sequence generation (selection bias) | Unclear risk | "In each part of the study, patients were randomly allocated intro three groups. Block randomisation (in blocks of 15) was used for the allocation. No additional information available on randomisation process. |
| Allocation concealment (selection bias) | Low risk | "cards indicating allocations were placed in a serially numbered, sealed opaque envelope?" Adequate allocation concealment. |
| Blinding (performance bias and detection bias) | Low risk | "The presence or absence of blood on a tray was assessed by a researcher who was blinded to the allocation" Healthcare workers could not have been blinded as they were using the devices but bias seems unlikely here. |
| Incomplete outcome data (attrition bias) | Low risk | No missing outcome data. |
| Selective reporting (reporting bias) | Low risk | Authors reported the outcomes mentioned in the method section: information is available for the three groups for the ease of insertion, information on the backflow, ease of handling needle, blood contamination, needlestick injuries and problems at insertion. |
| Similar recruitment of groups | Unclear risk | Patients characteristics were similar in terms of the age, weight and height. There were differences between groups for sex. No information available on the characteristics of the researchers and assistants such as years of experience, professions, difference between the intervention and control groups in terms of the staff. |
| Adjustment for baseline differences | Unclear risk | No information related to adjustment for baseline differences is reported. |
| Other bias | High risk | "We thank Japan Becton for supplying Insyte and Insyte Autoguards and Johnson & Johnson Medical for supplying protective acuvance needles." The involvement of a medical devices manufacturing company may have potentially introduced information bias. |
| Methods | Study design: Randomised Controlled Trial with two intervention arms and one control arm. Object of randomisation: patients. | |
| Participants | Japan. Researchers and assistants performing intravenous (n = 150) and intra‐arterial cannulations (n = 150) in elective surgery. Number studied: 300 patients. Intervention group two n = 100 (Protective Acuvance) cannula with a passive mechanism that retracts the needle, Control group n = 100 (divided over the two intervention arms). | |
| Interventions | Arm two: Use of safeguarded needles (Protective Acuvance) in intravenous and intra‐arterial cannulations. The control group used conventional Insyte catheter needles. | |
| Outcomes | Needlestick injuries (none detected), median number of blood contamination from inserted catheter or needles on staff, patients, equipment or tray, and median number of blood stains on tray. | |
| Notes | We combined the results of the intravenous and intra‐arterial cannulation when the same devices were used. | |
| Risk of bias | ||
| Bias | Authors' judgement | Support for judgement |
| Random sequence generation (selection bias) | Unclear risk | "In each part of the study, patients were randomly allocated intro three groups. Block randomisation (in block of 15) was used for the allocation and cards indicating allocations we placed in a serially numbered, sealed opaque envelope". |
| Allocation concealment (selection bias) | Low risk | "cards indicating allocations were placed in a serially numbered, sealed opaque envelope" |
| Blinding (performance bias and detection bias) | Low risk | "The presence or absence of blood on a tray was assessed by a researcher who was blinded to the allocation" Healthcare workers could not been blinded as they were using the devices but bias is unlikely here. |
| Incomplete outcome data (attrition bias) | Low risk | No missing outcome data. |
| Selective reporting (reporting bias) | Low risk | Authors reported on outcomes mentioned in the method section:information is available for the three groups for the ease of insertion, information on the backflow, ease of handling needle, blood contamination, needlestick injuries and problem at insertion. |
| Similar recruitment of groups | Unclear risk | Patients characteristics were similar in terms of the age, weight and height. There were differences in between groups for sex No information available on the characteristics of the researchers and assistants such as years of experience, professions, difference between the intervention and control groups in terms of the staff. |
| Adjustment for baseline differences | Unclear risk | No information related to adjustment for baseline differences is reported. |
| Other bias | High risk | "We thank Japan Becton for supplying Insyte and Insyte Autoguards and Johnson & Johnson Medical fro supplying protective acuvance needles." The involvement of a medical devices manufacturing company may have potentially introduced information bias. |
| Methods | Study design: Interrupted Time‐Series Study | |
| Participants | USA. Healthcare workers handling needles and thus with potential exposure to blood borne pathogens. Number studied: 11,161 healthcare workers for the pre‐intervention period (18 months) and 12,851 healthcare workers for the post‐intervention period (18 months). | |
| Interventions | Introduction of an intravenous catheter stylet with a safety engineered feature (a retractable protection shield). The mechanism has to be activated by the worker. Suture needles were not replaced by safety engineered needles and were thus used as control group. | |
| Outcomes | Number of percutaneous injuries per 1000 healthcare workers. | |
| Notes | Pre‐intervention rate (PI per 1000 health workers) IV catheter needle (2.5; 2.3, 2.5 for each six‐month period respectively). Total data points (n = 6). | |
| Methods | Study design: Randomised Controlled Trial. Object of randomisation: patients | |
| Participants | Turkey. Doctors who collected ABG samples from patients in the emergency care department. Number studied: 550 patients. Intervention group n = 275. Control group n = 275. | |
| Interventions | Use of safety‐engineered blood gas syringes which once in the artery filled automatically as a result of arterial pulse pressure. The control group used conventional heparinised syringes. | |
| Outcomes | (1) Number of needlestick injuries (2) Number of events of blood splashes (3) Number of attempts (4)The degree of difficulty of ABG extraction procedure according to physicians. | |
| Notes | Includes information about cost analysis. | |
| Risk of bias | ||
| Bias | Authors' judgement | Support for judgement |
| Random sequence generation (selection bias) | Unclear risk | The method of randomization carried out was not mentioned. |
| Allocation concealment (selection bias) | Low risk | Sealed envelopes were used. |
| Blinding (performance bias and detection bias) | Unclear risk | No information available. |
| Incomplete outcome data (attrition bias) | Low risk | No missing outcome data. Data available includes all physicians who performed arterial blood gas extraction procedures (n = 27). |
| Selective reporting (reporting bias) | Low risk | Pre‐specified outcomes were reported accordingly. |
| Similar recruitment of groups | Low risk | The study included patients who visited the ED during the period of May 1, 2012 to June 30, 2012. |
| Adjustment for baseline differences | Low risk | There was no significant difference between groups in terms of age, weight, sex, height, wrist circumference and BMI. |
| Other bias | Low risk | The study appears to be free of other types of bias. |
| Methods | Study design: Interrupted Time‐Series Study | |
| Participants | Canada (Ontario). Healthcare workers registered with Work place Safety and Insurance Board (a workers' compensation claims organization). Number studied 16,364 in the period (2004‐2012). The study included two intervention arms, one comprising of long‐term nursing care and the other one comprising of hospitals. | |
| Interventions | Introduction of a legislation between, 2008‐2009 for the use of safety engineered needles which includes the use of needleless devices. Individual hospital had the discretion to choose the type of safety engineered needle either passive or semi‐automatic. In the pre‐intervention period there was no use of safety engineered needles. | |
| Outcomes | Rate of needlestick injuries per 10,000 full time equivalents as reported by healthcare workers to Work place Safety and Insurance board. | |
| Notes | Total number of data points long‐term nursing care (n = 9). Total number of data points hospitals (n = 9). | |
| Methods | Study design: Randomised Controlled Trial. Object of randomisation: patients by calendar week | |
| Participants | USA. Staff of the operating theatre. Participation by attending anaesthesiologists was voluntary. Number randomised: 330 patients receiving IV catheter insertions. Intervention group n = 211. Control group n = 119. | |
| Interventions | The intervention group used Angiocath Autoguard IV catheters with retractable needles where retraction has to be activated with a button. The control group used traditional JELCO IV catheters. | |
| Outcomes | Number of spills and splatters of blood on linen, table, floor, skin or clothing per total number of procedures. Measurement: visual observations by the operating staff. | |
| Notes | ||
| Risk of bias | ||
| Bias | Authors' judgement | Support for judgement |
| Random sequence generation (selection bias) | High risk | "Assignment of catheter type was randomised by week" |
| Allocation concealment (selection bias) | Unclear risk | Researchers do not provide information on allocation concealment. |
| Blinding (performance bias and detection bias) | Unclear risk | No information available. |
| Incomplete outcome data (attrition bias) | Low risk | No missing outcome data. Data available includes all participants (n = 330). |
| Selective reporting (reporting bias) | Low risk | Pre‐specified outcomes were reported accordingly. |
| Similar recruitment of groups | Unclear risk | The intervention and control groups were recruited from the same hospital. The study was completed over 20 days, 11 days for intervention and 9 days for the control. It is unclear if patients recruited to the study differed based on the week the person was selected to participate into the study. |
| Adjustment for baseline differences | Unclear risk | No information on the adjustment for baseline difference reported. |
| Other bias | Low risk | The study appears to be free of other types of bias. |
| Methods | Study design: Interrupted Time‐Series Study | |
| Participants | USA. Registered nurses on medical and surgical wards, emergency department, intensive care unit and in the operating room performing tasks which require handling of needles. Number studied: 278 registered nurses with outcomes reported over 12 months. | |
| Interventions | Introduction of bedside needle disposal units. In the pre‐intervention period the disposal units were located in medication rooms and on medication carts. | |
| Outcomes | Number of reported needlestick per total number of healthcare personnel. Secondary outcome: recapping rate. | |
| Notes | Total number of data points (n = 12). | |
| Methods | Study design: Controlled Before and After Study | |
| Participants | UK (London). Bachelor of dental surgery students (3rd, 4th, 5th year) and dental nursing students from three hospitals in London. | |
| Interventions | Use of dental syringe that does not require re‐sheathing or removal of needle from the syringe. Control group used conventional metallic dental syringe. | |
| Outcomes | Outcome: incident reports of NSI sustained by dental students and nurse students over the period 1.2007 to 12.2008. The type of syringe system causing NSIs was not reported for the departments in the intervention and control groups. Unit: not specified. | |
| Notes | We contacted the authors but they did not respond. | |
| Risk of bias | ||
| Bias | Authors' judgement | Support for judgement |
| Random sequence generation (selection bias) | High risk | Not an RCT. |
| Allocation concealment (selection bias) | High risk | Not an RCT. |
| Blinding (performance bias and detection bias) | Unclear risk | Not reported. |
| Incomplete outcome data (attrition bias) | Unclear risk | Not reported. |
| Selective reporting (reporting bias) | High risk | Type of syringe system causing NSIs among various departments was not mentioned in the outcome. |
| Similar recruitment of groups | High risk | Same time period of recruitment but different groups recruited from different hospitals. |
| Adjustment for baseline differences | Unclear risk | No information regarding adjustment for baseline differences. |
| Other bias | Unclear risk | The study appears to be free of other types of bias. |
| Methods | Study design: Interrupted Time‐Series Study surrounding two interventions | |
| Participants | New Zealand. Laboratory staff performing venipunctures. Number studied: 644,000 venipunctures during a four‐year period. | |
| Interventions | 1. Adaption of Centers for Disease Control (CDC) guidelines on non‐recapping of needles. 2. Introduction of recapping injury prevention device Needle Guard and training on its use. In this review we only used the part on the introduction of the injury prevention device Needle Guard. The needle guard consists of a shield at the bottom of the protective cap that covers the needle. The shield should prevent a needle stick injury while the cap is placed beside the needle. Passive device because no worker intervention required. | |
| Outcomes | Number of needlestick injuries per total number of venipunctures performed. | |
| Notes | Not recapping prevention but prevention of PEI while recapping. During pre‐intervention, baseline rate estimated at 0.63 NSI per 1000 venipuncture‐years. Total number of data points (n = 39). | |
| Methods | Study design: Interrupted Time‐Series Study | |
| Participants | USA (Missouri). Healthcare workers from four medical nursing divisions and one intensive care unit approximating overall 1,095,097 employee productive hours during the 30‐month pre‐trial and nine‐month trial period . Demographics and working experience of staff not reported. | |
| Interventions | 1. Introduction of passive safety engineered device for insulin and tuberculin injections 2. Extensive training and education during pre and post intervention periods. | |
| Outcomes | NSI rate per 100,000 employee productive hours. | |
| Notes | ||
| Methods | Study design: Controlled Before and After Study | |
| Participants | USA. Staff from non‐profit hospitals. Demographics and working experience of staff not reported. Number studied: 14 hospitals (control) and 14 hospitals (interventions). Approximating overall 19,880 FTE during the two‐year study period | |
| Interventions | 1. Engineered safety features of a sharps container | |
| Outcomes | Sharp injury (a) during procedure; b) after procedure but before disposal; c) container‐associated (CASI); d) inappropriate disposal. We used the total number and the container‐related injuries to calculate intervention effects. | |
| Notes | We calculated the RR of NSI after the introduction of containers and the SE. These were put into RevMan data tables. We did not adjust for baseline difference nor for a clustering effect. | |
| Risk of bias | ||
| Bias | Authors' judgement | Support for judgement |
| Random sequence generation (selection bias) | High risk | Not an RCT. |
| Allocation concealment (selection bias) | High risk | Not an RCT. |
| Blinding (performance bias and detection bias) | Unclear risk | No information on blinding. "Staff who suffered sharp injuries were not aware of the study at the time of their injury report". However, health workers would be aware of the change in the type of devices used. |
| Incomplete outcome data (attrition bias) | Low risk | Authors reported that data on the outcome was obtained for the pre‐ and post‐intervention periods for the 14 participating hospitals. Authors do not include hospital‐level information. |
| Selective reporting (reporting bias) | Low risk | The pre‐specified outcomes are reported. |
| Similar recruitment of groups | Low risk | This study includes the same 14 hospitals for before and after intervention. There was minimum change in the number of FTE (0.6%) during the study period. |
| Adjustment for baseline differences | Unclear risk | Not reported in the analysis. |
| Other bias | Low risk | The study appears to be free of other types of bias. |
| Methods | Study design: Cluster Randomised Controlled Trial. Object of randomisation: nursing divisions. Three‐armed trial with separate control groups | |
| Participants | USA. Nursing personnel from general, medical, surgical and intensive‐care units performing intravenous therapy. Number studied: 73,454 patient days (980,392 productive hours worked). Intervention three n = 19,436. Control n = 19,550. | |
| Interventions | Use of needleless intravenous device 2‐way valve. Passive system no need for activation. Control groups used standard IV needle systems. | |
| Outcomes | Reported needlestick injures per 1000 patient‐days and 1000 productive hours worked. | |
| Notes | ||
| Risk of bias | ||
| Bias | Authors' judgement | Support for judgement |
| Random sequence generation (selection bias) | Unclear risk | "Four groups of nursing divisions were prospectively randomised to use one of the two safety devices" |
| Allocation concealment (selection bias) | Unclear risk | No information about allocation concealment is available. |
| Blinding (performance bias and detection bias) | Unclear risk | No information available on blinding. |
| Incomplete outcome data (attrition bias) | Low risk | Selected nursing division were assigned to either the intervention (MBC then replaced by PBC, and 2‐way). The MBC was replaced after four months due to staff dissatisfaction. Authors reported all outcomes data for the intervention and control group. |
| Selective reporting (reporting bias) | Unclear risk | "Intravenenous‐therapy related injuries were categorized further as follows: low‐risk injuries involved needles without direct blood contact; intermediate risk injuries involved needles likely to have occult blood present and high risk injuries involved needles in direct contact with blood." However, there is no information available based on this categorization stipulated in the method section. |
| Similar recruitment of groups | High risk | The nursing divisions selected to participate to the study were from the same hospital. The recruitment time period of 2‐way device differed from the PBC. The PBC was selected to replace the MBC (after four months) due to staff dissatisfaction. |
| Adjustment for baseline differences | Unclear risk | The demographics of the workers (age, sex, years of experience) are not reported. The adjustment for baseline differences is not reported in the analysis. |
| Other bias | High risk | "Study participants generally have ready access to the traditional devices, which may contaminate the evaluation, so much attention must be focused on appropriate experimental device distributions and traditional device removal prior to study initiation." NSI reported in the study group may have been caused by the use of the traditional device. Based on the information available, it is not possible to separate NSI caused by the new devices or traditional ones. |
| Methods | Study design: Cluster Randomised Controlled Trial. Object of randomisation: nursing divisions. Three‐armed trial with separate control groups | |
| Participants | USA. Nursing personnel from general, medical, surgical and intensive‐care units performing intravenous therapy. Number studied: 73,454 patient‐days (980,392 productive hours worked). Intervention two n = 3840. Control n = 2487 patient‐days. | |
| Interventions | Use of needleless intravenous device metal blunt cannula. Passive system no need for activation. Control groups used standard IV needle systems. | |
| Outcomes | Reported needlestick injures per 1000 patient‐days and 1000 productive hours worked. | |
| Notes | ||
| Risk of bias | ||
| Bias | Authors' judgement | Support for judgement |
| Random sequence generation (selection bias) | Unclear risk | "Four groups of nursing divisions were prospectively randomised to use one of the two safety devices" |
| Allocation concealment (selection bias) | Unclear risk | No information about allocation concealment is available. |
| Blinding (performance bias and detection bias) | Unclear risk | No information available on blinding. |
| Incomplete outcome data (attrition bias) | Low risk | Selected nursing division were assigned to either the intervention (MBC then replaced by PBC, and 2‐way). The MBC was replaced after four months due to staff dissatisfaction. Authors reported all outcomes data for the intervention and control group. |
| Selective reporting (reporting bias) | Unclear risk | "Intravenenous‐therapy related injuries were categorized further as follows: low‐risk injuries involved needles without direct blood contact; intermediate risk injuries involved needles likely to have occult blood present and high risk injuries involved needles in direct contact with blood." However, there is no information available based on this categorization stipulated in the method section. |
| Similar recruitment of groups | High risk | The nursing divisions selected to participate to the study were from the same hospital. The recruitment time period of 2‐way device differed from the PBC. The PBC was selected to replace the MBC (after four months) due to staff dissatisfaction. |
| Adjustment for baseline differences | Unclear risk | The demographics of the workers (age, sex, years of experience) are not reported. The adjustment for baseline differences is not reported in the analysis. |
| Other bias | High risk | "Study participants generally have ready access to the traditional devices, which may contaminate the evaluation, so much attention must be focused on appropriate experimental device distributions and traditional device removal prior to study initiation." NSI reported in the study group may have been caused by the use of the traditional device. Based on the information available, it is not possible to separate NSI caused by the new devices or traditional ones. |
| Methods | Study design: Cluster Randomised Controlled Trial. Object of randomisation: Nursing divisions. Three‐armed trial with separate control groups | |
| Participants | USA. Nursing personnel from general, medical, surgical and intensive‐care units performing intravenous therapy. Number studied: 73,454 patient days (980,392 productive hours worked). Intervention one n = 15,737. Control n = 12,404. | |
| Interventions | Use of needleless intravenous device: plastic blunt cannula. Passive system no need for activation. Control groups used standard IV needle systems. | |
| Outcomes | Reported needlestick injures per 1000 patient‐days and 1000 productive hours worked. | |
| Notes | ||
| Risk of bias | ||
| Bias | Authors' judgement | Support for judgement |
| Random sequence generation (selection bias) | Unclear risk | "Four groups of nursing divisions were prospectively randomised to use one of the two safety devices" |
| Allocation concealment (selection bias) | Unclear risk | No information about allocation concealment is available. |
| Blinding (performance bias and detection bias) | Unclear risk | No information available on blinding. |
| Incomplete outcome data (attrition bias) | Low risk | Selected nursing division were assigned to either the intervention (MBC then replaced by PBC, and 2‐way). The MBC was replaced after four months due to staff dissatisfaction. Authors reported all outcomes data for the intervention and control group. |
| Selective reporting (reporting bias) | Unclear risk | "Intravenenous‐therapy related injuries were categorized further as follows: low‐risk injuries involved needles without direct blood contact; intermediate risk injuries involved needles likely to have occult blood present and high risk injuries involved needles in direct contact with blood." However, there is no information available based on this categorization stipulated in the method section. |
| Similar recruitment of groups | High risk | The nursing divisions selected to participate to the study were from the same hospital. The recruitment time period of 2‐way device differed from the PBC. The PBC was selected to replace the MBC (after four months) due to staff dissatisfaction. |
| Adjustment for baseline differences | Unclear risk | The demographics of the workers (age, sex, years of experience) are not reported. The adjustment for baseline differences is not reported in the analysis. |
| Other bias | High risk | "Study participants generally have ready access to the traditional devices, which may contaminate the evaluation, so much attention must be focused on appropriate experimental device distributions and traditional device removal prior to study initiation." NSI reported in the study group may have been caused by the use of the traditional device. Based on the information available, it is not possible to separate NSI caused by the new devices or traditional ones. |
| Methods | Study design: Controlled Before‐After Study with Cross‐Over | |
| Participants | USA. Health care workers in sixteen nursing units excluding pediatrics, obstetrics‐gynaecology and intensive care, performing procedures which required the use of IV systems. We estimated that the number of workers in each groups was around 220. All IV insertions in the selected units during a period of six months. Eight units belonged to the intervention group and eight units to the control group, and the roles were switched in the middle of the study period. | |
| Interventions | Use of a needleless intermittent intravenous access system with a reflux valve. Control group used a conventional heparin lock. | |
| Outcomes | Number of reported percutaneous injuries per study week. Secondary outcomes: Local complications at insertion site, bacteraemia of patients, device‐related complications, staff satisfaction and cost analysis. | |
| Notes | Study includes information about costs; We calculated the RR (SE) for needlestick injuries of the intervention and the control group based on our estimates of the number of persons and the number of needlestick injuries reported by the authors. We added 0.5 to fill empty cells. | |
| Risk of bias | ||
| Bias | Authors' judgement | Support for judgement |
| Random sequence generation (selection bias) | High risk | No randomisation. |
| Allocation concealment (selection bias) | High risk | No randomisation. |
| Blinding (performance bias and detection bias) | Unclear risk | No information about blinding. |
| Incomplete outcome data (attrition bias) | Low risk | Authors indicated that study was completed in 16 medical and surgical units. The outcome data appears to be reported for the 16 units. No outcome data at the unit level. |
| Selective reporting (reporting bias) | Low risk | All expected outcomes are reported and correspond to the ones mentioned in the method section. |
| Similar recruitment of groups | Low risk | The intervention and control groups were from the same hospital. There is no information about the FTE change during study period. The study was completed within a short period of time (25 weeks), staff difference between before and after intervention is unlikely to be different. |
| Adjustment for baseline differences | Unclear risk | Authors specified that the wards for the control and intervention were similar in terms of staff‐to‐patient ratio and the type of illness of the patients. The units were different in terms of speciality for the control and intervention group. No information is available to compare the control and intervention groups for the number of staff, working experience, age and sex. Adjustment for baseline differences is not reported in the analysis. |
| Other bias | High risk | The outcome, NSI, is reported by study weeks. There is no information about number of FTE or number of devices used. Although the staff‐to‐patient ratios were similar, we do not know if the number or type of procedures were similar in both groups. |
| Methods | Study design: Interrupted Time‐Series Study | |
| Participants | USA. Hospitals that used Exposure Prevention Information Network (a multi hospital sharps injury database). A total of 85 hospitals were selected of which 30 were removed. Numbers studied: during the pre‐NPSA period (1995‐2000) data representing to 13,377 per‐cutaneous injuries and for the post‐NPSA period (2001‐2005) a total of 5,379 per‐cutaneous injuries. | |
| Interventions | Introduction of a legislation on November 6, 2000 and as mandated, OSHA revised the standard in 2001 which required the provision of safety‐engineered sharps, evaluation of devices, maintenance of sharps injury logs and annual review of the facility's exposure control plan. | |
| Outcomes | Percutaneous injury rates per 100 FTEs. | |
| Notes | Total number of data points (n = 11). | |
| Methods | Study design: Randomised Controlled Trial. Object of randomisation: procedures. Two intervention arms and one control arm | |
| Participants | France. Anaesthetist physicians and anaesthetist nurses in the operating room and emergency performing IV infusion. Number studied: 759 procedures. Intervention group two n = 254. Control group n = 254 (divided over the two arms). | |
| Interventions | Arm 2: use of active safety catheter (Insyte Autoguard). Control group used the Vialon traditional non‐safety catheter. We divided the control group over the two intervention arms. | |
| Outcomes | 1. Number of cases in which the patient's blood stained the operator's skin, gloves, mask, or any other clothing; 2. Number of cases in which the patient's blood stained the stretcher or floor. Secondary outcome: Ease of use and sense of protection. | |
| Notes | ||
| Risk of bias | ||
| Bias | Authors' judgement | Support for judgement |
| Random sequence generation (selection bias) | Low risk | "the type of venous catheter to use was determined randomly in a three ball ballot box." |
| Allocation concealment (selection bias) | Low risk | "The choice of the catheter was randomised by using a single blinded envelope method" |
| Blinding (performance bias and detection bias) | Unclear risk | No information on blinding available. |
| Incomplete outcome data (attrition bias) | Unclear risk | No information reported about the number of excluded patients. |
| Selective reporting (reporting bias) | Low risk | Expected outcomes reported in introduction correspond to the ones mentioned in the method section. |
| Similar recruitment of groups | Low risk | Study uses randomisation. |
| Adjustment for baseline differences | Low risk | Adequate randomisation, no additional adjustment needed in the analysis. |
| Other bias | Low risk | The study appears to be free of other types of bias. |
| Methods | Study design: Randomised Controlled Trial. Object of randomisation: procedures. Two intervention arms and one control arm | |
| Participants | France. Anaesthetist physicians and anaesthetist nurses in the operating room and emergency performing IV infusion. Number studied: 759 procedures. Intervention group one n = 251, Control group n = 254 (divided over the two arms). | |
| Interventions | Arm 1: use of passive safety catheter (Introcan Safety). Intervention 2: use of active safety catheter (Insyte Autoguard). Control group used the Vialon non‐safety catheter. We divided the control group over the two intervention arms. | |
| Outcomes | 1. Number of cases in which the patient's blood stained the operator's skin, gloves, mask, or any other clothing; 2. Number of cases in which the patient's blood stained the stretcher or floor. Secondary outcome: Ease of use and sense of protection. | |
| Notes | ||
| Risk of bias | ||
| Bias | Authors' judgement | Support for judgement |
| Random sequence generation (selection bias) | Low risk | "the type of venous catheter to use was determined randomly in a three ball ballot box." |
| Allocation concealment (selection bias) | Low risk | "The choice of the catheter was randomised by using a single blinded envelope method" |
| Blinding (performance bias and detection bias) | Unclear risk | No information on blinding available. |
| Incomplete outcome data (attrition bias) | Unclear risk | No information reported about the number of excluded patients. |
| Selective reporting (reporting bias) | Low risk | "If the operator considered the patient's vein unsuitable for placing an 18 G catheter, the patient was excluded from the protocol" |
| Similar recruitment of groups | Low risk | Not reported but adequate randomisation to the control or intervention group. |
| Adjustment for baseline differences | Low risk | Adequate randomisation, no additional adjustment needed in the analysis. |
| Other bias | Low risk | The study appears to be free of other types of bias. |
| Methods | Study design: Interrupted Time‐Series Study | |
| Participants | USA. Healthcare workers with direct patient contact, excluding physicians, or ancillary workers who may have been in areas where medical procedures had taken place during a six‐year period. Number studied: 3011 FTE for the pre‐intervention period (three years) and 3992 FTE for the post‐intervention period (three years). | |
| Interventions | Implementation of safety syringes and needleless intravenous systems. It was unclear if these were active or passive. Co‐intervention: Educational in services attended by some or all healthcare workers. | |
| Outcomes | Reported needlestick injuries per 100 full time employees. | |
| Notes | Baseline incidence rate by 100 FTE per year Year Incidence rate 1994 10.6% 1995 10.3% 1996 6.4% Total number of data points (n = 6) | |
| Methods | Study design: Interrupted Time‐Series Study | |
| Participants | India. Hospital healthcare workers during a seven‐year period. Number studied: Not reported. | |
| Interventions | 1. Introduction of sharps containers; 2. Education on blood borne pathogens and the importance of safe sharps disposal. | |
| Outcomes | Number of reported needlestick injuries due to improper disposal per total number of reported needlestick injuries. | |
| Notes | Total number of data points (n = 7). | |
| Methods | Study design: Interrupted Time‐Series | |
| Participants | France. 3600 bed university hospital, sharp injuries reported on an annual of 8500 FTE (2900 nurses). Number of phlebotomist nurses, not reported. | |
| Interventions | 1. re‐sheathable winged steel needles and Vacutainer blood collecting tube and 2. vacutainer blood collecting tubes with recapping sheaths. Each product required the healthcare worker to activate the safety feature immediately after phlebotomy. We regarded both devices as one intervention. The two safety mechanisms required two‐handed activation and were thus active. Pre‐intervention period (four years) and post‐intervention period (three years) | |
| Outcomes | Phlebotomy‐related PIs (vacuum‐tube + winged steel needle) per 100 devices purchased. | |
| Notes | Baseline rate: Number of phlebotomy PI reported for first two years but no denominator available. For third year of baseline, rate was 18.8 phlebotomy PI related per 100,000 purchased devices. Total number of data points (n = 7). | |
| Methods | Study design: Randomised Controlled Trial. Object of randomisation: patients | |
| Participants | Canada (Alberta). Clinicians who carried out PIVC insertions in emergency department patients. Number studied: 150 patients. Number of study insertions: 152. Intervention group n = 73. Control group n = 79. | |
| Interventions | Use of blood control catheter (via valve safety IV catheter) which was an active safety device that includes a valve that is designed to restrict blood flow back out of the catheter hub upon initial venipuncture. It also contains a window within the introducer needle for easy confirmation of vessel entry. Control group used the straight hub version of standard device which also has to be actively switched on (ProtectIV safety IV catheter). | |
| Outcomes | (1) Number of blood leakage events (2) Number of blood exposure risk reduction events (we could not understand what the authors meant by this outcome measure and we decided to exclude this outcome measure. | |
| Notes | ||
| Risk of bias | ||
| Bias | Authors' judgement | Support for judgement |
| Random sequence generation (selection bias) | High risk | Insertions were randomised 1:1 by participating clinicians. |
| Allocation concealment (selection bias) | Unclear risk | Researchers do not provide information on allocation concealment. |
| Blinding (performance bias and detection bias) | High risk | Not a blinded study, the fact that the study could not be carried out as a double blind investigation lent some inherent, albeit unavoidable, clinician bias to the results. |
| Incomplete outcome data (attrition bias) | Unclear risk | Not reported. |
| Selective reporting (reporting bias) | Low risk | Authors reported the outcomes mentioned in the method section: information is available for clinical acceptability, incidence of blood leakage, risk of blood exposure, need for digital compression, insertion success and clinical usability. |
| Similar recruitment of groups | Unclear risk | Incomplete information on recruitment of groups. |
| Adjustment for baseline differences | Unclear risk | No information related to adjustment for baseline differences is reported. |
| Other bias | High risk | Clinicians were able to contribute to the endpoint multiple times, number of insertions performed by clinicians varied from nurse to nurse. This study was funded by Smiths Medical, the manufacturer of both the blood control and standard PIVCs that were evaluvated. The co‐author, Laura Seiberlich, is an employee of the study sponsor. |
| Methods | Study design: Interrupted Time‐Series | |
| Participants | Healthcare workers from a hospital in Italy. The overall number of employees varied from 4447 and 4636 individuals from 2003 to 2007. | |
| Interventions | Sharps awareness program and passively activated Introcan safety IV catheter system. This has a self‐activating safety clip that automatically shields the needle’s sharp bevel during retraction of the needle after cannula insertion. With regard to design and handling, this safety catheter is identical to the conventional catheter. | |
| Outcomes | NSI with catheters and sharps. | |
| Notes | Total number of data points (n = 7) | |
| Methods | Study design: Controlled Before‐After Study | |
| Participants | Spain 350 bed general hospital. 1000 workers, seven wards assigned to intervention and five wards assigned as a control group. | |
| Interventions | 1. Educational session which included a three‐hour presentation and two hours of hands‐on training. 2. Safety devices which included blood‐culture collection tubes with a needle sheath, blood‐gas syringes with needle sheath, lancets with retractable single use puncture sticks, safety devices catheter and blunt needles. It was unclear if these devices were active or passive. Vacuum phlebotomy systems without needle sheaths were used prior the beginning of the study. | |
| Outcomes | Number of percutaneous injuries per 100,000 patient‐days. With the exception of the emergency department, NSI injuries per 100,000 patients. | |
| Notes | Information available on the cost of safety engineered devices. We used the rate ratios as reported by the authors. | |
| Risk of bias | ||
| Bias | Authors' judgement | Support for judgement |
| Random sequence generation (selection bias) | High risk | Not randomised. |
| Allocation concealment (selection bias) | High risk | Not randomised. |
| Blinding (performance bias and detection bias) | Unclear risk | No information is provided about blinding. |
| Incomplete outcome data (attrition bias) | Unclear risk | The intervention includes several wards. For the baseline, authors reported NSI rate for the different wards. This level of information is not available for the intervention as authors grouped the different medical wards into one category. |
| Selective reporting (reporting bias) | High risk | Figure 1: only absolute number is reported, no information available on the denominator for the study period. |
| Similar recruitment of groups | High risk | Researchers selected the wards for the intervention group, potentially introducing selection bias. The study was completed at the hospital at different times. Authors do not specify if the staff FTE and characteristics remain similar before and during intervention. |
| Adjustment for baseline differences | Unclear risk | The demographics of the workers (age, sex, years of experience) are not reported. Adjustment for baseline differences is not reported in the analysis. |
| Other bias | High risk | "injury reporting was voluntary during the pre intervention and intervention periods. However, the nurses in charge of the study carried out active surveillance reporting of injuries during the intervention period." This might have increased the number of cases reported. |
| Methods | Study design: Cluster‐RCT | |
| Participants | Netherlands. Workers of voluntarily participating hospital wards (academic hospital). Demographics and working experience of staff included. Number studied: 796 participants. Intervention one (safety device + workshop) = 267 participants (seven wards), intervention two (workshop only) = 263 (eight wards), control group = 266 (eight wards) | |
| Interventions | 1. (NW): one‐hour PowerPoint workshop about NSIs, introduction/demonstration by supplier of new device, plus replacement of existing injection needles on the ward with injection needle with safety device. The safety device had to be activated by the workers. 2. (W) only received workshop, no new needle device) | |
| Outcomes | Self‐reported number of NSIs within six‐month period and official hospital database registered NSIs. | |
| Notes | ||
| Risk of bias | ||
| Bias | Authors' judgement | Support for judgement |
| Random sequence generation (selection bias) | Unclear risk | No information on randomisation process. |
| Allocation concealment (selection bias) | Unclear risk | No information on allocation concealment. |
| Blinding (performance bias and detection bias) | Unclear risk | No information available on blinding. |
| Incomplete outcome data (attrition bias) | High risk | A. Questionnaire‐based NSI 1. Baseline: Workshop + device group: Data missing on 99/267 (37%) Workshop group: Data missing on 102/263 (39%) Control group: Data missing on 100/266 (38%) 2. At six months: Workshop + device group: Data missing on 197/267 (74%) Workshop group: Data missing on 179/263 (68%) Control group: Data missing on 180/266 (68%) 3. 12 months: Workshop + device group: Data missing on 187/267 (70%) Workshop group: Data missing on 160/263 (60%) Control group: Data missing on 192/266 (74%) B. Hospital registry NSI No missing outcome data |
| Selective reporting (reporting bias) | Low risk | All outcomes stated in the methods section reported. |
| Similar recruitment of groups | Low risk | Participants were randomised within the same hospital. |
| Adjustment for baseline differences | Low risk | There is difference among the groups in regards to sex and working experience. These differences may have influenced the results. For example, there are 17% apprentice nurse in the intervention group compared to 7% in the control group. "the differences in individual and job characteristics between the intervention groups and the control group at baseline were examined using generalized estimated equations (GEE) correcting for wards." |
| Other bias | Low risk | The study appears to be free of other types of bias. |
| Methods | Study design: Interrupted Time‐Series Study | |
| Participants | Australia (Brisbane). All occupational groups with clinical exposure within the hospital whose FTE were avaliable (medical, nursing, allied health and housekeeping) in the period 2000‐2006. | |
| Interventions | 1. Introduction of safety engineered retractable syringes and needle‐free IV systems 2. Extensive education program at the commencement of the intervention in 2005. | |
| Outcomes | Reported needlestick injuries per 10,000 FTEs. | |
| Notes | Information available on the cost of safety engineered devices. Total number of data points (n = 36). | |
| Methods | Study design: Controlled Before‐After Study | |
| Participants | UK. Staff of a dental clinic dealing exclusively with patients with blood‐borne viruses during a five‐year period. Number studied: approximately 600 workers. Intervention group n = approximately 300. Control group n = approximately 300. | |
| Interventions | Introduction of a safety syringe and training on its use by the manufacturer. The safety device had to be activated by the worker. Control group continued using non‐disposable metal syringes after having received education on safety issues. Co‐interventions: Testing of safety devices, ensuring adequate supplies and means of disposal, involvement of key partners, protocol for the changeover. | |
| Outcomes | Number of reported sharps injuries per 1000,000 hours worked; number of sharps injuries related to syringes per total number of sharps injuries. | |
| Notes | Includes information about cost. | |
| Risk of bias | ||
| Bias | Authors' judgement | Support for judgement |
| Random sequence generation (selection bias) | High risk | Not an RCT. |
| Allocation concealment (selection bias) | High risk | Not an RCT. |
| Blinding (performance bias and detection bias) | Unclear risk | No information on blinding. |
| Incomplete outcome data (attrition bias) | Low risk | No missing outcome data. |
| Selective reporting (reporting bias) | Unclear risk | In the method section, authors do not pre‐specify their outcome measures concretely. |
| Similar recruitment of groups | Unclear risk | The number of students and qualified staff remains constant throughout the pre‐intervention period and during intervention over the five‐year study period. It is unclear if pre‐ and post‐intervention group are composed of students with similar years of experience. For the concurrent control group, researchers provided limited information. It is unclear if the individuals in this group performed similar tasks as the pre‐ and post‐intervention group. Authors just indicated that a busy surgical unit was used as the control. |
| Adjustment for baseline differences | Low risk | Authors reported the participant's profession and working experience. The intervention and control groups appear comparable in terms of working experience. No information to enable comparing the control and intervention unit to assess homogeneity of the two groups. |
| Other bias | High risk | 1. "In view of the increased bulk of the safety syringes new waste disposal bins had to be ordered and distributed round the clinics." This co‐intervention may have affected the number of NSI but it is not possible to determine. 2. Possible conflict of interest: "We are indebted to Septodont for their supplies, training and help." |
Characteristics of excluded studies [ordered by study ID]
| Study | Reason for exclusion |
| The study was an ITS design but had insufficient data points. | |
| The study design did not match our inclusion criteria (not an intervention study). | |
| The study design did not match our inclusion criteria (not an intervention study), The study group did not match our inclusion criteria (livestock workers). | |
| The study was an ITS design but had insufficient data points. | |
| The study design did not match our inclusion criteria (surveillance data). | |
| The study was an ITS design but had insufficient data points. | |
| The study design did not match our inclusion criteria (surveillance data). | |
| The study design did not match our inclusion criteria (surveillance study follow up by expert analysis stating which NSI could have been prevented). | |
| The study design did not match our inclusion criteria (assesment study). | |
| The study design did not match our inclusion criteria (surveillance data). | |
| The main outcome of the study does not include NSI. “The aim of the evaluation was to assess the range of sharp safety hypodermic needle devices available in the UK, in terms of device performance and user acceptability. The evaluation was not designed to assess reductions in needlestick injury rates.” | |
| The study design was a CBA but the before data was missing. | |
| The study design did not match our inclusion criteria (no comparison group). | |
| The study design did not match our inclusion criteria (descriptive study). | |
| The study design did not match our inclusion criteria (not an intervention study). | |
| The study design did not match our inclusion criteria (no comparison group). | |
| The study was an ITS design but had insufficient data points. | |
| The study design did not match our inclusion criteria (surveillance data). | |
| The study was an ITS design but had insufficient data points. | |
| The study was an ITS design but had insufficient data points. | |
| The study design did not match our inclusion criteria (compliance study). | |
| The study design did not match our inclusion criteria (surveillance data). | |
| The study design did not match our inclusion criteria (surveillance data). | |
| The study was an ITS design but had insufficient data points. | |
| The study design did not match our inclusion criteria (descriptive study). | |
| The study was an ITS design but had insufficient data points. | |
| The study design did not match our inclusion criteria (qualitative study). | |
| The study design did not match our inclusion criteria (surveillance study). | |
| The main outcome of the study does not include NSI (study evaluvated patient safety). | |
| The study was an ITS design but had insufficient data points. | |
| The study design did not match our inclusion criteria. | |
| The study design did not match our inclusion criteria (not about safety‐engineered devices). | |
| The study was an ITS design but had insufficient data points. | |
| The study was not a field study. | |
| The study intervention does not match our inclusion criteria (the paper describes effectiveness of interactive classes). | |
| The paper describes spatter contamintaion by active SED but it is not a controlled study. | |
| The study design did not match our inclusion criteria (CBA but no comparison group). | |
| The study design did not match our inclusion criteria (no comparison group). | |
| The study was an ITS design but had insufficient data points. | |
| The main outcome of the study does not include NSI. | |
| The study design did not match our inclusion criteria. | |
| The study design did not match our inclusion criteria (literature review ‐ not original research). | |
| The study design did not match our inclusion criteria (surveillance data). | |
| The study design did not match our inclusion criteria (descriptive study). |
Characteristics of studies awaiting assessment [ordered by study ID]
| Methods | Time‐series |
| Participants | Healthcare workers |
| Interventions | Devices ? |
| Outcomes | Needlestick injuries ? |
| Notes |
| Methods | Time‐series |
| Participants | Healthcare workers |
| Interventions | Regulations |
| Outcomes | Sharps injuries |
| Notes |
| Methods | Time‐series |
| Participants | Healthcare workers |
| Interventions | Legislation |
| Outcomes | Needlestick injuries |
| Notes |
| Methods | Time‐series |
| Participants | Healthcare workers |
| Interventions | Legislation |
| Outcomes | Needlestick injuries |
| Notes |
| Methods | Time‐series |
| Participants | Healthcare workers |
| Interventions | Legislation |
| Outcomes | Needlestick injuries |
| Notes |
| Methods | Time‐series |
| Participants | Hospital workers |
| Interventions | Legislation |
| Outcomes | Needlestick injuries |
| Notes |
| Methods | Time‐series |
| Participants | Healthcare workers |
| Interventions | Legislation |
| Outcomes | Needlestick injuries |
| Notes |
Data and analyses
| Outcome or subgroup title | No. of studies | No. of participants | Statistical method | Effect size |
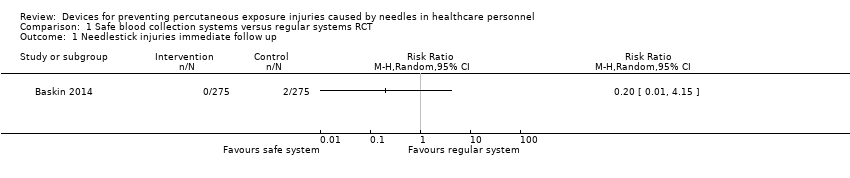
| 1 Needlestick injuries immediate follow up Show forest plot | 1 | Risk Ratio (M‐H, Random, 95% CI) | Totals not selected | |
| Analysis 1.1  Comparison 1 Safe blood collection systems versus regular systems RCT, Outcome 1 Needlestick injuries immediate follow up. | ||||
| 2 Blood splashes Show forest plot | 1 | Risk Ratio (M‐H, Random, 95% CI) | Totals not selected | |
| Analysis 1.2  Comparison 1 Safe blood collection systems versus regular systems RCT, Outcome 2 Blood splashes. | ||||
| Outcome or subgroup title | No. of studies | No. of participants | Statistical method | Effect size |
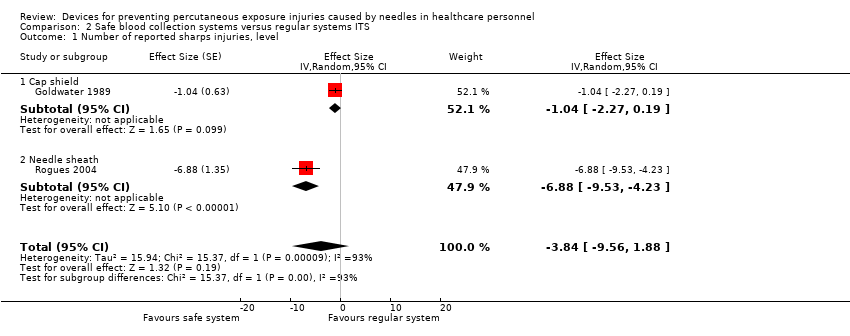
| 1 Number of reported sharps injuries, level Show forest plot | 2 | Effect Size (Random, 95% CI) | ‐3.84 [‐9.56, 1.88] | |
| Analysis 2.1  Comparison 2 Safe blood collection systems versus regular systems ITS, Outcome 1 Number of reported sharps injuries, level. | ||||
| 1.1 Cap shield | 1 | Effect Size (Random, 95% CI) | ‐1.04 [‐2.27, 0.19] | |
| 1.2 Needle sheath | 1 | Effect Size (Random, 95% CI) | ‐6.88 [‐9.53, ‐4.23] | |
| 2 Number of reported sharps injuries, slope Show forest plot | 2 | Effect Size (Fixed, 95% CI) | Totals not selected | |
| Analysis 2.2  Comparison 2 Safe blood collection systems versus regular systems ITS, Outcome 2 Number of reported sharps injuries, slope. | ||||
| 2.1 Cap shield | 1 | Effect Size (Fixed, 95% CI) | 0.0 [0.0, 0.0] | |
| 2.2 Needle sheath | 1 | Effect Size (Fixed, 95% CI) | 0.0 [0.0, 0.0] | |
| Outcome or subgroup title | No. of studies | No. of participants | Statistical method | Effect size |
| 1 Needlestick injuries Show forest plot | 3 | Rate Ratio (Fixed, 95% CI) | 0.62 [0.27, 1.41] | |
| Analysis 3.1  Comparison 3 Safe intravenous systems versus regular systems RCT, Outcome 1 Needlestick injuries. | ||||
| 2 Incidences of blood contamination Show forest plot | 6 | 1489 | Risk Ratio (M‐H, Fixed, 95% CI) | 1.38 [1.00, 1.92] |
| Analysis 3.2  Comparison 3 Safe intravenous systems versus regular systems RCT, Outcome 2 Incidences of blood contamination. | ||||
| 2.1 Active systems | 4 | 961 | Risk Ratio (M‐H, Fixed, 95% CI) | 1.60 [1.08, 2.36] |
| 2.2 Passive systems | 2 | 528 | Risk Ratio (M‐H, Fixed, 95% CI) | 0.94 [0.50, 1.75] |
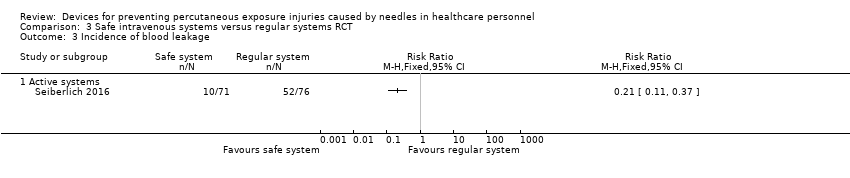
| 3 Incidence of blood leakage Show forest plot | 1 | Risk Ratio (M‐H, Fixed, 95% CI) | Totals not selected | |
| Analysis 3.3  Comparison 3 Safe intravenous systems versus regular systems RCT, Outcome 3 Incidence of blood leakage. | ||||
| 3.1 Active systems | 1 | Risk Ratio (M‐H, Fixed, 95% CI) | 0.0 [0.0, 0.0] | |
| Outcome or subgroup title | No. of studies | No. of participants | Statistical method | Effect size |
| 1 Number of needlestick injuries Show forest plot | 1 | Rate Ratio (Fixed, 95% CI) | Totals not selected | |
| Analysis 4.1  Comparison 4 Safe intravenous systems versus regular systems CBA, Outcome 1 Number of needlestick injuries. | ||||
| Outcome or subgroup title | No. of studies | No. of participants | Statistical method | Effect size |
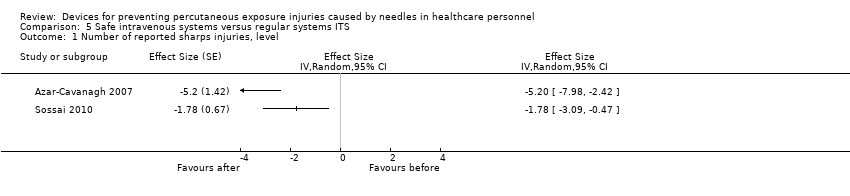
| 1 Number of reported sharps injuries, level Show forest plot | 2 | Effect Size (Random, 95% CI) | Totals not selected | |
| Analysis 5.1  Comparison 5 Safe intravenous systems versus regular systems ITS, Outcome 1 Number of reported sharps injuries, level. | ||||
| 2 Number of reported sharps injuries, slope Show forest plot | 2 | Effect Size (Random, 95% CI) | Totals not selected | |
| Analysis 5.2  Comparison 5 Safe intravenous systems versus regular systems ITS, Outcome 2 Number of reported sharps injuries, slope. | ||||
| Outcome or subgroup title | No. of studies | No. of participants | Statistical method | Effect size |
| 1 Questionnaire reported Needlestick injuries 6 mo follow up Show forest plot | 1 | Risk Ratio (M‐H, Fixed, 95% CI) | Totals not selected | |
| Analysis 6.1  Comparison 6 Safe injection systems versus regular systems RCT, Outcome 1 Questionnaire reported Needlestick injuries 6 mo follow up. | ||||
| 2 Hospital reported Needlestick injuries 6 mo follow up Show forest plot | 1 | Odds Ratio (M‐H, Fixed, 95% CI) | Totals not selected | |
| Analysis 6.2  Comparison 6 Safe injection systems versus regular systems RCT, Outcome 2 Hospital reported Needlestick injuries 6 mo follow up. | ||||
| 3 Questionnaire reported Needlestick injuries 12 mo follow up Show forest plot | 1 | Odds Ratio (M‐H, Fixed, 95% CI) | Totals not selected | |
| Analysis 6.3  Comparison 6 Safe injection systems versus regular systems RCT, Outcome 3 Questionnaire reported Needlestick injuries 12 mo follow up. | ||||
| 4 Hospital reported Needlestick injuries 12 mo follow up Show forest plot | 1 | Odds Ratio (M‐H, Fixed, 95% CI) | Totals not selected | |
| Analysis 6.4  Comparison 6 Safe injection systems versus regular systems RCT, Outcome 4 Hospital reported Needlestick injuries 12 mo follow up. | ||||
| Outcome or subgroup title | No. of studies | No. of participants | Statistical method | Effect size |
| 1 Needlestick injury rate Show forest plot | 1 | Rate Ratio (Fixed, 95% CI) | Totals not selected | |
| Analysis 7.1  Comparison 7 Safe injection systems versus regular systems CBA, Outcome 1 Needlestick injury rate. | ||||
| Outcome or subgroup title | No. of studies | No. of participants | Statistical method | Effect size |
| 1 change in level of needlestick injuries Show forest plot | 1 | Effect size (Random, 95% CI) | Totals not selected | |
| Analysis 8.1  Comparison 8 Safe passive injection systems versus safe active injection systems ITS, Outcome 1 change in level of needlestick injuries. | ||||
| 2 Change in slope of needlestick injuries Show forest plot | 1 | Effect Size (Random, 95% CI) | Totals not selected | |
| Analysis 8.2  Comparison 8 Safe passive injection systems versus safe active injection systems ITS, Outcome 2 Change in slope of needlestick injuries. | ||||
| Outcome or subgroup title | No. of studies | No. of participants | Statistical method | Effect size |
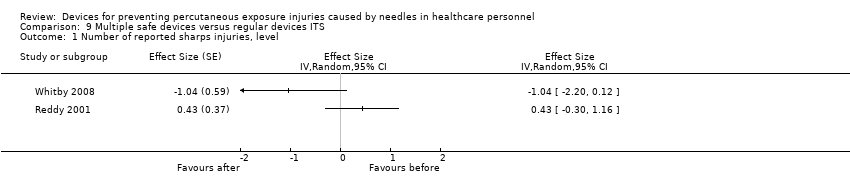
| 1 Number of reported sharps injuries, level Show forest plot | 2 | Effect Size (Random, 95% CI) | Totals not selected | |
| Analysis 9.1  Comparison 9 Multiple safe devices versus regular devices ITS, Outcome 1 Number of reported sharps injuries, level. | ||||
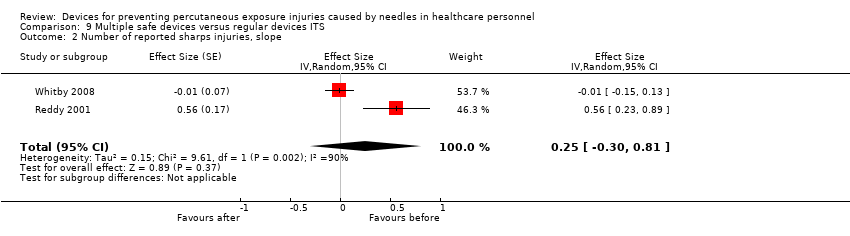
| 2 Number of reported sharps injuries, slope Show forest plot | 2 | Effect Size (Random, 95% CI) | 0.25 [‐0.30, 0.81] | |
| Analysis 9.2  Comparison 9 Multiple safe devices versus regular devices ITS, Outcome 2 Number of reported sharps injuries, slope. | ||||
| Outcome or subgroup title | No. of studies | No. of participants | Statistical method | Effect size |
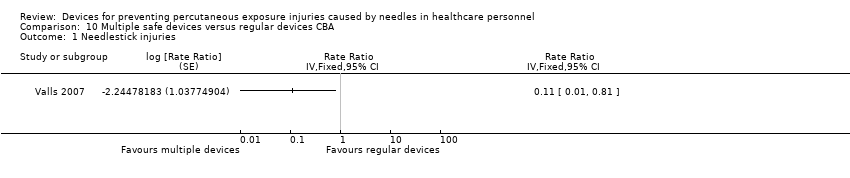
| 1 Needlestick injuries Show forest plot | 1 | Rate Ratio (Fixed, 95% CI) | Totals not selected | |
| Analysis 10.1  Comparison 10 Multiple safe devices versus regular devices CBA, Outcome 1 Needlestick injuries. | ||||
| Outcome or subgroup title | No. of studies | No. of participants | Statistical method | Effect size |
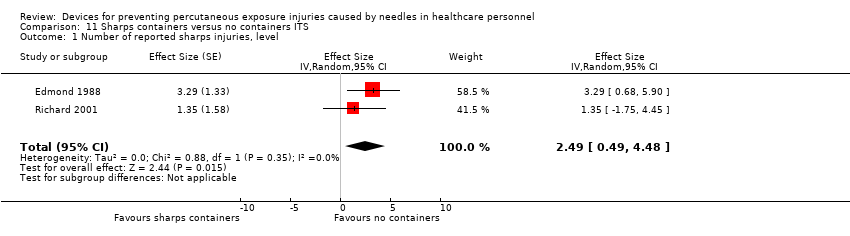
| 1 Number of reported sharps injuries, level Show forest plot | 2 | Effect Size (Random, 95% CI) | 2.49 [0.49, 4.48] | |
| Analysis 11.1  Comparison 11 Sharps containers versus no containers ITS, Outcome 1 Number of reported sharps injuries, level. | ||||
| 2 Number of reported sharps injuries, slope Show forest plot | 2 | Effect Size (Random, 95% CI) | Totals not selected | |
| Analysis 11.2  Comparison 11 Sharps containers versus no containers ITS, Outcome 2 Number of reported sharps injuries, slope. | ||||
| Outcome or subgroup title | No. of studies | No. of participants | Statistical method | Effect size |
| 1 Number of needlestick injuries Show forest plot | 1 | Rate Ratio (Fixed, 95% CI) | Totals not selected | |
| Analysis 12.1  Comparison 12 Sharps containers versus no containers CBA, Outcome 1 Number of needlestick injuries. | ||||
| 2 Number of container related needlestick injuries Show forest plot | 1 | Rate Ratio (Fixed, 95% CI) | Totals not selected | |
| Analysis 12.2  Comparison 12 Sharps containers versus no containers CBA, Outcome 2 Number of container related needlestick injuries. | ||||
| Outcome or subgroup title | No. of studies | No. of participants | Statistical method | Effect size |
| 1 NSI‐ change in level Show forest plot | 3 | Effect Size (Random, 95% CI) | Subtotals only | |
| Analysis 13.1  Comparison 13 Legislation versus no legislation ITS, Outcome 1 NSI‐ change in level. | ||||
| 1.1 Interruption | 2 | Effect Size (Random, 95% CI) | ‐6.15 [‐7.76, ‐4.54] | |
| 1.2 Gradual introduction | 1 | Effect Size (Random, 95% CI) | 0.80 [0.41, 1.19] | |
| 2 NSI‐ Change in slope Show forest plot | 3 | Effect Size (Random, 95% CI) | Subtotals only | |
| Analysis 13.2  Comparison 13 Legislation versus no legislation ITS, Outcome 2 NSI‐ Change in slope. | ||||
| 2.1 Interruption | 2 | Effect Size (Random, 95% CI) | ‐0.94 [‐1.97, 0.09] | |
| 2.2 Gradual introduction | 1 | Effect Size (Random, 95% CI) | 0.5 [0.36, 0.64] | |

Study flow diagram for 2017 update

Risk of bias graph: review authors' judgements about each risk of bias item presented as percentages across all included studies.

Risk of bias summary: review authors' judgements about each risk of bias item for each included study.
Comparison 1 Safe blood collection systems versus regular systems RCT, Outcome 1 Needlestick injuries immediate follow up.

Comparison 1 Safe blood collection systems versus regular systems RCT, Outcome 2 Blood splashes.
Comparison 2 Safe blood collection systems versus regular systems ITS, Outcome 1 Number of reported sharps injuries, level.

Comparison 2 Safe blood collection systems versus regular systems ITS, Outcome 2 Number of reported sharps injuries, slope.

Comparison 3 Safe intravenous systems versus regular systems RCT, Outcome 1 Needlestick injuries.

Comparison 3 Safe intravenous systems versus regular systems RCT, Outcome 2 Incidences of blood contamination.
Comparison 3 Safe intravenous systems versus regular systems RCT, Outcome 3 Incidence of blood leakage.

Comparison 4 Safe intravenous systems versus regular systems CBA, Outcome 1 Number of needlestick injuries.
Comparison 5 Safe intravenous systems versus regular systems ITS, Outcome 1 Number of reported sharps injuries, level.

Comparison 5 Safe intravenous systems versus regular systems ITS, Outcome 2 Number of reported sharps injuries, slope.

Comparison 6 Safe injection systems versus regular systems RCT, Outcome 1 Questionnaire reported Needlestick injuries 6 mo follow up.

Comparison 6 Safe injection systems versus regular systems RCT, Outcome 2 Hospital reported Needlestick injuries 6 mo follow up.

Comparison 6 Safe injection systems versus regular systems RCT, Outcome 3 Questionnaire reported Needlestick injuries 12 mo follow up.

Comparison 6 Safe injection systems versus regular systems RCT, Outcome 4 Hospital reported Needlestick injuries 12 mo follow up.

Comparison 7 Safe injection systems versus regular systems CBA, Outcome 1 Needlestick injury rate.

Comparison 8 Safe passive injection systems versus safe active injection systems ITS, Outcome 1 change in level of needlestick injuries.

Comparison 8 Safe passive injection systems versus safe active injection systems ITS, Outcome 2 Change in slope of needlestick injuries.
Comparison 9 Multiple safe devices versus regular devices ITS, Outcome 1 Number of reported sharps injuries, level.
Comparison 9 Multiple safe devices versus regular devices ITS, Outcome 2 Number of reported sharps injuries, slope.
Comparison 10 Multiple safe devices versus regular devices CBA, Outcome 1 Needlestick injuries.
Comparison 11 Sharps containers versus no containers ITS, Outcome 1 Number of reported sharps injuries, level.

Comparison 11 Sharps containers versus no containers ITS, Outcome 2 Number of reported sharps injuries, slope.
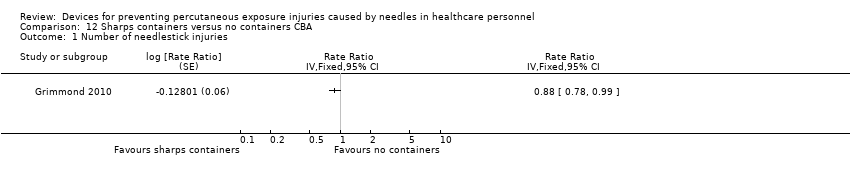
Comparison 12 Sharps containers versus no containers CBA, Outcome 1 Number of needlestick injuries.
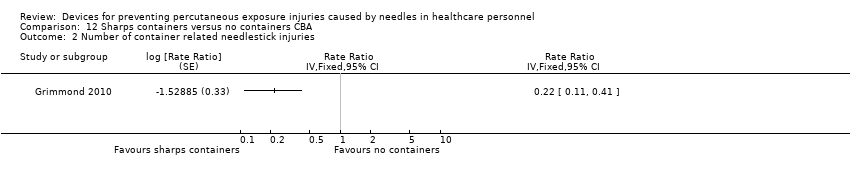
Comparison 12 Sharps containers versus no containers CBA, Outcome 2 Number of container related needlestick injuries.

Comparison 13 Legislation versus no legislation ITS, Outcome 1 NSI‐ change in level.
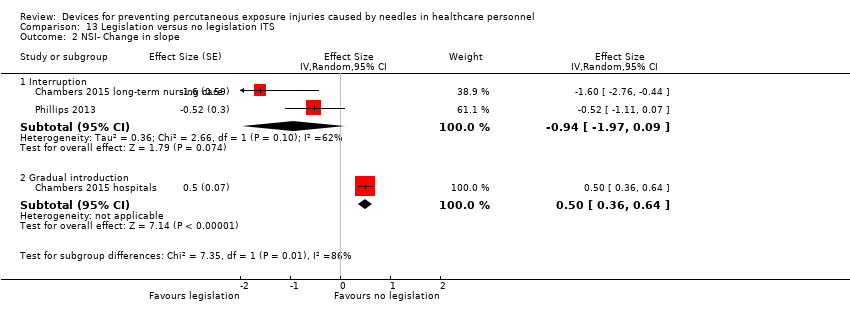
Comparison 13 Legislation versus no legislation ITS, Outcome 2 NSI‐ Change in slope.
| Safe blood collection systems compared to regular systems for preventing percutaneous exposure injuries caused by needles in healthcare personnel (RCTs) | ||||||
| Patient or population: preventing percutaneous exposure injuries caused by needles in healthcare personnel (RCTs) | ||||||
| Outcomes | Anticipated absolute effects* (95% CI) | Relative effect | № of participants | Quality of the evidence | Comments | |
| Risk with regular systems | Risk with Safe blood collection systems | |||||
| Needlestick injuries immediate follow up | Study population | RR 0.20 | 550 | ⊕⊝⊝⊝ | ||
| 7 per 1 000 | 1 per 1 000 | |||||
| Blood splashes | Study population | RR 0.14 | 550 | ⊕⊝⊝⊝ | ||
| 25 per 1 000 | 4 per 1 000 | |||||
| *The risk in the intervention group (and its 95% confidence interval) is based on the assumed risk in the comparison group and the relative effect of the intervention (and its 95% CI). | ||||||
| GRADE Working Group grades of evidence | ||||||
| 1 We downgraded the quality of evidence by one level due to risk of bias (selection bias, performance bias and detection bias). | ||||||
| Safe blood collection systems compared to regular systems for preventing percutaneous exposure injuries caused by needles in healthcare personnel (ITS) | |||
| Patient or population: preventing percutaneous exposure injuries caused by needles in healthcare personnel (ITS) | |||
| Outcomes | Impact | № of participants | Quality of the evidence |
| Number of reported sharps injuries, level ‐ reported seperately for needle sheath and cap shield studies | Needle sheath study: effect size ‐6.88; confidence interval ‐9.53 to ‐4.23. Cap shield study: effect size ‐1.04; confidence interval ‐2.27 to 0.19. | (2 observational studies) | ⊕⊝⊝⊝ |
| Number of reported sharps injuries, slope ‐ reported seperately for needle sheath and cap shield studies | Needle sheath study: effect size ‐1.19; confidence interval ‐2.50 to 0.12. Cap shield study: effect size ‐1.00; confidence interval ‐2.22 to ‐0.22. | (2 observational studies) | ⊕⊝⊝⊝ |
| Interpretation of effect size: small (0‐0.2) medium (0.2‐0.5) large (0.6 and above), an effect size with negative sign implies decrease and positive sign implies increase of effect. | |||
| GRADE Working Group grades of evidence | |||
| 1 We downgraded the quality of evidence by two levels due to heterogeneity (I² = 93%). | |||
| Safe intravenous systems compared to regular systems RCT for preventing percutaneous exposure injuries caused by needles in healthcare personnel | ||||||
| Patient or population: preventing percutaneous exposure injuries caused by needles in healthcare personnel | ||||||
| Outcomes | Anticipated absolute effects* (95% CI) | Relative effect | № of participants | Quality of the evidence | Comments | |
| Risk with regular systems RCT | Risk with Safe intravenous systems | |||||
| Needlestick injuries | Study population | Rate ratio 0.62 | (1 RCT, three arms) | ⊕⊝⊝⊝ | Calculated based on 1000 patient days | |
| 0.71 per 1 000 | 0.44 per 1 000 | |||||
| Incidences of blood contamination ‐ Active systems | Study population | RR 1.60 | 961 | ⊕⊕⊝⊝ | ||
| 92 per 1 000 | 148 per 1 000 | |||||
| Incidences of blood contamination ‐ Passive systems | Study population | RR 0.94 | 528 | ⊕⊕⊝⊝ | ||
| 79 per 1 000 | 74 per 1 000 | |||||
| Incidence of blood leakage ‐ Active systems | Study population | RR 0.21 | 147 | ⊕⊕⊝⊝ | ||
| 684 per 1 000 | 144 per 1 000 | |||||
| *The risk in the intervention group (and its 95% confidence interval) is based on the assumed risk in the comparison group and the relative effect of the intervention (and its 95% CI). | ||||||
| GRADE Working Group grades of evidence | ||||||
| 1 We downgraded the quality of evidence by two levels due to risk of bias (serious attrition). | ||||||
| Safe intravenous systems compared to regular systems CBA for preventing percutaneous exposure injuries caused by needles in healthcare personnel | ||||||
| Patient or population: preventing percutaneous exposure injuries caused by needles in healthcare personnel | ||||||
| Outcomes | Anticipated absolute effects* (95% CI) | Relative effect | № of participants | Quality of the evidence | Comments | |
| Risk with regular systems CBA | Risk with Safe intravenous systems | |||||
| Number of needlestick injuries | Study population | Rate ratio 0.06 | (1 observational study) | ⊕⊝⊝⊝ | ||
| 36.36 per 1 000 | 2.18 per 1 000 | |||||
| *The risk in the intervention group (and its 95% confidence interval) is based on the assumed risk in the comparison group and the relative effect of the intervention (and its 95% CI). | ||||||
| GRADE Working Group grades of evidence | ||||||
| 1 We downgraded the quality of evidence by two levels due to risk of bias (no random sequence generation or allocation concealment). | ||||||
| Safe intravenous systems compared to regular systems ITS for preventing percutaneous exposure injuries caused by needles in healthcare personnel | |||
| Patient or population: preventing percutaneous exposure injuries caused by needles in healthcare personnel | |||
| Outcomes | Impact | № of participants | Quality of the evidence |
| Number of reported sharps injuries, level | Study 1: effect size ‐5.20; confidence interval ‐7.98 to ‐2.42. Study 2: effect size ‐1.78; confidence interval ‐3.09 to ‐0.47. | (2 observational studies) | ⊕⊝⊝⊝ |
| Number of reported sharps injuries, slope | Study 1: Effect size ‐7.86; confidence interval ‐9.13 to ‐6.59. Study 2: Effect size 0.35; confidence interval ‐0.20 to 0.90. | (2 observational studies) | ⊕⊝⊝⊝ |
| Interpretation of effect size: small (0‐0.2) medium (0.2‐0.5) large (0.6 and above), a effect size with negative sign implies decrease and positive sign implies increase of effect. | |||
| GRADE Working Group grades of evidence | |||
| 1 We downgraded the quality of evidence by one level due to risk of bias caused by lacking intervention fidelity (in the second study conventional devices were used during intervention period). | |||
| Safe injection systems compared to regular systems RCT for preventing percutaneous exposure injuries caused by needles in healthcare personnel | ||||||
| Patient or population: preventing percutaneous exposure injuries caused by needles in healthcare personnel | ||||||
| Outcomes | Anticipated absolute effects* (95% CI) | Relative effect | № of participants | Quality of the evidence | Comments | |
| Risk with regular systems RCT | Risk with Safe injection systems | |||||
| Questionnaire reported Needlestick injuries 6 mo follow up | Study population | RR 0.42 | 154 | ⊕⊝⊝⊝ | ||
| 140 per 1 000 | 59 per 1 000 | |||||
| Questionnaire reported Needlestick injuries 12 mo follow up | Study population | OR 0.20 | 144 | ⊕⊝⊝⊝ | ||
| 119 per 1 000 | 26 per 1 000 | |||||
| Hospital reported Needlestick injuries 6 mo follow up | Study population | OR 1.20 | 533 | ⊕⊝⊝⊝ | ||
| 38 per 1 000 | 45 per 1 000 | |||||
| Hospital reported Needlestick injuries 12 mo follow up | Study population | OR 0.72 | 533 | ⊕⊝⊝⊝ | ||
| 41 per 1 000 | 30 per 1 000 | |||||
| *The risk in the intervention group (and its 95% confidence interval) is based on the assumed risk in the comparison group and the relative effect of the intervention (and its 95% CI). | ||||||
| GRADE Working Group grades of evidence | ||||||
| 1 We downgraded the quality of evidence by two levels due to risk of bias (high attrition). | ||||||
| Safe injection systems compared to regular systems CBA for preventing percutaneous exposure injuries caused by needles in healthcare personnel | ||||||
| Patient or population: preventing percutaneous exposure injuries caused by needles in healthcare personnel | ||||||
| Outcomes | Anticipated absolute effects* (95% CI) | Relative effect | № of participants | Quality of the evidence | Comments | |
| Risk with regular systems CBA | Risk with Safe injection systems | |||||
| Needlestick injury rate | Study population | Rate ratio 0.34 | (1 observational study) | ⊕⊝⊝⊝ | Calculated based on 1000 person years | |
| 236 per 1 000 | 80.24 per 1 000 | |||||
| *The risk in the intervention group (and its 95% confidence interval) is based on the assumed risk in the comparison group and the relative effect of the intervention (and its 95% CI). | ||||||
| GRADE Working Group grades of evidence | ||||||
| 1 We downgraded the quality of evidence by two levels due to risk of bias (no random sequence generation or allocation concealment). | ||||||
| Safe passive injection systems compared to safe active injection systems ITS for preventing percutaneous exposure injuries caused by needles in healthcare personnel | |||
| Patient or population: preventing percutaneous exposure injuries caused by needles in healthcare personnel | |||
| Outcomes | Impact | № of participants | Quality of the evidence |
| Change in level of needlestick injuries | Effect size 0.23; confidence interval ‐1.89 to 2.35. | (1 observational study) | ⊕⊝⊝⊝ |
| Change in slope of needlestick injuries | Effect size ‐0.74; confidence interval ‐1.66 to 0.18. | (1 observational study) | ⊕⊕⊝⊝ |
| Interpretation of effect size: small (0‐0.2) medium (0.2‐0.5) large (0.6 and above), a effect size with negative sign implies decrease and positive sign implies increase of effect. | |||
| GRADE Working Group grades of evidence | |||
| 1 We downgraded the quality of evidence by one level due to imprecision (wide confidence interval). | |||
| Multiple safe devices compared to regular devices ITS for preventing percutaneous exposure injuries caused by needles in healthcare personnel | |||
| Patient or population: preventing percutaneous exposure injuries caused by needles in healthcare personnel | |||
| Outcomes | Impact | № of participants | Quality of the evidence |
| Number of reported sharps injuries, level | Study 1: effect size ‐1.04; confidence interval ‐2.20 to 0.12. Study 2: effect size 0.43; confidence interval ‐0.30 to 1.16. | (2 observational studies) | ⊕⊝⊝⊝ |
| Number of reported sharps injuries, slope | Study 1: effect size ‐0.01; confidence interval ‐0.15 to 0.13. Study 2: effect size 0.56; confidence interval 0.23 to 0.89. | (2 observational studies) | ⊕⊝⊝⊝ |
| Interpretation of effect size: small (0‐0.2) medium (0.2‐0.5) large (0.6 and above), a effect size with negative sign implies decrease and positive sign implies increase of effect. | |||
| GRADE Working Group grades of evidence | |||
| 1 We downgraded the quality of evidence by one level due to risk of bias (One study had a low risk of bias but the other study had a high risk as conventional devices were still available after the intervention began). | |||
| Multiple safe devices compared to regular devices CBA for preventing percutaneous exposure injuries caused by needles in healthcare personnel | ||||||
| Patient or population: preventing percutaneous exposure injuries caused by needles in healthcare personnel | ||||||
| Outcomes | Anticipated absolute effects* (95% CI) | Relative effect | № of participants | Quality of the evidence | Comments | |
| Risk with regular devices CBA | Risk with Multiple safe devices | |||||
| Needle stick injuries | Study population | Rate ratio 0.11 | (1 observational study) | ⊕⊝⊝⊝ | Calculated based on 1000 patient days | |
| 0.44 per 1 000 | 0.052 per 1 000 | |||||
| *The risk in the intervention group (and its 95% confidence interval) is based on the assumed risk in the comparison group and the relative effect of the intervention (and its 95% CI). | ||||||
| GRADE Working Group grades of evidence | ||||||
| 1 We downgraded the quality of evidence by two levels due to risk of bias (no random sequence generation or allocation concealment). | ||||||
| Sharps containers compared to no containers ITS for preventing percutaneous exposure injuries caused by needles in healthcare personnel | |||
| Patient or population: preventing percutaneous exposure injuries caused by needles in healthcare personnel | |||
| Outcomes | Impact | № of participants | Quality of the evidence |
| Number of reported sharps injuries, level | Study 1: effect size 3.29; confidence interval 0.68 to 5.90. Study 2: effect size 1.35; confidence interval ‐1.75 to 4.45. | (2 observational studies) | ⊕⊝⊝⊝ |
| Number of reported sharps injuries, slope | Study 1: effect size 0.02; confidence interval ‐1.06 to 1.10. Study 2: effect size 2.55; confidence interval 1.20 to 3.90. | (2 observational studies) | ⊕⊝⊝⊝ |
| Interpretation of effect size: small (0‐0.2) medium (0.2‐0.5) large (0.6 and above), a effect size with negative sign implies decrease and positive sign implies increase of effect. | |||
| GRADE Working Group grades of evidence | |||
| 1 We downgraded the quality of evidence by one level due to inconsistency (study 2 showed an increase in reporting). | |||
| Sharps containers compared to no containers CBA for preventing percutaneous exposure injuries caused by needles in healthcare personnel | ||||||
| Patient or population: preventing percutaneous exposure injuries caused by needles in healthcare personnel | ||||||
| Outcomes | Anticipated absolute effects* (95% CI) | Relative effect | № of participants | Quality of the evidence | Comments | |
| Risk with no containers CBA | Risk with Sharps containers | |||||
| Number of needlestick injuries | Study population | Rate ratio 0.88 | (1 observational study) | ⊕⊝⊝⊝ | ||
| 28.3 per 1 000 | 24.9 per 1 000 | |||||
| Number of container related needlestick injuries | Study population | Rate ratio 0.22 | (1 observational study) | ⊕⊝⊝⊝ | ||
| 2.6 per 1 000 | 0.6 per 1 000 | |||||
| *The risk in the intervention group (and its 95% confidence interval) is based on the assumed risk in the comparison group and the relative effect of the intervention (and its 95% CI). | ||||||
| GRADE Working Group grades of evidence | ||||||
| 1 We downgraded the quality of evidence by two levels due to risk of bias (no random sequence generation or allocation concealment). | ||||||
| Legislation compared to no legislation ITS for preventing percutaneous exposure injuries caused by needles in healthcare personnel | |||
| Patient or population: preventing percutaneous exposure injuries caused by needles in healthcare personnel | |||
| Outcomes | Impact | № of participants | Quality of the evidence |
| NSI‐ change in level ‐ Interruption | Effect size ‐6.15; confidence interval ‐7.76 to ‐4.54. | (2 observational studies) | ⊕⊕⊕⊝ |
| NSI‐ change in level ‐ Gradual introduction | Effect size 0.80; confidence interval 0.41 to 1.19. | (1 observational study) | ⊕⊕⊝⊝ |
| NSI‐ Change in slope ‐ Interruption | Effect size ‐0.94; confidence interval ‐1.97 to 0.09 | (2 observational studies) | ⊕⊝⊝⊝ |
| NSI‐ Change in slope ‐ Gradual introduction | Effect size 0.50; confidence interval 0.36 to 0.64 | (1 observational study) | ⊕⊕⊝⊝ |
| Interpretation of effect size: small (0‐0.2) medium (0.2‐0.5) large (0.6 and above), a effect size with negative sign implies decrease and positive sign implies increase of effect. | |||
| GRADE Working Group grades of evidence | |||
| 1 We downgraded the quality of evidence by one level due to risk of bias (dataset did not represent the whole sample). | |||
| Study name | Device Commercial Names | Device Category | Safety Device type | passive/ active | For sale? |
| Asai 1999 active | Insyte AutoGuard intravenous cannula | Safe IV system (insertion) | button for actively retracting the needle | active | Yes |
| Asai 2002 active | Insyte Autoguard intravenous cannula | Safe IV system (insertion) | button for actively retracting the needle | active | Yes |
| Asai 2002 passive | Protective Acuvance | Safe IV system (insertion) | automated retraction of needle | passive | Yes |
| Azar‐Cavanagh 2007 | Unnamed intravenous catheter stylet | Safe IV system (insertion) | retractable protection shield | active? | ? |
| Baskin 2014 | BD Eclipse injector 3‐mL, BD preset syringe with BD Luer‐Lok tip 25G×1 | Blood collection | cannula protection shield is activated with one hand after puncture and clicks irreversibly over the cannula | active | Yes |
| Chambers 2015 hospitals | not reported | Multiple safe devices | safety engineered needles and needleless devices | passive or semi‐automatic | ? |
| Chambers 2015 long‐term nursing care | nor reported | Multiple safe devices | safety engineered needles and needleless devices | passive or semi‐automatic | ? |
| Cote 2003 | Angiocath Autoguard IV catheters | Safe IV system (insertion) | button for actively retracting the needle | active | Yes |
| Edmond 1988 | Winfield sharpsguard | Sharps container | bedside sharps container | n.a. | No |
| Gaballah 2010 | Unnamed safety dental syringes | Injection system | does not require re‐sheating or removal of the needle from its syringe | passive? | ? |
| Goldwater 1989 | Needle guard Biosafe New Zealand | Blood collection | shield on cap prevents injury while recapping | n.a. | No |
| Goris 2015 | Unnamed safety engineered passive retractable syringes | Injection system | automatically and instantly retracts the needle from the patient into the barrel of the syringe | passive | ? |
| Grimmond 2010 | Daniels sharpsmart | Sharps container | bedside sharps container | n.a. | Yes |
| L'Ecuyer 1996 2wva | 2‐way valve Safsite Braun medical | Safe IV system (insertion and needleless) | two valve system with plastic sharp that remains in the device | passive | Yes |
| L'Ecuyer 1996 mbc | Lifeshield metal blunt cannula | Safe IV system (needleless iv system) | metal blunt cannula | passive | Yes |
| L'Ecuyer 1996 pbc | Interlink PBC plastic cannula | Safe IV system (insertion and needleless) | plastic sharp covered by blunt plastic cannula | passive | Yes |
| Mendelson 1998 | 1‐valve Safsite Braun medical | Safe IV system (needleless) | valve of IV system incompatible with needle | passive | Yes |
| Phillips 2013 | safety engineered sharps | Multiple safe devices | not explained | ? | ? |
| Prunet 2008 active | Insyte Autoguard intravenous cannula | Safe IV system (insertion) | button for actively retracting the needle | active | Yes |
| Prunet 2008 passive | Introcan Safety IV system (Braun) | Safe IV system (insertion) | automatic shield on needle tip at withdrawing | passive | Yes |
| Reddy 2001 | 'safety syringes and needleless IV' | Multiple safe devices | not explained | ? | ? |
| Richard 2001 | 'sharps containers' | Sharps container | first in treatment rooms later bedside placements | ? | ? |
| Rogues 2004 | SafetyLock BD, resheathable winged steel needle | Blood collection | after pushing (two handed) needle retracts into sheath | active | Yes |
| Seiberlich 2016 | ViaValve safety I.V. catheter | Safe IV system (insertion) | contains a valve that is designed to restrict blood flow back out of the catheter hub upon initial venipuncture | active | Yes |
| Sossai 2010 | Introcan safety IV system (Braun) | Safe IV system (insertion) | automatic shield on needle tip at withdrawing | passive | Yes |
| Valls 2007 | Eclipse BD; Saf‐T‐ E‐Z Set, BD; Surshield, Terumo; Preserts BD; Provent plus, Smiths; Genie BD; Surgilance Terumo; Blunt administration needles BD | Multiple systems | n.a. | active and passive | Yes |
| van der Molen 2011 | Eclipse BD | Injection system | after injection needle covered with shield | active | Yes |
| Whitby 2008 | VanishPoint; VanishPoint blood tube holders; BD Safety‐Lok; SmartSite needle‐free system; Smartsite Plus | Multiple systems | retractable syringes, needle‐free IV systems and safety winged butterfly needles. | passive | Yes |
| Zakrzweska 2001 | Safety Plus Septodont (Dental injections) | Injection system | Protective sheaths can be temporarily or definitely protect the needle | active | Yes |
| Study | Intervention independent of other changes | Sufficient data points | Test for trend | Intervention did not affect data collection | Blinded outcome assessment | Complete data set | Reliable outcome measure | Total score |
| Goldwater 1989 | Not done (0) Comment: staff turnover during study period. Staff preference for the use of the intervention devices varied across study periods. | Done (1) Comment: inlcusion of 3 data points before and after, the study was reanalysed using ARIMA model. | Done (1) Comment: we reanalysed the study for trend. | Done (1) Data collection seems to remained the same pre and post‐intervention. | Not clear (0) Authors do not provide information on blinding. | Done (1) | Not clear (0): Comment: no system for NSI seems to have been in placed during the study period. Uncertain about the consistency of the reporting during the study period. | 4 |
| Rogues 2004 | Done (1) Quote: "Conventional phlebotomy non‐safety devices were removed from all departments, and the new products were in place on implementation" Comment: only one device seems to have been introduced during intervention but authors do not specify if additional changes occurred during the study. | Done (1) Comment: inlcusion of 3 data points before and after, the study was reanalysed using ARIMA model. | Done (1) Comment: we reanalysed the study for trend. | Done (1) Comment: the method of data collection remains the same throughout the study. It does not appears to be influenced by the intervention. | Not clear (0) Comment No information is available on blinding. | Not done (0) Comment: data not available for the estimated number of phlebotomies performed for 1993 and 1994. | Done (1) Comment: hospital has a sharp injury surveillance system prior and after intervention. Althought not ideal as possibility of underreporting but appropriate for the study outcome. | 5 |
| Reddy 2001 | Not done (0) Quote: one of the confounder present throughout the post intervention phase was the availability of traditional needles devices. Comment: intervention occurs simultaneously with the availability of non‐safety device. | Done (1) Comment: inlcusion of 3 data points before and after, the study was reanalysed using ARIMA model. | Done (1) Comment: we reanalysed the study for trend. | Done (1) Comment: the method of data collection remains the same throughout the study. It does not appears to be influenced by the intervention. | Not clear (0) Comment: no information available on blinding | Not done (0) Comment: physicians were excluded from analysis as no information on FTE. | Done (1) Comment: hospital had a sharp injury surveillance system prior and after intervention. Althought no ideal as possibility of underreporting but appropriate for the study outcome. | 4 |
| Azar‐Cavanagh 2007 | Done (1) Comment: safety devices seem to have systematically replaced the conventional devices. Authors do not specify if additional changes occurred during the study. | Done (1) Comment: inlcusion of 3 data points before and after, the study was reanalysed using ARIMA model. | Done (1) Comment: we reanalysed the study for trend. | Done (1) Comment: the method of data collection remains the same throughout the study. It does not appears to be influenced by the intervention. | Not clear (0) Comment: authors do not specify if data analysts were blinded to the study. Healthcare workers could not have been blinded to the introduction of the new devices. | Done (1) Comment: data is available for all health workers. | Done (1) Coment: | 6 |
| Sosai 2010 | Not done (0) Comment: authors indicated that some conventional devices were still used during the intervention period despite study which aimed to replace all conventional devices by new safety devices. | Done (1) comment: inlcusion of 3 data points before and after, the study was reanalysed using ARIMA model. | Done (1) Comment: we reanalysed the study for trend. | Not done (0) Quote: "after launching the sharps awareness campaign in 2003, # of injuries increased possibility because of sharps awareness campaign" Comment: intervention seems to have affected reporting of NSI. | Not clear (0) Comment: information on blinding is not reported. | Done (1) Comment: all hospital employees were included in the study. | Done (1) Comment: used the incident reporting system throughout the study which appears to be adequate measure for NSI. | 4 |
| Edmond 1988 | Not clear (0) Comment: no information if additional changes were introduced during the same period at the hospital. | Done (1) Comment: inlcusion of 3 data points before and after, the study was reanalysed using ARIMA model. | Done (1) Comment: we reanalysed the study for trend. | Done (1) Comment: intervention does not appears to have affected method of data collection. | Not clear (0) Quote: "the subjects were unaware of the nature of the study". Comment: the reporting of the NSI was not likely to be affected by the staff knowing of the study. However, health workers would be aware of the change in the type of devices used. | Not clear (0) Comment: information about the number of nurses for pre‐intervention but not for post‐intervention. For NSI, the number of staff per year is not available. | Done (1) Comment: authors used employee health records for pre and post intervention. For NSI, this system appears reliable for the outcome of interest. | 4 |
| Richard 2001 | Not clear (0) Comment: no information if additional changes were introduced during the same period at the hospital. | Done (1) Comment: inlcusion of 3 data points before and after, the study was reanalysed using ARIMA model. | Done (1) Comment: we reanalysed the study for trend. | Not done (0) Quote: the increase in total injuries reported in 1998 followed a better reporting stimulated by the second educational program. Comment: the reporting system started in 1993, it is possible that as more people became aware of the surveillance system, there was an increase in reporting. | Not clear (0) Comment: No information is available on blinding | Not clear (0) Comment: no information on the actual number of healthcare workers included during pre and post intervention. | Not clear (0) Comment: it is unclear if the reporting system was used consistently throughout the years especially as it was launched during the early phase of the study. | 2 |
| Chambers 2015 hospitals | Done (1) Comment: safety devices seem to have replaced the conventional devices due to legislation. | Done (1) Comment: inlcusion of 3 data points before and after, the study was reanalysed using ARIMA model. | Done (1) Comment: we reanalysed the study for trend. | Not clear (0) Comment: Increased attention to needle stick injury prevention during the period of regulatory change may have resulted in increased reporting. | Done (1) Comment: data was obtained from an administrative source. | Not done (0) Comment: the data set represented 63 percent of all needlestick injury claims. | Done (1) Comment: authors used work place safety and insurance board data for compensation claims. For NSI, this system appears reliable for the outcome of interest. | 5 |
| Chambers 2015 long‐term nursing care | Done (1) Comment: safety devices seem to have replaced the conventional devices due to legislation. | Done (1) Comment: inlcusion of 3 data points before and after, the study was reanalysed using ARIMA model. | Done (1) Comment: we reanalysed the study for trend. | Not clear (0) Comment: Increased attention to needle stick injury prevention during the period of regulatory change may have resulted in increased reporting. | Done (1) Comment: data was obtained from an administrative source. | Not done (0) Comment: the data set represented 63 percent of all needlestick injury claims. | Done (1) Comment: authors used work place safety and insurance board data for compensation claims. For NSI, this system appears reliable for the outcome of interest. | 5 |
| Goris 2015 | Done (1) Quote: "The existing inventories of subcutaneous active safety‐engineered devices were removed and replaced with subcutaneous passive safety‐engineered devices" Comment: All conventional devices were replaced by safety‐engineered devices at the start of the intervention. | Done (1) Comment: inlcusion of 3 data points before and after, the study was reanalysed using ARIMA model. | Done (1) Comment: we reanalysed the study for trend. | Not clear (0) Comment: the reporting might have increased after inrodcution of the passive safety‐engineered device due to heightened awareness. | Done (1) Comment: data was obtained from an administrative source. | Done (1) Comment: data for all the healthcare workers was provided in the form of employee productive hours in the pre and post intervention phase. | Done(1) Comment: authors used BJC occupational health database records for pre and post intervention. This being administrative data appears to be reliable for the outcome of interest. | 6 |
| Phillips 2013 | Done (1) Comment: safety devices seem to have replaced the conventional devices due to legislation. | Done (1) Comment: inlcusion of 3 data points before and after, the study was reanalysed using ARIMA model. | Done (1) Comment: we reanalysed the study for trend. | Not clear (0) | Done (1) Comment: data was obtained from an administrative source. | Not done (0) Comment: Data set represented only 73% of the total sample. | Done (1) Comment: Data was obtained from the US Exposure Prevention Information Network (EPINet) sharps injury surveillance database. This appears to be adequate measure for NSIs. | 5 |
| Whitby 2008 | Not clear (0) | Done (1) Comment: inlcusion of 3 data points before and after, the study was reanalysed using ARIMA model. | Done (1) Comment: we reanalysed the study for trend. | Done (1) Comment: the constant and unchanging rate of NSI with solid suture needles implies that reduction of NSI relates neither to the education program associated or increased reporting rates. | Not done (0) Comment: health workers were aware of the change in the type of devices used. | Done (1) Comment: data is available for all health workers. | Done (1) Comment: used the same system of reporting of NSI in pre and post intervention period to the infectious diseases department which has been in place since 1996. | 5 |
| Comparison and outcome | Starting level | Risk of bias | Consistency | Directness | Precision | Publication bias | Quality of evidence |
| Safe versus traditional blood collection systems RCT ‐ all outcomes | high | 1 RCT high RoB | consistent | direct | wide CI | impossible to determine | very low |
| Safe versus traditional blood collection systems ITS | low | 2 ITS high RoB | consistent | direct | wide CI | impossible to determine | very low |
| Safe versus traditional IV systems RCT ‐ all outcomes | high | 5 RCT high RoB, 1 RCT low RoB | consistent | direct | wide CI | impossible to determine | very low |
| Safe versus traditional IV systems CBA | low | 1 CBA high RoB | consistent | direct | wide CI | impossible to determine | very low |
| Safe versus traditional IV systems ITS | low | 1 ITS low RoB, 1 ITS high RoB | consistent | direct | wide CI | impossible to determine | very low |
| Safe versus traditional injection systems RCT | high | 1 RCT high RoB | consistent | indirect; hospital | wide CI | impossible to determine | very low |
| Safe versus traditional injection systems CBA | low | 1 CBA high RoB | consistent | indirect; dentists | wdie CI | impossible to determine | very low |
| Safe pasive injection systems versus safe active injection systems ITS | low | 1 ITS low RoB | consistent | direct | wide CI | impossible to determine | very low |
| Multiple safe versus traditional devices ITS | low | 2 ITS high RoB | inconsistent | direct | wide CI | impossible to determine | very low |
| Multiple safe versus traditional devices CBA | low | 1 CBA high RoB | consistent | direct | wide CI | impossible to determine | very low |
| Sharps containers versus no containers ITS | low | 1 ITS low RoB, 1 ITS high RoB | inconsistent | direct | wide CI | impossible to determine | very low |
| Sharps containers versus no containers CBA ‐ all outcomes | low | 1 CBA high RoB | consistent | direct | wide CI | impossible to determine | very low |
| Legislation versus no legislation ITS | low | 2 ITS high RoB | consistent | direct | wide CI | impossible to determine | low |
| Outcome or subgroup title | No. of studies | No. of participants | Statistical method | Effect size |
| 1 Needlestick injuries immediate follow up Show forest plot | 1 | Risk Ratio (M‐H, Random, 95% CI) | Totals not selected | |
| 2 Blood splashes Show forest plot | 1 | Risk Ratio (M‐H, Random, 95% CI) | Totals not selected | |
| Outcome or subgroup title | No. of studies | No. of participants | Statistical method | Effect size |
| 1 Number of reported sharps injuries, level Show forest plot | 2 | Effect Size (Random, 95% CI) | ‐3.84 [‐9.56, 1.88] | |
| 1.1 Cap shield | 1 | Effect Size (Random, 95% CI) | ‐1.04 [‐2.27, 0.19] | |
| 1.2 Needle sheath | 1 | Effect Size (Random, 95% CI) | ‐6.88 [‐9.53, ‐4.23] | |
| 2 Number of reported sharps injuries, slope Show forest plot | 2 | Effect Size (Fixed, 95% CI) | Totals not selected | |
| 2.1 Cap shield | 1 | Effect Size (Fixed, 95% CI) | 0.0 [0.0, 0.0] | |
| 2.2 Needle sheath | 1 | Effect Size (Fixed, 95% CI) | 0.0 [0.0, 0.0] | |
| Outcome or subgroup title | No. of studies | No. of participants | Statistical method | Effect size |
| 1 Needlestick injuries Show forest plot | 3 | Rate Ratio (Fixed, 95% CI) | 0.62 [0.27, 1.41] | |
| 2 Incidences of blood contamination Show forest plot | 6 | 1489 | Risk Ratio (M‐H, Fixed, 95% CI) | 1.38 [1.00, 1.92] |
| 2.1 Active systems | 4 | 961 | Risk Ratio (M‐H, Fixed, 95% CI) | 1.60 [1.08, 2.36] |
| 2.2 Passive systems | 2 | 528 | Risk Ratio (M‐H, Fixed, 95% CI) | 0.94 [0.50, 1.75] |
| 3 Incidence of blood leakage Show forest plot | 1 | Risk Ratio (M‐H, Fixed, 95% CI) | Totals not selected | |
| 3.1 Active systems | 1 | Risk Ratio (M‐H, Fixed, 95% CI) | 0.0 [0.0, 0.0] | |
| Outcome or subgroup title | No. of studies | No. of participants | Statistical method | Effect size |
| 1 Number of needlestick injuries Show forest plot | 1 | Rate Ratio (Fixed, 95% CI) | Totals not selected | |
| Outcome or subgroup title | No. of studies | No. of participants | Statistical method | Effect size |
| 1 Number of reported sharps injuries, level Show forest plot | 2 | Effect Size (Random, 95% CI) | Totals not selected | |
| 2 Number of reported sharps injuries, slope Show forest plot | 2 | Effect Size (Random, 95% CI) | Totals not selected | |
| Outcome or subgroup title | No. of studies | No. of participants | Statistical method | Effect size |
| 1 Questionnaire reported Needlestick injuries 6 mo follow up Show forest plot | 1 | Risk Ratio (M‐H, Fixed, 95% CI) | Totals not selected | |
| 2 Hospital reported Needlestick injuries 6 mo follow up Show forest plot | 1 | Odds Ratio (M‐H, Fixed, 95% CI) | Totals not selected | |
| 3 Questionnaire reported Needlestick injuries 12 mo follow up Show forest plot | 1 | Odds Ratio (M‐H, Fixed, 95% CI) | Totals not selected | |
| 4 Hospital reported Needlestick injuries 12 mo follow up Show forest plot | 1 | Odds Ratio (M‐H, Fixed, 95% CI) | Totals not selected | |
| Outcome or subgroup title | No. of studies | No. of participants | Statistical method | Effect size |
| 1 Needlestick injury rate Show forest plot | 1 | Rate Ratio (Fixed, 95% CI) | Totals not selected | |
| Outcome or subgroup title | No. of studies | No. of participants | Statistical method | Effect size |
| 1 change in level of needlestick injuries Show forest plot | 1 | Effect size (Random, 95% CI) | Totals not selected | |
| 2 Change in slope of needlestick injuries Show forest plot | 1 | Effect Size (Random, 95% CI) | Totals not selected | |
| Outcome or subgroup title | No. of studies | No. of participants | Statistical method | Effect size |
| 1 Number of reported sharps injuries, level Show forest plot | 2 | Effect Size (Random, 95% CI) | Totals not selected | |
| 2 Number of reported sharps injuries, slope Show forest plot | 2 | Effect Size (Random, 95% CI) | 0.25 [‐0.30, 0.81] | |
| Outcome or subgroup title | No. of studies | No. of participants | Statistical method | Effect size |
| 1 Needlestick injuries Show forest plot | 1 | Rate Ratio (Fixed, 95% CI) | Totals not selected | |
| Outcome or subgroup title | No. of studies | No. of participants | Statistical method | Effect size |
| 1 Number of reported sharps injuries, level Show forest plot | 2 | Effect Size (Random, 95% CI) | 2.49 [0.49, 4.48] | |
| 2 Number of reported sharps injuries, slope Show forest plot | 2 | Effect Size (Random, 95% CI) | Totals not selected | |
| Outcome or subgroup title | No. of studies | No. of participants | Statistical method | Effect size |
| 1 Number of needlestick injuries Show forest plot | 1 | Rate Ratio (Fixed, 95% CI) | Totals not selected | |
| 2 Number of container related needlestick injuries Show forest plot | 1 | Rate Ratio (Fixed, 95% CI) | Totals not selected | |
| Outcome or subgroup title | No. of studies | No. of participants | Statistical method | Effect size |
| 1 NSI‐ change in level Show forest plot | 3 | Effect Size (Random, 95% CI) | Subtotals only | |
| 1.1 Interruption | 2 | Effect Size (Random, 95% CI) | ‐6.15 [‐7.76, ‐4.54] | |
| 1.2 Gradual introduction | 1 | Effect Size (Random, 95% CI) | 0.80 [0.41, 1.19] | |
| 2 NSI‐ Change in slope Show forest plot | 3 | Effect Size (Random, 95% CI) | Subtotals only | |
| 2.1 Interruption | 2 | Effect Size (Random, 95% CI) | ‐0.94 [‐1.97, 0.09] | |
| 2.2 Gradual introduction | 1 | Effect Size (Random, 95% CI) | 0.5 [0.36, 0.64] | |