Dispositivos para la prevención de las lesiones por exposición percutánea causadas por agujas en el personal sanitario
Información
- DOI:
- https://doi.org/10.1002/14651858.CD009740.pub3Copiar DOI

- Base de datos:
-
- Cochrane Database of Systematic Reviews
- Versión publicada:
-
- 14 noviembre 2017see what's new
- Tipo:
-
- Intervention
- Etapa:
-
- Review
- Grupo Editorial Cochrane:
-
Grupo Cochrane de Salud laboral
- Copyright:
-
- Copyright © 2017 The Cochrane Collaboration. Published by John Wiley & Sons, Ltd.
Cifras del artículo
Altmetric:
Citado por:
Autores
Contributions of authors
Conceiving and designing the review: JV, ML and VR.
Co‐ordinating the review: JV and VR.
Data extraction: JV, MC, MP and VR.
Data analyses: JV, MC and VR.
Data interpretation: JV, MC and VR.
Writing of the review: MC, JV and VR.
Sources of support
Internal sources
-
Finnish Institute of Occupational Health, Finland.
Provided salary and office facilities and resources for Jos Verbeek
-
Pan American Health Organization, USA.
Provided salaries and office facilities and resources as well as support to attend Cochrane training sessions for Manisha Pahwa and Marie‐Claude Lavoie
External sources
-
No sources of support supplied
Declarations of interest
Viraj Reddy: None known.
Marie‐Claude Lavoie: None known.
Jos Verbeek: None known.
Manisha Pahwa: None known.
Acknowledgements
We thank Annika Saarto (neé Parantainen) for her groundwork as the initial first author of this protocol. We thank Minna Anthoni and Ulla‐Maija Hellgren who participated in the writing of an early version of the first protocol. We extend our gratitude to Ms Leena Isotalo, the Trials Search Coordinator of the Cochrane Work Review Group, for designing the systematic search strategies. We would also like to thank Dimitrinka Nikolova and Christian Gluud from Cochrane Hepato‐Biliary for their comments on an early version of our protocol and Jani Ruotsalainen from Cochrane Work and Janet Wale from the Bone, Joint and Muscle Trauma for copy editing the text.
Version history
| Published | Title | Stage | Authors | Version |
| 2017 Nov 14 | Devices for preventing percutaneous exposure injuries caused by needles in healthcare personnel | Review | Viraj K Reddy, Marie‐Claude Lavoie, Jos H Verbeek, Manisha Pahwa | |
| 2014 Mar 09 | Devices for preventing percutaneous exposure injuries caused by needles in healthcare personnel | Review | Marie‐Claude Lavoie, Jos H Verbeek, Manisha Pahwa | |
| 2012 Apr 18 | Devices for preventing percutaneous exposure injuries caused by needles in health care personnel | Protocol | Marie‐Claude Lavoie, Jos H Verbeek, Annika Parantainen, Manisha Pahwa | |
Differences between protocol and review
The protocol stated that the interventions would be categorized based on the type of device: 1) safety engineered devices for blood collection; 2) safety engineered devices for Injecting fluids; and 3) containers for collecting sharps. During the review process, we added three more categories, intravenous systems, multiple safety devices and legislation as two studies included more than one type of device as part of their intervention.
Notes
The protocol for this review was first published as "Prevention of percutaneous injuries with risk of hepatitis B, hepatitis C, or other viral infections for healthcare workers" (Parantainen 2008). Our initial idea was to include all interventions used to prevent needlestick injuries. However, after the publication of the protocol it became apparent that very many studies would be eligible for inclusion. The decision was therefore made to split the protocol up into four new protocols. The resulting two published reviews and one protocol are titled: "Blunt versus sharp suture needles for preventing percutaneous exposure incidents in surgical staff" (Saarto 2011), "Education and training for preventing percutaneous exposure injuries in healthcare personnel" (Cheetham 2016) and "Gloves, extra gloves or special types of gloves for preventing percutaneous exposure injuries in healthcare personnel" (Mischke 2014).
The original protocol was hosted by Cochrane Hepato‐Biliary but due to the heavy involvement of Jos Verbeek and Cochrane Work the new titles were registered under their aegis.
Keywords
MeSH
Medical Subject Headings (MeSH) Keywords
- *Health Personnel;
- *Protective Devices;
- Blood Specimen Collection [*instrumentation, methods];
- Controlled Before‐After Studies;
- Infusions, Intravenous [instrumentation];
- Injections [instrumentation];
- Needlestick Injuries [epidemiology, *prevention & control];
- Occupational Diseases [epidemiology, *prevention & control];
- Personal Protective Equipment;
- Randomized Controlled Trials as Topic;
Medical Subject Headings Check Words
Humans;

Study flow diagram for 2017 update

Risk of bias graph: review authors' judgements about each risk of bias item presented as percentages across all included studies.

Risk of bias summary: review authors' judgements about each risk of bias item for each included study.
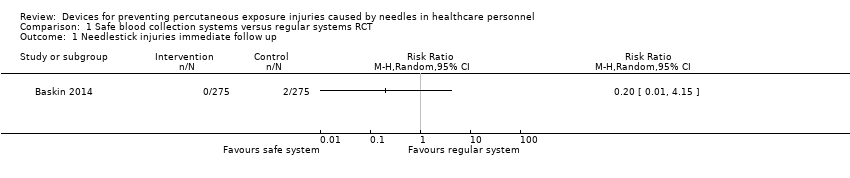
Comparison 1 Safe blood collection systems versus regular systems RCT, Outcome 1 Needlestick injuries immediate follow up.

Comparison 1 Safe blood collection systems versus regular systems RCT, Outcome 2 Blood splashes.
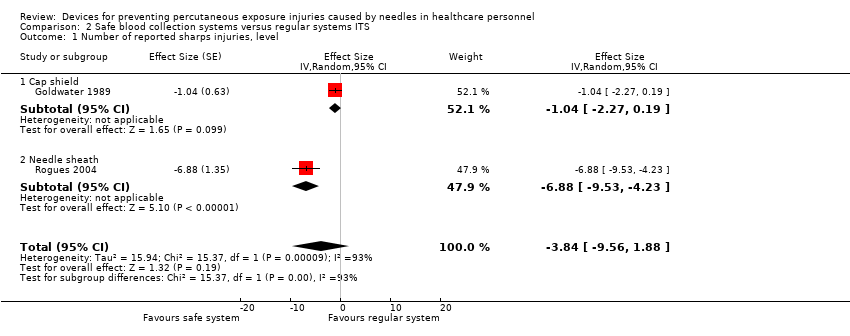
Comparison 2 Safe blood collection systems versus regular systems ITS, Outcome 1 Number of reported sharps injuries, level.

Comparison 2 Safe blood collection systems versus regular systems ITS, Outcome 2 Number of reported sharps injuries, slope.

Comparison 3 Safe intravenous systems versus regular systems RCT, Outcome 1 Needlestick injuries.

Comparison 3 Safe intravenous systems versus regular systems RCT, Outcome 2 Incidences of blood contamination.
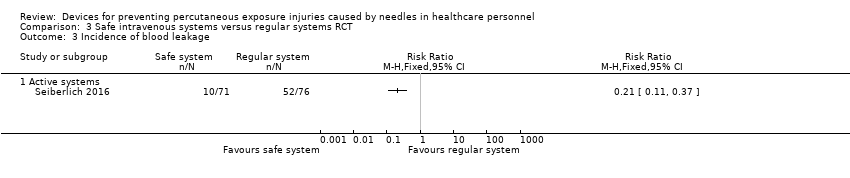
Comparison 3 Safe intravenous systems versus regular systems RCT, Outcome 3 Incidence of blood leakage.

Comparison 4 Safe intravenous systems versus regular systems CBA, Outcome 1 Number of needlestick injuries.
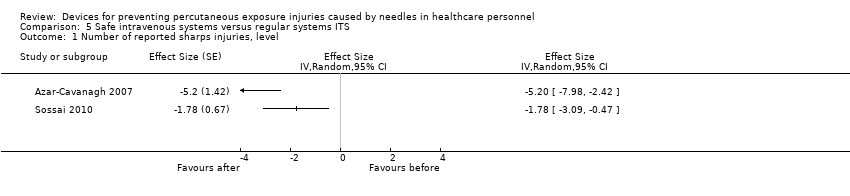
Comparison 5 Safe intravenous systems versus regular systems ITS, Outcome 1 Number of reported sharps injuries, level.

Comparison 5 Safe intravenous systems versus regular systems ITS, Outcome 2 Number of reported sharps injuries, slope.

Comparison 6 Safe injection systems versus regular systems RCT, Outcome 1 Questionnaire reported Needlestick injuries 6 mo follow up.

Comparison 6 Safe injection systems versus regular systems RCT, Outcome 2 Hospital reported Needlestick injuries 6 mo follow up.

Comparison 6 Safe injection systems versus regular systems RCT, Outcome 3 Questionnaire reported Needlestick injuries 12 mo follow up.

Comparison 6 Safe injection systems versus regular systems RCT, Outcome 4 Hospital reported Needlestick injuries 12 mo follow up.

Comparison 7 Safe injection systems versus regular systems CBA, Outcome 1 Needlestick injury rate.

Comparison 8 Safe passive injection systems versus safe active injection systems ITS, Outcome 1 change in level of needlestick injuries.

Comparison 8 Safe passive injection systems versus safe active injection systems ITS, Outcome 2 Change in slope of needlestick injuries.
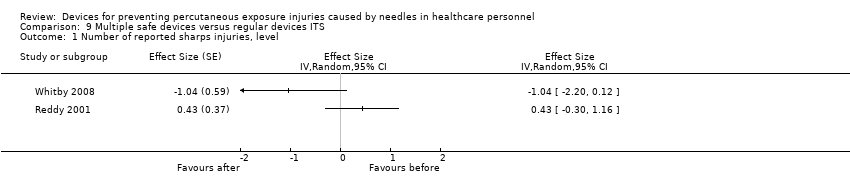
Comparison 9 Multiple safe devices versus regular devices ITS, Outcome 1 Number of reported sharps injuries, level.
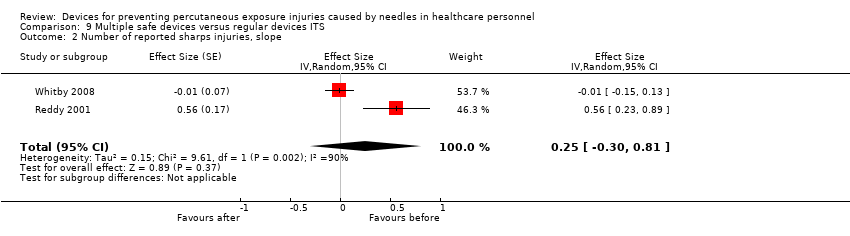
Comparison 9 Multiple safe devices versus regular devices ITS, Outcome 2 Number of reported sharps injuries, slope.
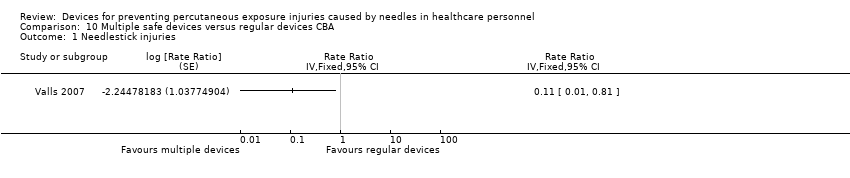
Comparison 10 Multiple safe devices versus regular devices CBA, Outcome 1 Needlestick injuries.
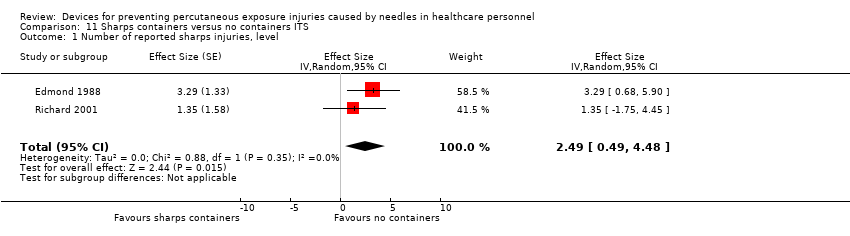
Comparison 11 Sharps containers versus no containers ITS, Outcome 1 Number of reported sharps injuries, level.

Comparison 11 Sharps containers versus no containers ITS, Outcome 2 Number of reported sharps injuries, slope.
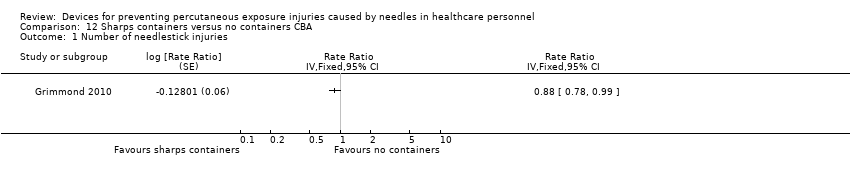
Comparison 12 Sharps containers versus no containers CBA, Outcome 1 Number of needlestick injuries.
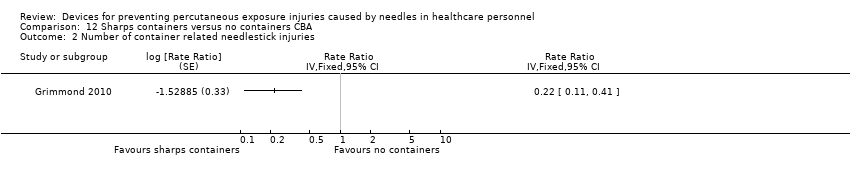
Comparison 12 Sharps containers versus no containers CBA, Outcome 2 Number of container related needlestick injuries.

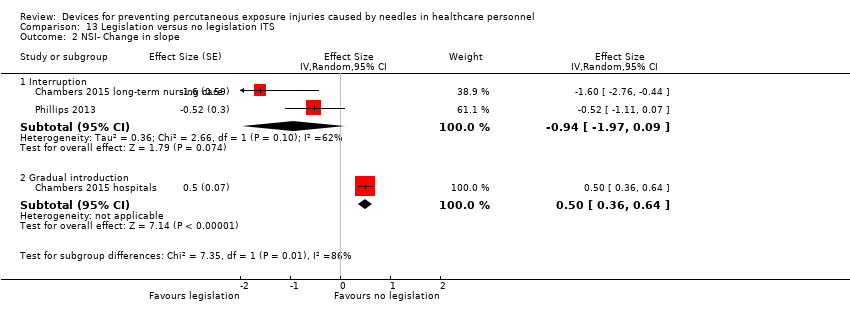
Comparison 13 Legislation versus no legislation ITS, Outcome 1 NSI‐ change in level.
Comparison 13 Legislation versus no legislation ITS, Outcome 2 NSI‐ Change in slope.
| Safe blood collection systems compared to regular systems for preventing percutaneous exposure injuries caused by needles in healthcare personnel (RCTs) | ||||||
| Patient or population: preventing percutaneous exposure injuries caused by needles in healthcare personnel (RCTs) | ||||||
| Outcomes | Anticipated absolute effects* (95% CI) | Relative effect | № of participants | Quality of the evidence | Comments | |
| Risk with regular systems | Risk with Safe blood collection systems | |||||
| Needlestick injuries immediate follow up | Study population | RR 0.20 | 550 | ⊕⊝⊝⊝ | ||
| 7 per 1 000 | 1 per 1 000 | |||||
| Blood splashes | Study population | RR 0.14 | 550 | ⊕⊝⊝⊝ | ||
| 25 per 1 000 | 4 per 1 000 | |||||
| *The risk in the intervention group (and its 95% confidence interval) is based on the assumed risk in the comparison group and the relative effect of the intervention (and its 95% CI). | ||||||
| GRADE Working Group grades of evidence | ||||||
| 1 We downgraded the quality of evidence by one level due to risk of bias (selection bias, performance bias and detection bias). | ||||||
| Safe blood collection systems compared to regular systems for preventing percutaneous exposure injuries caused by needles in healthcare personnel (ITS) | |||
| Patient or population: preventing percutaneous exposure injuries caused by needles in healthcare personnel (ITS) | |||
| Outcomes | Impact | № of participants | Quality of the evidence |
| Number of reported sharps injuries, level ‐ reported seperately for needle sheath and cap shield studies | Needle sheath study: effect size ‐6.88; confidence interval ‐9.53 to ‐4.23. Cap shield study: effect size ‐1.04; confidence interval ‐2.27 to 0.19. | (2 observational studies) | ⊕⊝⊝⊝ |
| Number of reported sharps injuries, slope ‐ reported seperately for needle sheath and cap shield studies | Needle sheath study: effect size ‐1.19; confidence interval ‐2.50 to 0.12. Cap shield study: effect size ‐1.00; confidence interval ‐2.22 to ‐0.22. | (2 observational studies) | ⊕⊝⊝⊝ |
| Interpretation of effect size: small (0‐0.2) medium (0.2‐0.5) large (0.6 and above), an effect size with negative sign implies decrease and positive sign implies increase of effect. | |||
| GRADE Working Group grades of evidence | |||
| 1 We downgraded the quality of evidence by two levels due to heterogeneity (I² = 93%). | |||
| Safe intravenous systems compared to regular systems RCT for preventing percutaneous exposure injuries caused by needles in healthcare personnel | ||||||
| Patient or population: preventing percutaneous exposure injuries caused by needles in healthcare personnel | ||||||
| Outcomes | Anticipated absolute effects* (95% CI) | Relative effect | № of participants | Quality of the evidence | Comments | |
| Risk with regular systems RCT | Risk with Safe intravenous systems | |||||
| Needlestick injuries | Study population | Rate ratio 0.62 | (1 RCT, three arms) | ⊕⊝⊝⊝ | Calculated based on 1000 patient days | |
| 0.71 per 1 000 | 0.44 per 1 000 | |||||
| Incidences of blood contamination ‐ Active systems | Study population | RR 1.60 | 961 | ⊕⊕⊝⊝ | ||
| 92 per 1 000 | 148 per 1 000 | |||||
| Incidences of blood contamination ‐ Passive systems | Study population | RR 0.94 | 528 | ⊕⊕⊝⊝ | ||
| 79 per 1 000 | 74 per 1 000 | |||||
| Incidence of blood leakage ‐ Active systems | Study population | RR 0.21 | 147 | ⊕⊕⊝⊝ | ||
| 684 per 1 000 | 144 per 1 000 | |||||
| *The risk in the intervention group (and its 95% confidence interval) is based on the assumed risk in the comparison group and the relative effect of the intervention (and its 95% CI). | ||||||
| GRADE Working Group grades of evidence | ||||||
| 1 We downgraded the quality of evidence by two levels due to risk of bias (serious attrition). | ||||||
| Safe intravenous systems compared to regular systems CBA for preventing percutaneous exposure injuries caused by needles in healthcare personnel | ||||||
| Patient or population: preventing percutaneous exposure injuries caused by needles in healthcare personnel | ||||||
| Outcomes | Anticipated absolute effects* (95% CI) | Relative effect | № of participants | Quality of the evidence | Comments | |
| Risk with regular systems CBA | Risk with Safe intravenous systems | |||||
| Number of needlestick injuries | Study population | Rate ratio 0.06 | (1 observational study) | ⊕⊝⊝⊝ | ||
| 36.36 per 1 000 | 2.18 per 1 000 | |||||
| *The risk in the intervention group (and its 95% confidence interval) is based on the assumed risk in the comparison group and the relative effect of the intervention (and its 95% CI). | ||||||
| GRADE Working Group grades of evidence | ||||||
| 1 We downgraded the quality of evidence by two levels due to risk of bias (no random sequence generation or allocation concealment). | ||||||
| Safe intravenous systems compared to regular systems ITS for preventing percutaneous exposure injuries caused by needles in healthcare personnel | |||
| Patient or population: preventing percutaneous exposure injuries caused by needles in healthcare personnel | |||
| Outcomes | Impact | № of participants | Quality of the evidence |
| Number of reported sharps injuries, level | Study 1: effect size ‐5.20; confidence interval ‐7.98 to ‐2.42. Study 2: effect size ‐1.78; confidence interval ‐3.09 to ‐0.47. | (2 observational studies) | ⊕⊝⊝⊝ |
| Number of reported sharps injuries, slope | Study 1: Effect size ‐7.86; confidence interval ‐9.13 to ‐6.59. Study 2: Effect size 0.35; confidence interval ‐0.20 to 0.90. | (2 observational studies) | ⊕⊝⊝⊝ |
| Interpretation of effect size: small (0‐0.2) medium (0.2‐0.5) large (0.6 and above), a effect size with negative sign implies decrease and positive sign implies increase of effect. | |||
| GRADE Working Group grades of evidence | |||
| 1 We downgraded the quality of evidence by one level due to risk of bias caused by lacking intervention fidelity (in the second study conventional devices were used during intervention period). | |||
| Safe injection systems compared to regular systems RCT for preventing percutaneous exposure injuries caused by needles in healthcare personnel | ||||||
| Patient or population: preventing percutaneous exposure injuries caused by needles in healthcare personnel | ||||||
| Outcomes | Anticipated absolute effects* (95% CI) | Relative effect | № of participants | Quality of the evidence | Comments | |
| Risk with regular systems RCT | Risk with Safe injection systems | |||||
| Questionnaire reported Needlestick injuries 6 mo follow up | Study population | RR 0.42 | 154 | ⊕⊝⊝⊝ | ||
| 140 per 1 000 | 59 per 1 000 | |||||
| Questionnaire reported Needlestick injuries 12 mo follow up | Study population | OR 0.20 | 144 | ⊕⊝⊝⊝ | ||
| 119 per 1 000 | 26 per 1 000 | |||||
| Hospital reported Needlestick injuries 6 mo follow up | Study population | OR 1.20 | 533 | ⊕⊝⊝⊝ | ||
| 38 per 1 000 | 45 per 1 000 | |||||
| Hospital reported Needlestick injuries 12 mo follow up | Study population | OR 0.72 | 533 | ⊕⊝⊝⊝ | ||
| 41 per 1 000 | 30 per 1 000 | |||||
| *The risk in the intervention group (and its 95% confidence interval) is based on the assumed risk in the comparison group and the relative effect of the intervention (and its 95% CI). | ||||||
| GRADE Working Group grades of evidence | ||||||
| 1 We downgraded the quality of evidence by two levels due to risk of bias (high attrition). | ||||||
| Safe injection systems compared to regular systems CBA for preventing percutaneous exposure injuries caused by needles in healthcare personnel | ||||||
| Patient or population: preventing percutaneous exposure injuries caused by needles in healthcare personnel | ||||||
| Outcomes | Anticipated absolute effects* (95% CI) | Relative effect | № of participants | Quality of the evidence | Comments | |
| Risk with regular systems CBA | Risk with Safe injection systems | |||||
| Needlestick injury rate | Study population | Rate ratio 0.34 | (1 observational study) | ⊕⊝⊝⊝ | Calculated based on 1000 person years | |
| 236 per 1 000 | 80.24 per 1 000 | |||||
| *The risk in the intervention group (and its 95% confidence interval) is based on the assumed risk in the comparison group and the relative effect of the intervention (and its 95% CI). | ||||||
| GRADE Working Group grades of evidence | ||||||
| 1 We downgraded the quality of evidence by two levels due to risk of bias (no random sequence generation or allocation concealment). | ||||||
| Safe passive injection systems compared to safe active injection systems ITS for preventing percutaneous exposure injuries caused by needles in healthcare personnel | |||
| Patient or population: preventing percutaneous exposure injuries caused by needles in healthcare personnel | |||
| Outcomes | Impact | № of participants | Quality of the evidence |
| Change in level of needlestick injuries | Effect size 0.23; confidence interval ‐1.89 to 2.35. | (1 observational study) | ⊕⊝⊝⊝ |
| Change in slope of needlestick injuries | Effect size ‐0.74; confidence interval ‐1.66 to 0.18. | (1 observational study) | ⊕⊕⊝⊝ |
| Interpretation of effect size: small (0‐0.2) medium (0.2‐0.5) large (0.6 and above), a effect size with negative sign implies decrease and positive sign implies increase of effect. | |||
| GRADE Working Group grades of evidence | |||
| 1 We downgraded the quality of evidence by one level due to imprecision (wide confidence interval). | |||
| Multiple safe devices compared to regular devices ITS for preventing percutaneous exposure injuries caused by needles in healthcare personnel | |||
| Patient or population: preventing percutaneous exposure injuries caused by needles in healthcare personnel | |||
| Outcomes | Impact | № of participants | Quality of the evidence |
| Number of reported sharps injuries, level | Study 1: effect size ‐1.04; confidence interval ‐2.20 to 0.12. Study 2: effect size 0.43; confidence interval ‐0.30 to 1.16. | (2 observational studies) | ⊕⊝⊝⊝ |
| Number of reported sharps injuries, slope | Study 1: effect size ‐0.01; confidence interval ‐0.15 to 0.13. Study 2: effect size 0.56; confidence interval 0.23 to 0.89. | (2 observational studies) | ⊕⊝⊝⊝ |
| Interpretation of effect size: small (0‐0.2) medium (0.2‐0.5) large (0.6 and above), a effect size with negative sign implies decrease and positive sign implies increase of effect. | |||
| GRADE Working Group grades of evidence | |||
| 1 We downgraded the quality of evidence by one level due to risk of bias (One study had a low risk of bias but the other study had a high risk as conventional devices were still available after the intervention began). | |||
| Multiple safe devices compared to regular devices CBA for preventing percutaneous exposure injuries caused by needles in healthcare personnel | ||||||
| Patient or population: preventing percutaneous exposure injuries caused by needles in healthcare personnel | ||||||
| Outcomes | Anticipated absolute effects* (95% CI) | Relative effect | № of participants | Quality of the evidence | Comments | |
| Risk with regular devices CBA | Risk with Multiple safe devices | |||||
| Needle stick injuries | Study population | Rate ratio 0.11 | (1 observational study) | ⊕⊝⊝⊝ | Calculated based on 1000 patient days | |
| 0.44 per 1 000 | 0.052 per 1 000 | |||||
| *The risk in the intervention group (and its 95% confidence interval) is based on the assumed risk in the comparison group and the relative effect of the intervention (and its 95% CI). | ||||||
| GRADE Working Group grades of evidence | ||||||
| 1 We downgraded the quality of evidence by two levels due to risk of bias (no random sequence generation or allocation concealment). | ||||||
| Sharps containers compared to no containers ITS for preventing percutaneous exposure injuries caused by needles in healthcare personnel | |||
| Patient or population: preventing percutaneous exposure injuries caused by needles in healthcare personnel | |||
| Outcomes | Impact | № of participants | Quality of the evidence |
| Number of reported sharps injuries, level | Study 1: effect size 3.29; confidence interval 0.68 to 5.90. Study 2: effect size 1.35; confidence interval ‐1.75 to 4.45. | (2 observational studies) | ⊕⊝⊝⊝ |
| Number of reported sharps injuries, slope | Study 1: effect size 0.02; confidence interval ‐1.06 to 1.10. Study 2: effect size 2.55; confidence interval 1.20 to 3.90. | (2 observational studies) | ⊕⊝⊝⊝ |
| Interpretation of effect size: small (0‐0.2) medium (0.2‐0.5) large (0.6 and above), a effect size with negative sign implies decrease and positive sign implies increase of effect. | |||
| GRADE Working Group grades of evidence | |||
| 1 We downgraded the quality of evidence by one level due to inconsistency (study 2 showed an increase in reporting). | |||
| Sharps containers compared to no containers CBA for preventing percutaneous exposure injuries caused by needles in healthcare personnel | ||||||
| Patient or population: preventing percutaneous exposure injuries caused by needles in healthcare personnel | ||||||
| Outcomes | Anticipated absolute effects* (95% CI) | Relative effect | № of participants | Quality of the evidence | Comments | |
| Risk with no containers CBA | Risk with Sharps containers | |||||
| Number of needlestick injuries | Study population | Rate ratio 0.88 | (1 observational study) | ⊕⊝⊝⊝ | ||
| 28.3 per 1 000 | 24.9 per 1 000 | |||||
| Number of container related needlestick injuries | Study population | Rate ratio 0.22 | (1 observational study) | ⊕⊝⊝⊝ | ||
| 2.6 per 1 000 | 0.6 per 1 000 | |||||
| *The risk in the intervention group (and its 95% confidence interval) is based on the assumed risk in the comparison group and the relative effect of the intervention (and its 95% CI). | ||||||
| GRADE Working Group grades of evidence | ||||||
| 1 We downgraded the quality of evidence by two levels due to risk of bias (no random sequence generation or allocation concealment). | ||||||
| Legislation compared to no legislation ITS for preventing percutaneous exposure injuries caused by needles in healthcare personnel | |||
| Patient or population: preventing percutaneous exposure injuries caused by needles in healthcare personnel | |||
| Outcomes | Impact | № of participants | Quality of the evidence |
| NSI‐ change in level ‐ Interruption | Effect size ‐6.15; confidence interval ‐7.76 to ‐4.54. | (2 observational studies) | ⊕⊕⊕⊝ |
| NSI‐ change in level ‐ Gradual introduction | Effect size 0.80; confidence interval 0.41 to 1.19. | (1 observational study) | ⊕⊕⊝⊝ |
| NSI‐ Change in slope ‐ Interruption | Effect size ‐0.94; confidence interval ‐1.97 to 0.09 | (2 observational studies) | ⊕⊝⊝⊝ |
| NSI‐ Change in slope ‐ Gradual introduction | Effect size 0.50; confidence interval 0.36 to 0.64 | (1 observational study) | ⊕⊕⊝⊝ |
| Interpretation of effect size: small (0‐0.2) medium (0.2‐0.5) large (0.6 and above), a effect size with negative sign implies decrease and positive sign implies increase of effect. | |||
| GRADE Working Group grades of evidence | |||
| 1 We downgraded the quality of evidence by one level due to risk of bias (dataset did not represent the whole sample). | |||
| Study name | Device Commercial Names | Device Category | Safety Device type | passive/ active | For sale? |
| Asai 1999 active | Insyte AutoGuard intravenous cannula | Safe IV system (insertion) | button for actively retracting the needle | active | Yes |
| Asai 2002 active | Insyte Autoguard intravenous cannula | Safe IV system (insertion) | button for actively retracting the needle | active | Yes |
| Asai 2002 passive | Protective Acuvance | Safe IV system (insertion) | automated retraction of needle | passive | Yes |
| Azar‐Cavanagh 2007 | Unnamed intravenous catheter stylet | Safe IV system (insertion) | retractable protection shield | active? | ? |
| Baskin 2014 | BD Eclipse injector 3‐mL, BD preset syringe with BD Luer‐Lok tip 25G×1 | Blood collection | cannula protection shield is activated with one hand after puncture and clicks irreversibly over the cannula | active | Yes |
| Chambers 2015 hospitals | not reported | Multiple safe devices | safety engineered needles and needleless devices | passive or semi‐automatic | ? |
| Chambers 2015 long‐term nursing care | nor reported | Multiple safe devices | safety engineered needles and needleless devices | passive or semi‐automatic | ? |
| Cote 2003 | Angiocath Autoguard IV catheters | Safe IV system (insertion) | button for actively retracting the needle | active | Yes |
| Edmond 1988 | Winfield sharpsguard | Sharps container | bedside sharps container | n.a. | No |
| Gaballah 2010 | Unnamed safety dental syringes | Injection system | does not require re‐sheating or removal of the needle from its syringe | passive? | ? |
| Goldwater 1989 | Needle guard Biosafe New Zealand | Blood collection | shield on cap prevents injury while recapping | n.a. | No |
| Goris 2015 | Unnamed safety engineered passive retractable syringes | Injection system | automatically and instantly retracts the needle from the patient into the barrel of the syringe | passive | ? |
| Grimmond 2010 | Daniels sharpsmart | Sharps container | bedside sharps container | n.a. | Yes |
| L'Ecuyer 1996 2wva | 2‐way valve Safsite Braun medical | Safe IV system (insertion and needleless) | two valve system with plastic sharp that remains in the device | passive | Yes |
| L'Ecuyer 1996 mbc | Lifeshield metal blunt cannula | Safe IV system (needleless iv system) | metal blunt cannula | passive | Yes |
| L'Ecuyer 1996 pbc | Interlink PBC plastic cannula | Safe IV system (insertion and needleless) | plastic sharp covered by blunt plastic cannula | passive | Yes |
| Mendelson 1998 | 1‐valve Safsite Braun medical | Safe IV system (needleless) | valve of IV system incompatible with needle | passive | Yes |
| Phillips 2013 | safety engineered sharps | Multiple safe devices | not explained | ? | ? |
| Prunet 2008 active | Insyte Autoguard intravenous cannula | Safe IV system (insertion) | button for actively retracting the needle | active | Yes |
| Prunet 2008 passive | Introcan Safety IV system (Braun) | Safe IV system (insertion) | automatic shield on needle tip at withdrawing | passive | Yes |
| Reddy 2001 | 'safety syringes and needleless IV' | Multiple safe devices | not explained | ? | ? |
| Richard 2001 | 'sharps containers' | Sharps container | first in treatment rooms later bedside placements | ? | ? |
| Rogues 2004 | SafetyLock BD, resheathable winged steel needle | Blood collection | after pushing (two handed) needle retracts into sheath | active | Yes |
| Seiberlich 2016 | ViaValve safety I.V. catheter | Safe IV system (insertion) | contains a valve that is designed to restrict blood flow back out of the catheter hub upon initial venipuncture | active | Yes |
| Sossai 2010 | Introcan safety IV system (Braun) | Safe IV system (insertion) | automatic shield on needle tip at withdrawing | passive | Yes |
| Valls 2007 | Eclipse BD; Saf‐T‐ E‐Z Set, BD; Surshield, Terumo; Preserts BD; Provent plus, Smiths; Genie BD; Surgilance Terumo; Blunt administration needles BD | Multiple systems | n.a. | active and passive | Yes |
| van der Molen 2011 | Eclipse BD | Injection system | after injection needle covered with shield | active | Yes |
| Whitby 2008 | VanishPoint; VanishPoint blood tube holders; BD Safety‐Lok; SmartSite needle‐free system; Smartsite Plus | Multiple systems | retractable syringes, needle‐free IV systems and safety winged butterfly needles. | passive | Yes |
| Zakrzweska 2001 | Safety Plus Septodont (Dental injections) | Injection system | Protective sheaths can be temporarily or definitely protect the needle | active | Yes |
| Study | Intervention independent of other changes | Sufficient data points | Test for trend | Intervention did not affect data collection | Blinded outcome assessment | Complete data set | Reliable outcome measure | Total score |
| Goldwater 1989 | Not done (0) Comment: staff turnover during study period. Staff preference for the use of the intervention devices varied across study periods. | Done (1) Comment: inlcusion of 3 data points before and after, the study was reanalysed using ARIMA model. | Done (1) Comment: we reanalysed the study for trend. | Done (1) Data collection seems to remained the same pre and post‐intervention. | Not clear (0) Authors do not provide information on blinding. | Done (1) | Not clear (0): Comment: no system for NSI seems to have been in placed during the study period. Uncertain about the consistency of the reporting during the study period. | 4 |
| Rogues 2004 | Done (1) Quote: "Conventional phlebotomy non‐safety devices were removed from all departments, and the new products were in place on implementation" Comment: only one device seems to have been introduced during intervention but authors do not specify if additional changes occurred during the study. | Done (1) Comment: inlcusion of 3 data points before and after, the study was reanalysed using ARIMA model. | Done (1) Comment: we reanalysed the study for trend. | Done (1) Comment: the method of data collection remains the same throughout the study. It does not appears to be influenced by the intervention. | Not clear (0) Comment No information is available on blinding. | Not done (0) Comment: data not available for the estimated number of phlebotomies performed for 1993 and 1994. | Done (1) Comment: hospital has a sharp injury surveillance system prior and after intervention. Althought not ideal as possibility of underreporting but appropriate for the study outcome. | 5 |
| Reddy 2001 | Not done (0) Quote: one of the confounder present throughout the post intervention phase was the availability of traditional needles devices. Comment: intervention occurs simultaneously with the availability of non‐safety device. | Done (1) Comment: inlcusion of 3 data points before and after, the study was reanalysed using ARIMA model. | Done (1) Comment: we reanalysed the study for trend. | Done (1) Comment: the method of data collection remains the same throughout the study. It does not appears to be influenced by the intervention. | Not clear (0) Comment: no information available on blinding | Not done (0) Comment: physicians were excluded from analysis as no information on FTE. | Done (1) Comment: hospital had a sharp injury surveillance system prior and after intervention. Althought no ideal as possibility of underreporting but appropriate for the study outcome. | 4 |
| Azar‐Cavanagh 2007 | Done (1) Comment: safety devices seem to have systematically replaced the conventional devices. Authors do not specify if additional changes occurred during the study. | Done (1) Comment: inlcusion of 3 data points before and after, the study was reanalysed using ARIMA model. | Done (1) Comment: we reanalysed the study for trend. | Done (1) Comment: the method of data collection remains the same throughout the study. It does not appears to be influenced by the intervention. | Not clear (0) Comment: authors do not specify if data analysts were blinded to the study. Healthcare workers could not have been blinded to the introduction of the new devices. | Done (1) Comment: data is available for all health workers. | Done (1) Coment: | 6 |
| Sosai 2010 | Not done (0) Comment: authors indicated that some conventional devices were still used during the intervention period despite study which aimed to replace all conventional devices by new safety devices. | Done (1) comment: inlcusion of 3 data points before and after, the study was reanalysed using ARIMA model. | Done (1) Comment: we reanalysed the study for trend. | Not done (0) Quote: "after launching the sharps awareness campaign in 2003, # of injuries increased possibility because of sharps awareness campaign" Comment: intervention seems to have affected reporting of NSI. | Not clear (0) Comment: information on blinding is not reported. | Done (1) Comment: all hospital employees were included in the study. | Done (1) Comment: used the incident reporting system throughout the study which appears to be adequate measure for NSI. | 4 |
| Edmond 1988 | Not clear (0) Comment: no information if additional changes were introduced during the same period at the hospital. | Done (1) Comment: inlcusion of 3 data points before and after, the study was reanalysed using ARIMA model. | Done (1) Comment: we reanalysed the study for trend. | Done (1) Comment: intervention does not appears to have affected method of data collection. | Not clear (0) Quote: "the subjects were unaware of the nature of the study". Comment: the reporting of the NSI was not likely to be affected by the staff knowing of the study. However, health workers would be aware of the change in the type of devices used. | Not clear (0) Comment: information about the number of nurses for pre‐intervention but not for post‐intervention. For NSI, the number of staff per year is not available. | Done (1) Comment: authors used employee health records for pre and post intervention. For NSI, this system appears reliable for the outcome of interest. | 4 |
| Richard 2001 | Not clear (0) Comment: no information if additional changes were introduced during the same period at the hospital. | Done (1) Comment: inlcusion of 3 data points before and after, the study was reanalysed using ARIMA model. | Done (1) Comment: we reanalysed the study for trend. | Not done (0) Quote: the increase in total injuries reported in 1998 followed a better reporting stimulated by the second educational program. Comment: the reporting system started in 1993, it is possible that as more people became aware of the surveillance system, there was an increase in reporting. | Not clear (0) Comment: No information is available on blinding | Not clear (0) Comment: no information on the actual number of healthcare workers included during pre and post intervention. | Not clear (0) Comment: it is unclear if the reporting system was used consistently throughout the years especially as it was launched during the early phase of the study. | 2 |
| Chambers 2015 hospitals | Done (1) Comment: safety devices seem to have replaced the conventional devices due to legislation. | Done (1) Comment: inlcusion of 3 data points before and after, the study was reanalysed using ARIMA model. | Done (1) Comment: we reanalysed the study for trend. | Not clear (0) Comment: Increased attention to needle stick injury prevention during the period of regulatory change may have resulted in increased reporting. | Done (1) Comment: data was obtained from an administrative source. | Not done (0) Comment: the data set represented 63 percent of all needlestick injury claims. | Done (1) Comment: authors used work place safety and insurance board data for compensation claims. For NSI, this system appears reliable for the outcome of interest. | 5 |
| Chambers 2015 long‐term nursing care | Done (1) Comment: safety devices seem to have replaced the conventional devices due to legislation. | Done (1) Comment: inlcusion of 3 data points before and after, the study was reanalysed using ARIMA model. | Done (1) Comment: we reanalysed the study for trend. | Not clear (0) Comment: Increased attention to needle stick injury prevention during the period of regulatory change may have resulted in increased reporting. | Done (1) Comment: data was obtained from an administrative source. | Not done (0) Comment: the data set represented 63 percent of all needlestick injury claims. | Done (1) Comment: authors used work place safety and insurance board data for compensation claims. For NSI, this system appears reliable for the outcome of interest. | 5 |
| Goris 2015 | Done (1) Quote: "The existing inventories of subcutaneous active safety‐engineered devices were removed and replaced with subcutaneous passive safety‐engineered devices" Comment: All conventional devices were replaced by safety‐engineered devices at the start of the intervention. | Done (1) Comment: inlcusion of 3 data points before and after, the study was reanalysed using ARIMA model. | Done (1) Comment: we reanalysed the study for trend. | Not clear (0) Comment: the reporting might have increased after inrodcution of the passive safety‐engineered device due to heightened awareness. | Done (1) Comment: data was obtained from an administrative source. | Done (1) Comment: data for all the healthcare workers was provided in the form of employee productive hours in the pre and post intervention phase. | Done(1) Comment: authors used BJC occupational health database records for pre and post intervention. This being administrative data appears to be reliable for the outcome of interest. | 6 |
| Phillips 2013 | Done (1) Comment: safety devices seem to have replaced the conventional devices due to legislation. | Done (1) Comment: inlcusion of 3 data points before and after, the study was reanalysed using ARIMA model. | Done (1) Comment: we reanalysed the study for trend. | Not clear (0) | Done (1) Comment: data was obtained from an administrative source. | Not done (0) Comment: Data set represented only 73% of the total sample. | Done (1) Comment: Data was obtained from the US Exposure Prevention Information Network (EPINet) sharps injury surveillance database. This appears to be adequate measure for NSIs. | 5 |
| Whitby 2008 | Not clear (0) | Done (1) Comment: inlcusion of 3 data points before and after, the study was reanalysed using ARIMA model. | Done (1) Comment: we reanalysed the study for trend. | Done (1) Comment: the constant and unchanging rate of NSI with solid suture needles implies that reduction of NSI relates neither to the education program associated or increased reporting rates. | Not done (0) Comment: health workers were aware of the change in the type of devices used. | Done (1) Comment: data is available for all health workers. | Done (1) Comment: used the same system of reporting of NSI in pre and post intervention period to the infectious diseases department which has been in place since 1996. | 5 |
| Comparison and outcome | Starting level | Risk of bias | Consistency | Directness | Precision | Publication bias | Quality of evidence |
| Safe versus traditional blood collection systems RCT ‐ all outcomes | high | 1 RCT high RoB | consistent | direct | wide CI | impossible to determine | very low |
| Safe versus traditional blood collection systems ITS | low | 2 ITS high RoB | consistent | direct | wide CI | impossible to determine | very low |
| Safe versus traditional IV systems RCT ‐ all outcomes | high | 5 RCT high RoB, 1 RCT low RoB | consistent | direct | wide CI | impossible to determine | very low |
| Safe versus traditional IV systems CBA | low | 1 CBA high RoB | consistent | direct | wide CI | impossible to determine | very low |
| Safe versus traditional IV systems ITS | low | 1 ITS low RoB, 1 ITS high RoB | consistent | direct | wide CI | impossible to determine | very low |
| Safe versus traditional injection systems RCT | high | 1 RCT high RoB | consistent | indirect; hospital | wide CI | impossible to determine | very low |
| Safe versus traditional injection systems CBA | low | 1 CBA high RoB | consistent | indirect; dentists | wdie CI | impossible to determine | very low |
| Safe pasive injection systems versus safe active injection systems ITS | low | 1 ITS low RoB | consistent | direct | wide CI | impossible to determine | very low |
| Multiple safe versus traditional devices ITS | low | 2 ITS high RoB | inconsistent | direct | wide CI | impossible to determine | very low |
| Multiple safe versus traditional devices CBA | low | 1 CBA high RoB | consistent | direct | wide CI | impossible to determine | very low |
| Sharps containers versus no containers ITS | low | 1 ITS low RoB, 1 ITS high RoB | inconsistent | direct | wide CI | impossible to determine | very low |
| Sharps containers versus no containers CBA ‐ all outcomes | low | 1 CBA high RoB | consistent | direct | wide CI | impossible to determine | very low |
| Legislation versus no legislation ITS | low | 2 ITS high RoB | consistent | direct | wide CI | impossible to determine | low |
| Outcome or subgroup title | No. of studies | No. of participants | Statistical method | Effect size |
| 1 Needlestick injuries immediate follow up Show forest plot | 1 | Risk Ratio (M‐H, Random, 95% CI) | Totals not selected | |
| 2 Blood splashes Show forest plot | 1 | Risk Ratio (M‐H, Random, 95% CI) | Totals not selected | |
| Outcome or subgroup title | No. of studies | No. of participants | Statistical method | Effect size |
| 1 Number of reported sharps injuries, level Show forest plot | 2 | Effect Size (Random, 95% CI) | ‐3.84 [‐9.56, 1.88] | |
| 1.1 Cap shield | 1 | Effect Size (Random, 95% CI) | ‐1.04 [‐2.27, 0.19] | |
| 1.2 Needle sheath | 1 | Effect Size (Random, 95% CI) | ‐6.88 [‐9.53, ‐4.23] | |
| 2 Number of reported sharps injuries, slope Show forest plot | 2 | Effect Size (Fixed, 95% CI) | Totals not selected | |
| 2.1 Cap shield | 1 | Effect Size (Fixed, 95% CI) | 0.0 [0.0, 0.0] | |
| 2.2 Needle sheath | 1 | Effect Size (Fixed, 95% CI) | 0.0 [0.0, 0.0] | |
| Outcome or subgroup title | No. of studies | No. of participants | Statistical method | Effect size |
| 1 Needlestick injuries Show forest plot | 3 | Rate Ratio (Fixed, 95% CI) | 0.62 [0.27, 1.41] | |
| 2 Incidences of blood contamination Show forest plot | 6 | 1489 | Risk Ratio (M‐H, Fixed, 95% CI) | 1.38 [1.00, 1.92] |
| 2.1 Active systems | 4 | 961 | Risk Ratio (M‐H, Fixed, 95% CI) | 1.60 [1.08, 2.36] |
| 2.2 Passive systems | 2 | 528 | Risk Ratio (M‐H, Fixed, 95% CI) | 0.94 [0.50, 1.75] |
| 3 Incidence of blood leakage Show forest plot | 1 | Risk Ratio (M‐H, Fixed, 95% CI) | Totals not selected | |
| 3.1 Active systems | 1 | Risk Ratio (M‐H, Fixed, 95% CI) | 0.0 [0.0, 0.0] | |
| Outcome or subgroup title | No. of studies | No. of participants | Statistical method | Effect size |
| 1 Number of needlestick injuries Show forest plot | 1 | Rate Ratio (Fixed, 95% CI) | Totals not selected | |
| Outcome or subgroup title | No. of studies | No. of participants | Statistical method | Effect size |
| 1 Number of reported sharps injuries, level Show forest plot | 2 | Effect Size (Random, 95% CI) | Totals not selected | |
| 2 Number of reported sharps injuries, slope Show forest plot | 2 | Effect Size (Random, 95% CI) | Totals not selected | |
| Outcome or subgroup title | No. of studies | No. of participants | Statistical method | Effect size |
| 1 Questionnaire reported Needlestick injuries 6 mo follow up Show forest plot | 1 | Risk Ratio (M‐H, Fixed, 95% CI) | Totals not selected | |
| 2 Hospital reported Needlestick injuries 6 mo follow up Show forest plot | 1 | Odds Ratio (M‐H, Fixed, 95% CI) | Totals not selected | |
| 3 Questionnaire reported Needlestick injuries 12 mo follow up Show forest plot | 1 | Odds Ratio (M‐H, Fixed, 95% CI) | Totals not selected | |
| 4 Hospital reported Needlestick injuries 12 mo follow up Show forest plot | 1 | Odds Ratio (M‐H, Fixed, 95% CI) | Totals not selected | |
| Outcome or subgroup title | No. of studies | No. of participants | Statistical method | Effect size |
| 1 Needlestick injury rate Show forest plot | 1 | Rate Ratio (Fixed, 95% CI) | Totals not selected | |
| Outcome or subgroup title | No. of studies | No. of participants | Statistical method | Effect size |
| 1 change in level of needlestick injuries Show forest plot | 1 | Effect size (Random, 95% CI) | Totals not selected | |
| 2 Change in slope of needlestick injuries Show forest plot | 1 | Effect Size (Random, 95% CI) | Totals not selected | |
| Outcome or subgroup title | No. of studies | No. of participants | Statistical method | Effect size |
| 1 Number of reported sharps injuries, level Show forest plot | 2 | Effect Size (Random, 95% CI) | Totals not selected | |
| 2 Number of reported sharps injuries, slope Show forest plot | 2 | Effect Size (Random, 95% CI) | 0.25 [‐0.30, 0.81] | |
| Outcome or subgroup title | No. of studies | No. of participants | Statistical method | Effect size |
| 1 Needlestick injuries Show forest plot | 1 | Rate Ratio (Fixed, 95% CI) | Totals not selected | |
| Outcome or subgroup title | No. of studies | No. of participants | Statistical method | Effect size |
| 1 Number of reported sharps injuries, level Show forest plot | 2 | Effect Size (Random, 95% CI) | 2.49 [0.49, 4.48] | |
| 2 Number of reported sharps injuries, slope Show forest plot | 2 | Effect Size (Random, 95% CI) | Totals not selected | |
| Outcome or subgroup title | No. of studies | No. of participants | Statistical method | Effect size |
| 1 Number of needlestick injuries Show forest plot | 1 | Rate Ratio (Fixed, 95% CI) | Totals not selected | |
| 2 Number of container related needlestick injuries Show forest plot | 1 | Rate Ratio (Fixed, 95% CI) | Totals not selected | |
| Outcome or subgroup title | No. of studies | No. of participants | Statistical method | Effect size |
| 1 NSI‐ change in level Show forest plot | 3 | Effect Size (Random, 95% CI) | Subtotals only | |
| 1.1 Interruption | 2 | Effect Size (Random, 95% CI) | ‐6.15 [‐7.76, ‐4.54] | |
| 1.2 Gradual introduction | 1 | Effect Size (Random, 95% CI) | 0.80 [0.41, 1.19] | |
| 2 NSI‐ Change in slope Show forest plot | 3 | Effect Size (Random, 95% CI) | Subtotals only | |
| 2.1 Interruption | 2 | Effect Size (Random, 95% CI) | ‐0.94 [‐1.97, 0.09] | |
| 2.2 Gradual introduction | 1 | Effect Size (Random, 95% CI) | 0.5 [0.36, 0.64] | |