Peranti untuk mencegah kecederaan pendedahan perkutaneus yang disebabkan oleh jarum dalam kalangan kakitangan penjagaan kesihatan
Abstract
Background
Percutaneous exposure injuries from devices used for blood collection or for injections expose healthcare workers to the risk of blood borne infections such as hepatitis B and C, and human immunodeficiency virus (HIV). Safety features such as shields or retractable needles can possibly contribute to the prevention of these injuries and it is important to evaluate their effectiveness.
Objectives
To determine the benefits and harms of safety medical devices aiming to prevent percutaneous exposure injuries caused by needles in healthcare personnel versus no intervention or alternative interventions.
Search methods
We searched CENTRAL, MEDLINE, EMBASE, NHSEED, Science Citation Index Expanded, CINAHL, Nioshtic, CISdoc and PsycINFO (until 11 November 2016).
Selection criteria
We included randomised controlled trials (RCT), controlled before and after studies (CBA) and interrupted time‐series (ITS) designs of the effect of safety engineered medical devices on percutaneous exposure injuries in healthcare staff.
Data collection and analysis
Two of the authors independently assessed study eligibility and risk of bias and extracted data. We synthesized study results with a fixed‐effect or random‐effects model meta‐analysis where appropriate.
Main results
We included six RCTs with 1838 participants, two cluster‐RCTs with 795 participants and 73,454 patient days, five CBAs with approximately 22,000 participants and eleven ITS with an average of 13.8 data points. These studies evaluated safe modifications of blood collection systems, intravenous (IV) systems, injection systems, multiple devices, sharps containers and legislation on the implementation of safe devices. We estimated the needlestick injury (NSI) rate in the control groups to be about one to five NSIs per 1000 person‐years. There were only two studies from low‐ or middle‐income countries. The risk of bias was high in 20 of 24 studies.
Safe blood collection systems:
We found one RCT that found a safety engineered blood gas syringe having no considerable effect on NSIs (Relative Risk (RR) 0.2, 95% Confidence Interval (95% CI) 0.01 to 4.14, 550 patients, very low quality evidence). In one ITS study, safe blood collection systems decreased NSIs immediately after the introduction (effect size (ES) ‐6.9, 95% CI ‐9.5 to ‐4.2) but there was no further decrease over time (ES ‐1.2, 95% CI ‐2.5 to 0.1, very low quality evidence). Another ITS study evaluated an outdated recapping shield, which we did not consider further.
Safe Intravenous systems
There was very low quality evidence in two ITS studies that NSIs were reduced with the introduction of safe IV devices, whereas one RCT and one CBA study provided very low quality evidence of no effect. However, there was moderate quality evidence produced by four other RCT studies that these devices increased the number of blood splashes when the safety system had to be engaged actively (relative risk (RR) 1.6, 95% CI 1.08 to 2.36). In contrast there was low quality evidence produced by two RCTs of passive systems that showed no effect on blood splashes. Yet another RCT produced low quality evidence that a different safe active IV system also decreased the incidence of blood leakages.
Safe injection devices
There was very low quality evidence provided by one RCT and one CBA study showing that introduction of safe injection devices did not considerably change the NSI rate. One ITS study produced low quality evidence showing that the introduction of safe passive injection systems had no effect on NSI rate when compared to safe active injection systems.
Multiple safe devices
There was very low quality evidence from one CBA study and two ITS studies. According to the CBA study, the introduction of multiple safe devices resulted in a decrease in NSI,whereas the two ITS studies found no change.
Safety containers
One CBA study produced very low quality evidence showing that the introduction of safety containers decreased NSI. However, two ITS studies evaluating the same intervention found inconsistent results.
Legislation
There was low to moderate quality evidence in two ITS studies that introduction of legislation on the use of safety‐engineered devices reduced the rate of NSIs among healthcare workers. There was also low quality evidence which showed a decrease in the trend over time for NSI rates.
Twenty out of 24 studies had a high risk of bias and the lack of evidence of a beneficial effect could be due to both confounding and bias. This does not mean that these devices are not effective.
Authors' conclusions
For safe blood collection systems, we found very low quality evidence of inconsistent effects on NSIs. For safe passive intravenous systems, we found very low quality evidence of a decrease in NSI and a reduction in the incidence of blood leakage events but moderate quality evidence that active systems may increase exposure to blood. For safe injection needles, the introduction of multiple safety devices or the introduction of sharps containers the evidence was inconsistent or there was no clear evidence of a benefit. There was low to moderate quality evidence that introduction of legislation probably reduces NSI rates.
More high‐quality cluster‐randomised controlled studies that include cost‐effectiveness measures are needed, especially in countries where both NSIs and blood‐borne infections are highly prevalent.
Ringkasan bahasa mudah
Peranti dengan ciri keselamatan untuk mencegah kecederaan pendedahan perkutaneus dalam kalangan kakitangan penjagaan kesihatan
Apakah matlamat ulasan ini?
Pekerja penjagaan kesihatan menggunakan jarum, picagari dan peranti lain untuk mengumpul darah pesakit dan menyuntik ubat dalam bentuk cecair. Kadangkala pekerja penjagaan kesihatan bersentuhan dengan hujung tajam peranti‐peranti ini secara tidak sengaja. Hal sedemikian disebut kecederaan "needlestick" (NSI) dan ia boleh mendedahkan pekerja penjagaan kesihatan kepada risiko jangkitan yang serius seperti hepatitis atau virus imunodifisiensi manusia (HIV). Ciri‐ciri keselamatan seperti perisai atau jarum boleh retrak boleh membantu mencegah kecederaan tersebut. Kami mencari pelbagai pangkalan data untuk kajian rawak terkawal (RCTs) dan kajian tanpa rawak (NRS) yang menilai ciri‐ciri ini.
Mesej utama
Bukti peranti keselamatan yang mencegah NSI adalah berkualiti rendah dan tidak konsisten. Kekurangan kesan membantu yang kukuh dan konsisten mungkin disebabkan oleh bias. Ini tidak bermakna peranti‐peranti tersebut tidak berkesan. Risiko pencemaran darah mungkin lebih besar.
Lebih banyak kajian eksperimen yang berkualiti tinggi dengan kumpulan‐kumpulan pekerja kesihatan diperlukan untuk membandingkan kesan‐kesan dan keberkesanan kos pelbagai jenis peranti keselamatan NSI, terutama di negara‐negara di mana kedua‐dua NSI dan jangkitan bawaan darah adalah lazim.
Apa yang dikaji dalam ulasan ini?
Kami memasukkan lapan RCT dan 16 NRS. Kajian‐kajian ini menilai keselamatan sistem pengumpulan darah, sistem intravena (IV), sistem suntikan, pelbagai peranti, bekas‐bekas tajam dan perundangan. Kami menganggarkan satu hingga lima NSI berlaku dalam setiap 1000 pekerja setiap tahun tanpa intervensi. Risiko bias adalah tinggi dalam 20 daripada 24 kajian.
Apakah keputusan utama ulasan?
Untuk sistem pengumpulan darah yang selamat, satu RCT mendapati bukti berkualiti sangat rendah menunjukkan tiada kesan yang ketara dan satu NRS menghasilkan bukti berkualiti sangat rendah yang menunjukkan penurunan besar dalam NSI. Satu lagi NRS menggunakan perisai topi yang sudah ketinggalan zaman.
Untuk peranti IV yang selamat, terdapat kualiti bukti yang sangat rendah bahawa NSI menurun dalam dua NRS tetapi tidak dalam satu RCT dan satu NRS lain. Walau bagaimanapun, empat kajian RCT lain menghasilkan bukti berkualiti sederhana bahawa peranti yang perlu dipasang meningkatkan jumlah percikan darah. Dalam dua kajian RCT di mana ciri keselamatan dipasang secara automatik menghasilkan bukti berkualiti rendah yang tidak menunjukkan perubahan dalam jumlah percikan darah. Satu lagi kajian RCT mendapati bukti berkualiti rendah menunjukkan penurunan jumlah kebocoran darah dengan peranti ini.
Untuk peranti suntikan yang selamat, terdapat bukti berkualiti sangat rendah bahawa ini mengurangkan kadar NSI dalam satu RCT dan dalam satu NRS. Walau bagaimanapun, NRS lain mendapati bukti berkualiti rendah bahawa tiada perbezaan dalam kadar NSI di antara peranti suntikan selamat yang aktif dan pasif.
Untuk pengenalan beberapa peranti keselamatan sekaligus, terdapat bukti berkualiti sangat rendah terhadap kesan yang tidak konsisten dari tiga NRS. . Satu NRS menunjukkan penurunan dalam kadar NSI tetapi dua kajian lain tidak menunjukkan perbezaan.
Untuk penggunaan bekas keselamatan, terdapat bukti berkualiti sangat rendah terhadap kesan yang tidak konsisten dari tiga NRS. . Satu NRS menunjukkan penurunan dalam NSI tetapi dua kajian yang lain menunjukkan keputusan yang tidak konsisten.
Untuk memperkenalkan perundangan mengenai peranti keselamatan tereka bentuk, terdapat kualiti bukti rendah hingga sederhana yang dihasilkan oleh dua kajian NRS yang menunjukkan pengurangan NSI.
Adakah ulasan ini terkini?
Kami mencari kajian sehingga 11 November 2016.
Authors' conclusions
Summary of findings
| Safe blood collection systems compared to regular systems for preventing percutaneous exposure injuries caused by needles in healthcare personnel (RCTs) | ||||||
| Patient or population: preventing percutaneous exposure injuries caused by needles in healthcare personnel (RCTs) | ||||||
| Outcomes | Anticipated absolute effects* (95% CI) | Relative effect | № of participants | Quality of the evidence | Comments | |
| Risk with regular systems | Risk with Safe blood collection systems | |||||
| Needlestick injuries immediate follow up | Study population | RR 0.20 | 550 | ⊕⊝⊝⊝ | ||
| 7 per 1 000 | 1 per 1 000 | |||||
| Blood splashes | Study population | RR 0.14 | 550 | ⊕⊝⊝⊝ | ||
| 25 per 1 000 | 4 per 1 000 | |||||
| *The risk in the intervention group (and its 95% confidence interval) is based on the assumed risk in the comparison group and the relative effect of the intervention (and its 95% CI). | ||||||
| GRADE Working Group grades of evidence | ||||||
| 1 We downgraded the quality of evidence by one level due to risk of bias (selection bias, performance bias and detection bias). | ||||||
| Safe blood collection systems compared to regular systems for preventing percutaneous exposure injuries caused by needles in healthcare personnel (ITS) | |||
| Patient or population: preventing percutaneous exposure injuries caused by needles in healthcare personnel (ITS) | |||
| Outcomes | Impact | № of participants | Quality of the evidence |
| Number of reported sharps injuries, level ‐ reported seperately for needle sheath and cap shield studies | Needle sheath study: effect size ‐6.88; confidence interval ‐9.53 to ‐4.23. Cap shield study: effect size ‐1.04; confidence interval ‐2.27 to 0.19. | (2 observational studies) | ⊕⊝⊝⊝ |
| Number of reported sharps injuries, slope ‐ reported seperately for needle sheath and cap shield studies | Needle sheath study: effect size ‐1.19; confidence interval ‐2.50 to 0.12. Cap shield study: effect size ‐1.00; confidence interval ‐2.22 to ‐0.22. | (2 observational studies) | ⊕⊝⊝⊝ |
| Interpretation of effect size: small (0‐0.2) medium (0.2‐0.5) large (0.6 and above), an effect size with negative sign implies decrease and positive sign implies increase of effect. | |||
| GRADE Working Group grades of evidence | |||
| 1 We downgraded the quality of evidence by two levels due to heterogeneity (I² = 93%). | |||
| Safe intravenous systems compared to regular systems RCT for preventing percutaneous exposure injuries caused by needles in healthcare personnel | ||||||
| Patient or population: preventing percutaneous exposure injuries caused by needles in healthcare personnel | ||||||
| Outcomes | Anticipated absolute effects* (95% CI) | Relative effect | № of participants | Quality of the evidence | Comments | |
| Risk with regular systems RCT | Risk with Safe intravenous systems | |||||
| Needlestick injuries | Study population | Rate ratio 0.62 | (1 RCT, three arms) | ⊕⊝⊝⊝ | Calculated based on 1000 patient days | |
| 0.71 per 1 000 | 0.44 per 1 000 | |||||
| Incidences of blood contamination ‐ Active systems | Study population | RR 1.60 | 961 | ⊕⊕⊝⊝ | ||
| 92 per 1 000 | 148 per 1 000 | |||||
| Incidences of blood contamination ‐ Passive systems | Study population | RR 0.94 | 528 | ⊕⊕⊝⊝ | ||
| 79 per 1 000 | 74 per 1 000 | |||||
| Incidence of blood leakage ‐ Active systems | Study population | RR 0.21 | 147 | ⊕⊕⊝⊝ | ||
| 684 per 1 000 | 144 per 1 000 | |||||
| *The risk in the intervention group (and its 95% confidence interval) is based on the assumed risk in the comparison group and the relative effect of the intervention (and its 95% CI). | ||||||
| GRADE Working Group grades of evidence | ||||||
| 1 We downgraded the quality of evidence by two levels due to risk of bias (serious attrition). | ||||||
| Safe intravenous systems compared to regular systems CBA for preventing percutaneous exposure injuries caused by needles in healthcare personnel | ||||||
| Patient or population: preventing percutaneous exposure injuries caused by needles in healthcare personnel | ||||||
| Outcomes | Anticipated absolute effects* (95% CI) | Relative effect | № of participants | Quality of the evidence | Comments | |
| Risk with regular systems CBA | Risk with Safe intravenous systems | |||||
| Number of needlestick injuries | Study population | Rate ratio 0.06 | (1 observational study) | ⊕⊝⊝⊝ | ||
| 36.36 per 1 000 | 2.18 per 1 000 | |||||
| *The risk in the intervention group (and its 95% confidence interval) is based on the assumed risk in the comparison group and the relative effect of the intervention (and its 95% CI). | ||||||
| GRADE Working Group grades of evidence | ||||||
| 1 We downgraded the quality of evidence by two levels due to risk of bias (no random sequence generation or allocation concealment). | ||||||
| Safe intravenous systems compared to regular systems ITS for preventing percutaneous exposure injuries caused by needles in healthcare personnel | |||
| Patient or population: preventing percutaneous exposure injuries caused by needles in healthcare personnel | |||
| Outcomes | Impact | № of participants | Quality of the evidence |
| Number of reported sharps injuries, level | Study 1: effect size ‐5.20; confidence interval ‐7.98 to ‐2.42. Study 2: effect size ‐1.78; confidence interval ‐3.09 to ‐0.47. | (2 observational studies) | ⊕⊝⊝⊝ |
| Number of reported sharps injuries, slope | Study 1: Effect size ‐7.86; confidence interval ‐9.13 to ‐6.59. Study 2: Effect size 0.35; confidence interval ‐0.20 to 0.90. | (2 observational studies) | ⊕⊝⊝⊝ |
| Interpretation of effect size: small (0‐0.2) medium (0.2‐0.5) large (0.6 and above), a effect size with negative sign implies decrease and positive sign implies increase of effect. | |||
| GRADE Working Group grades of evidence | |||
| 1 We downgraded the quality of evidence by one level due to risk of bias caused by lacking intervention fidelity (in the second study conventional devices were used during intervention period). | |||
| Safe injection systems compared to regular systems RCT for preventing percutaneous exposure injuries caused by needles in healthcare personnel | ||||||
| Patient or population: preventing percutaneous exposure injuries caused by needles in healthcare personnel | ||||||
| Outcomes | Anticipated absolute effects* (95% CI) | Relative effect | № of participants | Quality of the evidence | Comments | |
| Risk with regular systems RCT | Risk with Safe injection systems | |||||
| Questionnaire reported Needlestick injuries 6 mo follow up | Study population | RR 0.42 | 154 | ⊕⊝⊝⊝ | ||
| 140 per 1 000 | 59 per 1 000 | |||||
| Questionnaire reported Needlestick injuries 12 mo follow up | Study population | OR 0.20 | 144 | ⊕⊝⊝⊝ | ||
| 119 per 1 000 | 26 per 1 000 | |||||
| Hospital reported Needlestick injuries 6 mo follow up | Study population | OR 1.20 | 533 | ⊕⊝⊝⊝ | ||
| 38 per 1 000 | 45 per 1 000 | |||||
| Hospital reported Needlestick injuries 12 mo follow up | Study population | OR 0.72 | 533 | ⊕⊝⊝⊝ | ||
| 41 per 1 000 | 30 per 1 000 | |||||
| *The risk in the intervention group (and its 95% confidence interval) is based on the assumed risk in the comparison group and the relative effect of the intervention (and its 95% CI). | ||||||
| GRADE Working Group grades of evidence | ||||||
| 1 We downgraded the quality of evidence by two levels due to risk of bias (high attrition). | ||||||
| Safe injection systems compared to regular systems CBA for preventing percutaneous exposure injuries caused by needles in healthcare personnel | ||||||
| Patient or population: preventing percutaneous exposure injuries caused by needles in healthcare personnel | ||||||
| Outcomes | Anticipated absolute effects* (95% CI) | Relative effect | № of participants | Quality of the evidence | Comments | |
| Risk with regular systems CBA | Risk with Safe injection systems | |||||
| Needlestick injury rate | Study population | Rate ratio 0.34 | (1 observational study) | ⊕⊝⊝⊝ | Calculated based on 1000 person years | |
| 236 per 1 000 | 80.24 per 1 000 | |||||
| *The risk in the intervention group (and its 95% confidence interval) is based on the assumed risk in the comparison group and the relative effect of the intervention (and its 95% CI). | ||||||
| GRADE Working Group grades of evidence | ||||||
| 1 We downgraded the quality of evidence by two levels due to risk of bias (no random sequence generation or allocation concealment). | ||||||
| Safe passive injection systems compared to safe active injection systems ITS for preventing percutaneous exposure injuries caused by needles in healthcare personnel | |||
| Patient or population: preventing percutaneous exposure injuries caused by needles in healthcare personnel | |||
| Outcomes | Impact | № of participants | Quality of the evidence |
| Change in level of needlestick injuries | Effect size 0.23; confidence interval ‐1.89 to 2.35. | (1 observational study) | ⊕⊝⊝⊝ |
| Change in slope of needlestick injuries | Effect size ‐0.74; confidence interval ‐1.66 to 0.18. | (1 observational study) | ⊕⊕⊝⊝ |
| Interpretation of effect size: small (0‐0.2) medium (0.2‐0.5) large (0.6 and above), a effect size with negative sign implies decrease and positive sign implies increase of effect. | |||
| GRADE Working Group grades of evidence | |||
| 1 We downgraded the quality of evidence by one level due to imprecision (wide confidence interval). | |||
| Multiple safe devices compared to regular devices ITS for preventing percutaneous exposure injuries caused by needles in healthcare personnel | |||
| Patient or population: preventing percutaneous exposure injuries caused by needles in healthcare personnel | |||
| Outcomes | Impact | № of participants | Quality of the evidence |
| Number of reported sharps injuries, level | Study 1: effect size ‐1.04; confidence interval ‐2.20 to 0.12. Study 2: effect size 0.43; confidence interval ‐0.30 to 1.16. | (2 observational studies) | ⊕⊝⊝⊝ |
| Number of reported sharps injuries, slope | Study 1: effect size ‐0.01; confidence interval ‐0.15 to 0.13. Study 2: effect size 0.56; confidence interval 0.23 to 0.89. | (2 observational studies) | ⊕⊝⊝⊝ |
| Interpretation of effect size: small (0‐0.2) medium (0.2‐0.5) large (0.6 and above), a effect size with negative sign implies decrease and positive sign implies increase of effect. | |||
| GRADE Working Group grades of evidence | |||
| 1 We downgraded the quality of evidence by one level due to risk of bias (One study had a low risk of bias but the other study had a high risk as conventional devices were still available after the intervention began). | |||
| Multiple safe devices compared to regular devices CBA for preventing percutaneous exposure injuries caused by needles in healthcare personnel | ||||||
| Patient or population: preventing percutaneous exposure injuries caused by needles in healthcare personnel | ||||||
| Outcomes | Anticipated absolute effects* (95% CI) | Relative effect | № of participants | Quality of the evidence | Comments | |
| Risk with regular devices CBA | Risk with Multiple safe devices | |||||
| Needle stick injuries | Study population | Rate ratio 0.11 | (1 observational study) | ⊕⊝⊝⊝ | Calculated based on 1000 patient days | |
| 0.44 per 1 000 | 0.052 per 1 000 | |||||
| *The risk in the intervention group (and its 95% confidence interval) is based on the assumed risk in the comparison group and the relative effect of the intervention (and its 95% CI). | ||||||
| GRADE Working Group grades of evidence | ||||||
| 1 We downgraded the quality of evidence by two levels due to risk of bias (no random sequence generation or allocation concealment). | ||||||
| Sharps containers compared to no containers ITS for preventing percutaneous exposure injuries caused by needles in healthcare personnel | |||
| Patient or population: preventing percutaneous exposure injuries caused by needles in healthcare personnel | |||
| Outcomes | Impact | № of participants | Quality of the evidence |
| Number of reported sharps injuries, level | Study 1: effect size 3.29; confidence interval 0.68 to 5.90. Study 2: effect size 1.35; confidence interval ‐1.75 to 4.45. | (2 observational studies) | ⊕⊝⊝⊝ |
| Number of reported sharps injuries, slope | Study 1: effect size 0.02; confidence interval ‐1.06 to 1.10. Study 2: effect size 2.55; confidence interval 1.20 to 3.90. | (2 observational studies) | ⊕⊝⊝⊝ |
| Interpretation of effect size: small (0‐0.2) medium (0.2‐0.5) large (0.6 and above), a effect size with negative sign implies decrease and positive sign implies increase of effect. | |||
| GRADE Working Group grades of evidence | |||
| 1 We downgraded the quality of evidence by one level due to inconsistency (study 2 showed an increase in reporting). | |||
| Sharps containers compared to no containers CBA for preventing percutaneous exposure injuries caused by needles in healthcare personnel | ||||||
| Patient or population: preventing percutaneous exposure injuries caused by needles in healthcare personnel | ||||||
| Outcomes | Anticipated absolute effects* (95% CI) | Relative effect | № of participants | Quality of the evidence | Comments | |
| Risk with no containers CBA | Risk with Sharps containers | |||||
| Number of needlestick injuries | Study population | Rate ratio 0.88 | (1 observational study) | ⊕⊝⊝⊝ | ||
| 28.3 per 1 000 | 24.9 per 1 000 | |||||
| Number of container related needlestick injuries | Study population | Rate ratio 0.22 | (1 observational study) | ⊕⊝⊝⊝ | ||
| 2.6 per 1 000 | 0.6 per 1 000 | |||||
| *The risk in the intervention group (and its 95% confidence interval) is based on the assumed risk in the comparison group and the relative effect of the intervention (and its 95% CI). | ||||||
| GRADE Working Group grades of evidence | ||||||
| 1 We downgraded the quality of evidence by two levels due to risk of bias (no random sequence generation or allocation concealment). | ||||||
| Legislation compared to no legislation ITS for preventing percutaneous exposure injuries caused by needles in healthcare personnel | |||
| Patient or population: preventing percutaneous exposure injuries caused by needles in healthcare personnel | |||
| Outcomes | Impact | № of participants | Quality of the evidence |
| NSI‐ change in level ‐ Interruption | Effect size ‐6.15; confidence interval ‐7.76 to ‐4.54. | (2 observational studies) | ⊕⊕⊕⊝ |
| NSI‐ change in level ‐ Gradual introduction | Effect size 0.80; confidence interval 0.41 to 1.19. | (1 observational study) | ⊕⊕⊝⊝ |
| NSI‐ Change in slope ‐ Interruption | Effect size ‐0.94; confidence interval ‐1.97 to 0.09 | (2 observational studies) | ⊕⊝⊝⊝ |
| NSI‐ Change in slope ‐ Gradual introduction | Effect size 0.50; confidence interval 0.36 to 0.64 | (1 observational study) | ⊕⊕⊝⊝ |
| Interpretation of effect size: small (0‐0.2) medium (0.2‐0.5) large (0.6 and above), a effect size with negative sign implies decrease and positive sign implies increase of effect. | |||
| GRADE Working Group grades of evidence | |||
| 1 We downgraded the quality of evidence by one level due to risk of bias (dataset did not represent the whole sample). | |||
Background
Healthcare workers (HCWs) are exposed to several occupational hazards, including biological agents. Percutaneous injury and occupational exposure to blood and body fluids increase the risk of exposure of HCWs to blood borne pathogens such as hepatitis B (HBV), hepatitis C (HCV) and human immunodeficiency virus (HIV). These infections can lead to chronic and fatal diseases. In the United States (US), the annual number of percutaneous injuries among hospital‐based HCWs was estimated to be 384,325 in 1997 to 1998 (Panlilio 2004). Percutaneous injury incidence rates have decreased since then. However, recently it was estimated that still 300,000 HCWs sustain percutaneous injuries annually in the US (Grimmond 2017). The World Health Organization (WHO) estimates that 16,000 HCV, 66,000 HBV and 1000 HIV infections may have occurred worldwide among HCWs in the year 2000 due to their occupational exposure to blood and body fluids (Pruss‐Ustun 2005). More recent information relating to recent global trends of percutaneous exposure injuries is not available. Nonetheless it is reasonable to assume that the trends are not considerably different from the US.
Description of the condition
A HCW's risk for acquiring infectious diseases at work is influenced by a variety of environmental and social factors. The population prevalence of specific diseases, percentage HBV vaccination coverage in the population, availability of medical supplies, adherence to standard precautions, accessibility and availability of post‐exposure prophylaxis, among others are important components influencing the risk of HCWs becoming infected by blood borne diseases. For HBV, the risk varies greatly based on the immunization coverage among health workers and the served population. For example, in 1990 the HBV infection rate among unvaccinated US healthcare personnel was three to five times greater than in the US general population (MacCannell 2010). This number decreased significantly due to the introduction of routine HBV immunization and comprehensive occupational health and safety policies. The prevalence of HBV among HCWs is now five times less than in the US general population (MacCannell 2010).
Occupational transmission of infectious diseases has a significant impact on the health of the workers and also on the healthcare system as a whole. The transmission of occupational blood borne infectious diseases leads to increased absenteeism and morbidity, and in some cases to higher mortality rates, among HCWs. These outcomes affect the delivery, provision, quality and safety of care. HCWs may suffer from psychological stress due to the risk of acquiring an infectious disease, which affects both their work and personal life (Fisman 2002; Sohn 2006). There is also the financial burden associated with occupational exposure to blood borne diseases, which includes costs related to blood tests, treatment, outpatient visits, and lost working hours (Jagger 1990; Leigh 2007).
Description of the intervention
Exposure to blood or body fluids is also called percutaneous exposure and happens most often when HCWs are injured with sharp needles or instruments, or when blood or body fluids are splashed on mucous membranes or wounds during medical interventions or accidents. These incidents are called percutaneous exposure incidents. The majority of these incidents are percutaneous injuries which include sharps injuries or needlestick injuries (NSIs). The actual causes of a NSI are multifactorial and include elements such as types of devices and procedures, lack of access to or availability of personal protective equipment for the HCWs, suboptimal use of personal protective equipment, lack of training and education on infection control and occupational health principles, improper management of needles, poor organisational climate, high workload and fatigue, working alternate shifts, high mental pressure and subjective perception of risk (Akduman 1999; Ansa 2002; Clarke 2002; Doebbeling 2003; Fisman 2007; Ilhan 2006; Ngatu 2011; Oh 2005; Orji 2002; Roberts 1999; Smith 2006; Smith 2006b; Wallis 2007). Most of these causes can be addressed by specific interventions.
Several epidemiological studies have demonstrated that some needlestick injuries are associated with specific actions and medical equipment, such as recapping and sharp devices respectively (De Carli 2003). The practice of recapping needles is a major factor contributing to needlestick injuries (Ngatu 2011) and specific devices have also been associated with an increased risk of percutaneous injuries. According to MacCannell 2010, needlestick injuries occurred more frequently with hollow‐bore needles compared to solid sharps (54% versus 40%). It is estimated that up to 25% of reported hollow‐bore needlestick injuries among nurses and physicians could have been prevented by the use of safer devices (MacCannell 2010). Almost two‐thirds of all reported injuries occurred with devices without safety features (MacCannell 2010).
Engineered medical devices such as retractable needles can reduce and eliminate the exposure to blood and body fluids. Even though sometime ago legislation has been introduced in the US and Europe that mandates that safety‐engineered devices should be used, there is no generally agreed definition of what constitutes a safety‐engineered device (OSHA 2001). Here, we define a safety‐engineered device as any medical device that purportedly protects against percutaneous injuries.
How the intervention might work
There are several possibilities to prevent infection from needlestick injuries. For hepatitis B, vaccination has been successful (Chen 2005). Vaccination is not yet possible for HCV or HIV (Mast 2004). Therefore, exposure elimination and reduction remain the main preventive strategies.
Many hospitals are now using safe medical devices as an intervention to reduce the risk of percutaneous injuries. These devices eliminate or encapsulate the needles. For example, needleless intravenous systems are defined as systems that administer medications through an intravenous access device without using needle connections. Some studies have noted a decrease in the risk of needlestick injuries following the introduction of safety medical devices such as a needle free system for intravenous therapy (Mendelson 1998), meanwhile other studies have found inconclusive findings for such systems (L'Ecuyer 1996 2wva).
Why it is important to do this review
There are several strategies available to abate percutaneous exposure injuries among HCWs workers, and these are widely used. Therefore, it is important to know if these preventive interventions are effective. Retrospective studies indicate that percutaneous exposure incidents would be reduced by more than 50% by behavioural interventions, either through education or adoption of new techniques (Bryce 1999; Castella 2003). The use of safety devices would probably also have a significant effect (Bryce 1999; Castella 2003; Jagger 1988; Waclawski 2004). There have been several reviews on the effectiveness of interventions (Hanrahan 1997; Hutin 2003; Rogers 2000; Trim 2004; Tuma 2006) but none have used the systematic Cochrane methodology. This review excluded studies where sharp suture needles were substituted with blunted ones as another Cochrane review (Parantainen 2011) has already addressed the effect of this intervention. Extra gloves or special types of gloves could theoretically be considered a device to prevent needlestick injuries while handling needles, but we excluded these studies because there is another Cochrane Review that shows that extra gloves are effective to prevent needlestick injuries (Mischke 2014).
Recently the WHO issued guidelines for the use of safety‐engineered devices in healthcare settings (WHO 2016). However, they based their recommendations on a judgment of moderate quality evidence which was different from the low quality evidence that we found in the 2014 version of this review.
Objectives
To determine the benefits and harms of safety medical devices aiming to prevent percutaneous exposure injuries caused by needles in healthcare personnel versus no intervention or alternative interventions.
Methods
Criteria for considering studies for this review
Types of studies
We included all randomised controlled trials (RCT), cluster‐randomised trials (cluster‐RCT), interrupted time‐series (ITS) and controlled before and after studies (CBA) irrespective of language of publication, publication status, or blinding.
We expected that the availability of RCTs would be limited for this topic. Interventions for prevention are very different from clinical interventions. Many of these interventions are not implemented at the individual level. For example, new equipment is used by a group of workers or safety engineering controls are applied to the whole department simultaneously. This approach makes individual randomisation impossible. In principle, this can be partly overcome by randomisation at the department level as in a cluster‐RCT design. However, as the level of aggregation increases, the more difficult this is to perform due to the level of recruitment required. Therefore, we included the following non‐randomised study designs in our review: CBA studies with a concurrent control group, and ITS. CBA studies are also called prospective cohort studies. They are easier to perform, taking into account that the intervention is assigned at the group level, and still have reasonable validity.
ITS designs are often based on routinely collected administrative data from insurance or governmental sources, collected for injury outcomes. In many cases the data are collected independently from interventions and over long periods of time, offering reasonable validity. If there are at least three data points before and three data points after the intervention, we included these study designs as ITS (EPOC 2006). Both ITS with and without a control group were eligible for inclusion.
Types of participants
We included studies where participants were HCWs, including dentists, which means all persons that are professionally involved in providing health care to patients. The majority of study participants had to fulfil this criterion.
Types of interventions
Inclusion criteria
We included studies examining any medical devices that aim to prevent percutaneous exposure incidents and thus could reduce the risk of exposure to blood or bodily fluids.
We categorised the interventions based on the type of device in the following way.
‐ Safety engineered devices for blood collection.
‐ Safety engineered devices for Injecting fluids.
‐ Containers for collecting sharps.
Because these categories did not cover all studies that we found, we added two categories.
‐ The use of multiple safety devices in an intervention programme.
‐ Intravenous systems.
‐ The introduction of legislation
Exclusion criteria
We excluded studies where sharp suture needles were substituted with blunted ones. Another Cochrane review (Parantainen 2011) has addressed the effect of this intervention. We also excluded studies on devices that eliminate the use of suture needles or that encapsulate suture needles during surgery because the risk of a NSI is different with suture needles in surgery. Extra gloves or special types of gloves were also excluded because there is another Cochrane review on the effect of gloves to prevent needlestick injuries Mischke 2014.
Types of outcome measures
Primary outcomes
Our primary outcome measure was exposure of HCWs to potentially contaminated blood or bodily fluids. Exposure can be reported as self‐reported NSI, sharps injury, blood stains on the skin, or glove perforations. We considered all reports of such exposure as valid measures of the outcome, such as self‐reports, reports by the employer, or observations of blood stains.
Secondary outcomes
We considered ease of use of the devices (including user satisfaction) and information related to the cost of the intervention as secondary outcomes.
Search methods for identification of studies
Electronic searches
First, we generated search terms for percutaneous exposure incidents. We then combined these terms for percutaneous exposure incidents with the recommended search strings for randomised trials and for non‐randomised studies. We used the Robinson 2002 search strategy for randomised clinical trials and controlled clinical studies. For finding non‐randomised studies, we used the sensitive search strategy for occupational health intervention studies (Verbeek 2005).
We used the strategy to search CENTRAL, MEDLINE, EMBASE, NHSEED, Science Citation Index Expanded, CINAHL, OSH‐update, and PsycINFO from the earliest record to 1 November 2016. We also searched LILACS but only until 2012. We felt that the yield did not outweigh the efforts and decided to stop searching LILACS. In addition, we searched the databases of WHO, the UK National Health Service (NHS) and www.med.virginia.edu/epinet (Royle 2003).
We present the original search strategies for the databases listed above in Appendix 1.
In the first update of the original search that is common with Parantainen 2011, we used recap* and device* as additional search terms combined by OR and with the other terms as explained in Appendix 2.
We present the most recent updated search strategies for the databases listed above in Appendix 3.
Searching other resources
We screened the reference lists of all relevant studies for additional studies.
Data collection and analysis
Selection of studies
Using the inclusion and exclusion criteria, the authors (M‐CL, JV, VR, MP) worked individually and independently to screen the titles and abstracts of the references that were identified by the search strategy as potential studies. Pairs of authors went through the same references to increase the reliability of the results. We obtained the full texts of those references that appeared to meet the inclusion criteria. We did not blind ourselves regarding the trial author details because we felt that it would not increase validity. We solved disagreements between pairs by discussion. A pair consulted a third author if disagreement persisted.
Data extraction and management
Review authors worked in pairs (VR and JV, M‐CL and MP) but independently to extract the data onto a form. The form included the essential study characteristics about the participants, interventions, outcomes and results. We also noted any adverse events and the sponsorship of the study. Two pairs of authors (VR and JV, M‐CL and MP) independently assessed the risk of bias of the studies. The pairs used a consensus method if disagreements occurred. The pairs consulted a third author if disagreement persisted. Again, we did not mask trial names because we believed that it would not increase validity.
Assessment of risk of bias in included studies
For the assessment of risk of bias in RCTs we used the risk of bias tool in RevMan 2014. For CBA studies, we used two items additional to the Cochrane risk of bias tool from a validated instrument (Downs 1998): adjustment for baseline differences and similar timing of recruitment of intervention group.
For ITS studies we used the risk of bias criteria as presented by Ramsay 2003.
Overall judgement of risk of bias at study level
For RCT studies we judged a study to be at a low risk of bias if at least two of the following domains (random sequence generation, allocation concealment and blinding) had a low risk of bias and the remaining third domain had unclear risk of bias and none of the other domains (attrition bias, reporting bias, similar recruitment of groups, adjustment for baseline differences and other bias) had a high risk of bias.
For CBA and ITS studies, we judged a study to be at a low risk of bias if none of the domains were rated as high risk.
Measures of treatment effect
For RCTs and CBA studies with dichotomous outcomes, we used relative risks or risk ratios (RR) as the measure of the treatment effect. We did not use odds ratios because the incidence of most outcomes was higher than 10% and then odds ratios give an inflated impression of the relative risk.
In studies where needlestick injuries or glove perforations were reported more than once for an individual we used rates and rate ratios as the treatment effect. We calculated the log rate ratio and the standard error and used these data as the input for RevMan.
For ITS studies, we extracted and re‐analysed the data from the original papers according to the recommended methods for analysis of ITS designs for inclusion in systematic reviews (Ramsay 2003). These methods utilise a segmented time‐series regression analysis to estimate the effect of an intervention while taking into account secular time trends and any autocorrelation between individual observations. For each study, we fitted a first order autoregressive time‐series model to the data using a modification of the parameterization of Ramsay 2003. Details of the mode specification are as follows:
Y = ß0 + ß1 time + ß2 (time ‐ p) I (time > p) + ß3 I (time > p) + E, E ˜ N (0, s²).
For time = 1,...,T, where p is the time of the start of the intervention, I (time ≥ p) is a function which takes the value 1 if time is p or later and zero otherwise, and where the errors E are assumed to follow a first order autoregressive process (AR1) and the errors E are normally distributed with mean zero and variance s². The ß parameters have the following interpretation:
ß1 is the pre‐intervention slope;
ß2 is the difference between post‐ and pre‐intervention slopes;
ß3 is the change in level at the beginning of the intervention period, meaning that it is the difference between the observed level at the first intervention time point and that predicted by the pre‐intervention time trend.
We used the change in slope and the change in level as two different measures of treatment effect for ITS studies.
Unit of analysis issues
For studies that employed a cluster‐randomised design but did not make an allowance for the design effect, we intended to calculate the design effect. If no intra‐cluster coefficients were reported, although they are needed to calculate the design effect, we would have assumed a fairly large intra‐cluster coefficient of 0.05 to enable the calculation of design effect. We intended to use the methods that are recommended in the Cochrane Handbook for Systematic Reviews of Interventions (Higgins 2011) for the calculations. However, the two studies that used a cluster‐randomised design either did not provide data on the size of the clusters (L'Ecuyer 1996 2wva) or had a loss to follow up of 50% (van der Molen 2011), which made the cluster calculations questionable. Therefore, we did not perform these calculations.
For studies with multiple study arms that belonged to the same comparison, we divided the number of events and participants in the control group equally over the study arms to prevent double counting of study participants in the meta‐analysis (Asai 2002 active; Asai 2002 passive).
Dealing with missing data
We contacted the authors for additional information if the data needed for meta‐analysis were missing (Hotaling 2009; Sossai 2010). If data were presented in figures only and the authors could not be reached, we extracted data from the figures presented in the article (Chambers 2015 hospitals; Chambers 2015 long‐term nursing care; Goldwater 1989; Goris 2015; Phillips 2013; Whitby 2008). If data such as standard deviations had been missing and they could be calculated from other data present in the article, such as P values, we would have done so according to the recommendations in the Cochrane Handbook for Systematic Reviews of Interventions (Higgins 2011), but there were no studies where this was necessary.
Assessment of heterogeneity
Clinical homogeneity among studies was defined based on the similarity of populations, interventions, and outcomes measured at the same follow‐up point. We regarded all healthcare professionals as sufficiently similar to assume a similar preventive effect from the use of similar devices. We categorised safe devices as indicated under types of interventions and assumed that different devices would lead to different effects. We added three extra categories: intravenous (IV) systems, the introduction of multiple safe devices at the same time and legislation that mandates the use of safe devices. We deemed the interventions contained within these categories to be conceptually similar and sufficiently homogeneous to be combined in a meta‐analysis.
We divided outcomes into a category of needlestick injuries and a category of blood or bodily fluid splashes. Thus, we had two different outcome measures: needlestick injuries and blood splashes. Even though the denominator of the NSI rates differed from patients to devices to workers we felt that they were sufficiently similar to be combined.
We did not combine various study designs as we assumed that there were large differences in risk of bias between the different study types. We have presented the results per comparison separately for each design type.
We assessed statistical heterogeneity by means of the I² statistic. We used the values of < 40%, between 30% and 60%, between 50% and 90%, and over 75% as indicating not important, moderate, substantial, and considerable heterogeneity respectively, as proposed in the Cochrane Handbook for Systematic Reviews of Interventions (Higgins 2011).
Assessment of reporting biases
We will assess for publication bias with a funnel plot in future updates of this review if more than five studies are available in a single comparison.
Data synthesis
We pooled studies that contained sufficient data and that we judged to be clinically and statistically homogeneous with RevMan 5 software (RevMan 2014).
When studies were statistically heterogeneous we used a random‐effects model or we refrained from meta‐analysis; otherwise we used a fixed‐effect model.
For ITS, we first standardised the data by dividing the outcome and standard error by the pre‐intervention standard deviation resulting in an effect size, as recommended by Ramsay 2001. Then, we entered the results into RevMan as the change in level and in slope as two different outcomes using the general inverse variance method.
Finally, we used the GRADE approach to assess the quality of the evidence per comparison and per outcome as described in the Cochrane Handbook for Systematic Reviews of Interventions (Higgins 2011). For comparisons that only included RCTs, we started at high quality evidence. Then, we reduced the quality of the evidence by one or more levels if there were one or more limitations in the following domains: risk of bias, consistency, directness of the evidence, precision of the pooled estimate, and the possibility of publication bias. When the comparison included non‐randomised studies we started at the low quality level and downgraded further if there were limitations, or we would have upgraded the quality if there were reasons to do so. We used the programme GRADEpro 2017 to generate summary of findings tables for the two most important outcomes for all comparisons but separated by design.
Subgroup analysis and investigation of heterogeneity
We intended to re‐analyse the results for studies with a high baseline or control group exposure rate, and for studies from low‐ and middle‐income countries, but this was not possible due to the few studies that we found per comparison and the lack of studies from low‐ and middle‐income countries.
Sensitivity analysis
We intended to re‐analyse the results including only studies with a low risk of bias in order to find out if risk of bias led to changes in the findings but this was only possible for one comparison as there weren't enough low risk of bias studies to do so.
Results
Description of studies
Results of the search
With the original search strategy described in Appendix 1 and after removal of duplicates we had a total of 11,239 references. Based on titles and abstracts, we selected 322 references for full‐text reading. Of these, we excluded those that did not fulfil our inclusion criteria. In cases where the article did not provide enough data we contacted the authors and asked them to send the missing information. If we did not receive sufficient information to judge if the study should be included, we excluded the study. This resulted in 84 full text articles on NSI prevention. Of these, 14 studies fulfilled the inclusion criteria for this review. We updated the search by adding the strategy described in Appendix 2 in January 2012. This resulted in 167 additional references from which we selected seven for full‐text reading. Of these full‐text studies, there were three additional studies that fulfilled our inclusion criteria. Another update of the whole search (Appendix 1 combined with Appendix 2) in January 2014 yielded another 292 references of which three could be potentially included but are awaiting classification. Six are pending more information from the authors (Perry 2012; Phillips 2010; Phillips 2011; Phillips 2012; Phillips 2012a; Uyen 2014) and one is pending translation from Italian (Ferrario 2012). In November 2016 we updated and reran the search strategy again and it yielded an additional 1194 references (Appendix 3) out of which we screened 60 for full‐text reading (see Figure 1). Out of these studies 7 studies fulfilled the inclusion criteria. Altogether, this process led to a total of 24 studies that fulfilled our inclusion criteria.

Study flow diagram for 2017 update
Included studies
Interventions
We included a total of 24 studies, which contain three studies with two intervention arms (Asai 2002 active; Asai 2002 passive; Prunet 2008 active; Prunet 2008 passive; Chambers 2015 hospitals; Chambers 2015 long‐term nursing care) and one study with three intervention arms (L'Ecuyer 1996 2wva; L'Ecuyer 1996 mbc; L'Ecuyer 1996 pbc), corresponding to 29 different comparisons of safety medical devices that we named as different studies to increase transparency of the meta‐analyses. We elaborated on the details of the devices in Table 1. Based on the information in the articles, we checked on the Internet if the devices were still for sale and if they still resembled the original description given in the article. Even though we could not be sure that the devices currently sold were exactly similar to those in the articles, we are confident that the main safety features are still the same.
| Study name | Device Commercial Names | Device Category | Safety Device type | passive/ active | For sale? |
| Asai 1999 active | Insyte AutoGuard intravenous cannula | Safe IV system (insertion) | button for actively retracting the needle | active | Yes |
| Asai 2002 active | Insyte Autoguard intravenous cannula | Safe IV system (insertion) | button for actively retracting the needle | active | Yes |
| Asai 2002 passive | Protective Acuvance | Safe IV system (insertion) | automated retraction of needle | passive | Yes |
| Azar‐Cavanagh 2007 | Unnamed intravenous catheter stylet | Safe IV system (insertion) | retractable protection shield | active? | ? |
| Baskin 2014 | BD Eclipse injector 3‐mL, BD preset syringe with BD Luer‐Lok tip 25G×1 | Blood collection | cannula protection shield is activated with one hand after puncture and clicks irreversibly over the cannula | active | Yes |
| Chambers 2015 hospitals | not reported | Multiple safe devices | safety engineered needles and needleless devices | passive or semi‐automatic | ? |
| Chambers 2015 long‐term nursing care | nor reported | Multiple safe devices | safety engineered needles and needleless devices | passive or semi‐automatic | ? |
| Cote 2003 | Angiocath Autoguard IV catheters | Safe IV system (insertion) | button for actively retracting the needle | active | Yes |
| Edmond 1988 | Winfield sharpsguard | Sharps container | bedside sharps container | n.a. | No |
| Gaballah 2010 | Unnamed safety dental syringes | Injection system | does not require re‐sheating or removal of the needle from its syringe | passive? | ? |
| Goldwater 1989 | Needle guard Biosafe New Zealand | Blood collection | shield on cap prevents injury while recapping | n.a. | No |
| Goris 2015 | Unnamed safety engineered passive retractable syringes | Injection system | automatically and instantly retracts the needle from the patient into the barrel of the syringe | passive | ? |
| Grimmond 2010 | Daniels sharpsmart | Sharps container | bedside sharps container | n.a. | Yes |
| L'Ecuyer 1996 2wva | 2‐way valve Safsite Braun medical | Safe IV system (insertion and needleless) | two valve system with plastic sharp that remains in the device | passive | Yes |
| L'Ecuyer 1996 mbc | Lifeshield metal blunt cannula | Safe IV system (needleless iv system) | metal blunt cannula | passive | Yes |
| L'Ecuyer 1996 pbc | Interlink PBC plastic cannula | Safe IV system (insertion and needleless) | plastic sharp covered by blunt plastic cannula | passive | Yes |
| Mendelson 1998 | 1‐valve Safsite Braun medical | Safe IV system (needleless) | valve of IV system incompatible with needle | passive | Yes |
| Phillips 2013 | safety engineered sharps | Multiple safe devices | not explained | ? | ? |
| Prunet 2008 active | Insyte Autoguard intravenous cannula | Safe IV system (insertion) | button for actively retracting the needle | active | Yes |
| Prunet 2008 passive | Introcan Safety IV system (Braun) | Safe IV system (insertion) | automatic shield on needle tip at withdrawing | passive | Yes |
| Reddy 2001 | 'safety syringes and needleless IV' | Multiple safe devices | not explained | ? | ? |
| Richard 2001 | 'sharps containers' | Sharps container | first in treatment rooms later bedside placements | ? | ? |
| Rogues 2004 | SafetyLock BD, resheathable winged steel needle | Blood collection | after pushing (two handed) needle retracts into sheath | active | Yes |
| Seiberlich 2016 | ViaValve safety I.V. catheter | Safe IV system (insertion) | contains a valve that is designed to restrict blood flow back out of the catheter hub upon initial venipuncture | active | Yes |
| Sossai 2010 | Introcan safety IV system (Braun) | Safe IV system (insertion) | automatic shield on needle tip at withdrawing | passive | Yes |
| Valls 2007 | Eclipse BD; Saf‐T‐ E‐Z Set, BD; Surshield, Terumo; Preserts BD; Provent plus, Smiths; Genie BD; Surgilance Terumo; Blunt administration needles BD | Multiple systems | n.a. | active and passive | Yes |
| van der Molen 2011 | Eclipse BD | Injection system | after injection needle covered with shield | active | Yes |
| Whitby 2008 | VanishPoint; VanishPoint blood tube holders; BD Safety‐Lok; SmartSite needle‐free system; Smartsite Plus | Multiple systems | retractable syringes, needle‐free IV systems and safety winged butterfly needles. | passive | Yes |
| Zakrzweska 2001 | Safety Plus Septodont (Dental injections) | Injection system | Protective sheaths can be temporarily or definitely protect the needle | active | Yes |
The types of devices used in the various studies were:
-
safe blood collection devices (n = 3) (Baskin 2014; Goldwater 1989; Rogues 2004);
-
safe IV systems (n = 9) (Asai 1999 active; Asai 2002 active; Asai 2002 passive; Azar‐Cavanagh 2007; Cote 2003; L'Ecuyer 1996 2wva; L'Ecuyer 1996 mbc; L'Ecuyer 1996 pbc; Mendelson 1998; Prunet 2008 active; Prunet 2008 passive; Seiberlich 2016; Sossai 2010);
-
safe injection device (n = 4) (Gaballah 2012; Goris 2015; van der Molen 2011; Zakrzewska 2001);
-
multiple safety devices interventions (n = 5) (Chambers 2015 hospitals; Chambers 2015 long‐term nursing care; Phillips 2013; Reddy 2001; Valls 2007; Whitby 2008); and
-
safe needle disposal boxes (n = 3) (Edmond 1988; Grimmond 2010; Richard 2001).
Safety engineered devices can be divided into two broad categories, passive and active devices. Passive devices have a safety function that is automatically activated without the user's interference. This type of safety device is supposed to offer better protection because the human factor is excluded. Active devices require one‐ or two‐handed activation by a health worker after use.
Four studies used a similar type of safe active IV system (Autoguard IV) (Asai 1999 active; Asai 2002 active; Cote 2003; Prunet 2008 active). The safety mechanism of this device is activated by pushing a button which retracts the needle. Two studies evaluated a passive and an active system (Asai 2002 active; Asai 2002 passive; Prunet 2008 active; Prunet 2008 passive). In addition to the Autoguard IV, Asai 2002 passive and Prunet 2008 passive used a passive device. Asai 2002 passive used the Protective Acuvance, which consists of two needles (one inside the other) where the tip of the needle is automatically changed to a blunt needle upon withdrawing. Prunet 2008 passive used the Introcan safety, which automatically shields the needle tip upon withdrawing. The Introcan safety IV system was also used by Sossai 2010. Whereas Seiberlich 2016 used a safe active IV system (ViaValve), which consisted of a valve to prevent blood flow back out of the catheter hub on initial venipuncture.
A needleless system refers to a device that does not use needles for the collection of body fluids or administration of medication or fluid after initial IV access is established (Mendelson 1998). L'Ecuyer 1996 2wva; L'Ecuyer 1996 mbc; L'Ecuyer 1996 pbc used three needleless IV systems. One, the safety needleless IV tubing system (blunt metal cannula), was replaced after four months by a blunt plastic cannula due to dissatisfaction of employees with the device. Mendelson 1998 evaluated a needleless IV system which is incompatible with a needle. All other studies had employed either a combination of the needleless system and insertion or evaluated the effects of safe insertion only.
In the five studies involving multiple safety devices, one study included safety‐engineered needles and needleless devices that were either passive or semi‐automatic (Chambers 2015 hospitals; Chambers 2015 long‐term nursing care). The study by Phillips 2013 used safety‐engineered sharps. Reddy 2001 used safety syringes and needleless IV systems. Valls 2007 used safety vacuum phlebotomy systems, blood‐gas syringes with a needle sheath, lancets with retractable single‐use puncture sticks, safe IV catheters (passive and active), and safe injection devices. Whitby 2008 used multiple passive safety‐engineered devices including retractable syringes, needle‐free IV systems and safety winged butterfly needles.
In the studies on safe disposal boxes, Edmond 1988 evaluated a bedside needle disposal; Grimmond 2010 assessed a sharps container with enhanced safety features such as automatic lock‐out when full; and Richard 2001 introduced small containers in all patient areas combined with an educational program.
In studies focusing on safe blood collection, Rogues 2004 introduced two devices: re‐sheathable winged steel needles and Vacutainer blood‐collecting tubes with recapping sheaths. Goldwater 1989 used a shield on the needle cap to prevent the needle from injuring the worker. Baskin 2014 used a safety‐engineered blood gas syringe in which the cannula protection shield is activated with one hand after puncture and clicks irreversibly over the cannula.
Representing safe injection devices, Gaballah 2012 used safety dental syringes that did not require re‐sheating or removal of the needle from its syringe. Goris 2015 used passive subcutaneous retractable syringes that automatically and instantly retract the needle from the patient into the barrel of the syringe. van der Molen 2011 evaluated an injection needle with a safety feature shielding the needle after the injection, and Zakrzewska 2001 assessed one type of safety syringe for dentistry. The injection devices had an active safety mechanism that had to be activated by the workers.
A total of 17 studies reported introducing the safety devices together with training sessions (Azar‐Cavanagh 2007; Baskin 2014; Edmond 1988; Gaballah 2012; Goldwater 1989; Goris 2015; L'Ecuyer 1996 mbc; L'Ecuyer 1996 pbc; L'Ecuyer 1996 2wva; Mendelson 1998; Prunet 2008 active; Prunet 2008 passive; Richard 2001; Rogues 2004; Seiberlich 2016; Sossai 2010; Valls 2007; van der Molen 2011; Whitby 2008; Zakrzewska 2001). Goldwater 1989 briefly stated that staff completed an educational program. Two studies did not report on the integration of training or education as part of the study (Grimmond 2010; Reddy 2001).
Types of study designs
Study designs used to assess the effect of the intervention were:
-
six RCTs (Asai 1999 active; Asai 2002 active; Asai 2002 passive; Baskin 2014; Cote 2003; Prunet 2008 active; Prunet 2008 passive; Seiberlich 2016);
-
two cluster‐RCTs (L'Ecuyer 1996 2wva; L'Ecuyer 1996 mbc; L'Ecuyer 1996 pbc; van der Molen 2011);
-
five CBAs (Gaballah 2012; Grimmond 2010; Mendelson 1998; Valls 2007; Zakrzewska 2001); and
-
eleven ITS (Azar‐Cavanagh 2007; Chambers 2015 hospitals; Chambers 2015 long‐term nursing care; Edmond 1988; Goldwater 1989; Goris 2015; Phillips 2013; Reddy 2001; Richard 2001; Rogues 2004; Sossai 2010; Whitby 2008).
Participants
There were slight differences across studies in terms of selected participants for the study. In nine studies, researchers referred to the broad term of healthcare personnel or hospital workers as participants (Chambers 2015 hospitals; Chambers 2015 long‐term nursing care; Edmond 1988; Goris 2015; Grimmond 2010; Phillips 2013; Richard 2001; Rogues 2004; Sossai 2010; van der Molen 2011). Reddy 2001 included health personnel with the exception of physicians. Three studies included healthcare workers explicitly at risk of blood borne pathogen exposure from contaminated needles, referred to as house staff, physicians, medical students, nurses, nursing assistants, emergency medical technicians and environmental service workers (Azar‐Cavanagh 2007; Mendelson 1998; Whitby 2008). Three studies included nursing personnel only as participants (L'Ecuyer 1996 2wva; Seiberlich 2016; Valls 2007;). Two studies included anaesthesiologists (Cote 2003; Prunet 2008 active; Prunet 2008 passive). In two studies researchers and assistants were the persons handling the needles (Asai 1999 active; Asai 1999 active; Asai 2002 active). Dental clinic staff were the target group in one study (Zakrzewska 2001). One study included dental and nursing students (Gaballah 2012). One study included emergency department doctors (Baskin 2014). Another study included only laboratory staff (Goldwater 1989)
In one RCT the number of participants were 50 each in the intervention and control groups (Asai 1999 active; Asai 2002 active; Asai 2002 passive). In another RCT there were 254 and 251 participants in each of the intervention groups and 254 participants in the control group (Prunet 2008 active; Prunet 2008 passive). There were 119 participants in the control group and 211 in the intervention group in (Cote 2003) and 275 in each group in (Baskin 2014). In (Seiberlich 2016) there were 79 in the control group and 73 in the intervention group.
In the cluster‐RCTs, van der Molen 2011 reported on eight wards in each of the two intervention groups and the control group, representing approximately 265 workers in each of the these three groups during the initial phase. The authors adjusted for the cluster effect by means of a GEE‐analysis. L'Ecuyer 1996 2wva reported 19,436 patient‐days for the plastic two‐way valves, 3840 patient‐days for the metal blunt cannula (L'Ecuyer 1996 mbc) and 15,737 patient‐days for the plastic blunt needle (L'Ecuyer 1996 pbc). However, the study did not mention the number of wards that were randomised.
In the CBA studies, Grimmond 2010 recruited 14 hospitals in both the control and the intervention groups, approximating overall 19,880 full‐time equivalents (FTE) during the two‐year study period. Valls 2007 recruited seven wards for the intervention group and five wards for the control group from a hospital with 1000 workers. Zakrzewska 2001 had approximately 300 workers in both the intervention and control groups. Mendelson 1998 reported on eight medical units in both the intervention and control groups, corresponding to approximately 220 workers per group. Gaballah 2012 recruited three hospitals ‐ one for the control group and two for the intervention group. However, the authors did not report data relating to the number of participants.
In the ITS studies, Azar‐Cavanagh 2007 reported on 11,161 healthcare workers for the pre‐intervention period (18 months) and 12,851 healthcare workers for the post‐intervention period (18 months). Reddy 2001 reported on 3011 FTE for the pre‐intervention period (three years) and 3992 FTE for the post‐intervention period (three years). Rogues 2004 reported on 8500 FTE (2000 nurses) per year for the pre‐intervention period (four years) and post‐intervention period (three years). Edmond 1988 followed 278 nurses for the pre‐intervention period (eight months) but provided no information to determine if this number remained the same for the intervention period (four months). Richard 2001 did not report the number of participants in the one participating hospital during the seven‐year study period. Goldwater 1989 reported 127,000 venipunctures for the pre‐intervention period (six months), and 483,000 venipunctures with the device and 232,348 without the device during the intervention period (33 months). Sossai 2010 reported that the number of employees at the hospital fluctuated between 4447 and 4636 throughout the study period (two years pre‐intervention and three years post‐intervention). Chambers 2015 hospitals reported on an average of 325 000 FTE per year and included nine data points. Chambers 2015 long‐term nursing care also reported on an average of 325000 FTE per year and included nine data points. Goris 2015 reported on 857 895 employee productive hours for the pre‐intervention period and 237 202 employee productive hours for the post‐intervention period. Phillips 2013 reported on 184 years of cumulative data collected from 85 hospitals in the pre‐intervention period (six years) and 150 years of cumulative data collected from 85 hospitals in the post‐intervention period (five years). Whitby 2008 reported on 3053 FTE for the pre‐intervention period (12 months) and 6506 FTE for the post‐intervention period (24 months).
The average number of data points in the eleven ITS studies was 13.8 and ranged from six to 39.
Outcomes
Twenty‐one studies included self‐reported percutaneous injuries as their main outcome (Asai 1999 active; Asai 2002 active; Asai 2002 passive; Azar‐Cavanagh 2007; Chambers 2015 hospitals; Chambers 2015 long‐term nursing care; Cote 2003; Edmond 1988; Gaballah 2012; Goldwater 1989; Goris 2015; Grimmond 2010; L'Ecuyer 1996 2wva; L'Ecuyer 1996 mbc; L'Ecuyer 1996 pbc; Mendelson 1998; Phillips 2013; Reddy 2001; Richard 2001; Rogues 2004; Sossai 2010; Valls 2007; van der Molen 2011; Whitby 2008; Zakrzewska 2001). Seiberlich 2016 reported on incidence of blood leakage and blood exposure risk reduction. In two studies (Baskin 2014; Prunet 2008 active; Prunet 2008 passive) the main outcomes were both blood splashes and NSIs. In three studies researchers reported only blood splashes (Asai 1999 active; Asai 2002 passive; Cote 2003; Prunet 2008 active; Prunet 2008 passive). Three studies did not report NSIs as their main outcome as no injury was reported during the study (Asai 1999 active; Asai 2002 passive; Prunet 2008 active; Prunet 2008 passive). Cote 2003 reported that the study was underpowered to assess the difference in needlestick injuries between the groups.
The denominators for the self‐reported NSIs included: the number of procedures (Baskin 2014; Goldwater 1989; Rogues 2004), medical devices (Prunet 2008 active; Prunet 2008 passive; Sossai 2010), FTE (Chambers 2015 hospitals; Chambers 2015 long‐term nursing care; Grimmond 2010; Phillips 2013; Reddy 2001; Whitby 2008), health workers (Azar‐Cavanagh 2007; Edmond 1988; van der Molen 2011), patient‐days and productive hours worked (L'Ecuyer 1996 2wva; L'Ecuyer 1996 mbc; L'Ecuyer 1996 pbc), study weeks (Mendelson 1998), hours worked (Zakrzewska 2001), patients‐days and patients (Valls 2007), employee productive hours (Goris 2015). Richard 2001 reported the number of percutaneous injuries and the proportion of injuries due to improper disposal of sharps, which was defined by the authors as an NSI to worker assisting with a procedure, or NSI located on the non‐dominant hand while removing the needle. The denominators for the blood splashes were patients (Asai 1999 active; Asai 2002 active; Asai 2002 passive; Prunet 2008 active; Prunet 2008 passive) and number of procedures (Baskin 2014; Cote 2003). In one study the denominator for NSIs was not reported (Gaballah 2012).
Researchers reported the ease of use of the devices in six studies (Asai 1999 active; Asai 2002 active; Asai 2002 passive; Baskin 2014; Mendelson 1998; Prunet 2008 active; Prunet 2008 passive; Seiberlich 2016). Five studies included a cost analysis of the intervention (Goris 2015; Mendelson 1998; Valls 2007; Whitby 2008; Zakrzewska 2001).
To be able to estimate the absolute effect of an intervention it was important to know what the control group injury rate or the baseline rate was. The NSI rate varied from 5.0 percutaneous injuries (PIs) per 1000 person‐years for Azar‐Cavanagh 2007 to 1.03 per 1000 FTE‐years for Reddy 2001. Rogues 2004 reported a rate of 17.0 phlebotomy related PIs per 100,000 devices purchased. Sossai 2010 had a baseline rate of 9.67 per 100,000 catheters used per year. Goldwater 1989 reported a rate of about 49 per 100,000 venipuncture‐years.
Geographical location
The included studies originated from nine different countries. Nine studies were from the USA (Azar‐Cavanagh 2007; Cote 2003; Edmond 1988; Goris 2015; Grimmond 2010; L'Ecuyer 1996 2wva; L'Ecuyer 1996 mbc; L'Ecuyer 1996 pbc; Mendelson 1998; Phillips 2013; Reddy 2001), two from Japan (Asai 1999 active; Asai 2002 active; Asai 2002 passive), two from France (Prunet 2008 active; Prunet 2008 passive; Rogues 2004), two from Canada (Chambers 2015 hospitals; Chambers 2015 long‐term nursing care; Seiberlich 2016), two from the UK (Gaballah 2012; Zakrzewska 2001) and one each from New Zealand (Goldwater 1989), India (Richard 2001), Italy (Sossai 2010), Spain (Valls 2007), the Netherlands (van der Molen 2011), Turkey (Baskin 2014) and Australia (Whitby 2008).
Year of study
Of the 24 included studies, 19 had been published after the year 2000 (Asai 2002 active; Asai 2002 passive; Azar‐Cavanagh 2007; Baskin 2014; Chambers 2015 hospitals; Chambers 2015 long‐term nursing care; Cote 2003; Gaballah 2012; Goris 2015; Grimmond 2010; Phillips 2013; Prunet 2008 active; Prunet 2008 passive; Reddy 2001; Richard 2001; Rogues 2004; Seiberlich 2016; Sossai 2010; Valls 2007; van der Molen 2011; Whitby 2008; Zakrzewska 2001), whereas three studies had been published in the 1990s (Asai 1999 active; L'Ecuyer 1996 2wva; L'Ecuyer 1996 mbc; L'Ecuyer 1996 pbc; Mendelson 1998) and two studies in the 1980s (Edmond 1988; Goldwater 1989).
Excluded studies
The table Characteristics of excluded studies lists the reasons for exclusion of 44 studies.
Risk of bias in included studies
Risk of bias varied considerably across studies (Figure 2; Figure 3).

Risk of bias graph: review authors' judgements about each risk of bias item presented as percentages across all included studies.

Risk of bias summary: review authors' judgements about each risk of bias item for each included study.
Allocation
Adequate sequence generation
We judged one of the six RCTs to have a low risk of bias for sequence generation because the researchers used a ballot box to randomise patients (Prunet 2008 active; Prunet 2008 passive). One RCT used randomisation by week (Cote 2003) and we judged it to have a high risk of bias due to the predictability of the randomisation. In one RCT (Seiberlich 2016) randomisation was done on a 1:1 basis by the participating clinicians and hence we judged it to have a high risk of bias. We judged three of the six RCTs to have an unclear risk of bias because the authors did not report specific information on the method used for randomisation (Asai 1999 active; Asai 2002 active; Asai 2002 passive; Baskin 2014).
Neither of the two cluster‐RCTs provided sufficient information about their randomisation process and therefore we judged them to have an unclear risk of bias (L'Ecuyer 1996 2wva; L'Ecuyer 1996 mbc; L'Ecuyer 1996 pbc; van der Molen 2011).
Allocation concealment
We judged three of the six RCTs to have a low risk of bias for allocation concealment because the researchers used sealed opaque envelopes or a single‐blinded envelope (Asai 2002 active; Asai 2002 passive; Baskin 2014; Prunet 2008 active; Prunet 2008 passive). We judged three RCTs and two cluster‐RCTs (Asai 1999 active; Cote 2003; L'Ecuyer 1996 2wva; L'Ecuyer 1996 mbc; L'Ecuyer 1996 pbc; Seiberlich 2016; van der Molen 2011) to have an unclear risk of bias because the authors reported no information about allocation concealment.
Blinding
Among the RCTs, Asai 1999 active and Asai 2002 passive reported that the presence or absence of blood on the tray was assessed by blinded researchers. We judged these two studies to have a low risk bias. Seiberlich 2016 reported it was not a double‐blind study which led to an inherent yet unavoidable clinician bias. Hence we judged this study to have a high risk of bias. Cote 2003; and Prunet 2008 active; Prunet 2008 passive also reported the presence or absence of blood spills but they did not report if the outcome assessors were blinded. Because of this we judged these two studies to have an unclear risk of bias. We judged the remaining 19 included studies to have an unclear risk of performance and detection bias as they provided no information on blinding.
One ITS study and another CBA study reported that healthcare workers were unaware of the study (Edmond 1988; Grimmond 2010). In these two studies it is unlikely that the staff changed their work practices or behaviours towards reporting NSIs due to the acknowledgment of the study. However, health workers would be aware of the change in the type of devices used. Consequently we judged these two studies to have an unclear risk of bias.
Incomplete outcome data
Among the six RCTs and two cluster‐RCTs, we judged six studies to have a low risk for incomplete outcome data because they reported all outcome data for all participants (Asai 1999 active; Asai 2002 active; Baskin 2014; Cote 2003; L'Ecuyer 1996 2wva; van der Molen 2011). Outcome information was unclear for the remaining two RCTs (Prunet 2008 active; Seiberlich 2016) and therefore we judged them to have an unclear risk of bias in this domain.
Among the five CBA studies, we judged three studies to have a low risk of bias because there was complete outcome data available (Grimmond 2010; Mendelson 1998; Zakrzewska 2001). The remaining two CBA studies reported outcome information unclearly and therefore we judged them to have an unclear risk of attrition bias (Gaballah 2012; Valls 2007).
Selective reporting
Among the six RCTs and two cluster‐RCTs, seven studies reported all outcomes as described in the method section and therefore we judged them to have a low risk of reporting bias (Asai 1999 active; Asai 2002 active; Asai 2002 passive; Baskin 2014; Cote 2003; Prunet 2008 active; Prunet 2008 passive; Seiberlich 2016; van der Molen 2011). We judged L'Ecuyer 1996 2wva to have an unclear risk of reporting bias as information that we expected based on the described methods appeared to be missing in the results section.
Among the five CBA studies, two studies reported all outcomes as described in the methods sections and therefore we judged them to have a low risk of reporting bias (Grimmond 2010; Mendelson 1998). We judged Valls 2007 to be at high risk of reporting bias because the authors did not fully report outcomes in the results section and they did not consistently report the denominator used for their analyses. We judged Gaballah 2012 to have a high risk of reporting bias because the type of syringe system causing NSIs among various departments was not mentioned in the results section. We judged Zakrzewska 2001 to have an unclear risk of reporting bias because the authors did not specifically mention their outcome measures in the methods section.
Similar recruitment of groups
Among the six RCTs and two cluster‐RCTs, we judged Baskin 2014; Prunet 2008 passive and van der Molen 2011 to have a low risk of recruitment bias. According to our judgment, four studies had an unclear risk of recruitment bias because they did not report information related to the recruitment of study groups (Asai 1999 active; Asai 2002 active; Cote 2003; Seiberlich 2016). We judged one study to be at high risk of recruitment bias due to a difference in the recruitment process for the intervention and control groups (L'Ecuyer 1996 2wva; L'Ecuyer 1996 mbc; L'Ecuyer 1996 pbc).
Among the five CBA studies, we judged two studies to have a low risk of recruitment bias (Grimmond 2010; Mendelson 1998). The study by Grimmond 2010 reported a small difference in staff full‐time equivalents (FTE) (< 1%) and the study by Mendelson 1998 was completed within a relatively short period of time (six months). We judged one study to have an unclear risk of recruitment bias due to the lack of information related to the recruitment of groups (Zakrzewska 2001). We judged two studies to be at high risk of recruitment bias because in one the researchers self‐assigned control and intervention hospital wards (Valls 2007) and in the other study the authors recruited control and intervention groups from different hospitals (Gaballah 2012).
Adjustment for baseline differences
For an RCT, any baseline difference should be due to chance if the randomisation process was appropriately completed. According to our judgment Asai 1999 active; Asai 2002 active; Asai 2002 passive; Cote 2003; L'Ecuyer 1996 2wva; L'Ecuyer 1996 mbc; L'Ecuyer 1996 pbc and Seiberlich 2016 had an unclear risk of bias due to baseline imbalance as they provided no information about the participants in the intervention and control groups. We judged Baskin 2014; Prunet 2008 active; Prunet 2008 passive and van der Molen 2011 to have a low risk of bias as they had adequately adjusted for baseline differences.
Among the five CBAs, we judged four studies to have an unclear risk of bias due to baseline imbalance as they reported no information regarding the adjustment for baseline difference (Gaballah 2012; Grimmond 2010; Mendelson 1998; Valls 2007). We judged Zakrzewska 2001 to have a low risk of bias in this domain because both groups were similar.
Risk of bias in ITS studies
See Table 2 for an overview of our judgment of all 11 included studies' risk of bias in all seven risk of bias domains relevant to the ITS design, and the consequent level of evidence provided. Among the 11 included ITS studies, five studies fulfilled the criterion that the intervention was independent of other changes (Azar‐Cavanagh 2007; Chambers 2015 hospitals; Chambers 2015 long‐term nursing care; Goris 2015; Phillips 2013; Rogues 2004). None of the studies reported a repeated measures analysis nor tested for trend, but this was overcome by our re‐analysis of the data. Six studies (Azar‐Cavanagh 2007; Edmond 1988; Goldwater 1989; Reddy 2001; Rogues 2004; Whitby 2008) used a data collection method which was sustained throughout the study and thus was unlikely to have affected the data collection. Three studies reported information to help determine if blind outcome assessment was used (Chambers 2015 hospitals; Chambers 2015 long‐term nursing care; Phillips 2013; Goris 2015). For the criterion of the completeness of the data set, five studies reported outcome data adequately (Azar‐Cavanagh 2007; Goldwater 1989; Goris 2015; Sossai 2010; Whitby 2008). We assessed the outcome measures of nine studies to be reliable because they used a consistent reporting system for NSI throughout the study period or they sourced data from a reliable source such as administrative data (Azar‐Cavanagh 2007; Chambers 2015 hospitals; Chambers 2015 long‐term nursing care; Edmond 1988; Goris 2015; Phillips 2013; Reddy 2001; Rogues 2004; Sossai 2010; Whitby 2008). One ITS study had an additional risk of bias due to participating health workers having access to conventional needles during the intervention period (Reddy 2001).
| Study | Intervention independent of other changes | Sufficient data points | Test for trend | Intervention did not affect data collection | Blinded outcome assessment | Complete data set | Reliable outcome measure | Total score |
| Goldwater 1989 | Not done (0) Comment: staff turnover during study period. Staff preference for the use of the intervention devices varied across study periods. | Done (1) Comment: inlcusion of 3 data points before and after, the study was reanalysed using ARIMA model. | Done (1) Comment: we reanalysed the study for trend. | Done (1) Data collection seems to remained the same pre and post‐intervention. | Not clear (0) Authors do not provide information on blinding. | Done (1) | Not clear (0): Comment: no system for NSI seems to have been in placed during the study period. Uncertain about the consistency of the reporting during the study period. | 4 |
| Rogues 2004 | Done (1) Quote: "Conventional phlebotomy non‐safety devices were removed from all departments, and the new products were in place on implementation" Comment: only one device seems to have been introduced during intervention but authors do not specify if additional changes occurred during the study. | Done (1) Comment: inlcusion of 3 data points before and after, the study was reanalysed using ARIMA model. | Done (1) Comment: we reanalysed the study for trend. | Done (1) Comment: the method of data collection remains the same throughout the study. It does not appears to be influenced by the intervention. | Not clear (0) Comment No information is available on blinding. | Not done (0) Comment: data not available for the estimated number of phlebotomies performed for 1993 and 1994. | Done (1) Comment: hospital has a sharp injury surveillance system prior and after intervention. Althought not ideal as possibility of underreporting but appropriate for the study outcome. | 5 |
| Reddy 2001 | Not done (0) Quote: one of the confounder present throughout the post intervention phase was the availability of traditional needles devices. Comment: intervention occurs simultaneously with the availability of non‐safety device. | Done (1) Comment: inlcusion of 3 data points before and after, the study was reanalysed using ARIMA model. | Done (1) Comment: we reanalysed the study for trend. | Done (1) Comment: the method of data collection remains the same throughout the study. It does not appears to be influenced by the intervention. | Not clear (0) Comment: no information available on blinding | Not done (0) Comment: physicians were excluded from analysis as no information on FTE. | Done (1) Comment: hospital had a sharp injury surveillance system prior and after intervention. Althought no ideal as possibility of underreporting but appropriate for the study outcome. | 4 |
| Azar‐Cavanagh 2007 | Done (1) Comment: safety devices seem to have systematically replaced the conventional devices. Authors do not specify if additional changes occurred during the study. | Done (1) Comment: inlcusion of 3 data points before and after, the study was reanalysed using ARIMA model. | Done (1) Comment: we reanalysed the study for trend. | Done (1) Comment: the method of data collection remains the same throughout the study. It does not appears to be influenced by the intervention. | Not clear (0) Comment: authors do not specify if data analysts were blinded to the study. Healthcare workers could not have been blinded to the introduction of the new devices. | Done (1) Comment: data is available for all health workers. | Done (1) Coment: | 6 |
| Sosai 2010 | Not done (0) Comment: authors indicated that some conventional devices were still used during the intervention period despite study which aimed to replace all conventional devices by new safety devices. | Done (1) comment: inlcusion of 3 data points before and after, the study was reanalysed using ARIMA model. | Done (1) Comment: we reanalysed the study for trend. | Not done (0) Quote: "after launching the sharps awareness campaign in 2003, # of injuries increased possibility because of sharps awareness campaign" Comment: intervention seems to have affected reporting of NSI. | Not clear (0) Comment: information on blinding is not reported. | Done (1) Comment: all hospital employees were included in the study. | Done (1) Comment: used the incident reporting system throughout the study which appears to be adequate measure for NSI. | 4 |
| Edmond 1988 | Not clear (0) Comment: no information if additional changes were introduced during the same period at the hospital. | Done (1) Comment: inlcusion of 3 data points before and after, the study was reanalysed using ARIMA model. | Done (1) Comment: we reanalysed the study for trend. | Done (1) Comment: intervention does not appears to have affected method of data collection. | Not clear (0) Quote: "the subjects were unaware of the nature of the study". Comment: the reporting of the NSI was not likely to be affected by the staff knowing of the study. However, health workers would be aware of the change in the type of devices used. | Not clear (0) Comment: information about the number of nurses for pre‐intervention but not for post‐intervention. For NSI, the number of staff per year is not available. | Done (1) Comment: authors used employee health records for pre and post intervention. For NSI, this system appears reliable for the outcome of interest. | 4 |
| Richard 2001 | Not clear (0) Comment: no information if additional changes were introduced during the same period at the hospital. | Done (1) Comment: inlcusion of 3 data points before and after, the study was reanalysed using ARIMA model. | Done (1) Comment: we reanalysed the study for trend. | Not done (0) Quote: the increase in total injuries reported in 1998 followed a better reporting stimulated by the second educational program. Comment: the reporting system started in 1993, it is possible that as more people became aware of the surveillance system, there was an increase in reporting. | Not clear (0) Comment: No information is available on blinding | Not clear (0) Comment: no information on the actual number of healthcare workers included during pre and post intervention. | Not clear (0) Comment: it is unclear if the reporting system was used consistently throughout the years especially as it was launched during the early phase of the study. | 2 |
| Chambers 2015 hospitals | Done (1) Comment: safety devices seem to have replaced the conventional devices due to legislation. | Done (1) Comment: inlcusion of 3 data points before and after, the study was reanalysed using ARIMA model. | Done (1) Comment: we reanalysed the study for trend. | Not clear (0) Comment: Increased attention to needle stick injury prevention during the period of regulatory change may have resulted in increased reporting. | Done (1) Comment: data was obtained from an administrative source. | Not done (0) Comment: the data set represented 63 percent of all needlestick injury claims. | Done (1) Comment: authors used work place safety and insurance board data for compensation claims. For NSI, this system appears reliable for the outcome of interest. | 5 |
| Chambers 2015 long‐term nursing care | Done (1) Comment: safety devices seem to have replaced the conventional devices due to legislation. | Done (1) Comment: inlcusion of 3 data points before and after, the study was reanalysed using ARIMA model. | Done (1) Comment: we reanalysed the study for trend. | Not clear (0) Comment: Increased attention to needle stick injury prevention during the period of regulatory change may have resulted in increased reporting. | Done (1) Comment: data was obtained from an administrative source. | Not done (0) Comment: the data set represented 63 percent of all needlestick injury claims. | Done (1) Comment: authors used work place safety and insurance board data for compensation claims. For NSI, this system appears reliable for the outcome of interest. | 5 |
| Goris 2015 | Done (1) Quote: "The existing inventories of subcutaneous active safety‐engineered devices were removed and replaced with subcutaneous passive safety‐engineered devices" Comment: All conventional devices were replaced by safety‐engineered devices at the start of the intervention. | Done (1) Comment: inlcusion of 3 data points before and after, the study was reanalysed using ARIMA model. | Done (1) Comment: we reanalysed the study for trend. | Not clear (0) Comment: the reporting might have increased after inrodcution of the passive safety‐engineered device due to heightened awareness. | Done (1) Comment: data was obtained from an administrative source. | Done (1) Comment: data for all the healthcare workers was provided in the form of employee productive hours in the pre and post intervention phase. | Done(1) Comment: authors used BJC occupational health database records for pre and post intervention. This being administrative data appears to be reliable for the outcome of interest. | 6 |
| Phillips 2013 | Done (1) Comment: safety devices seem to have replaced the conventional devices due to legislation. | Done (1) Comment: inlcusion of 3 data points before and after, the study was reanalysed using ARIMA model. | Done (1) Comment: we reanalysed the study for trend. | Not clear (0) | Done (1) Comment: data was obtained from an administrative source. | Not done (0) Comment: Data set represented only 73% of the total sample. | Done (1) Comment: Data was obtained from the US Exposure Prevention Information Network (EPINet) sharps injury surveillance database. This appears to be adequate measure for NSIs. | 5 |
| Whitby 2008 | Not clear (0) | Done (1) Comment: inlcusion of 3 data points before and after, the study was reanalysed using ARIMA model. | Done (1) Comment: we reanalysed the study for trend. | Done (1) Comment: the constant and unchanging rate of NSI with solid suture needles implies that reduction of NSI relates neither to the education program associated or increased reporting rates. | Not done (0) Comment: health workers were aware of the change in the type of devices used. | Done (1) Comment: data is available for all health workers. | Done (1) Comment: used the same system of reporting of NSI in pre and post intervention period to the infectious diseases department which has been in place since 1996. | 5 |
Other potential sources of bias
In two RCTs (Asai 1999 active; Asai 2002 active; Asai 2002 passive) the authors reported that the industry supplied the medical safety devices, which could have potentially introduced bias. Therefore we judged these studies to have a high risk of bias. In one RCT (Seiberlich 2016) in addition to the study being funded by the manufacturer of the devices being evaluated a co‐author was an employee of the study sponsor. Consequently we judged the study to have a high risk of bias. In one study, health workers had access to conventional needles during the intervention period (L'Ecuyer 1996 2wva; L'Ecuyer 1996 mbc; L'Ecuyer 1996 pbc). Injuries during this period were attributed to the new devices even if they were caused by the conventional devices. Consequently we judged the study to have high risk of bias.
Among the five CBA studies, Zakrzewska 2001 reported that the industry supplied the medical safety devices, which could have potentially introduced bias. We judged this study to have a high risk of bias. In another study, the surveillance system for NSIs differed between the pre‐ and post‐intervention phases (Valls 2007). This difference may imply a high risk of bias because a more active case finding system was used during the intervention period. Finally, one study introduced another device parallel to the main intervention (Zakrzewska 2001).
The measurement of NSIs was a source of bias in all studies that used this outcome. NSIs can be based on self‐report or a proxy measure of glove perforations. However, none of the included studies used glove perforations as a measurement of NSIs. Like any occupational injury, the reporting of NSIs increases when workers are more aware of the problem, for example due to an awareness campaign. Any intervention has the same effect as an awareness campaign and will thus raise the number of reported injuries. This will probably lead to an underestimation of the true intervention effect.
Effects of interventions
See: Summary of findings for the main comparison (RCT) Safe blood collection systems compared to regular systems for preventing percutaneous exposure injuries caused by needles in healthcare personnel; Summary of findings 2 (ITS) Safe blood collection systems compared to regular systems for preventing percutaneous exposure injuries caused by needles in healthcare personnel; Summary of findings 3 (RCT) Safe intravenous systems compared to regular systems for preventing percutaneous exposure injuries caused by needles in healthcare personnel; Summary of findings 4 (CBA) Safe intravenous systems compared to regular systems for preventing percutaneous exposure injuries caused by needles in healthcare personnel; Summary of findings 5 (ITS) Safe intravenous systems compared to regular systems for preventing percutaneous exposure injuries caused by needles in healthcare personnel; Summary of findings 6 (RCT) Safe injection systems compared to regular systems RCT for preventing percutaneous exposure injuries caused by needles in healthcare personnel; Summary of findings 7 (CBA) Safe injection systems compared to regular systems for preventing percutaneous exposure injuries caused by needles in healthcare personnel; Summary of findings 8 (ITS) Safe passive injection systems compared to safe active injection systems for preventing percutaneous exposure injuries caused by needles in healthcare personnel; Summary of findings 9 (ITS) Multiple safe devices compared to regular devices for preventing percutaneous exposure injuries caused by needles in healthcare personnel; Summary of findings 10 (CBA) Multiple safe devices compared to regular devices for preventing percutaneous exposure injuries caused by needles in healthcare personnel; Summary of findings 11 (ITS) Sharps containers compared to no containers for preventing percutaneous exposure injuries caused by needles in healthcare personnel; Summary of findings 12 (CBA) Sharps containers compared to no containers for preventing percutaneous exposure injuries caused by needles in healthcare personnel; Summary of findings 13 (ITS) Legislation compared to no legislation for preventing percutaneous exposure injuries caused by needles in healthcare personnel
1. Safe blood collection systems versus regular systems
RCT
Outcome: needlestick injuries (NSIs)
One RCT (Baskin 2014) randomised patients to two types of syringes and evaluated the effect of safety engineered blood gas syringes on NSI compared to a conventional heparinised syringe group in the physicians who drew the blood samples. Both intervention (n = 275) and control groups (n = 275) included patients who visited the emergency department. After an immediate follow up, there was a statistically non‐significant decrease in the NSI following the intervention (RR 0.20, 95% CI 0.01 to 4.15) (Analysis 1.1).
Outcome: blood splashes
The same study (Baskin 2014) also examined contact with blood. There was a statistically non‐significant decrease in the incidence of blood splashes (RR 0.14, 95% CI 0.02 to 1.15) (Analysis 1.2).
ITS
Outcome: needlestick injuries (NSIs)
The two included ITS studies evaluated very different interventions. Therefore, we did not combine the studies in a meta‐analysis. One study evaluated a shield on the needle cap that should prevent the needle from injuring the worker when the cap is put back on the needle (Goldwater 1989). There was a non‐significant trend towards a decrease of injuries in this study (Analysis 2.1). The other used a needle sheath (Rogues 2004). In this study the level of injuries decreased substantially (effect size (ES) ‐6.88, 95% CI ‐9.53 to ‐4.23) but the trend over time showed a non‐significant decrease (Analysis 2.2).
2. Safe intravenous systems versus regular systems
RCT
Outcome: needlestick injuries (NSIs)
One trial evaluated the effect of three different safe IV systems to prevent NSI, which resulted in a non‐significant reduction of reported NSIs with a RR of 0.62 (95% CI 0.27 to 1.41) (Analysis 3.1) (L'Ecuyer 1996 mbc; L'Ecuyer 1996 2wva; L'Ecuyer 1996 pbc).
Outcome: incidence of blood contamination
Seven trials with 1641 participants studied if safe IV systems resulted in a change in blood contamination compared to the usual systems. There was a statistically non‐significant increased risk of blood contamination with the safe systems with a RR of 1.38 (95% CI 1.00 to 1.92). Active systems, which had to be activated by health workers, displayed a statistically significant increase in blood splashes (RR 1.60, 95% CI 1.08 to 2.36). Passive systems, which don't have to be activated, displayed a similar incidence in blood splashes in both the intervention and control groups (RR 0.94, 95% CI 0.50 to 1.75) (Analysis 3.2).
Outcome: incidence of blood leakage
One RCT study (Seiberlich 2016) evaluated the effect of a passive safe IV system on the reduction of blood leakage events during insertion of the catheter, withdrawal of the needle and connection of the luer. The study showed a significant reduction in the incidence of blood leakage events with safe IV systems (RR 0.21, 95% CI 0.11 to 0.37) (Analysis 3.3).
CBA
Outcome: needlestick injuries (NSIs)
One CBA study (Mendelson 1998) evaluated the effect of safe IV systems to prevent NSI, which resulted in a non‐significant reduction of reported NSIs with a RR of 0.06 (95% CI 0.0 to 1.09) (Analysis 4.1).
ITS
Outcome: needlestick injuries (NSIs)
In two ITS studies (Azar‐Cavanagh 2007; Sossai 2010) the results were statistically very heterogenous (I² = 79% for level and I² = 99% for trend) and therefore we did not combine them in a meta‐analysis. The level in both studies decreased with a big effect size (Analysis 5.1). The trend over time decreased substantially in one study but not in the other (Analysis 5.2).
3. Safe injection systems versus regular systems
RCT
Outcome: needlestick injuries (NSIs)
One RCT (van der Molen 2011) evaluated the effect of a workshop on NSI combined with the introduction of safety engineered injection needles in seven wards (n = 267) compared to a non‐intervention control group (eight wards, n = 266) and to a workshop on the prevention of NSIs only control group in eight wards (n = 263). NSIs were measured by questionnaires and by the hospital reporting system.
At six‐months follow‐up, there was a statistically non‐significant decrease in NSI based on the questionnaires (RR 0.49, 95% CI 0.16 to 1.56), but based on the hospital records there was a statistically non‐significant increase in NSI (RR 1.20, 95% CI 0.42 to 3.39) (Analysis 6.1; Analysis 6.2).
At 12‐months follow‐up, based on the questionnaire results there was a statistically significant reduction of NSI with RR of 0.20 (95% CI 0.04 to 0.96), but based on the hospital recording system there was a statistically non‐significant reduction of NSI with RR 0.72 (95% CI 0.28 to 1.81) (Analysis 6.3; Analysis 6.4).
CBA
In one study among dentists (Zakrzewska 2001) the risk of NSI was smaller with safe syringes compared to traditional ones but the difference was not significant (RR 0.34, 95% CI 0.04 to 3.28) (Analysis 7.1). Another study which was carried out among dental students (Gaballah 2012) evaluated the risk of NSI with safety dental syringes compared to conventional dental syringes. The authors did not report complete data regarding the type of syringe system causing NSIs for the departments in the intervention and control groups and therefore we did not analyse the results.
ITS
Outcome: needlestick injuries (NSIs) change in level
One study among healthcare workers (Goris 2015) evaluated the effect of a trial with passive safety‐engineered injection systems compared to active safety‐engineered injection systems on the incidence of NSI. There was no considerable effect on the level of NSI following the introduction of the intervention (ES 0.23, 95% CI ‐1.89 to 2.35) (Analysis 8.1).
Outcome: needlestick injuries (NSIs) change in slope
The same study showed a statistically non‐significant long term trend of a decrease in NSI (ES ‐0.74, 95% CI ‐1.66 to 0.18) (Analysis 8.2).
4. Multiple safe devices versus regular devices
CBA
Outcome: needlestick injuries (NSIs)
One study that compared hospital level injury rates (Valls 2007) found a decrease in NSI in the hospitals that introduced safety devices compared to those that did not (RR 0.11, 95% CI 0.01 to 0.81) (Analysis 10.1).
ITS
Outcome: needlestick injuries (NSIs) change in level
In one ITS study (Reddy 2001) there was a statistically non‐significant increase in the level of injuries following the introduction of the safety syringes and needleless IV system (ES 0.43, 95% CI ‐0.30 to 1.16) (Analysis 9.1). Another ITS study (Whitby 2008) showed a statistically non‐significant decrease in the level of NSI following the introduction of safety syringes, needless IV systems and safety‐engineered needles (ES ‐1.04, 95% CI ‐2.20 to 0.12) (Analysis 9.1).
Outcome: needlestick injuries (NSIs) change in slope
In the study by (Reddy 2001) the ES for the change in long‐term time trend showed an increase in the number of reported NSIs (ES 0.56, 95% CI 0.23 to 0.89) (Analysis 9.2). In the other ITS study (Whitby 2008) there was a statistically non‐significant decrease in the trend of reported NSI (ES ‐0.01, 95% CI ‐0.15 to 0.13) (Analysis 9.2).
5. Sharps containers versus no containers
CBA
Outcome: needlestick injuries (NSIs)
In one CBA study (Grimmond 2010), the NSI rate decreased following the introduction of sharps containers compared to departments where these were not introduced with a RR of 0.88 (95% CI 0.78 to 0.99) (Analysis 12.1). This reduction was statistically significant when only container‐related NSIs were counted with a RR of 0.22 (95% CI 0.11 to 0.41) (Analysis 12.2).
ITS
Two ITS studies (Edmond 1988; Richard 2001) showed an increased level of NSI immediately after the introduction of sharps containers and a contradictory effect in the long‐term trend which prevented the synthesis of these studies in a meta‐analysis (Analysis 11.1; Analysis 11.2).
6. Legislation versus no legislation
ITS
Outcome: needlestick injuries (NSIs) change in level
One ITS study had two intervention arms. One arm comprised of long‐term nursing care (Chambers 2015 long‐term nursing care) and the other comprised of hospitals (Chambers 2015 hospitals). According to the results the level of NSI decreased in long‐term nursing care after the introduction of legislation. However, the intervention arm comprising of hospitals showed an increase in the level of NSI. Another ITS study (Phillips 2013) also showed a decrease in the level of NSI following the introduction of legislation. Since these results were very heterogenous we did not combine them in a meta‐analysis (Analysis 13.1).
Outcome: needlestick injuries (NSIs) change in slope
In one ITS study the NSI trend over time decreased in one of the intervention arms comprising of long‐term nursing care (Chambers 2015 long‐term nursing care) and increased in the other arm which included hospitals (Chambers 2015 hospitals). The other ITS study (Phillips 2013) showed a decrease in the long term trend of NSI (Analysis 13.2).
Secondary outcomes
1. Cost
A total of five studies reported information regarding the cost of the intervention. Valls 2007 reported that the direct cost of the use of safety devices was an additional USD 19,417 (USD 0.75 per patient) for the emergency department and USD 16,336 (USD 0.56 per patient‐day) for the hospital wards compared to the pre‐intervention period. Zakrzewska 2001 reported that the price of the safety syringes was comparable to the non‐disposable syringes, approximately USD 0.33 per item. Mendelson 1998 reported that the estimated incremental hospital‐wide cost was USD 82,822 (in 1991) but the cost of injury prevented was USD 1593. Whitby 2008 reported that the overall increased cost for provision of safety‐engineered retractable syringes in the 800‐bed hopsital was USD 46,000 per annum, USD 14 for each at‐risk healthcare worker per year or USD 2 per occupied bed‐day per annum. Goris 2015 reported a net annual increase of USD 20,708.42 on conversion of ASED to PSED at the Barnes‐Jewish Hospital. The study also reported that the total cost avoidance of a conversion from ASED to PSED was USD 68,768.28.
2. Ease of use
Asai 1999 active reported no difference between the safety devices and the conventional devices in terms of ease of insertion. However, the authors reported statistically higher ease of handling for the safety device compared to the conventional one. Asai 1999 active, Asai 2002 active, and Asai 2002 passive reported that the Autoguard IV was significantly easier to insert and handle compared to the other safety device and the conventional catheter needle. Mendelson 1998 reported that 94% of the individuals who completed the survey (approximately 52% response rate) were comfortable using the safe IV system after five or less trials. Prunet 2008 active and Prunet 2008 passive reported that the Insyte Autoguard device was significantly more difficult to insert when compared to conventional devices and the passive devices. With both safety devices the needle was significantly more difficult to withdraw in comparison to the conventional catheter. Baskin 2014 reported that there was no significant difference between a conventional heparinised insulin syringe and safety‐engineered blood gas syringe in terms of ease of use. Seiberlich 2016 reported that the blood control PIVC and standard PIVC were similar in terms of ease of use.
Grading of the evidence
We graded the quality of the evidence per intervention‐outcome combination (Table 3). Because we based our conclusions upon results obtained with a range of study designs, we could not use the GRADEpro programme. We present our considerations in Table 3. For all but one combination we assessed the quality of the evidence as very low because of serious limitations in the study design and the inconsistency of the results. Starting with a low level of quality because of the non‐randomised studies included, the level goes down to very low quality. Only for the combination of safe IV systems and blood contamination, we assessed the quality of evidence as moderate because all included studies were RCTs and they did not have limitations in their design or in the other qualifiers.
| Comparison and outcome | Starting level | Risk of bias | Consistency | Directness | Precision | Publication bias | Quality of evidence |
| Safe versus traditional blood collection systems RCT ‐ all outcomes | high | 1 RCT high RoB | consistent | direct | wide CI | impossible to determine | very low |
| Safe versus traditional blood collection systems ITS | low | 2 ITS high RoB | consistent | direct | wide CI | impossible to determine | very low |
| Safe versus traditional IV systems RCT ‐ all outcomes | high | 5 RCT high RoB, 1 RCT low RoB | consistent | direct | wide CI | impossible to determine | very low |
| Safe versus traditional IV systems CBA | low | 1 CBA high RoB | consistent | direct | wide CI | impossible to determine | very low |
| Safe versus traditional IV systems ITS | low | 1 ITS low RoB, 1 ITS high RoB | consistent | direct | wide CI | impossible to determine | very low |
| Safe versus traditional injection systems RCT | high | 1 RCT high RoB | consistent | indirect; hospital | wide CI | impossible to determine | very low |
| Safe versus traditional injection systems CBA | low | 1 CBA high RoB | consistent | indirect; dentists | wdie CI | impossible to determine | very low |
| Safe pasive injection systems versus safe active injection systems ITS | low | 1 ITS low RoB | consistent | direct | wide CI | impossible to determine | very low |
| Multiple safe versus traditional devices ITS | low | 2 ITS high RoB | inconsistent | direct | wide CI | impossible to determine | very low |
| Multiple safe versus traditional devices CBA | low | 1 CBA high RoB | consistent | direct | wide CI | impossible to determine | very low |
| Sharps containers versus no containers ITS | low | 1 ITS low RoB, 1 ITS high RoB | inconsistent | direct | wide CI | impossible to determine | very low |
| Sharps containers versus no containers CBA ‐ all outcomes | low | 1 CBA high RoB | consistent | direct | wide CI | impossible to determine | very low |
| Legislation versus no legislation ITS | low | 2 ITS high RoB | consistent | direct | wide CI | impossible to determine | low |
Sensitivity analysis
We re‐analysed the results comparing safe IV systems for blood contamination leaving out the one study with a high risk of bias (Cote 2003), but that did not substantially change the results.
Publication bias
We did not have enough studies in any one comparison to assess the effect of publication bias with a funnel plot or a statistical test. However, because we also found small studies with negative results, we don't think that publication bias has played a significant role in the results of this review.
Subgroup analysis and exploration of heterogeneity
We intended to do a subgroup analysis based on the control group or baseline exposure rate. Since the exposures were measured in various ways and we had only a few studies in each comparison we refrained from doing so. In some comparisons, such as multiple safe devices and sharps containers, the results were inconsistent and we could not see any other reasons than the high risk of bias in the non‐randomised studies. We also intended to re‐analyse the results according to the origin of the study as one could expect low‐ and middle‐income countries to have a higher infectious disease prevalence (UNAIDS 2009). However, we included only two studies (Baskin 2014; Richard 2001) from low‐ or middle‐income countries (Turkey and India) that did not show a preventive effect from the introduction of safety‐engineered devices.
Discussion
Summary of main results
For safe blood collection systems, we found very low quality evidence of no considerable effect on NSIs in one underpowered RCT that introduced safe arterial blood gas collection systems. In one ITS study we found very low quality evidence of a large reduction in NSI following the use of a needle sheath on a winged steel needle. Another ITS study used cap shields that are outdated.
There was very low quality evidence in two ITS studies that NSIs were reduced with the introduction of safe IV devices. One RCT and one CBA study found no difference in NSIs. However, there was moderate quality evidence in four other RCTs that these devices increased the number of blood splashes where the safety system had to be engaged actively (relative risk (RR) 1.6, 95% CI 1.08 to 2.36) whereas two RCTs of passive systems produced low quality evidence that showed no effect on blood splashes. Yet another RCT produced low quality evidence that a different safe active IV system also decreased the incidence of blood leakages.
According to very low quality evidence from one RCT and one CBA study, the introduction of safe injection devices did not considerably change the NSI rate. One ITS study found low quality evidence of no effect on NSI rate following the introduction of safe passive injection systems compared to safe active injection systems.
According to very low quality evidence from one CBA study the introduction of multiple safety devices resulted in a decrease in NSIs (RR 0.1, 95% CI 0.01 to 0.81), whereas two ITS studies showed inconsistent results.
Similarly, the introduction of safety containers reduced NSIs in one CBA study but not in the two ITS studies (very low quality evidence).
Two ITS studies produced moderate quality evidence showing that the introduction of legislation on safety‐engineered devices reduced NSI rate. However, another ITS study reported in the same article that included hospitals the results showed the introduction of legislation having no effect on NSI rate. The reason for this could be that especially in this population safety‐engineered needles were available for early adoption already seven years prior to the legislation which invalidates the assumption that there is an interruption in the time‐series.
Overall completeness and applicability of evidence
The studies included in this review cover a time period from 1988 to 2016. With the exception of two studies, one from Turkey and the other from India, all the remaining studies were from high‐income countries. Studies covered a wide range of devices used for blood collection or injections. Some studies evaluated safety devices that are not in use anymore such as the standard needled IV system. This has been replaced by needleless IV systems. We included studies examining safety devices regardless of whether the devices were presently in use or not, as long as the studies evaluating them met our original inclusion criteria.
It is difficult to randomise complex interventions and therefore we also included non‐randomised studies. This provides the best avaliable evidence for these interventions. We felt that uncontrolled studies are at a too high risk of bias and therefore we did not include them. By including ITS studies we were able to detect both short‐term and long‐term effects on trends of injury rates.
Most studies could be named pragmatic trials because they were either carried out by the healthcare staff who were themselves at risk or they were based on routinely gathered data, such as NSI reports. This increased the applicability of the evidence but probably at the same time has decreased the quality of the studies. Most studies cover healthcare staff that are exposed to the risk of needlestick injuries, and as such the evidence is directly applicable to nurses, physicians and laboratory staff. Of the 24 included studies only two RCTs had researchers and assistants complete the procedures. Consequently their findings may not apply to the general population of healthcare workers. However, they completed the procedures in ordinary healthcare conditions and we assumed that they formed a part of the healthcare staff.
Among healthcare workers there is wide variation in skills, experience and working conditions that leads to a wide variation in NSI risk. For example, phlebotomists spend nearly all of their working hours drawing blood, and by repetition and practice will be more adept at this procedure than the average physician. At the same time their occupational exposure to needlestick injuries will also be higher than that of physicians due to the nature of their work. This variation can almost certainly lead to a difference in the rate of percutaneous exposure injuries. However, there was not enough variation in the included studies to assess this.
In the 2017 update of the review we found that there was low to moderate quality evidence that introduction of legislation on the use of safety‐engineered devices reduced the level of NSIs among healthcare workers.
Even though the number of studies increased from 17 to 24 in the 2017 update of this review, findings for various safety engineered devices remained largely unchanged from the original version of this review.
Quality of the evidence
We judged 20 of the 24 included studies to have a high risk of bias. The fact that we did find RCTs shows that rigorously controlled research methods can be used to evaluate the introduction of safety devices, especially in a cluster‐randomised design where hospital departments are randomised to the introduction of safety devices. Most of the often avoidable problems in study methodology like lack of randomisation (Table 3) might have been caused by the lack of involvement of professional research institutes.
With the exception of four studies, all included studies reported NSIs as their outcome. This outcome is problematic because these injuries are known to be under‐reported and are likely to increase with raised awareness, for example through an intervention study (Ratner 1994). This might explain the lack of effect in many studies, especially in the ITS studies. Nowadays, where the use of gloves with procedures that involve blood has increased, it would also be possible to use glove perforations as an outcome measure, which is less subject to reporting bias. Another problem with the NSI outcome is that the denominator varies across studies, with person‐years, employee productive hours, full time equivalents in some studies and 100,000 devices in others. We judged these all to be similar enough to be combined across studies because all these denominators reflect the hazard of needlestick injuries in a similar way, both in the intervention and the control group. There is most likely no single valid denominator for different purposes. It has been argued that for comparing hospitals the best denominator would be patient‐days, because of the accuracy and availability of the figures (Chen 2005).
Potential biases in the review process
We did not exclude studies published in languages other than English, but we found very few non‐English studies. Therefore, we are confident that there is no language bias in our review. We carried out all selection and data‐extraction processes in duplicate and involved a third assessor if we could not reach consensus easily.
The inclusion of non‐randomised studies further decreased the likelihood that we excluded important evidence. Because we analysed the non‐randomised studies separately, we believe that this has not introduced bias.
It was difficult to ascertain the validity of the outcome measures. Given the consistency of the results and the fact that the outcome was measured similarly in the intervention and control groups, we feel that this did not introduce bias. However, in some studies healthcare workers still had access to the conventional devices during the intervention period. Needlestick injuries caused by the conventional devices may have been misclassified as caused by safety devices, thus decreasing the effect of the intervention. The rate of needlestick injuries is a problematic outcome as attention to the problem has the potential to increase the rate of reporting thus nullifying the effect of the intervention. It could be that non‐significant results are due to this effect.
Agreements and disagreements with other studies or reviews
Several reviews have been published on prevention of percutaneous exposure injuries in the past years. Compared to earlier reviews (Hutin 2003; Rogers 2000), the number of studies has increased. Tuma 2006 reviewed the effect of safety engineered devices on percutaneous injuries, and reported that all 17 included studies reported a substantial decrease in injury rates. However, only five of these studies used a control group and the authors did not use meta‐analysis to combine results.
Harb 2015 reviewed the effect of safety‐engineered injection devices on the incidence of NSIs in healthcare delivery settings, and reported that there was moderate quality evidence that syringes with a sharps injury prevention feature reduced the incidence of needlestick injuries. The authors included uncontrolled before‐after studies which would normally be judged as having a high risk of bias. However, the authors arrived at the GRADE qualification moderate quality evidence for evidence based on uncontrolled before‐after studies. This is in disagreement with the GRADE guidance and our judgment of the quality of the available evidence.
Ballout 2016 reviewed the effect of safety‐engineered devices on the incidence of needlestick injuries during intravenous and phlebotomy procedures in healthcare settings. The authors included 21 NRS and one RCT and reported that there was moderate quality evidence that the use of safety‐engineered devices reduced the NSI rates of HCWs during phlebotomy and intravenous procedures. Here too the authors rated the evidence from uncontrolled before‐after studies as moderate quality which is in disagreement with the GRADE guidance and our judgment of the quality of the available evidence.
The HSE 2012 review states that there was low quality (SIGN level C) evidence that safety sharps devices lead to a reduction in sharps injuries and blood exposure for HCWs. However, even though the conclusion is more or less similar to our review, the HSE review included fewer studies and combined different types of interventions such as surgery needles and injection devices and the authors did not perform a meta‐analysis.
The review by Tarigan 2015 evaluated the effects of safety engineered devices combined with training and concluded that this intervention can substantially reduce the risk of NSIs. However, the authors included different study designs in one meta‐analysis and moreover analysed ITS studies as a simple before‐after comparison study which does not take into account trends over time.
Therefore we believe that the conclusions about the evidence put forth in this review are more realistic than in the other reviews mentioned above.

Study flow diagram for 2017 update

Risk of bias graph: review authors' judgements about each risk of bias item presented as percentages across all included studies.

Risk of bias summary: review authors' judgements about each risk of bias item for each included study.
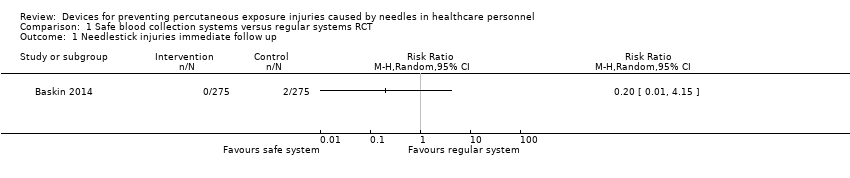
Comparison 1 Safe blood collection systems versus regular systems RCT, Outcome 1 Needlestick injuries immediate follow up.

Comparison 1 Safe blood collection systems versus regular systems RCT, Outcome 2 Blood splashes.
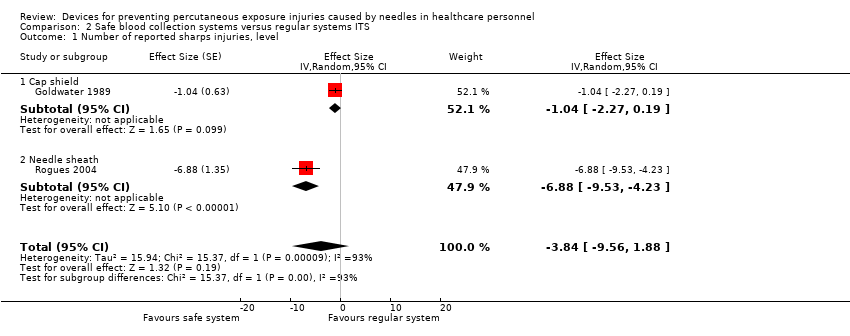
Comparison 2 Safe blood collection systems versus regular systems ITS, Outcome 1 Number of reported sharps injuries, level.

Comparison 2 Safe blood collection systems versus regular systems ITS, Outcome 2 Number of reported sharps injuries, slope.

Comparison 3 Safe intravenous systems versus regular systems RCT, Outcome 1 Needlestick injuries.

Comparison 3 Safe intravenous systems versus regular systems RCT, Outcome 2 Incidences of blood contamination.
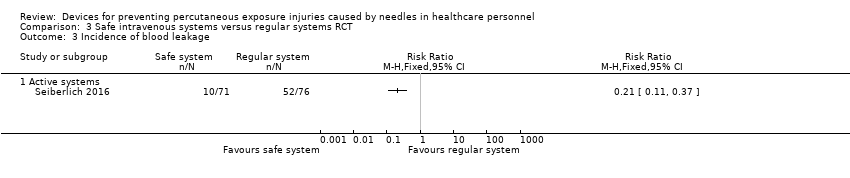
Comparison 3 Safe intravenous systems versus regular systems RCT, Outcome 3 Incidence of blood leakage.

Comparison 4 Safe intravenous systems versus regular systems CBA, Outcome 1 Number of needlestick injuries.
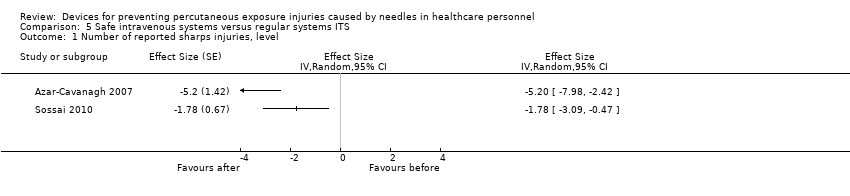
Comparison 5 Safe intravenous systems versus regular systems ITS, Outcome 1 Number of reported sharps injuries, level.

Comparison 5 Safe intravenous systems versus regular systems ITS, Outcome 2 Number of reported sharps injuries, slope.

Comparison 6 Safe injection systems versus regular systems RCT, Outcome 1 Questionnaire reported Needlestick injuries 6 mo follow up.

Comparison 6 Safe injection systems versus regular systems RCT, Outcome 2 Hospital reported Needlestick injuries 6 mo follow up.

Comparison 6 Safe injection systems versus regular systems RCT, Outcome 3 Questionnaire reported Needlestick injuries 12 mo follow up.

Comparison 6 Safe injection systems versus regular systems RCT, Outcome 4 Hospital reported Needlestick injuries 12 mo follow up.

Comparison 7 Safe injection systems versus regular systems CBA, Outcome 1 Needlestick injury rate.

Comparison 8 Safe passive injection systems versus safe active injection systems ITS, Outcome 1 change in level of needlestick injuries.

Comparison 8 Safe passive injection systems versus safe active injection systems ITS, Outcome 2 Change in slope of needlestick injuries.
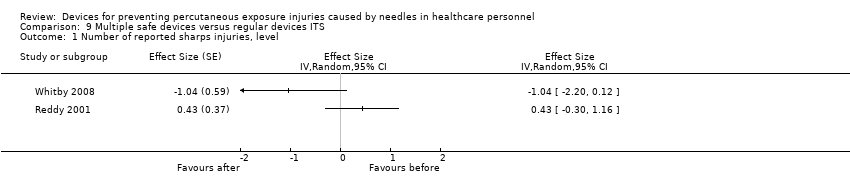
Comparison 9 Multiple safe devices versus regular devices ITS, Outcome 1 Number of reported sharps injuries, level.
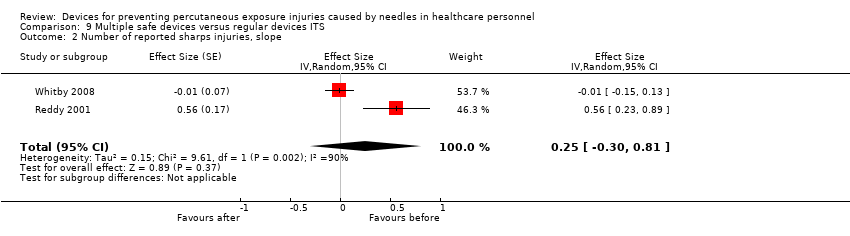
Comparison 9 Multiple safe devices versus regular devices ITS, Outcome 2 Number of reported sharps injuries, slope.
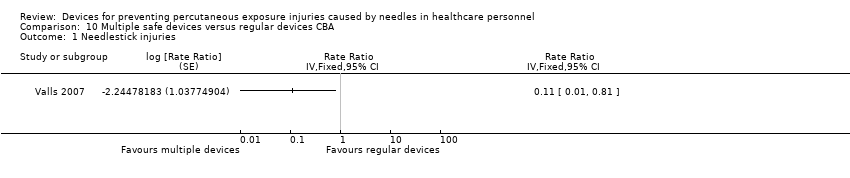
Comparison 10 Multiple safe devices versus regular devices CBA, Outcome 1 Needlestick injuries.
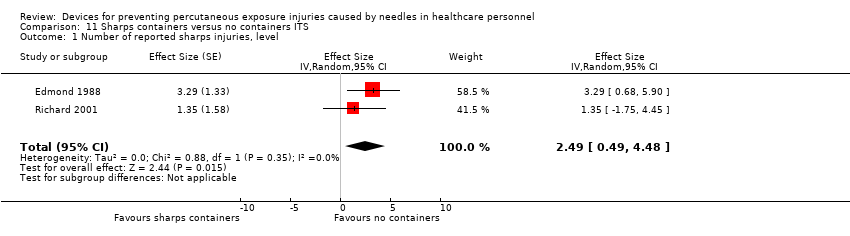
Comparison 11 Sharps containers versus no containers ITS, Outcome 1 Number of reported sharps injuries, level.

Comparison 11 Sharps containers versus no containers ITS, Outcome 2 Number of reported sharps injuries, slope.
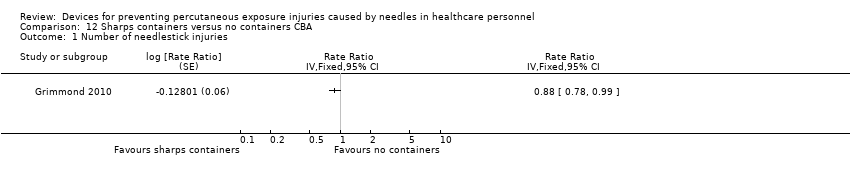
Comparison 12 Sharps containers versus no containers CBA, Outcome 1 Number of needlestick injuries.
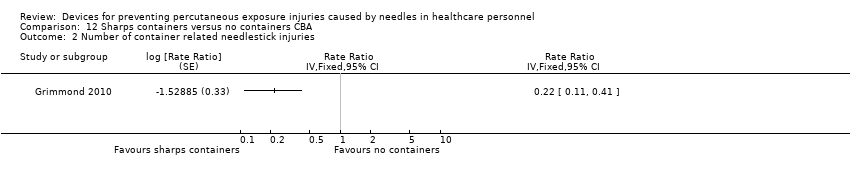
Comparison 12 Sharps containers versus no containers CBA, Outcome 2 Number of container related needlestick injuries.

Comparison 13 Legislation versus no legislation ITS, Outcome 1 NSI‐ change in level.
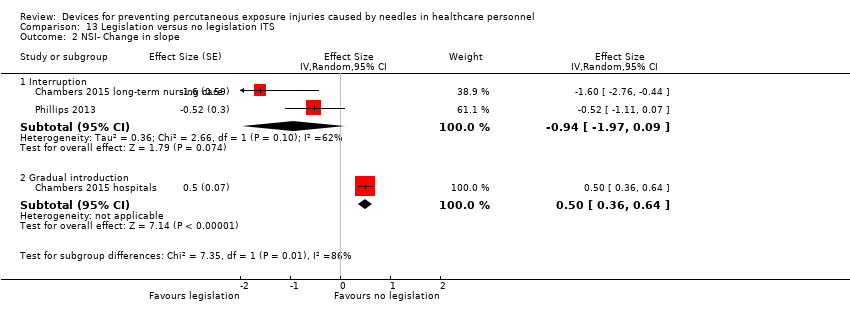
Comparison 13 Legislation versus no legislation ITS, Outcome 2 NSI‐ Change in slope.
| Safe blood collection systems compared to regular systems for preventing percutaneous exposure injuries caused by needles in healthcare personnel (RCTs) | ||||||
| Patient or population: preventing percutaneous exposure injuries caused by needles in healthcare personnel (RCTs) | ||||||
| Outcomes | Anticipated absolute effects* (95% CI) | Relative effect | № of participants | Quality of the evidence | Comments | |
| Risk with regular systems | Risk with Safe blood collection systems | |||||
| Needlestick injuries immediate follow up | Study population | RR 0.20 | 550 | ⊕⊝⊝⊝ | ||
| 7 per 1 000 | 1 per 1 000 | |||||
| Blood splashes | Study population | RR 0.14 | 550 | ⊕⊝⊝⊝ | ||
| 25 per 1 000 | 4 per 1 000 | |||||
| *The risk in the intervention group (and its 95% confidence interval) is based on the assumed risk in the comparison group and the relative effect of the intervention (and its 95% CI). | ||||||
| GRADE Working Group grades of evidence | ||||||
| 1 We downgraded the quality of evidence by one level due to risk of bias (selection bias, performance bias and detection bias). | ||||||
| Safe blood collection systems compared to regular systems for preventing percutaneous exposure injuries caused by needles in healthcare personnel (ITS) | |||
| Patient or population: preventing percutaneous exposure injuries caused by needles in healthcare personnel (ITS) | |||
| Outcomes | Impact | № of participants | Quality of the evidence |
| Number of reported sharps injuries, level ‐ reported seperately for needle sheath and cap shield studies | Needle sheath study: effect size ‐6.88; confidence interval ‐9.53 to ‐4.23. Cap shield study: effect size ‐1.04; confidence interval ‐2.27 to 0.19. | (2 observational studies) | ⊕⊝⊝⊝ |
| Number of reported sharps injuries, slope ‐ reported seperately for needle sheath and cap shield studies | Needle sheath study: effect size ‐1.19; confidence interval ‐2.50 to 0.12. Cap shield study: effect size ‐1.00; confidence interval ‐2.22 to ‐0.22. | (2 observational studies) | ⊕⊝⊝⊝ |
| Interpretation of effect size: small (0‐0.2) medium (0.2‐0.5) large (0.6 and above), an effect size with negative sign implies decrease and positive sign implies increase of effect. | |||
| GRADE Working Group grades of evidence | |||
| 1 We downgraded the quality of evidence by two levels due to heterogeneity (I² = 93%). | |||
| Safe intravenous systems compared to regular systems RCT for preventing percutaneous exposure injuries caused by needles in healthcare personnel | ||||||
| Patient or population: preventing percutaneous exposure injuries caused by needles in healthcare personnel | ||||||
| Outcomes | Anticipated absolute effects* (95% CI) | Relative effect | № of participants | Quality of the evidence | Comments | |
| Risk with regular systems RCT | Risk with Safe intravenous systems | |||||
| Needlestick injuries | Study population | Rate ratio 0.62 | (1 RCT, three arms) | ⊕⊝⊝⊝ | Calculated based on 1000 patient days | |
| 0.71 per 1 000 | 0.44 per 1 000 | |||||
| Incidences of blood contamination ‐ Active systems | Study population | RR 1.60 | 961 | ⊕⊕⊝⊝ | ||
| 92 per 1 000 | 148 per 1 000 | |||||
| Incidences of blood contamination ‐ Passive systems | Study population | RR 0.94 | 528 | ⊕⊕⊝⊝ | ||
| 79 per 1 000 | 74 per 1 000 | |||||
| Incidence of blood leakage ‐ Active systems | Study population | RR 0.21 | 147 | ⊕⊕⊝⊝ | ||
| 684 per 1 000 | 144 per 1 000 | |||||
| *The risk in the intervention group (and its 95% confidence interval) is based on the assumed risk in the comparison group and the relative effect of the intervention (and its 95% CI). | ||||||
| GRADE Working Group grades of evidence | ||||||
| 1 We downgraded the quality of evidence by two levels due to risk of bias (serious attrition). | ||||||
| Safe intravenous systems compared to regular systems CBA for preventing percutaneous exposure injuries caused by needles in healthcare personnel | ||||||
| Patient or population: preventing percutaneous exposure injuries caused by needles in healthcare personnel | ||||||
| Outcomes | Anticipated absolute effects* (95% CI) | Relative effect | № of participants | Quality of the evidence | Comments | |
| Risk with regular systems CBA | Risk with Safe intravenous systems | |||||
| Number of needlestick injuries | Study population | Rate ratio 0.06 | (1 observational study) | ⊕⊝⊝⊝ | ||
| 36.36 per 1 000 | 2.18 per 1 000 | |||||
| *The risk in the intervention group (and its 95% confidence interval) is based on the assumed risk in the comparison group and the relative effect of the intervention (and its 95% CI). | ||||||
| GRADE Working Group grades of evidence | ||||||
| 1 We downgraded the quality of evidence by two levels due to risk of bias (no random sequence generation or allocation concealment). | ||||||
| Safe intravenous systems compared to regular systems ITS for preventing percutaneous exposure injuries caused by needles in healthcare personnel | |||
| Patient or population: preventing percutaneous exposure injuries caused by needles in healthcare personnel | |||
| Outcomes | Impact | № of participants | Quality of the evidence |
| Number of reported sharps injuries, level | Study 1: effect size ‐5.20; confidence interval ‐7.98 to ‐2.42. Study 2: effect size ‐1.78; confidence interval ‐3.09 to ‐0.47. | (2 observational studies) | ⊕⊝⊝⊝ |
| Number of reported sharps injuries, slope | Study 1: Effect size ‐7.86; confidence interval ‐9.13 to ‐6.59. Study 2: Effect size 0.35; confidence interval ‐0.20 to 0.90. | (2 observational studies) | ⊕⊝⊝⊝ |
| Interpretation of effect size: small (0‐0.2) medium (0.2‐0.5) large (0.6 and above), a effect size with negative sign implies decrease and positive sign implies increase of effect. | |||
| GRADE Working Group grades of evidence | |||
| 1 We downgraded the quality of evidence by one level due to risk of bias caused by lacking intervention fidelity (in the second study conventional devices were used during intervention period). | |||
| Safe injection systems compared to regular systems RCT for preventing percutaneous exposure injuries caused by needles in healthcare personnel | ||||||
| Patient or population: preventing percutaneous exposure injuries caused by needles in healthcare personnel | ||||||
| Outcomes | Anticipated absolute effects* (95% CI) | Relative effect | № of participants | Quality of the evidence | Comments | |
| Risk with regular systems RCT | Risk with Safe injection systems | |||||
| Questionnaire reported Needlestick injuries 6 mo follow up | Study population | RR 0.42 | 154 | ⊕⊝⊝⊝ | ||
| 140 per 1 000 | 59 per 1 000 | |||||
| Questionnaire reported Needlestick injuries 12 mo follow up | Study population | OR 0.20 | 144 | ⊕⊝⊝⊝ | ||
| 119 per 1 000 | 26 per 1 000 | |||||
| Hospital reported Needlestick injuries 6 mo follow up | Study population | OR 1.20 | 533 | ⊕⊝⊝⊝ | ||
| 38 per 1 000 | 45 per 1 000 | |||||
| Hospital reported Needlestick injuries 12 mo follow up | Study population | OR 0.72 | 533 | ⊕⊝⊝⊝ | ||
| 41 per 1 000 | 30 per 1 000 | |||||
| *The risk in the intervention group (and its 95% confidence interval) is based on the assumed risk in the comparison group and the relative effect of the intervention (and its 95% CI). | ||||||
| GRADE Working Group grades of evidence | ||||||
| 1 We downgraded the quality of evidence by two levels due to risk of bias (high attrition). | ||||||
| Safe injection systems compared to regular systems CBA for preventing percutaneous exposure injuries caused by needles in healthcare personnel | ||||||
| Patient or population: preventing percutaneous exposure injuries caused by needles in healthcare personnel | ||||||
| Outcomes | Anticipated absolute effects* (95% CI) | Relative effect | № of participants | Quality of the evidence | Comments | |
| Risk with regular systems CBA | Risk with Safe injection systems | |||||
| Needlestick injury rate | Study population | Rate ratio 0.34 | (1 observational study) | ⊕⊝⊝⊝ | Calculated based on 1000 person years | |
| 236 per 1 000 | 80.24 per 1 000 | |||||
| *The risk in the intervention group (and its 95% confidence interval) is based on the assumed risk in the comparison group and the relative effect of the intervention (and its 95% CI). | ||||||
| GRADE Working Group grades of evidence | ||||||
| 1 We downgraded the quality of evidence by two levels due to risk of bias (no random sequence generation or allocation concealment). | ||||||
| Safe passive injection systems compared to safe active injection systems ITS for preventing percutaneous exposure injuries caused by needles in healthcare personnel | |||
| Patient or population: preventing percutaneous exposure injuries caused by needles in healthcare personnel | |||
| Outcomes | Impact | № of participants | Quality of the evidence |
| Change in level of needlestick injuries | Effect size 0.23; confidence interval ‐1.89 to 2.35. | (1 observational study) | ⊕⊝⊝⊝ |
| Change in slope of needlestick injuries | Effect size ‐0.74; confidence interval ‐1.66 to 0.18. | (1 observational study) | ⊕⊕⊝⊝ |
| Interpretation of effect size: small (0‐0.2) medium (0.2‐0.5) large (0.6 and above), a effect size with negative sign implies decrease and positive sign implies increase of effect. | |||
| GRADE Working Group grades of evidence | |||
| 1 We downgraded the quality of evidence by one level due to imprecision (wide confidence interval). | |||
| Multiple safe devices compared to regular devices ITS for preventing percutaneous exposure injuries caused by needles in healthcare personnel | |||
| Patient or population: preventing percutaneous exposure injuries caused by needles in healthcare personnel | |||
| Outcomes | Impact | № of participants | Quality of the evidence |
| Number of reported sharps injuries, level | Study 1: effect size ‐1.04; confidence interval ‐2.20 to 0.12. Study 2: effect size 0.43; confidence interval ‐0.30 to 1.16. | (2 observational studies) | ⊕⊝⊝⊝ |
| Number of reported sharps injuries, slope | Study 1: effect size ‐0.01; confidence interval ‐0.15 to 0.13. Study 2: effect size 0.56; confidence interval 0.23 to 0.89. | (2 observational studies) | ⊕⊝⊝⊝ |
| Interpretation of effect size: small (0‐0.2) medium (0.2‐0.5) large (0.6 and above), a effect size with negative sign implies decrease and positive sign implies increase of effect. | |||
| GRADE Working Group grades of evidence | |||
| 1 We downgraded the quality of evidence by one level due to risk of bias (One study had a low risk of bias but the other study had a high risk as conventional devices were still available after the intervention began). | |||
| Multiple safe devices compared to regular devices CBA for preventing percutaneous exposure injuries caused by needles in healthcare personnel | ||||||
| Patient or population: preventing percutaneous exposure injuries caused by needles in healthcare personnel | ||||||
| Outcomes | Anticipated absolute effects* (95% CI) | Relative effect | № of participants | Quality of the evidence | Comments | |
| Risk with regular devices CBA | Risk with Multiple safe devices | |||||
| Needle stick injuries | Study population | Rate ratio 0.11 | (1 observational study) | ⊕⊝⊝⊝ | Calculated based on 1000 patient days | |
| 0.44 per 1 000 | 0.052 per 1 000 | |||||
| *The risk in the intervention group (and its 95% confidence interval) is based on the assumed risk in the comparison group and the relative effect of the intervention (and its 95% CI). | ||||||
| GRADE Working Group grades of evidence | ||||||
| 1 We downgraded the quality of evidence by two levels due to risk of bias (no random sequence generation or allocation concealment). | ||||||
| Sharps containers compared to no containers ITS for preventing percutaneous exposure injuries caused by needles in healthcare personnel | |||
| Patient or population: preventing percutaneous exposure injuries caused by needles in healthcare personnel | |||
| Outcomes | Impact | № of participants | Quality of the evidence |
| Number of reported sharps injuries, level | Study 1: effect size 3.29; confidence interval 0.68 to 5.90. Study 2: effect size 1.35; confidence interval ‐1.75 to 4.45. | (2 observational studies) | ⊕⊝⊝⊝ |
| Number of reported sharps injuries, slope | Study 1: effect size 0.02; confidence interval ‐1.06 to 1.10. Study 2: effect size 2.55; confidence interval 1.20 to 3.90. | (2 observational studies) | ⊕⊝⊝⊝ |
| Interpretation of effect size: small (0‐0.2) medium (0.2‐0.5) large (0.6 and above), a effect size with negative sign implies decrease and positive sign implies increase of effect. | |||
| GRADE Working Group grades of evidence | |||
| 1 We downgraded the quality of evidence by one level due to inconsistency (study 2 showed an increase in reporting). | |||
| Sharps containers compared to no containers CBA for preventing percutaneous exposure injuries caused by needles in healthcare personnel | ||||||
| Patient or population: preventing percutaneous exposure injuries caused by needles in healthcare personnel | ||||||
| Outcomes | Anticipated absolute effects* (95% CI) | Relative effect | № of participants | Quality of the evidence | Comments | |
| Risk with no containers CBA | Risk with Sharps containers | |||||
| Number of needlestick injuries | Study population | Rate ratio 0.88 | (1 observational study) | ⊕⊝⊝⊝ | ||
| 28.3 per 1 000 | 24.9 per 1 000 | |||||
| Number of container related needlestick injuries | Study population | Rate ratio 0.22 | (1 observational study) | ⊕⊝⊝⊝ | ||
| 2.6 per 1 000 | 0.6 per 1 000 | |||||
| *The risk in the intervention group (and its 95% confidence interval) is based on the assumed risk in the comparison group and the relative effect of the intervention (and its 95% CI). | ||||||
| GRADE Working Group grades of evidence | ||||||
| 1 We downgraded the quality of evidence by two levels due to risk of bias (no random sequence generation or allocation concealment). | ||||||
| Legislation compared to no legislation ITS for preventing percutaneous exposure injuries caused by needles in healthcare personnel | |||
| Patient or population: preventing percutaneous exposure injuries caused by needles in healthcare personnel | |||
| Outcomes | Impact | № of participants | Quality of the evidence |
| NSI‐ change in level ‐ Interruption | Effect size ‐6.15; confidence interval ‐7.76 to ‐4.54. | (2 observational studies) | ⊕⊕⊕⊝ |
| NSI‐ change in level ‐ Gradual introduction | Effect size 0.80; confidence interval 0.41 to 1.19. | (1 observational study) | ⊕⊕⊝⊝ |
| NSI‐ Change in slope ‐ Interruption | Effect size ‐0.94; confidence interval ‐1.97 to 0.09 | (2 observational studies) | ⊕⊝⊝⊝ |
| NSI‐ Change in slope ‐ Gradual introduction | Effect size 0.50; confidence interval 0.36 to 0.64 | (1 observational study) | ⊕⊕⊝⊝ |
| Interpretation of effect size: small (0‐0.2) medium (0.2‐0.5) large (0.6 and above), a effect size with negative sign implies decrease and positive sign implies increase of effect. | |||
| GRADE Working Group grades of evidence | |||
| 1 We downgraded the quality of evidence by one level due to risk of bias (dataset did not represent the whole sample). | |||
| Study name | Device Commercial Names | Device Category | Safety Device type | passive/ active | For sale? |
| Asai 1999 active | Insyte AutoGuard intravenous cannula | Safe IV system (insertion) | button for actively retracting the needle | active | Yes |
| Asai 2002 active | Insyte Autoguard intravenous cannula | Safe IV system (insertion) | button for actively retracting the needle | active | Yes |
| Asai 2002 passive | Protective Acuvance | Safe IV system (insertion) | automated retraction of needle | passive | Yes |
| Azar‐Cavanagh 2007 | Unnamed intravenous catheter stylet | Safe IV system (insertion) | retractable protection shield | active? | ? |
| Baskin 2014 | BD Eclipse injector 3‐mL, BD preset syringe with BD Luer‐Lok tip 25G×1 | Blood collection | cannula protection shield is activated with one hand after puncture and clicks irreversibly over the cannula | active | Yes |
| Chambers 2015 hospitals | not reported | Multiple safe devices | safety engineered needles and needleless devices | passive or semi‐automatic | ? |
| Chambers 2015 long‐term nursing care | nor reported | Multiple safe devices | safety engineered needles and needleless devices | passive or semi‐automatic | ? |
| Cote 2003 | Angiocath Autoguard IV catheters | Safe IV system (insertion) | button for actively retracting the needle | active | Yes |
| Edmond 1988 | Winfield sharpsguard | Sharps container | bedside sharps container | n.a. | No |
| Gaballah 2010 | Unnamed safety dental syringes | Injection system | does not require re‐sheating or removal of the needle from its syringe | passive? | ? |
| Goldwater 1989 | Needle guard Biosafe New Zealand | Blood collection | shield on cap prevents injury while recapping | n.a. | No |
| Goris 2015 | Unnamed safety engineered passive retractable syringes | Injection system | automatically and instantly retracts the needle from the patient into the barrel of the syringe | passive | ? |
| Grimmond 2010 | Daniels sharpsmart | Sharps container | bedside sharps container | n.a. | Yes |
| L'Ecuyer 1996 2wva | 2‐way valve Safsite Braun medical | Safe IV system (insertion and needleless) | two valve system with plastic sharp that remains in the device | passive | Yes |
| L'Ecuyer 1996 mbc | Lifeshield metal blunt cannula | Safe IV system (needleless iv system) | metal blunt cannula | passive | Yes |
| L'Ecuyer 1996 pbc | Interlink PBC plastic cannula | Safe IV system (insertion and needleless) | plastic sharp covered by blunt plastic cannula | passive | Yes |
| Mendelson 1998 | 1‐valve Safsite Braun medical | Safe IV system (needleless) | valve of IV system incompatible with needle | passive | Yes |
| Phillips 2013 | safety engineered sharps | Multiple safe devices | not explained | ? | ? |
| Prunet 2008 active | Insyte Autoguard intravenous cannula | Safe IV system (insertion) | button for actively retracting the needle | active | Yes |
| Prunet 2008 passive | Introcan Safety IV system (Braun) | Safe IV system (insertion) | automatic shield on needle tip at withdrawing | passive | Yes |
| Reddy 2001 | 'safety syringes and needleless IV' | Multiple safe devices | not explained | ? | ? |
| Richard 2001 | 'sharps containers' | Sharps container | first in treatment rooms later bedside placements | ? | ? |
| Rogues 2004 | SafetyLock BD, resheathable winged steel needle | Blood collection | after pushing (two handed) needle retracts into sheath | active | Yes |
| Seiberlich 2016 | ViaValve safety I.V. catheter | Safe IV system (insertion) | contains a valve that is designed to restrict blood flow back out of the catheter hub upon initial venipuncture | active | Yes |
| Sossai 2010 | Introcan safety IV system (Braun) | Safe IV system (insertion) | automatic shield on needle tip at withdrawing | passive | Yes |
| Valls 2007 | Eclipse BD; Saf‐T‐ E‐Z Set, BD; Surshield, Terumo; Preserts BD; Provent plus, Smiths; Genie BD; Surgilance Terumo; Blunt administration needles BD | Multiple systems | n.a. | active and passive | Yes |
| van der Molen 2011 | Eclipse BD | Injection system | after injection needle covered with shield | active | Yes |
| Whitby 2008 | VanishPoint; VanishPoint blood tube holders; BD Safety‐Lok; SmartSite needle‐free system; Smartsite Plus | Multiple systems | retractable syringes, needle‐free IV systems and safety winged butterfly needles. | passive | Yes |
| Zakrzweska 2001 | Safety Plus Septodont (Dental injections) | Injection system | Protective sheaths can be temporarily or definitely protect the needle | active | Yes |
| Study | Intervention independent of other changes | Sufficient data points | Test for trend | Intervention did not affect data collection | Blinded outcome assessment | Complete data set | Reliable outcome measure | Total score |
| Goldwater 1989 | Not done (0) Comment: staff turnover during study period. Staff preference for the use of the intervention devices varied across study periods. | Done (1) Comment: inlcusion of 3 data points before and after, the study was reanalysed using ARIMA model. | Done (1) Comment: we reanalysed the study for trend. | Done (1) Data collection seems to remained the same pre and post‐intervention. | Not clear (0) Authors do not provide information on blinding. | Done (1) | Not clear (0): Comment: no system for NSI seems to have been in placed during the study period. Uncertain about the consistency of the reporting during the study period. | 4 |
| Rogues 2004 | Done (1) Quote: "Conventional phlebotomy non‐safety devices were removed from all departments, and the new products were in place on implementation" Comment: only one device seems to have been introduced during intervention but authors do not specify if additional changes occurred during the study. | Done (1) Comment: inlcusion of 3 data points before and after, the study was reanalysed using ARIMA model. | Done (1) Comment: we reanalysed the study for trend. | Done (1) Comment: the method of data collection remains the same throughout the study. It does not appears to be influenced by the intervention. | Not clear (0) Comment No information is available on blinding. | Not done (0) Comment: data not available for the estimated number of phlebotomies performed for 1993 and 1994. | Done (1) Comment: hospital has a sharp injury surveillance system prior and after intervention. Althought not ideal as possibility of underreporting but appropriate for the study outcome. | 5 |
| Reddy 2001 | Not done (0) Quote: one of the confounder present throughout the post intervention phase was the availability of traditional needles devices. Comment: intervention occurs simultaneously with the availability of non‐safety device. | Done (1) Comment: inlcusion of 3 data points before and after, the study was reanalysed using ARIMA model. | Done (1) Comment: we reanalysed the study for trend. | Done (1) Comment: the method of data collection remains the same throughout the study. It does not appears to be influenced by the intervention. | Not clear (0) Comment: no information available on blinding | Not done (0) Comment: physicians were excluded from analysis as no information on FTE. | Done (1) Comment: hospital had a sharp injury surveillance system prior and after intervention. Althought no ideal as possibility of underreporting but appropriate for the study outcome. | 4 |
| Azar‐Cavanagh 2007 | Done (1) Comment: safety devices seem to have systematically replaced the conventional devices. Authors do not specify if additional changes occurred during the study. | Done (1) Comment: inlcusion of 3 data points before and after, the study was reanalysed using ARIMA model. | Done (1) Comment: we reanalysed the study for trend. | Done (1) Comment: the method of data collection remains the same throughout the study. It does not appears to be influenced by the intervention. | Not clear (0) Comment: authors do not specify if data analysts were blinded to the study. Healthcare workers could not have been blinded to the introduction of the new devices. | Done (1) Comment: data is available for all health workers. | Done (1) Coment: | 6 |
| Sosai 2010 | Not done (0) Comment: authors indicated that some conventional devices were still used during the intervention period despite study which aimed to replace all conventional devices by new safety devices. | Done (1) comment: inlcusion of 3 data points before and after, the study was reanalysed using ARIMA model. | Done (1) Comment: we reanalysed the study for trend. | Not done (0) Quote: "after launching the sharps awareness campaign in 2003, # of injuries increased possibility because of sharps awareness campaign" Comment: intervention seems to have affected reporting of NSI. | Not clear (0) Comment: information on blinding is not reported. | Done (1) Comment: all hospital employees were included in the study. | Done (1) Comment: used the incident reporting system throughout the study which appears to be adequate measure for NSI. | 4 |
| Edmond 1988 | Not clear (0) Comment: no information if additional changes were introduced during the same period at the hospital. | Done (1) Comment: inlcusion of 3 data points before and after, the study was reanalysed using ARIMA model. | Done (1) Comment: we reanalysed the study for trend. | Done (1) Comment: intervention does not appears to have affected method of data collection. | Not clear (0) Quote: "the subjects were unaware of the nature of the study". Comment: the reporting of the NSI was not likely to be affected by the staff knowing of the study. However, health workers would be aware of the change in the type of devices used. | Not clear (0) Comment: information about the number of nurses for pre‐intervention but not for post‐intervention. For NSI, the number of staff per year is not available. | Done (1) Comment: authors used employee health records for pre and post intervention. For NSI, this system appears reliable for the outcome of interest. | 4 |
| Richard 2001 | Not clear (0) Comment: no information if additional changes were introduced during the same period at the hospital. | Done (1) Comment: inlcusion of 3 data points before and after, the study was reanalysed using ARIMA model. | Done (1) Comment: we reanalysed the study for trend. | Not done (0) Quote: the increase in total injuries reported in 1998 followed a better reporting stimulated by the second educational program. Comment: the reporting system started in 1993, it is possible that as more people became aware of the surveillance system, there was an increase in reporting. | Not clear (0) Comment: No information is available on blinding | Not clear (0) Comment: no information on the actual number of healthcare workers included during pre and post intervention. | Not clear (0) Comment: it is unclear if the reporting system was used consistently throughout the years especially as it was launched during the early phase of the study. | 2 |
| Chambers 2015 hospitals | Done (1) Comment: safety devices seem to have replaced the conventional devices due to legislation. | Done (1) Comment: inlcusion of 3 data points before and after, the study was reanalysed using ARIMA model. | Done (1) Comment: we reanalysed the study for trend. | Not clear (0) Comment: Increased attention to needle stick injury prevention during the period of regulatory change may have resulted in increased reporting. | Done (1) Comment: data was obtained from an administrative source. | Not done (0) Comment: the data set represented 63 percent of all needlestick injury claims. | Done (1) Comment: authors used work place safety and insurance board data for compensation claims. For NSI, this system appears reliable for the outcome of interest. | 5 |
| Chambers 2015 long‐term nursing care | Done (1) Comment: safety devices seem to have replaced the conventional devices due to legislation. | Done (1) Comment: inlcusion of 3 data points before and after, the study was reanalysed using ARIMA model. | Done (1) Comment: we reanalysed the study for trend. | Not clear (0) Comment: Increased attention to needle stick injury prevention during the period of regulatory change may have resulted in increased reporting. | Done (1) Comment: data was obtained from an administrative source. | Not done (0) Comment: the data set represented 63 percent of all needlestick injury claims. | Done (1) Comment: authors used work place safety and insurance board data for compensation claims. For NSI, this system appears reliable for the outcome of interest. | 5 |
| Goris 2015 | Done (1) Quote: "The existing inventories of subcutaneous active safety‐engineered devices were removed and replaced with subcutaneous passive safety‐engineered devices" Comment: All conventional devices were replaced by safety‐engineered devices at the start of the intervention. | Done (1) Comment: inlcusion of 3 data points before and after, the study was reanalysed using ARIMA model. | Done (1) Comment: we reanalysed the study for trend. | Not clear (0) Comment: the reporting might have increased after inrodcution of the passive safety‐engineered device due to heightened awareness. | Done (1) Comment: data was obtained from an administrative source. | Done (1) Comment: data for all the healthcare workers was provided in the form of employee productive hours in the pre and post intervention phase. | Done(1) Comment: authors used BJC occupational health database records for pre and post intervention. This being administrative data appears to be reliable for the outcome of interest. | 6 |
| Phillips 2013 | Done (1) Comment: safety devices seem to have replaced the conventional devices due to legislation. | Done (1) Comment: inlcusion of 3 data points before and after, the study was reanalysed using ARIMA model. | Done (1) Comment: we reanalysed the study for trend. | Not clear (0) | Done (1) Comment: data was obtained from an administrative source. | Not done (0) Comment: Data set represented only 73% of the total sample. | Done (1) Comment: Data was obtained from the US Exposure Prevention Information Network (EPINet) sharps injury surveillance database. This appears to be adequate measure for NSIs. | 5 |
| Whitby 2008 | Not clear (0) | Done (1) Comment: inlcusion of 3 data points before and after, the study was reanalysed using ARIMA model. | Done (1) Comment: we reanalysed the study for trend. | Done (1) Comment: the constant and unchanging rate of NSI with solid suture needles implies that reduction of NSI relates neither to the education program associated or increased reporting rates. | Not done (0) Comment: health workers were aware of the change in the type of devices used. | Done (1) Comment: data is available for all health workers. | Done (1) Comment: used the same system of reporting of NSI in pre and post intervention period to the infectious diseases department which has been in place since 1996. | 5 |
| Comparison and outcome | Starting level | Risk of bias | Consistency | Directness | Precision | Publication bias | Quality of evidence |
| Safe versus traditional blood collection systems RCT ‐ all outcomes | high | 1 RCT high RoB | consistent | direct | wide CI | impossible to determine | very low |
| Safe versus traditional blood collection systems ITS | low | 2 ITS high RoB | consistent | direct | wide CI | impossible to determine | very low |
| Safe versus traditional IV systems RCT ‐ all outcomes | high | 5 RCT high RoB, 1 RCT low RoB | consistent | direct | wide CI | impossible to determine | very low |
| Safe versus traditional IV systems CBA | low | 1 CBA high RoB | consistent | direct | wide CI | impossible to determine | very low |
| Safe versus traditional IV systems ITS | low | 1 ITS low RoB, 1 ITS high RoB | consistent | direct | wide CI | impossible to determine | very low |
| Safe versus traditional injection systems RCT | high | 1 RCT high RoB | consistent | indirect; hospital | wide CI | impossible to determine | very low |
| Safe versus traditional injection systems CBA | low | 1 CBA high RoB | consistent | indirect; dentists | wdie CI | impossible to determine | very low |
| Safe pasive injection systems versus safe active injection systems ITS | low | 1 ITS low RoB | consistent | direct | wide CI | impossible to determine | very low |
| Multiple safe versus traditional devices ITS | low | 2 ITS high RoB | inconsistent | direct | wide CI | impossible to determine | very low |
| Multiple safe versus traditional devices CBA | low | 1 CBA high RoB | consistent | direct | wide CI | impossible to determine | very low |
| Sharps containers versus no containers ITS | low | 1 ITS low RoB, 1 ITS high RoB | inconsistent | direct | wide CI | impossible to determine | very low |
| Sharps containers versus no containers CBA ‐ all outcomes | low | 1 CBA high RoB | consistent | direct | wide CI | impossible to determine | very low |
| Legislation versus no legislation ITS | low | 2 ITS high RoB | consistent | direct | wide CI | impossible to determine | low |
| Outcome or subgroup title | No. of studies | No. of participants | Statistical method | Effect size |
| 1 Needlestick injuries immediate follow up Show forest plot | 1 | Risk Ratio (M‐H, Random, 95% CI) | Totals not selected | |
| 2 Blood splashes Show forest plot | 1 | Risk Ratio (M‐H, Random, 95% CI) | Totals not selected | |
| Outcome or subgroup title | No. of studies | No. of participants | Statistical method | Effect size |
| 1 Number of reported sharps injuries, level Show forest plot | 2 | Effect Size (Random, 95% CI) | ‐3.84 [‐9.56, 1.88] | |
| 1.1 Cap shield | 1 | Effect Size (Random, 95% CI) | ‐1.04 [‐2.27, 0.19] | |
| 1.2 Needle sheath | 1 | Effect Size (Random, 95% CI) | ‐6.88 [‐9.53, ‐4.23] | |
| 2 Number of reported sharps injuries, slope Show forest plot | 2 | Effect Size (Fixed, 95% CI) | Totals not selected | |
| 2.1 Cap shield | 1 | Effect Size (Fixed, 95% CI) | 0.0 [0.0, 0.0] | |
| 2.2 Needle sheath | 1 | Effect Size (Fixed, 95% CI) | 0.0 [0.0, 0.0] | |
| Outcome or subgroup title | No. of studies | No. of participants | Statistical method | Effect size |
| 1 Needlestick injuries Show forest plot | 3 | Rate Ratio (Fixed, 95% CI) | 0.62 [0.27, 1.41] | |
| 2 Incidences of blood contamination Show forest plot | 6 | 1489 | Risk Ratio (M‐H, Fixed, 95% CI) | 1.38 [1.00, 1.92] |
| 2.1 Active systems | 4 | 961 | Risk Ratio (M‐H, Fixed, 95% CI) | 1.60 [1.08, 2.36] |
| 2.2 Passive systems | 2 | 528 | Risk Ratio (M‐H, Fixed, 95% CI) | 0.94 [0.50, 1.75] |
| 3 Incidence of blood leakage Show forest plot | 1 | Risk Ratio (M‐H, Fixed, 95% CI) | Totals not selected | |
| 3.1 Active systems | 1 | Risk Ratio (M‐H, Fixed, 95% CI) | 0.0 [0.0, 0.0] | |
| Outcome or subgroup title | No. of studies | No. of participants | Statistical method | Effect size |
| 1 Number of needlestick injuries Show forest plot | 1 | Rate Ratio (Fixed, 95% CI) | Totals not selected | |
| Outcome or subgroup title | No. of studies | No. of participants | Statistical method | Effect size |
| 1 Number of reported sharps injuries, level Show forest plot | 2 | Effect Size (Random, 95% CI) | Totals not selected | |
| 2 Number of reported sharps injuries, slope Show forest plot | 2 | Effect Size (Random, 95% CI) | Totals not selected | |
| Outcome or subgroup title | No. of studies | No. of participants | Statistical method | Effect size |
| 1 Questionnaire reported Needlestick injuries 6 mo follow up Show forest plot | 1 | Risk Ratio (M‐H, Fixed, 95% CI) | Totals not selected | |
| 2 Hospital reported Needlestick injuries 6 mo follow up Show forest plot | 1 | Odds Ratio (M‐H, Fixed, 95% CI) | Totals not selected | |
| 3 Questionnaire reported Needlestick injuries 12 mo follow up Show forest plot | 1 | Odds Ratio (M‐H, Fixed, 95% CI) | Totals not selected | |
| 4 Hospital reported Needlestick injuries 12 mo follow up Show forest plot | 1 | Odds Ratio (M‐H, Fixed, 95% CI) | Totals not selected | |
| Outcome or subgroup title | No. of studies | No. of participants | Statistical method | Effect size |
| 1 Needlestick injury rate Show forest plot | 1 | Rate Ratio (Fixed, 95% CI) | Totals not selected | |
| Outcome or subgroup title | No. of studies | No. of participants | Statistical method | Effect size |
| 1 change in level of needlestick injuries Show forest plot | 1 | Effect size (Random, 95% CI) | Totals not selected | |
| 2 Change in slope of needlestick injuries Show forest plot | 1 | Effect Size (Random, 95% CI) | Totals not selected | |
| Outcome or subgroup title | No. of studies | No. of participants | Statistical method | Effect size |
| 1 Number of reported sharps injuries, level Show forest plot | 2 | Effect Size (Random, 95% CI) | Totals not selected | |
| 2 Number of reported sharps injuries, slope Show forest plot | 2 | Effect Size (Random, 95% CI) | 0.25 [‐0.30, 0.81] | |
| Outcome or subgroup title | No. of studies | No. of participants | Statistical method | Effect size |
| 1 Needlestick injuries Show forest plot | 1 | Rate Ratio (Fixed, 95% CI) | Totals not selected | |
| Outcome or subgroup title | No. of studies | No. of participants | Statistical method | Effect size |
| 1 Number of reported sharps injuries, level Show forest plot | 2 | Effect Size (Random, 95% CI) | 2.49 [0.49, 4.48] | |
| 2 Number of reported sharps injuries, slope Show forest plot | 2 | Effect Size (Random, 95% CI) | Totals not selected | |
| Outcome or subgroup title | No. of studies | No. of participants | Statistical method | Effect size |
| 1 Number of needlestick injuries Show forest plot | 1 | Rate Ratio (Fixed, 95% CI) | Totals not selected | |
| 2 Number of container related needlestick injuries Show forest plot | 1 | Rate Ratio (Fixed, 95% CI) | Totals not selected | |
| Outcome or subgroup title | No. of studies | No. of participants | Statistical method | Effect size |
| 1 NSI‐ change in level Show forest plot | 3 | Effect Size (Random, 95% CI) | Subtotals only | |
| 1.1 Interruption | 2 | Effect Size (Random, 95% CI) | ‐6.15 [‐7.76, ‐4.54] | |
| 1.2 Gradual introduction | 1 | Effect Size (Random, 95% CI) | 0.80 [0.41, 1.19] | |
| 2 NSI‐ Change in slope Show forest plot | 3 | Effect Size (Random, 95% CI) | Subtotals only | |
| 2.1 Interruption | 2 | Effect Size (Random, 95% CI) | ‐0.94 [‐1.97, 0.09] | |
| 2.2 Gradual introduction | 1 | Effect Size (Random, 95% CI) | 0.5 [0.36, 0.64] | |